Article

Assessing the Potential of Onboard LiDAR-Based Application to Detect the Quality of Tree Stems in Cut-to-Length (CTL) Harvesting Operations

1
Ponsse Plc, Korkeakoulunkatu 7, 33720 Tampere, Finland
2
School of Forest Sciences, University of Eastern Finland, P.O. Box 111, 80101 Joensuu, Finland
3
Epec Plc, Laakeriväylä 1, 60100 Seinäjoki, Finland
*
Author to whom correspondence should be addressed.
Forests 2024, 15(5), 818; https://doi.org/10.3390/f15050818
Submission received: 26 March 2024 / Revised: 30 April 2024 / Accepted: 4 May 2024 / Published: 7 May 2024
(This article belongs to the Section Forest Operations and Engineering)

Abstract

:
This paper investigated the integration of LiDAR technology in cut-to-length (CTL) harvesting machines to enhance tree selection accuracy and efficiency. In the evolution of CTL forest machines towards improving operational efficiency and operator conditions, challenges persist in manual tree selection during thinning operations, especially under unmarked conditions and complex environments. These can be improved due to advances in technology. We studied the potential of LiDAR systems in assisting harvester operators, aiming to mitigate workload, reduce decision errors, and optimize the harvesting workflow. We used both synthetic and real-world 3D point cloud data sets for tree stem defect analysis. The former was crafted using a 3D modelling engine, while the latter originated from forest observations using 3D LiDAR on a CTL harvester. Both data sets contained instances of tree stem defects that should be detected. We demonstrated the potential of LiDAR technology: The analysis of synthetic data yielded a Root Mean Square Error (RMSE) of 0.00229 meters (m) and an RMSE percentage of 0.77%, demonstrating high detection accuracy. The real-world data also showed high accuracy, with an RMSE of 0.000767 m and an RMSE percentage of 1.39%. Given these results, we recommend using on-board LiDAR sensor technologies for collecting and analyzing data on tree/forest quality in real-time. This will help overcome existing barriers and drive forest operations toward enhanced efficiency and sustainability.

1. Introduction

1.1. Study Background and Aims

Cut-to-length (CTL) harvesting machines have revolutionized forest harvesting operations, significantly boosting both efficiency and the quality of the yield. In modern mechanized timber harvesting, enhancing operator working conditions, incorporating guidance systems for support, and introducing task automation are key focuses. These advances have notably eased the daily workload for harvester operators, benefiting both the workers and the forest industries. The design of these machines prioritizes the ergonomics and well-being of the operator, ensuring safe and controlled operation [1]. For the forest industries, using these machines leads to marked improvements in both productivity and the quality of the wood harvested. However, as stated by Picchi et al. [2] opportunities to further improve the efficiency and output quality of these machines remain, promising even greater advancements in CTL harvesting operations. In forest thinning, selecting which trees to remove is traditionally a manual task. This selection is either performed by forest owners marking trees for felling or requires manual input from the CTL harvester operator [3], relying on their experience and judgment for critical decision-making. Kärhä et al. [4] investigated manual tree stem bucking practices within Finnish coniferous forests, with a focus on Norway spruce (Picea abies) and Scots pine (Pinus sylvestris). Their study revealed inefficiencies in log utilization during thinning operations, primarily attributed to manual bucking practices leading to suboptimal log lengths and volumes. Manual bucking traditionally involves human operators manually determining cutting points along a tree stem to produce logs of desired dimensions. While modern harvesting machinery often incorporates optimizers to assist with bucking decisions, manual intervention remains necessary in certain scenarios, resulting in varying degrees of automation across forest harvesting operations.
In the context of our study, manual bucking entails human operators primarily responsible for log length and volume decisions, with limited automation assistance. Building on the findings and the recommendation of Kärhä et al. [4], our study underscores the drawbacks of manual bucking, highlighting instances of suboptimal log dimensions. To mitigate this issue, a transition towards automated or semi-automated bucking systems is recommended. These advanced systems leverage technologies such as mobile laser scanning (MLS) and machine vision to enhance log quality classification and optimize bucking decisions. Embracing automation and integrating cutting-edge technologies into forest operations can yield improvements in efficiency, log quality classification, resource utilization, and overall productivity.
Additionally, Kärhä et al. [4] pointed out the selection challenges CTL harvester operators face, particularly without clear markings, which necessitates heightened operator focus and quick decision-making, potentially increasing error rates and stress under prolonged operation. Thinning aims to remove lower-quality trees, letting the healthier ones thrive and increase in value [5]. However, this goal is difficult to achieve due to the human element in decision-making. Identifying inferior trees is challenging due to limited visibility and difficulties in fully observing distant tree stems. There is a growing need for an assistive system to streamline tasks and enable precise tree selection for the operator and the industry. The emergence and availability of new sensor technologies like LiDAR offer potential solutions to these challenges [2].
We have seen advancements in utilizing LiDAR for extracting log segments and assessing their quality or volume. Traditionally, this process involved manual methods or less precise technologies. LiDAR offers a more efficient and accurate alternative. By employing LiDAR, we can precisely measure log dimensions and assess quality without the need for physical intervention or invasive measurements.
Leveraging LiDAR technology for log segment extraction and quality assessment offers practicality and ergonomic benefits. LiDAR enables rapid data collection over large areas, facilitating comprehensive assessments in shorter timeframes. Additionally, it reduces the need for manual labor and physical measurements, minimizing operational costs and labor-intensive processes.
Moreover, the non-invasive characteristic of LiDAR preserves forest ecosystems’ integrity and reduces disturbances during data collection. Utilizing LiDAR for log segment extraction and quality assessment improves efficiency, accuracy, and sustainability in forest operations.
This paper explored the application of LiDAR technology in CTL harvesting machines and discussed the insights gained from this approach. The study aimed to answer the following research questions:
(1)
How to construct and test the functioning of the process for the tree stem identification based on Point Clouds? This means we want to correctly estimate the number of tree stems and their defects based on the data from the 3D module.
(2)
What are the main challenges and advantages when detecting tree stems and their defects with MLS mounted on the harvester in real-time?

1.2. Literature Review on the State of the Art in Forest Operations

In the forest sector, the LiDAR technology for improved tree selection and harvesting efficiency presents a dynamic and evolving field. Contrasting the static and meticulously planned urban environments, forests pose unique challenges due to their diverse terrains, varied tree species, and unpredictable arrangements influenced by natural factors [6]. This complexity necessitates innovative approaches to forest management and harvesting operations. Previous studies, such as Kärhä et al. [7], have delved into the economic implications and productivity challenges posed by root rot (Heterobasidion spp.) in trees like Norway spruce, highlighting the need for advanced monitoring and detection technologies like sonic tomography. Meanwhile, Miettinen et al. [8] introduced a measurement concept for forest harvester heads, emphasizing the potential of non-contact measurement technologies, including 3D laser scanning and machine vision, to enhance log quality and harvesting efficiency.
Further advancements were noted by Hyyti and Visala [9], where the deployment of 2D Sick scanners on a moving all-terrain vehicle demonstrated the capability to model tree stems and ground despite the challenges of motion-induced noise. Similarly, Li and Thiel’s exploration [10] of MLS’s impact on the tree stem attribute measurements underscored the technology’s role in reducing manual labour and improving DBH estimates, thereby supporting the development of autonomous forestry equipment.
The utilization of MLS systems, as discussed in [11,12,13], showcased the high accuracy achievable in stem mapping and tree detection, emphasizing MLS’s utility in generating precise 3D data for forest composition analysis. However, challenges in automated and accurate tree segmentation from dense point clouds were acknowledged, necessitating sophisticated segmentation methods. Morgan et al. [14] investigated handheld LiDAR and Structure from Motion (SfM) photogrammetry for tree damage assessment, comparing these techniques with conventional field methods. While traditional approaches identified more damaged stems, the study attributed lower damage counts from LiDAR and SfM to restricted point cloud reconstructions of upper stems. Panagiotidis et al. [15] explored the feasibility of using a low-cost handheld camera for stem accuracy assessment by comparing data from two-point clouds: one from a digital camera and the other from a FARO® Focus3D S120 laser scanner (FARO®, Lake Mary, USA). Euclidean distances were calculated for corresponding points, revealing that points with errors less than 11 cm were mainly located on the ground. Regression analysis demonstrated a significant relationship between height above ground and error, with higher points on the stems exhibiting increased error. Nonetheless, these technologies showed promise for lower stem damage assessment, offering a practical supplement to traditional forest inventory methods. Hyyppä et al. [16] demonstrated the effectiveness of high-resolution airborne laser scanning for forest inventory, using a handheld MLS for reference data. Yun et al. [17] evaluated laser scanning for tree leaf area measurement using detailed tree models, finding improved accuracy with multiple terrestrial scans and further enhancements with aerial scans. Lu et al. [18] integrated UAV-LiDAR and Backpack-LiDAR (MLS) data, applying commercial software for point cloud preprocessing. de Paula Pires et al. [19] employed a car-mounted MLS to automate field-reference data collection for forest inventories, concentrating on the detection of individual trees and the estimation of their stem attributes near forest roads. This approach showed considerable promise for conducting forest inventories on a large scale, providing an effective method to improve models used in remote sensing-based forest inventories and to facilitate the advancement of precision forestry. Kukko et al. [20] employed MLS and GNSS/INS technologies, using graph optimization to refine data trajectories, thus efficiently mapping forests, and determining tree parameters. Gao et al. [21] leveraged near-field LiDAR data from UAV and ground backpack scanners to determine the structural parameters of trees in subtropical planted forests. The findings affirm near-field LiDAR’s effectiveness in extracting tree structural details. Recent innovations, such as the “ForestScanner” app developed by the Hokkaido Research Center [22], represent a leap towards simplifying LiDAR scanning in the forestry sector through user-friendly mobile applications, albeit with limitations in scanning range and manual operation.
The introduction of the Thinning Density Assistant (TDA) by Ponsse Plc [23] marks a significant step towards integrating LiDAR-based perception systems in CTL harvesters, aiming to optimize thinning operations based on silvicultural standards. This aligns with observations from [24,25] on the variability in adherence to thinning standards within Finnish forests, highlighting the potential of technology to align forestry practices with sustainability goals. As stated by Finnish Forest Industries [26], Kärhä et al. [27] and Korhonen et al. [28], the integration of advanced sensor technologies and automation in forestry operations represents a pivotal advancement towards sustainability. These technologies enhance efficiency by streamlining operations and minimizing resource waste, while also providing accurate data for informed decision-making. Real-time monitoring of environmental parameters enables proactive intervention to maintain ecosystem health and biodiversity. By reducing the environmental impact of harvesting activities and facilitating compliance with regulations, these advancements contribute to sustainable forest management. Moreover, they aid in adapting forestry practices to mitigate the effects of climate change. Overall, the integration of advanced technologies in forestry holds promise for promoting ecological balance and meeting human needs for forest products in a sustainable manner.
The current state of automation in the forestry sector, as noted, is nascent with substantial room for growth. The partial automation of forest machinery, as explored in research [29,30], suggests a promising direction for reducing operator workload and enhancing operational efficiency. This gradual integration of automation, coupled with the strategic use of technologies like LiDAR, as highlighted in [31], has the potential to revolutionize forest management by minimizing waste, optimizing resource use, and improving financial outcomes for the forest industries.
In summary, the State of the Art reveals a concerted move towards integrating advanced sensor technologies and automation in forest operations. This trend not only addresses the inherent challenges posed by the complex forest environment but also opens avenues for significant improvements in efficiency, accuracy, and sustainability in forestry practices. The current study builds upon this foundation, aiming to further refine and expand the application of LiDAR technology to meet the nuanced demands of modern forest operations, setting a new benchmark for precision and operator assistance in the field.

2. Materials and Methods

2.1. Mobile LiDAR Technology Used

2.1.1. LiDAR Functioning

MLS, a variant of LiDAR technology, has gained recognition for forest scanning applications, offering a dynamic method to capture environmental data [30]. This technology, characterized by its infrared laser source, scanner mounted on moving vehicles, and GPS/IMU integration for real-time location and orientation data, operates on the principle of emitting laser pulses and measuring their return time to calculate distances. MLS’s ability to rapidly collect data over large areas makes it particularly suitable for extensive forest landscapes [11]. However, the selection of the right LiDAR technology depends on project-specific needs including area scale, required precision, budgetary constraints, and time availability. The challenges of using MLS in forests include dealing with complex environments that affect signal quality, handling large data volumes, maintaining accuracy in adverse conditions, detecting minor or internal defects, integrating with harvesting equipment, and the costs and maintenance of advanced systems. Despite these challenges, the advantages of MLS, such as enhancing tree inventory management, timber value assessment, harvesting planning, safety, environmental impact assessment, and providing data for sustainable management, demonstrate its potential to improve efficiency, accuracy, and sustainability in forest operations [11,12,13,22,29,30].
In summary, while the challenges mainly revolve around technical, environmental, and cost factors, the advantages of using MLS for tree stem detection lie in improved efficiency, accuracy, and sustainability of forest operations. The MLS is considered in the present research.

2.1.2. Scanning Resolution

The LiDAR measurement accuracy in a forest is contingent on several factors, including the distance at which measurements are taken, the number of laser measurements performed, the characteristics of the undergrowth, the tree parameters (shape, height, diameter at breast height, etc.), the type and the capability of the used LiDAR sensor as well as the number and height of branches. Figure 1 illustrates the potential setup of LiDAR on a CTL harvester, highlighting the placement of the sensor, the proximity to the tree, and the LiDAR’s field of view. In detail:
  • With a 45° vertical field of view, the LiDAR’s laser beams may not cover the entire tree at a certain distance, though they are likely to hit the tree if it is positioned further away.
  • A 90° vertical field of view ensures that the laser beams encompass the whole tree at the specified distance.
  • From a top perspective, the likelihood of the tree being entirely covered by the laser beams increases as the distance to the tree decreases.
Figure 1. Side view of vertical viewpoint having 45° (a), the side viewpoint of vertical viewpoint having 90° (b), and top view horizontal viewpoint (c). The angle “a” in (a) and (b) represents the separation between the laser beams.
Forests 15 00818 g001
The angle ‘a’ in Figure 1. Represents the separation between the laser beams. A narrower angle between these beams allows for more detailed information about the object they hit. This concept is further developed through analytical models proposed for calculating spatial resolution requirements, incorporating tree size, sensor placement, and effective laser point distribution. These models leverage trigonometric principles to estimate precise horizontal and vertical resolutions necessary for accurate forest structure characterization, based on a specified number of laser points impacting the target tree.
Horizontal Resolution Calculation:
1. Horizontal Angle of a Tree θ h : This is determined by dividing the tree’s diameter ( D ) by the distance to the tree ( L ) , represented as:
θ h = D L
2. Desired Horizontal Resolution R h : To find this, divide the horizontal angle θ h by the desired number of points ( N ) , giving:
R h = θ h N
Vertical Resolution Calculation
1. Top Angle ( α ) : Calculated by taking the difference between the tree’s height ( H t ) and the sensor’s height ( H s ) , dividing by the distance to the tree ( L ) , and then taking the arctangent, resulting in:
α = arctan H t H s L
2. Bottom Angle ( β ) : Found by dividing the sensor’s height ( H s ) by the distance to the tree ( L ) and taking the arctangent, which is:
β = arctan H s L
3. Total Tree Angle ( θ t ) : The sum of the top and bottom angles:
θ t = α + β
4. Desired Vertical Resolution ( R v ) : This is determined by dividing the total tree angle ( θ t ) by the desired number of points ( N ) giving:
R v = θ t N
These equations allow for the calculation of the resolutions needed to accurately capture an object (like a tree) from a distance, ensuring that the resulting point cloud has the desired level of detail.

2.2. The Defects of Tree Stems

Trees exhibit a diverse array of sizes and shapes, and they can have various types of defects. These defects encompass natural irregularities such as bending, curvature, twisting, and more. Additionally, trees can have man-made defects resulting from damages incurred during the harvesting process. The present study focuses mainly on two types of defects: Crooked and curved tree stems.
Crooked growth refers to a uniform bending along a stem’s length, requiring specific measurement and cutting techniques to manage. The acceptable limit for crookedness is defined as a maximum of 1 cm deviation per meter [32,33]. For curved growth, characterized by localized bending on part of the stem, the cutting strategy involves removing sections with a curvature exceeding 1 cm over a 1-m length [28,29]. The assessment of crookedness involves measuring the maximum deviation of the log’s centerline from a straight line connecting the top and bottom centers. Effective management includes cutting at the curve’s lowest point for crooked growth and entirely removing curves or multi-curvature segments, especially prevalent in hardwoods exhibiting constant crookedness or spiral bending throughout the log. The study by Sagar et al. [31] offers insights from the perspective of operators and industry, discusses the challenges associated with defects and estimates the potential losses, both in time and finances when using real industry data. In the forestry terminology, a “crook” typically refers to a pronounced and abrupt deviation or bend in the stem that may render a segment of the tree unmerchantable due to its severity and abruptness. On the other hand, a “curve” denotes a more gradual deviation or bending of the stem, which, with skilled bucking to shorter lengths, may still allow for merchantability by accommodating the curvature within acceptable length specifications.
It is important to note that the distinction between a crook and a curve may vary regionally and be influenced by local harvesting practices and market standards. Therefore, clear and standardized definitions are essential for effective communication and consistency in forest operations.

2.3. Data Collection

This study encompasses the analysis of two distinct data sets for in-depth understanding. The initial data set, synthetic data was generated manually to ensure accuracy and relevance to our study. This involved crafting and configuring 3D models and simulations within the Blender environment to represent scenarios and conditions pertinent to our research. This method allowed for precise control and customization of the data set, enabling tailoring to specific experimental parameters and validation criteria, thereby ensuring its accuracy and suitability for our study. Conversely, the second data set, the real-world data originated from practical field data collected in a natural forest environment. This data was gathered using an advanced physical LiDAR sensor, strategically mounted on a CTL harvester. The following subsections provide detailed insights into these data collection setups, outlining the methodologies and tools utilized in this research.

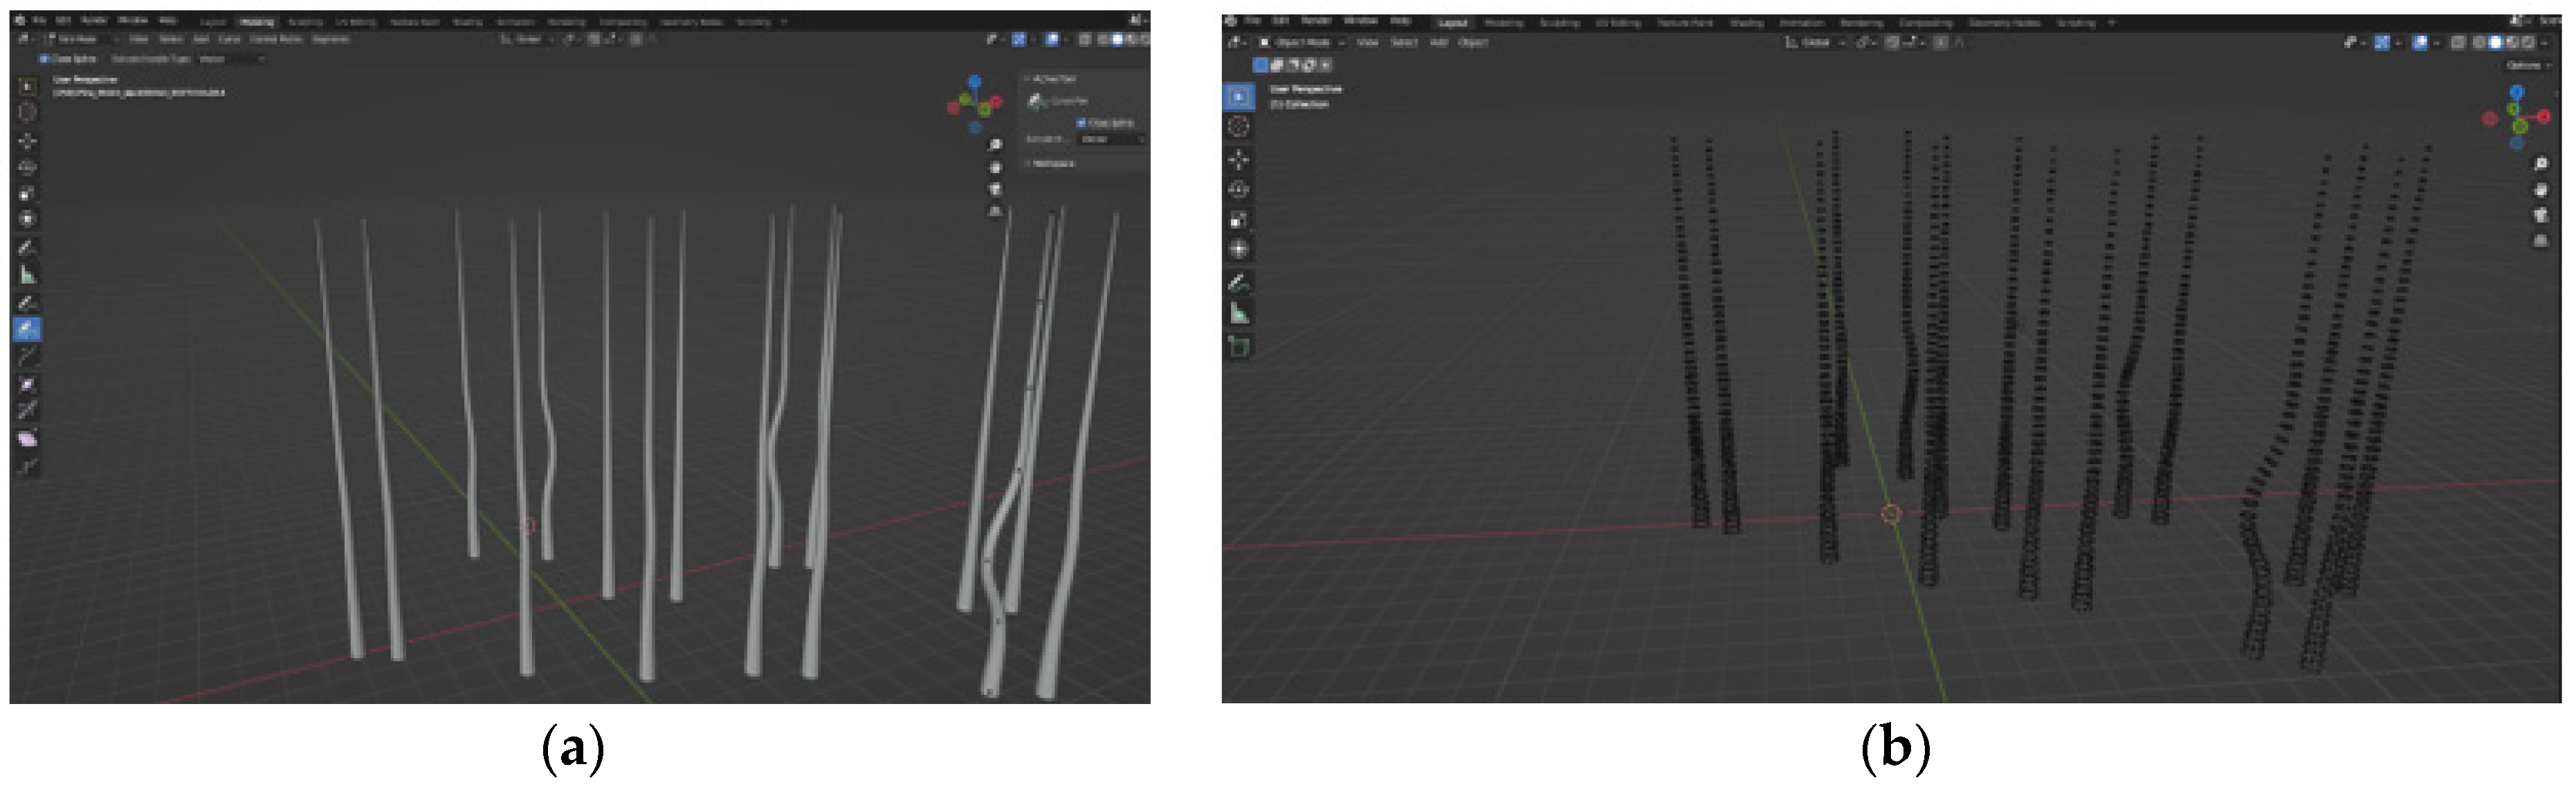
2.3.1. Synthetic Data

The data generation process involved the use of Blender version 3.6, a versatile and freely available 3D creation suite. Blender offers a comprehensive set of tools and capabilities across the entire 3D production pipeline, encompassing tasks such as modelling, rigging, animation, simulation, rendering, compositing, motion tracking, video editing, and even game development [34].
To create 3D tree stems, the Sapling Tree Gen add-on, included with the default Blender installation, was employed. Each tree stem was meticulously customized to exhibit specific and precisely measured curves. Subsequently, the 3D models were converted into mesh representations. From these mesh models, a Point Cloud was generated using the “blender-pcd-io” add-on, designed for importing and exporting Point Cloud Data (PCD) in Blender versions 2.8 and above [35]. It is worth noting that the “blender-pcd-io” add-on requires separate installation. The resulting exported Point Cloud data were then utilized for subsequent Point Cloud processing tasks. Figure 2 presents the Blender view of the created tree stems and the point cloud from the 3D models.

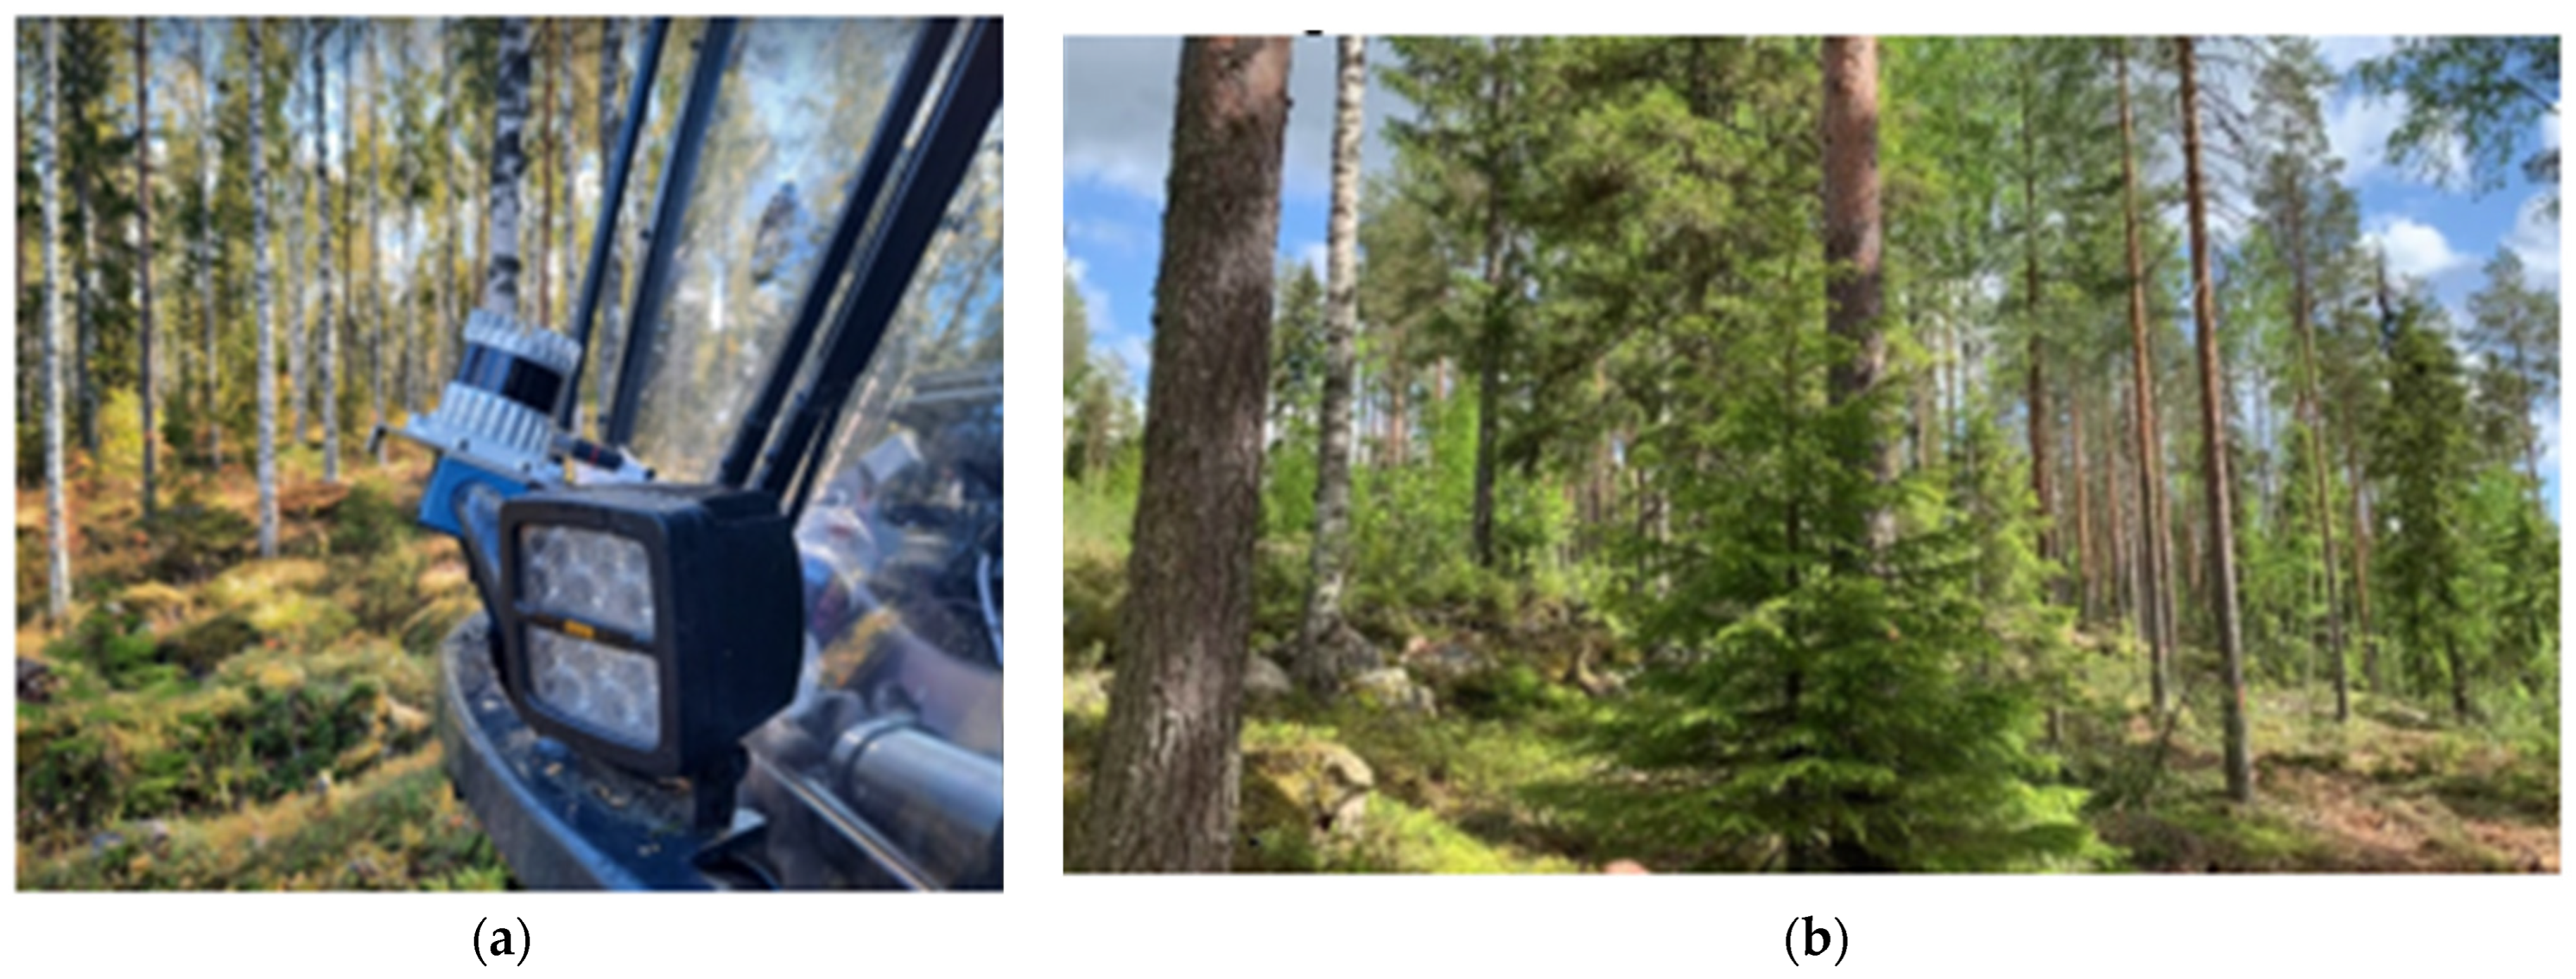
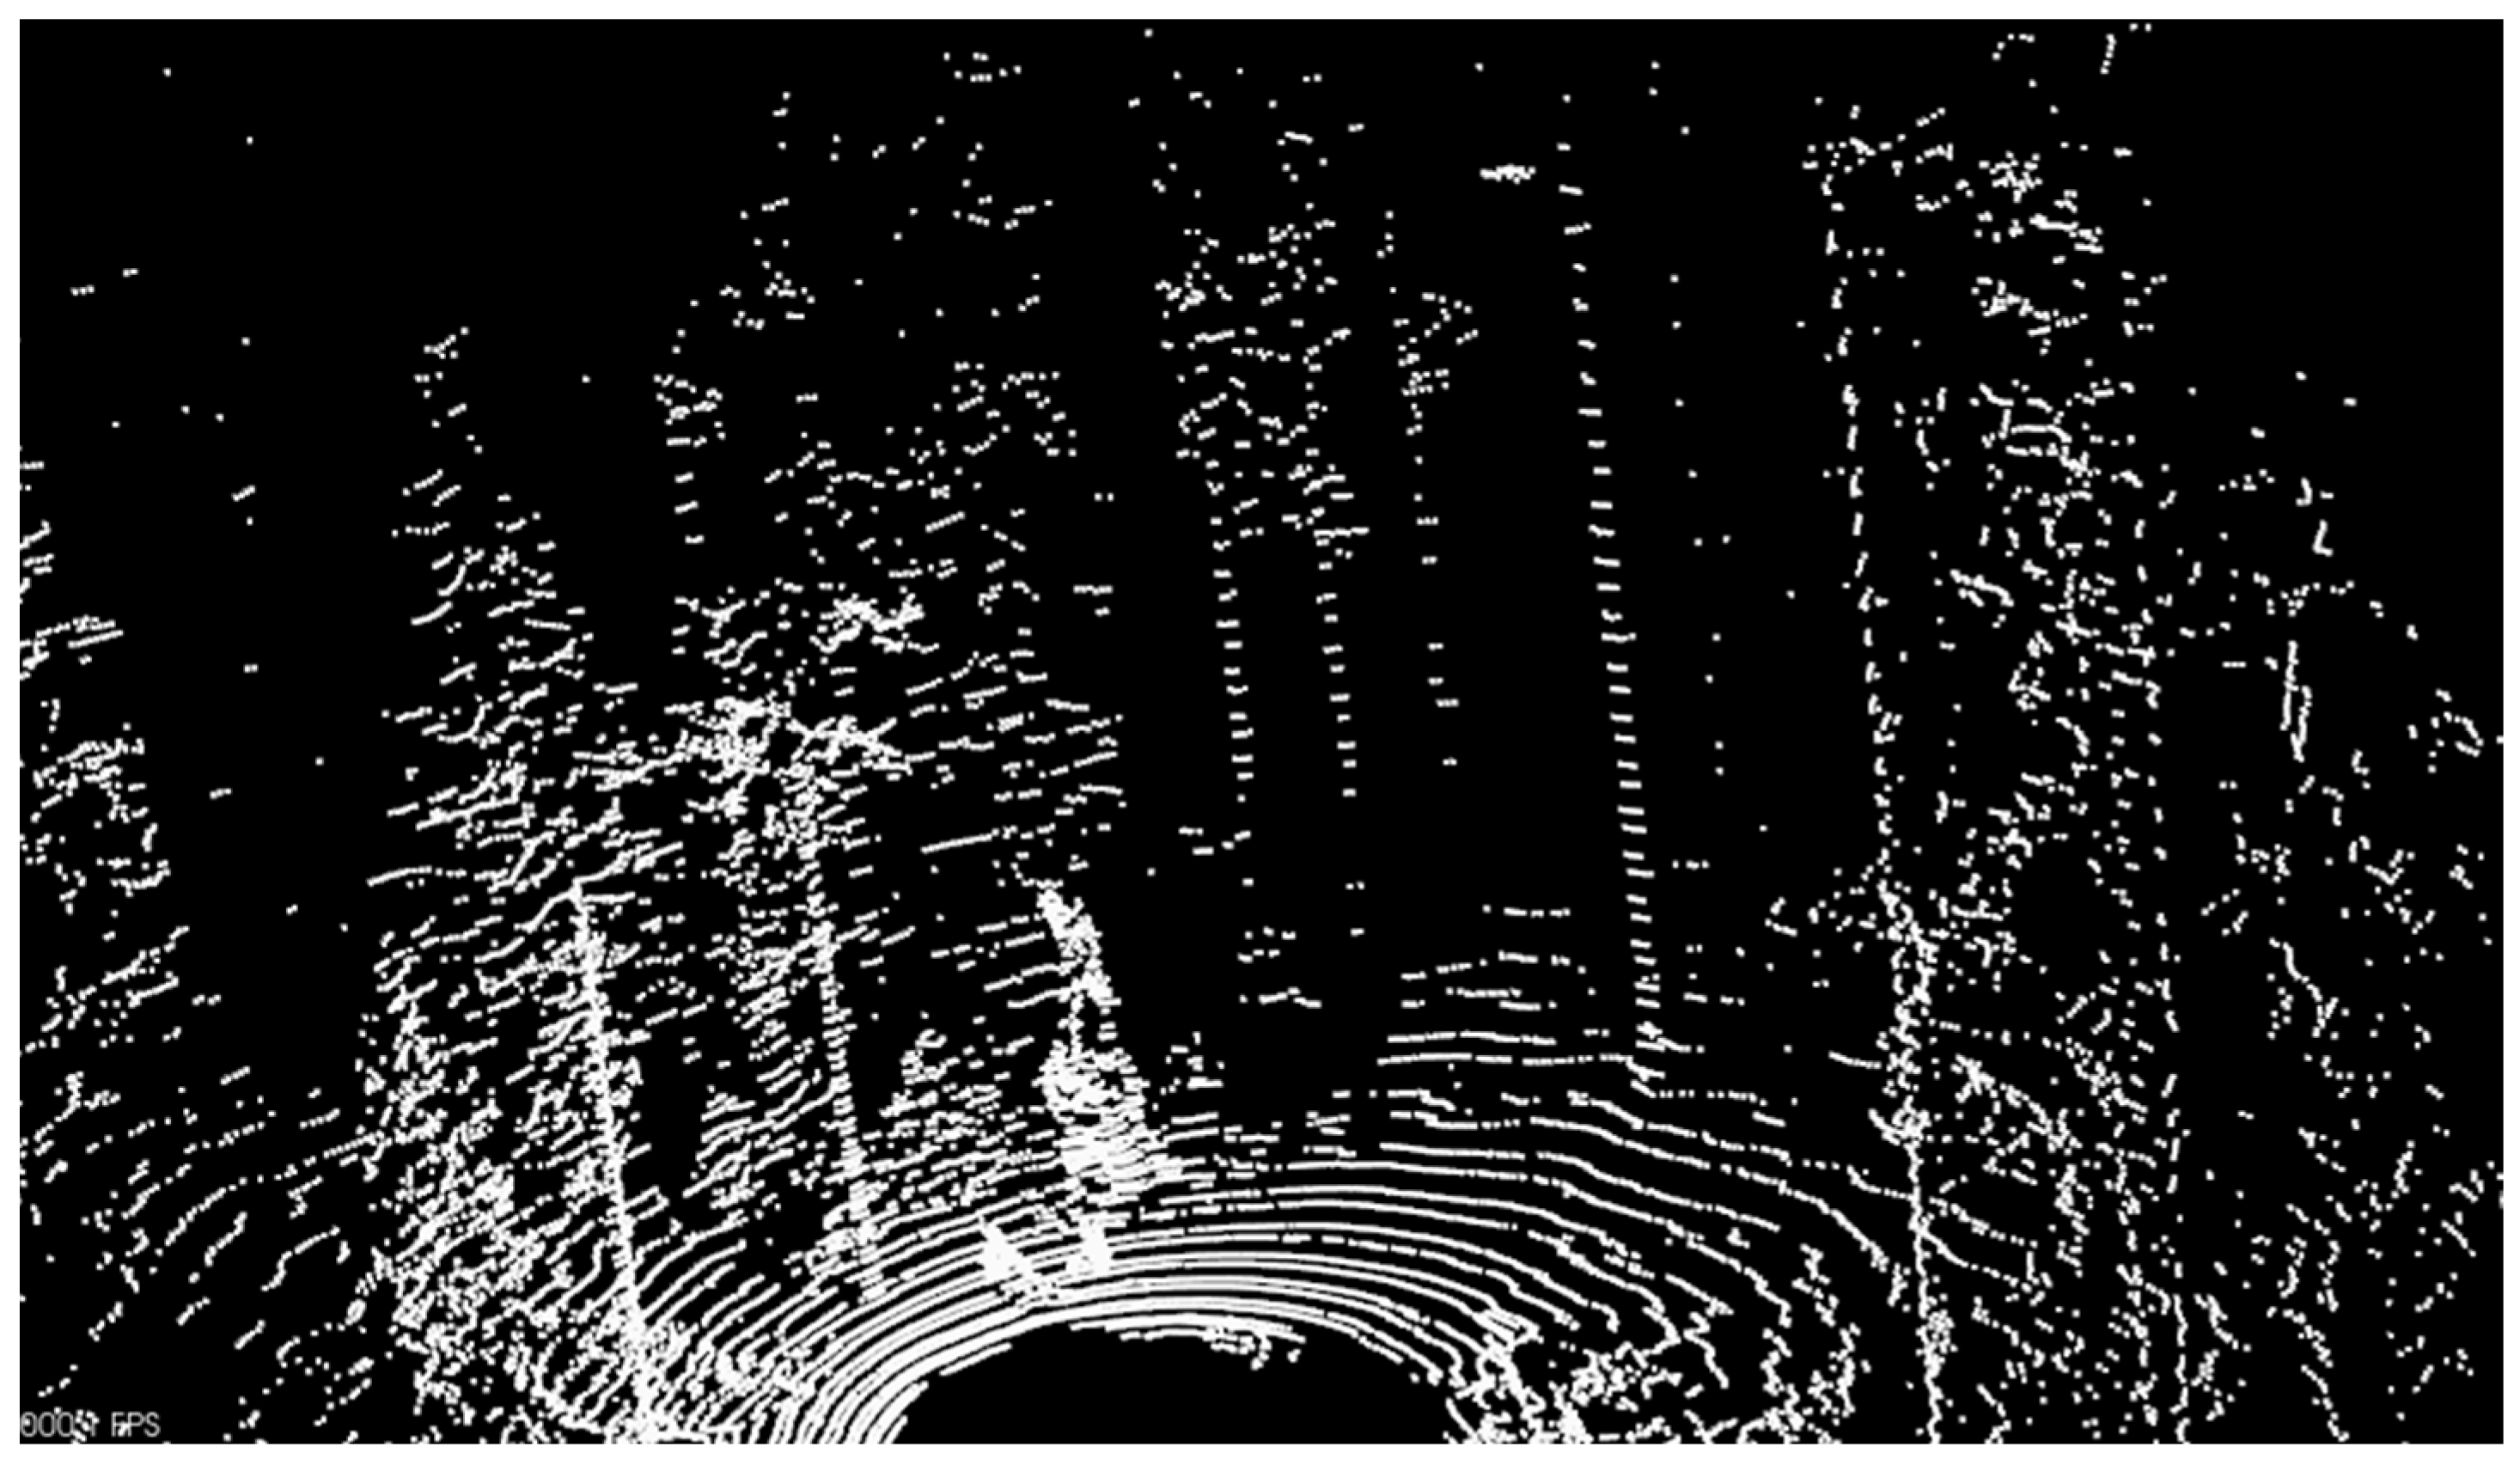
2.3.2. Real-World Data Collection (Point Cloud)

Data collection was conducted in June 2023 in the forest of Vieremä, northwest Finland, close to the Ponsse Plc headquarters. The Ouster LiDAR OS0 x64 (Ouster Inc., San Francisco, CA, USA) was utilized for this purpose, mounted at the front of the safety cabin on the Ponsse Scorpion CTL harvester. The LiDAR sensor characteristics are as follows: It is equipped with a capability for 360° horizontal and 90° vertical fields of view, ensuring comprehensive environmental coverage. The sensor boasts a significant range of up to 100 m. The LiDAR sensor utilized in our study boasts a precision characterized by a vertical channel count of 64 and a horizontal resolution of 1024. It is noteworthy that this sensor provides three distinct horizontal configurations: 512, 1024, or 2048. Given our experimental objectives and requirements, we selected the 1024 configuration due to its consistent performance and its capacity to yield satisfactory results within our experimental framework. The sensor operates with angular resolutions of 1.40625° vertically and 0.3515625° horizontally. It achieves a data acquisition rate of 655,360 points per second, supported by a rotation rate of 10 Hz, which allows for rapid and efficient data collection [36]. Figure 3a provides a visual representation of how the LiDAR system was positioned on the Ponsse Scorpion harvester. The forest area, primarily composed of Scots pine trees, also featured a mix of birch (Betula spp.) and Norway spruce trees. Figure 3b displays an image showing the view angle from the forest where the test data collection took place.
The forest utilized in our study is privately owned. We identified three specific trees within the private forest area, each exhibiting target defects. Subsequently, we conducted LiDAR scanning on these trees and proceeded to fell, cut, and manually measure them. It is worth mentioning that each selected tree originated from a distinct plot within the test forest. We are currently unable to disclose specific numerical details due to confidentiality constraints associated with private forest ownership.
A laptop equipped with Ubuntu 18.04 (Canonical Ltd., London, UK) and installed with the ROS (Robot Operating System) (Open Source Robotics Foundation (OSRF), Mountain View, CA, USA) melodic package was utilized for recording ROS message data into .bag files. This same laptop was also employed for extracting point cloud data from these .bag files. Additionally, Rviz (Robot Visualization), a 3D visualization tool for ROS, was used both for real-time visualization of LiDAR data during test data collection and for playback of the recorded data.
Figure 4 displays an image depicting the forest’s perspective as captured in point cloud data. Figure 5 reveals the targeted curved tree before and after being felled, alongside the manual measurements conducted with a measuring tape and a digital Masser BT caliper.

2.4. Data Analysis

2.4.1. Tools Used

CloudCompare version 2.11.3 (Anoia) on a Windows 64-bit (Microsoft Corporation, Redmond, WA, USA) platform served as the tool for visual inspection of the point cloud data. CloudCompare is an open-source point cloud comparison and visualization software [37]. It can be used to align, merge, and compare point clouds, as well as to extract features and generate 3D models from point clouds. Before subjecting the Point Cloud file to algorithmic analysis, it underwent a thorough examination within CloudCompare. This process was essential to validate the integrity of the Point Cloud data and allowed for manual measurements to be conducted. Various parameters such as tree count, tree height, and inter-tree distances were among the measurements attainable during this inspection phase.
Point Cloud Library (PCL) installed on a Windows environment. The PCL is an open-source library and includes algorithms and tools for processing point clouds [38]. It provides a wide range of algorithms for point cloud filtering, feature estimation, and surface reconstruction, among other things. It is a critical tool in the field of computer vision and 3D data processing, providing a fundamental method for understanding the spatial arrangement of objects in a 3D environment.
Utilizing Visual Studio Professional 2022 (64-bit)) (Microsoft Corporation, Redmond, WA, USA), a robust commercial IDE developed by Microsoft, we developed the necessary algorithms for our research. However, Microsoft does offer a free edition called Visual Studio Community, which is designed for individual developers, open-source projects, academic research, and education [39].

2.4.2. Point Cloud Processing

The PCL facilitated the import of point cloud data from a PCD file. For cluster extraction, the EuclideanClusterExtraction algorithm was employed, which isolates clusters within the point cloud by assessing the Euclidean distance that separates the points. The process involves:
  • Input: A cloud of points where each point has a position in 3D space.
  • Distance Threshold: The algorithm requires a predefined distance threshold, which determines how close points should be to each other to be considered part of the same cluster.
  • Clustering: The algorithm proceeds to group points that are within the distance threshold of each other. Each group of points closer than the threshold to each other forms a cluster.
  • Output: The output is a set of clusters, where each cluster is a group of points that are close to each other based on the Euclidean distance.
This method is widely used in various fields for segmenting point cloud data into distinct groups. Applications include robotics (for obstacle detection and navigation), autonomous vehicles (for understanding the vehicle’s environment), and 3D modelling (for object reconstruction and analysis).
The ExtractIndices function in the PCL is utilized for extracting a subset of points from a point cloud based on given indices. This is an essential function for manipulating and processing point cloud data in various applications. In addition to leveraging the pre-existing functions and algorithms within PCL, it became necessary to develop custom functions to facilitate the management of the Point Cloud data. The steps in data analysis are as follows:
  • Load Point Cloud: Utilizes the PCL’s PCDReader class to initiate the loading of point cloud data.
  • Remove Outliers: This phase is dedicated to purging any points that contain “Not-a-Number” (NaN) values from the point cloud to ensure data integrity.
  • Clustering: At this juncture, individual tree stems are discerned and segregated from the collective point cloud data set.
  • Divide into Sections: Here, the point cloud cluster of each tree stem is segmented into predefined height intervals. It involves calculating the minimum and maximum heights within the cluster, delineating sections for varying height ranges, and allocating points to these sections based on their vertical position.
  • Get Center line: This process establishes the center line by pinpointing the central point at both the base and apex sections of the point cloud cluster, effectively marking the core axis of the stem.
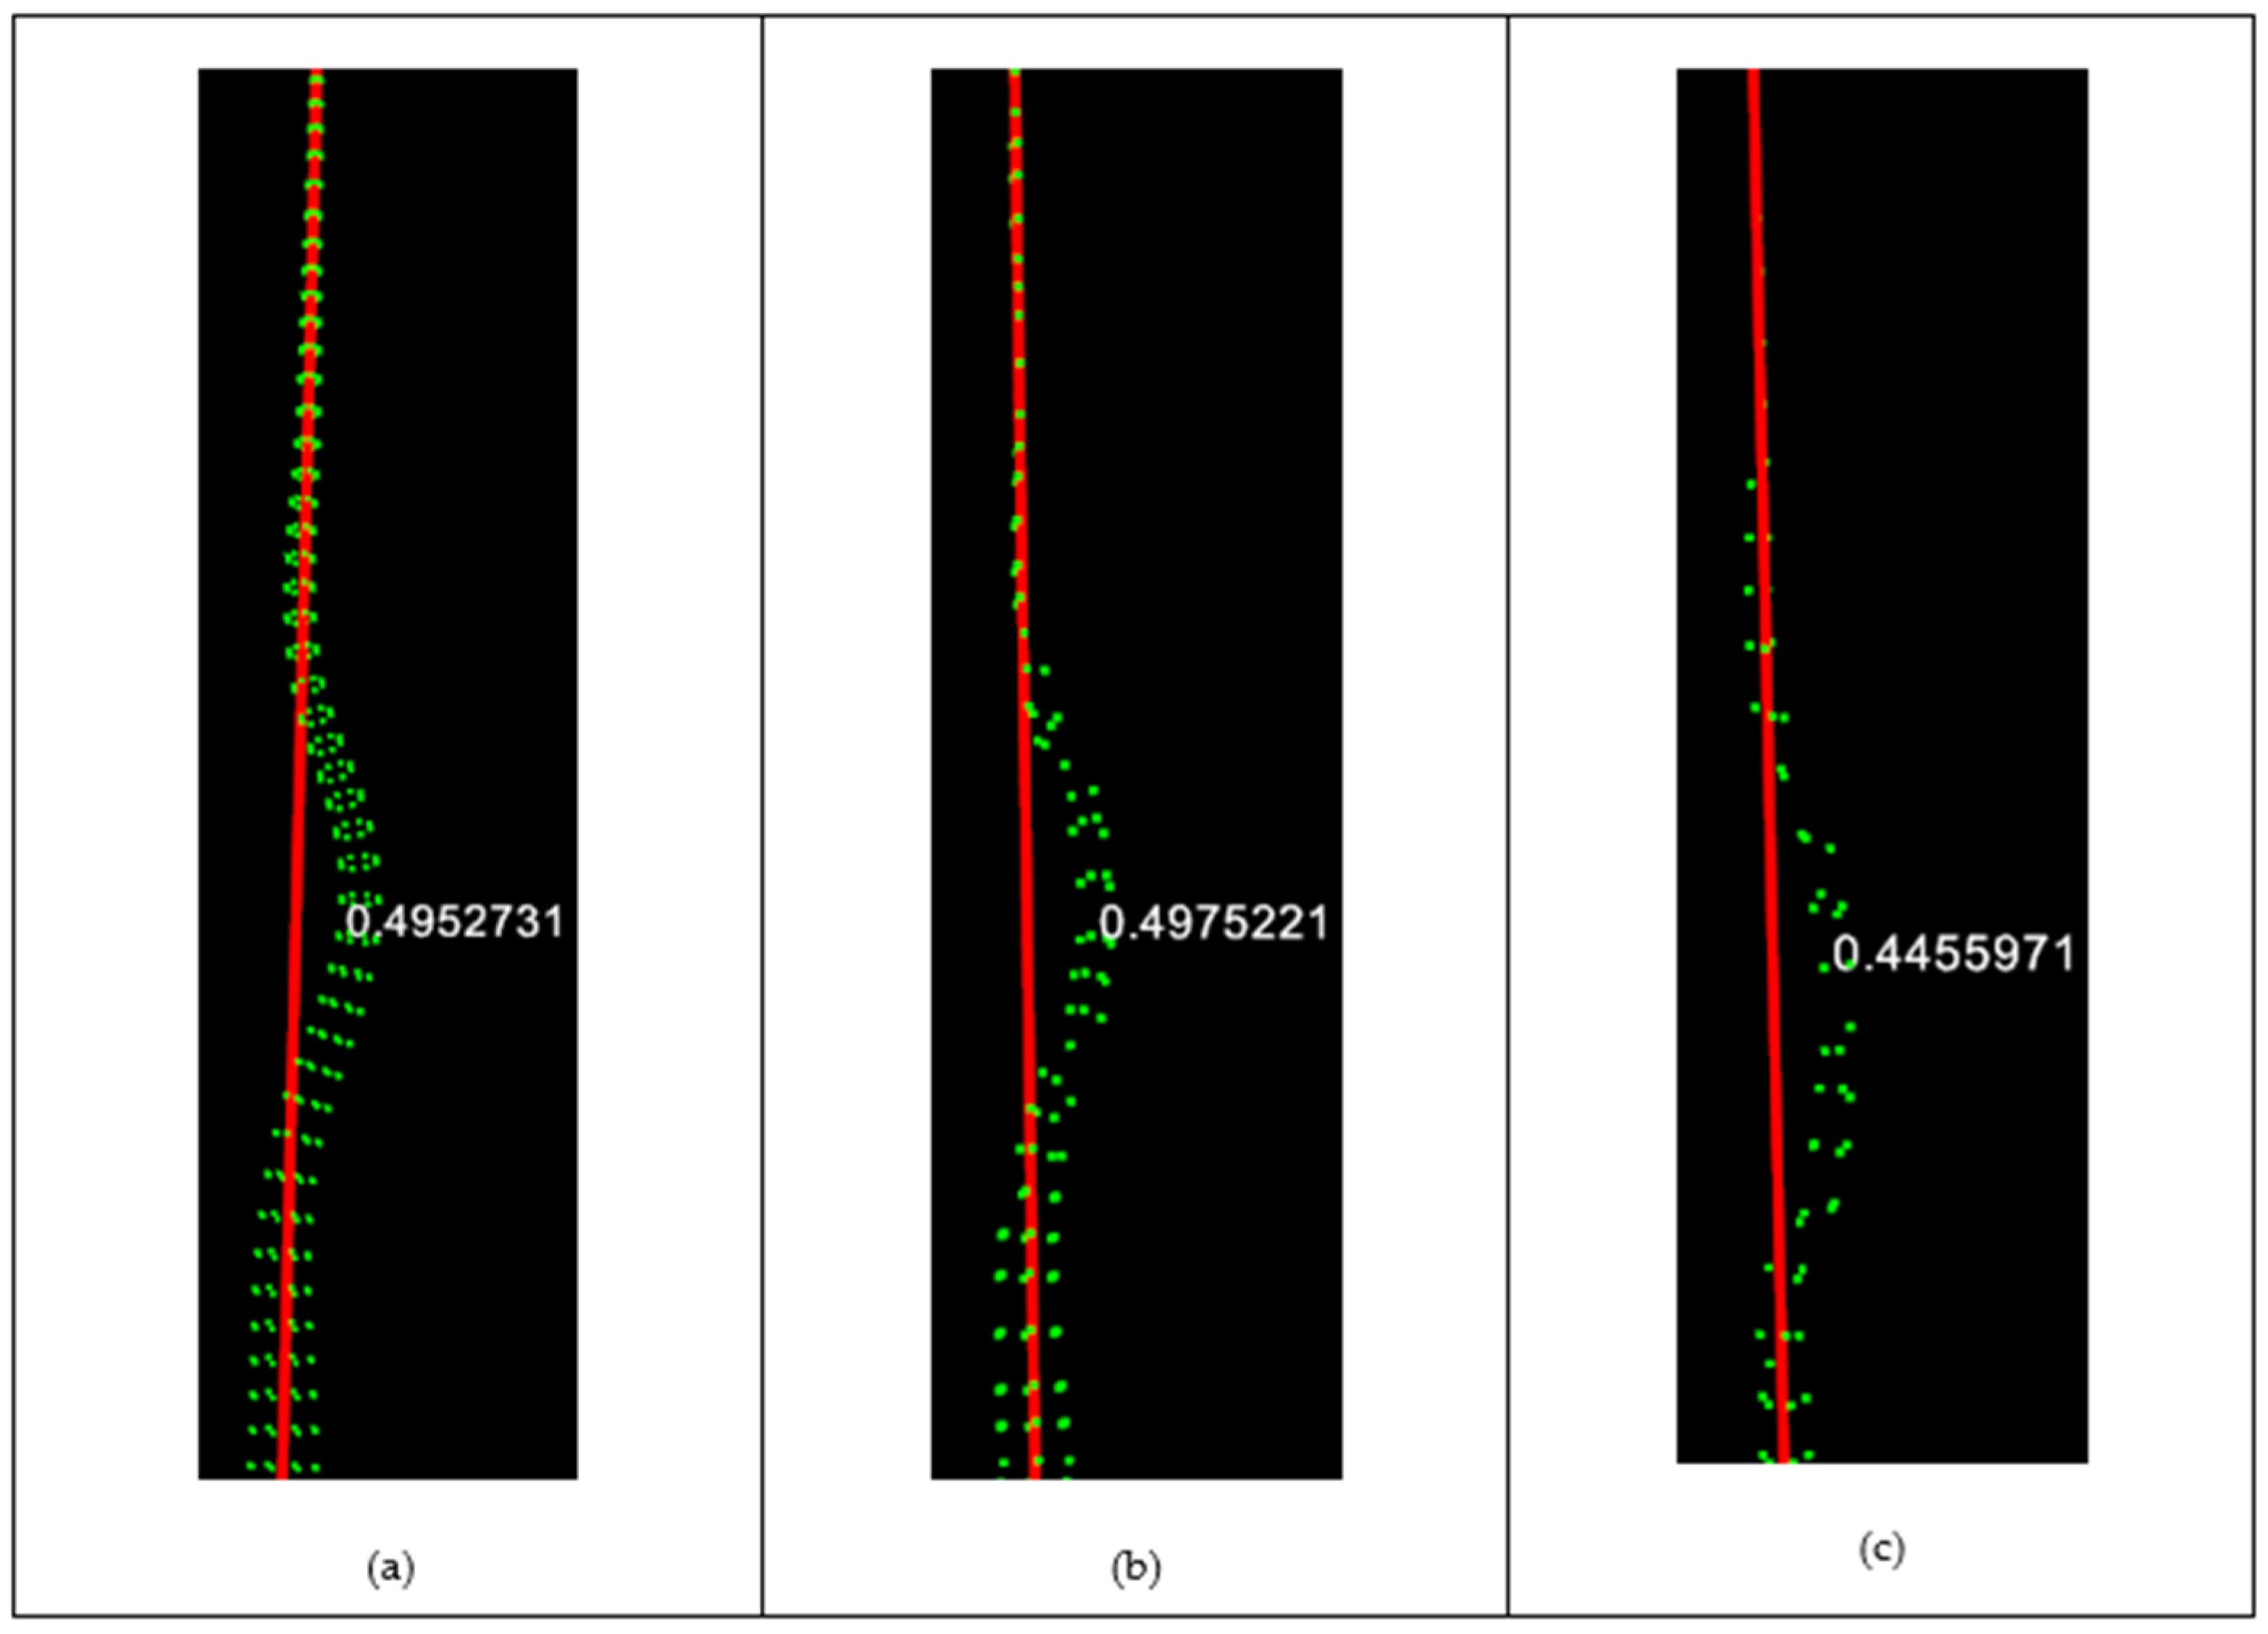
  • Calculate the Curve: Employs vector calculus to ascertain the minimal distance between any selected point and a three-dimensional line, or center line, which is charted between two distinct points.
  • Visualize: This step involves the graphical representation of the tree stem alongside the maximum distance value from its center line, providing a visual assessment of the stem’s deviation or curvature.
For processing real-world point cloud data, a preliminary step was required: extracting the point cloud from the recorded ROS bags. This involved loading each ROS bag and retrieving the point cloud data from it, which was accomplished by executing a ROS command in the terminal. After this extraction, additional steps were also necessary:
  • Alignment: Alignment for the point cloud using the orientation of the LiDAR. The point cloud is orientated upright, the trees are pointing in Z direction, and the ground is in the X and Y plane.
  • Segmentation: In the initial phase of segmentation using a 2D grid approach, the point cloud is segmented into grid cells based on their XY coordinates, forming an XY grid. The process of ground point removal involves eliminating the lowest points in each grid cell. Here, the ‘lowest’ refers to selecting the minimum Z value within a grid cell and establishing an offset above this value. Points falling below this threshold (minimum Z value plus offset) are classified as ground points and removed. Following the ground removal, the remaining points in each cell are evaluated. If a cell contains only a few points post-ground removal, it indicates the absence of a tree stem. Conversely, cells with insufficient point counts, determined by a predefined threshold, are identified as containing branch points. Cells meeting or exceeding this point count threshold are then classified as tree stems. This method effectively differentiates between tree stems and branches based on the density of points within each grid cell.
  • Fit a cylinder: Estimating the point normal and setting up the model type to a cylinder and the SAC_RANSAC as a method type for each cluster. The cylinder inliers and the coefficients are obtained. Following the grid approach, the focus shifts to isolating the tree points once the ground points and branch points have been excluded. Clustering of the tree or vegetation points is then undertaken. Clustering serves to divide the trees into distinct point clouds for further processing.

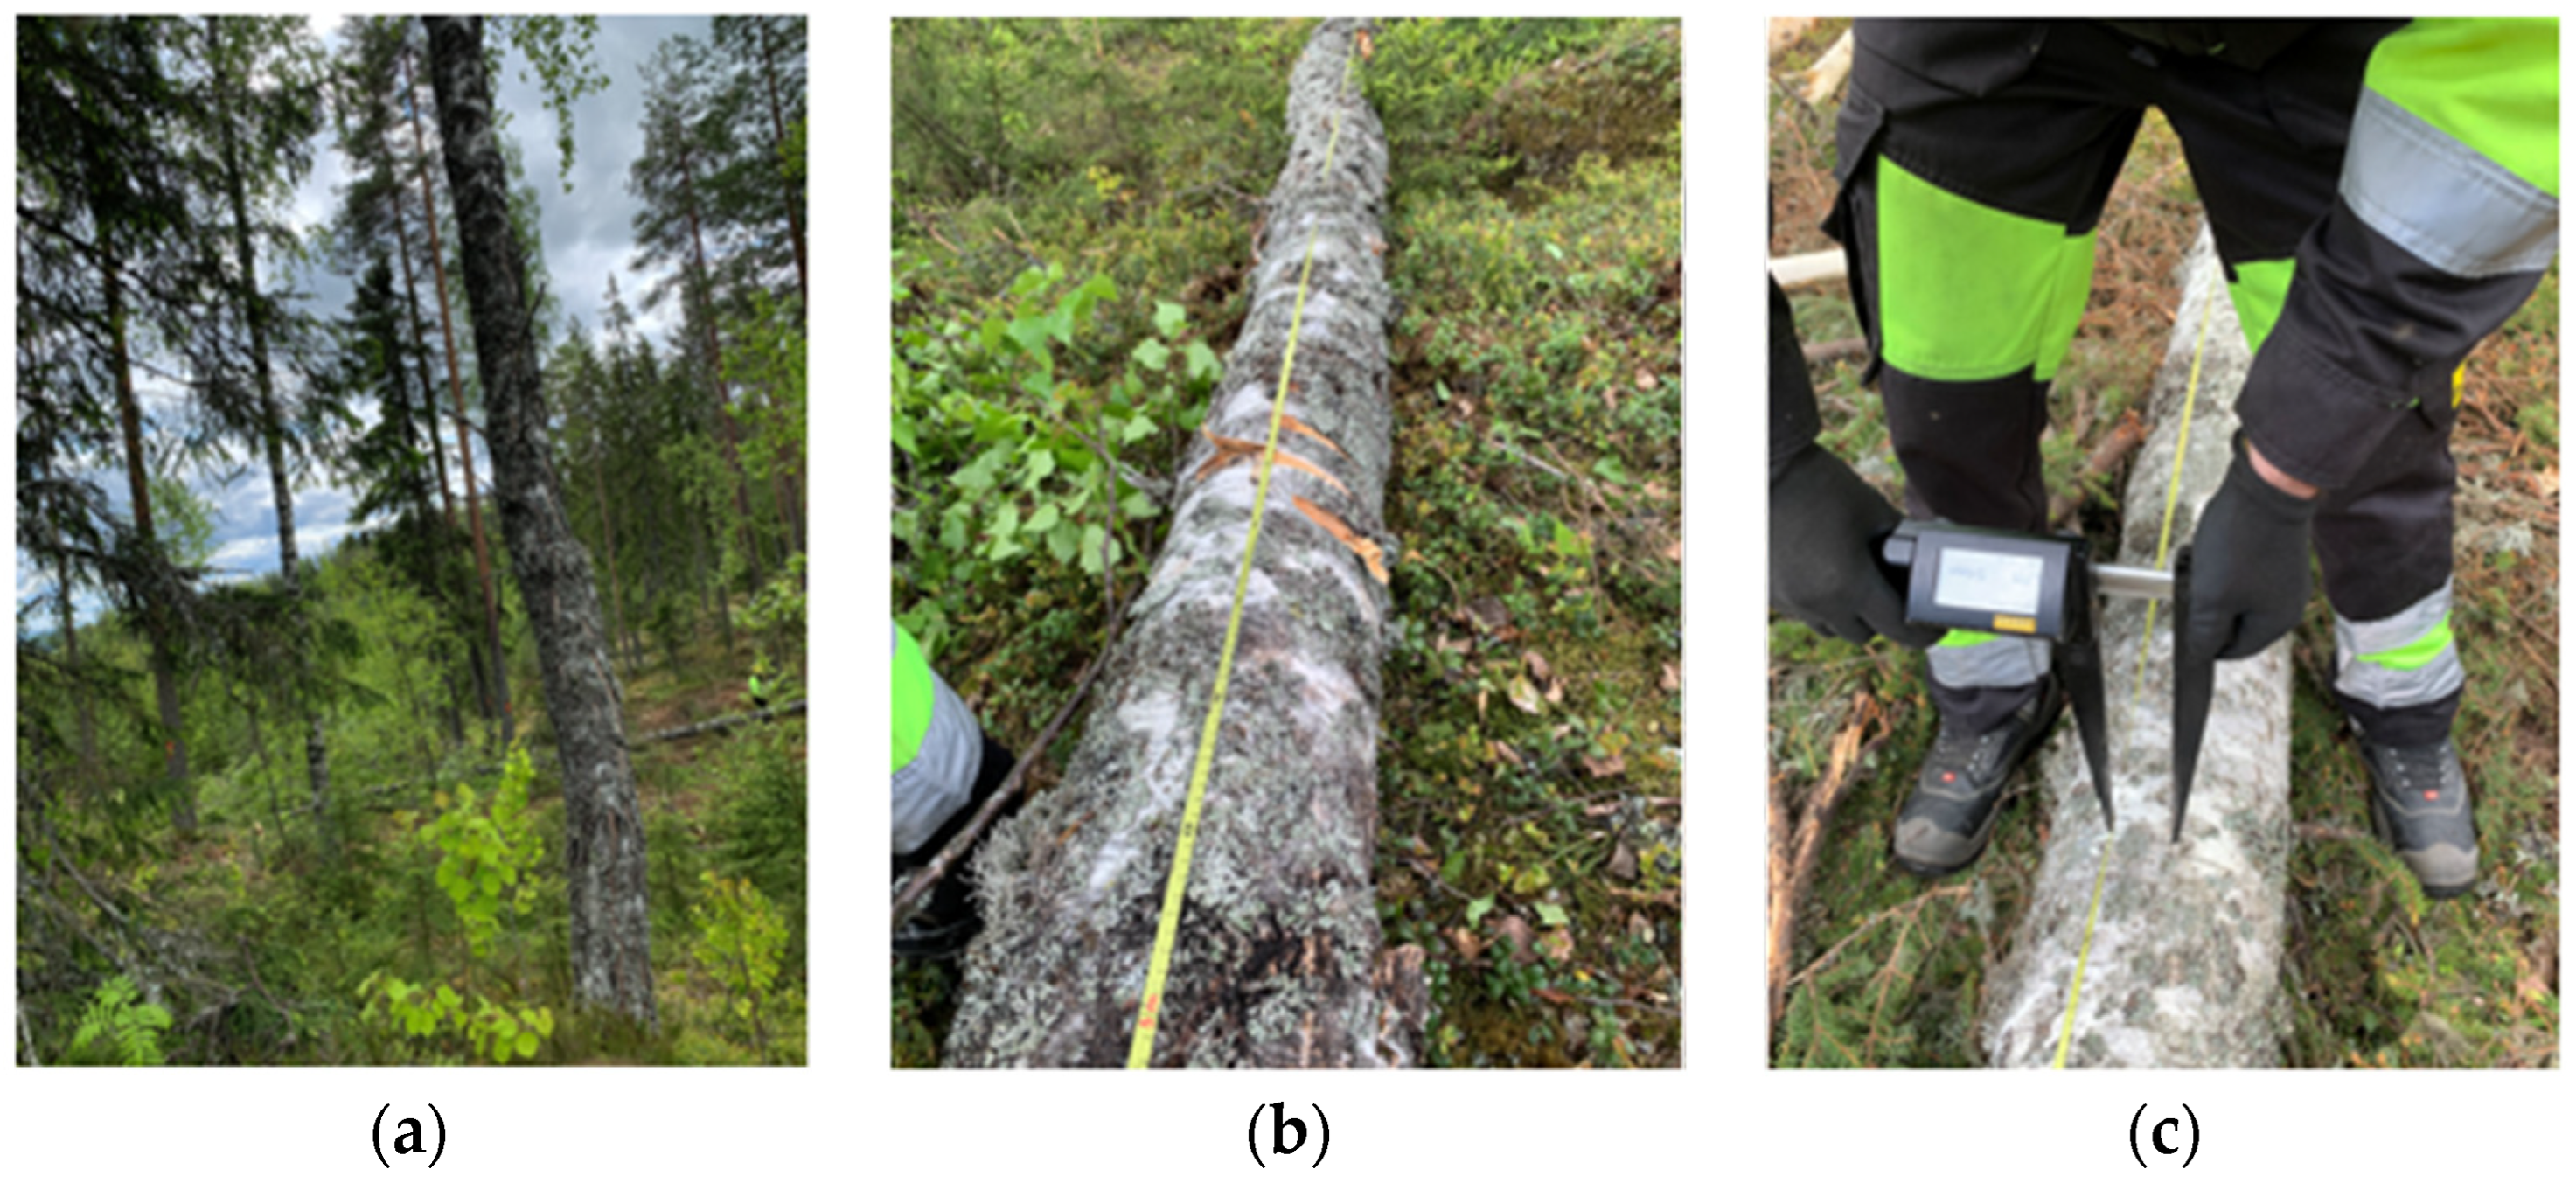
2.4.3. Determining the Accuracy

The Root Mean Square Error (RMSE) and Bias between the measured curve value and the predefined value were calculated using the following equations:
RMSE = 1 n i = 1 n P i A i 2
where P i is the predicted value, A i is the actual value, n is the number of observations.
For calculating the RMSE Percent (RMSE%):
RMSE % = RMSE mean A × 100
For calculating the Bias:
Bias = 1 n i = 1 n P i A i
For calculating the Bias Percent (Bias%):
Bias % = Bias mean A × 100
where A is the average of the actual values.

3. Results

3.1. Detecting Tree Stems from Point Clouds

Implementing PCL algorithms proved to be fairly direct requiring adjustment of only a few parameters. However, one of the major hurdles encountered was installing the PCL library and ensuring its accessibility within the Windows environment. For synthetic point cloud data, the process was relatively straightforward, as there were ample points available on each tree stem. In contrast, handling real-world point cloud data presented some challenges, particularly when trees were located further away from the sensor, trees with numerous branches, and areas where many trees were near each other, increasing the likelihood of segmentation or clustering errors. This difference can be attributed to the denser nature of point clouds in synthetic data. Despite these challenges, the process generally succeeded in accurately identifying several tree stems from the point cloud.

3.2. Detecting Defective Tree Stems from Synthetic Point Clouds

To identify defects within the detected tree stems, each stem was segmented into sections, with the central point of each section being determined. Figure 6 presents the synthetic point cloud with measurements of the stem curves. The dimensions of the original tree stem were first documented to evaluate the algorithms’ effectiveness and accuracy. This initial measurement confirmed the precision of the outcomes. Following this, the PCL was utilized to refine the tree stem’s point cloud using a VoxelGrid filter. This filtering process streamlined the point cloud by aggregating the points within each voxel around their centroid, resulting in a more concise and manageable representation of the tree stem. As illustrated in Figure 7, specifically, sample (b) was reduced to 124 points, and sample (c) to 74 points, compared to the original 392 points representing the entire tree stem (a).
The tree stems modeled in 3D yielded curve measurements of 0.1, 0.242, 0.282, and 0.563. RMSE reached 0.00229 m with an RMSE percentage of 0.77%. Additionally, the Bias stood at −0.00174 with a Bias percentage of −0.59%. These measurements confirmed the effectiveness and accuracy of the selected methods and algorithms.

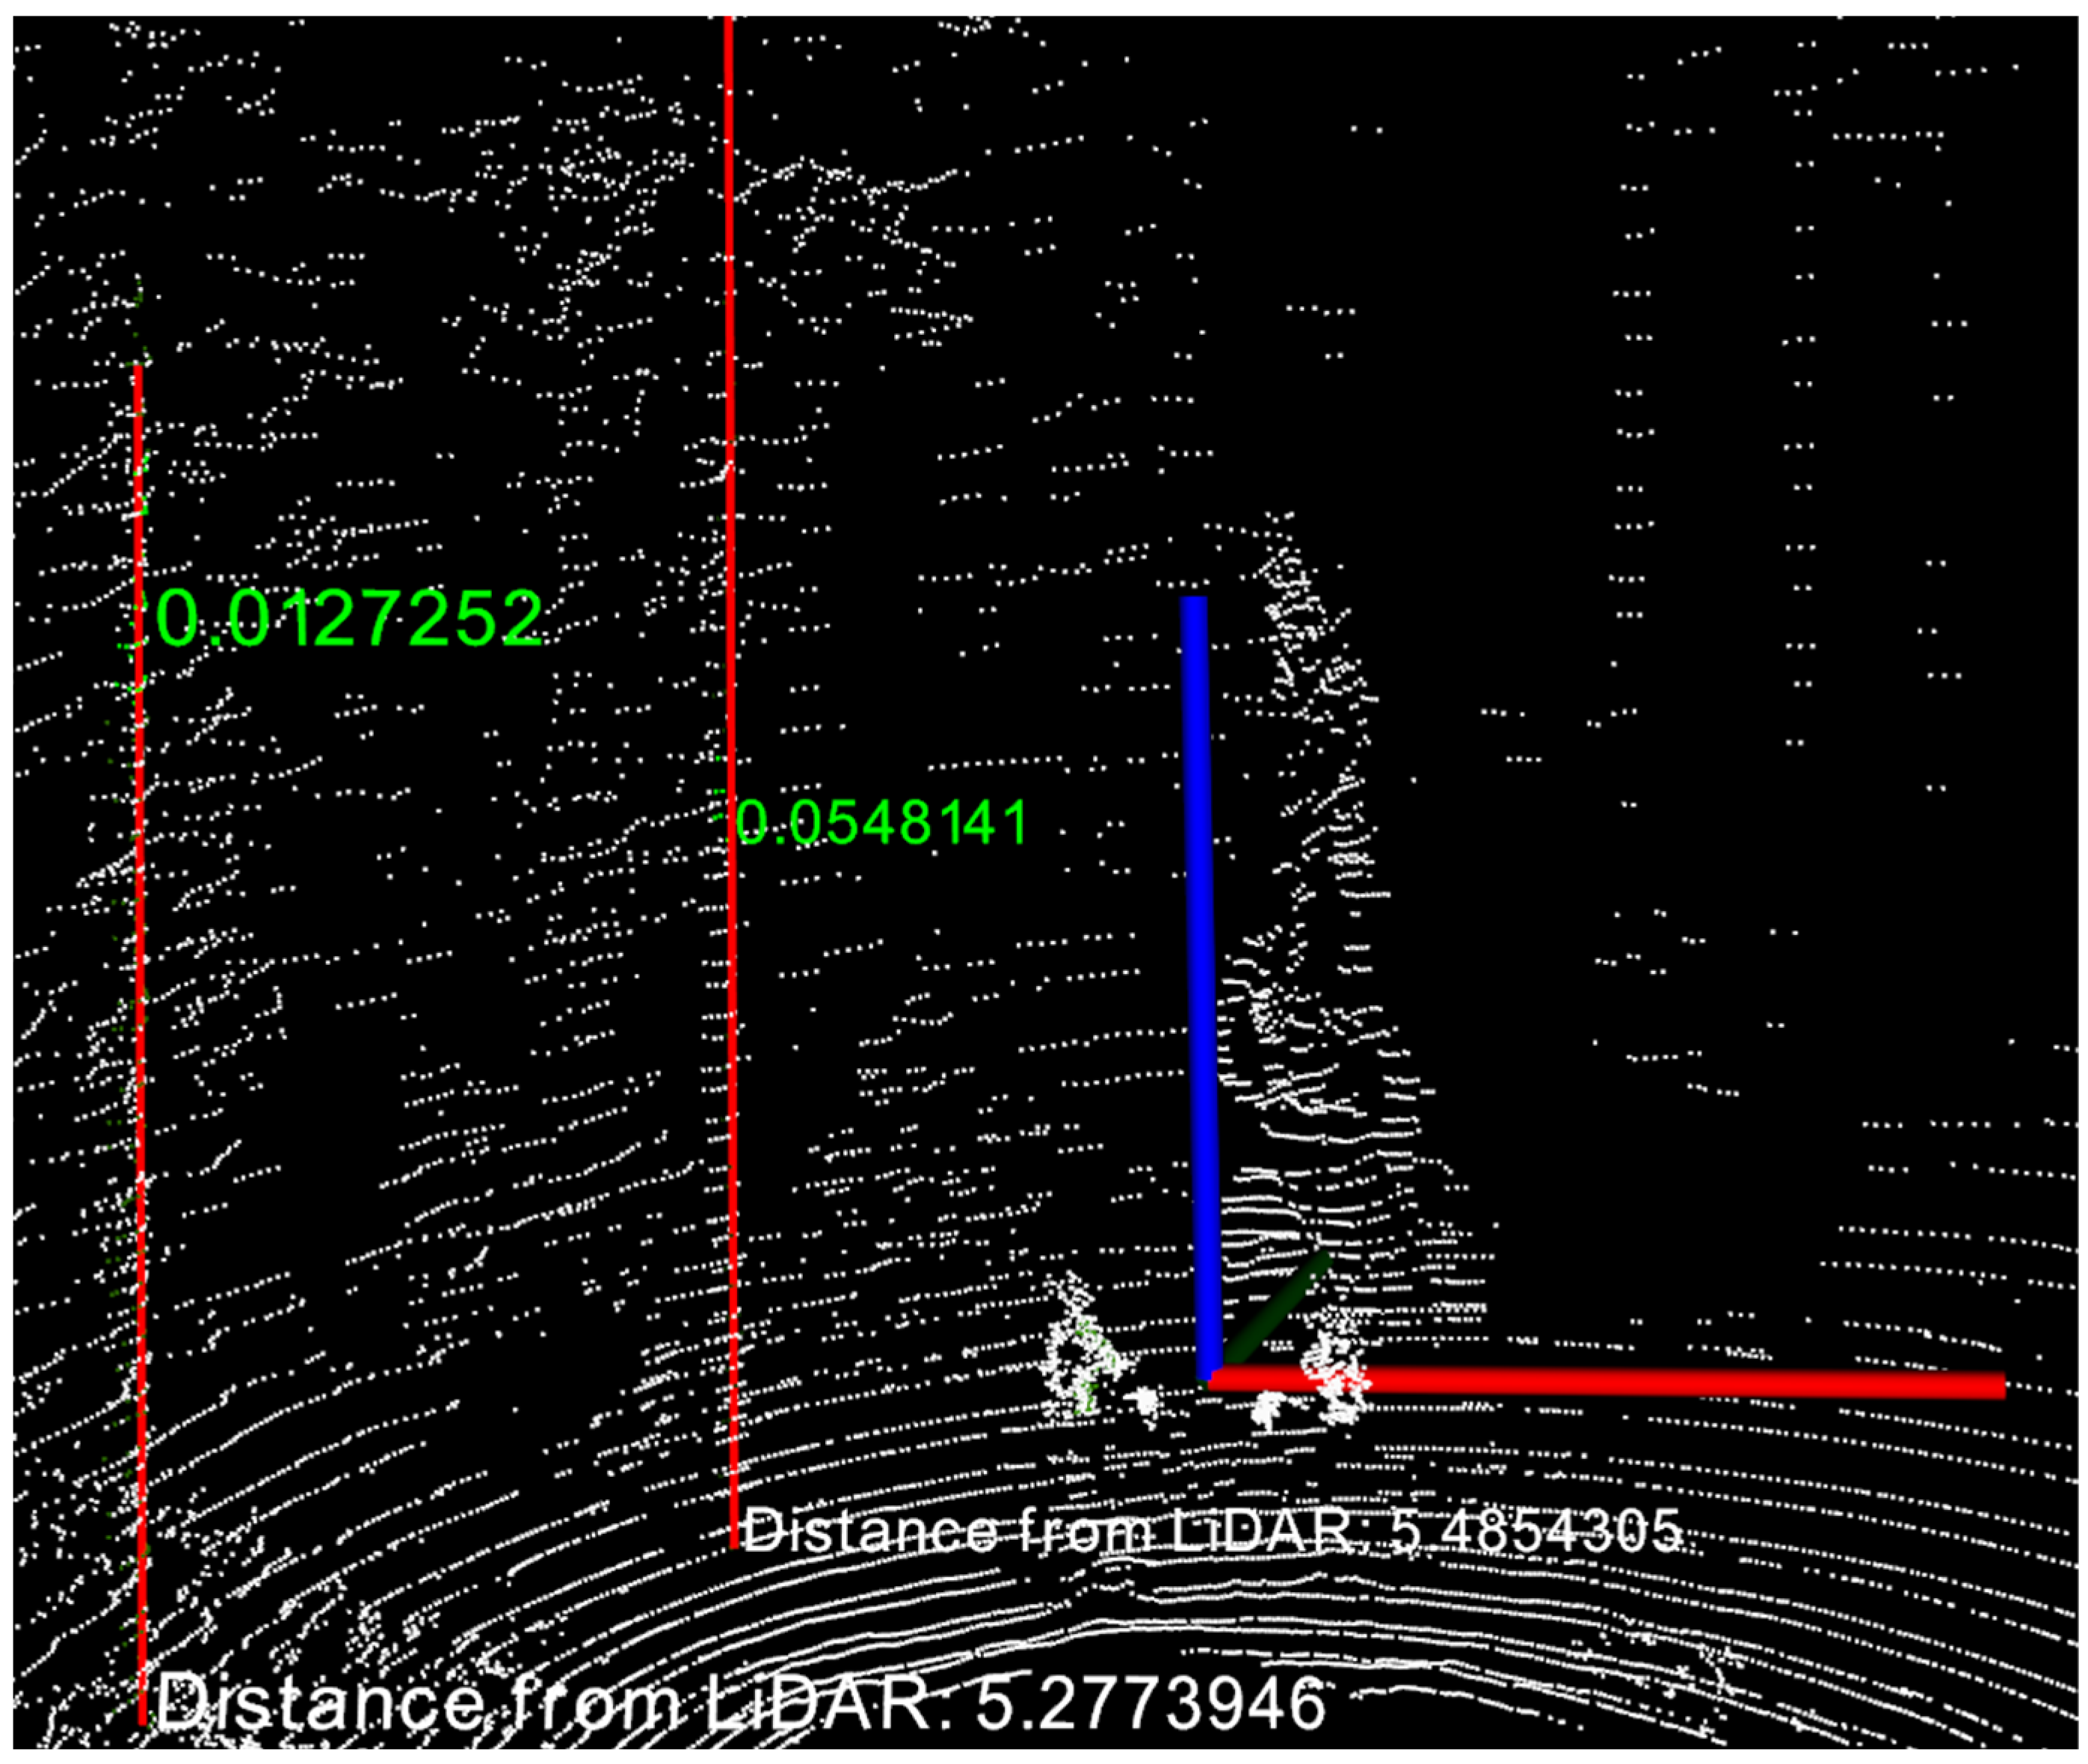
3.3. Detecting Defective Tree Stems from the Real-World Point Clouds

Detecting tree stems accurately within the real-world data proved difficult, and not all stems were correctly clustered, as noted in Section 3.1. However, once a tree stem was successfully identified, it was divided into sections, and the central point of each section was determined. The central points of these sections were then recorded, and a central line was drawn connecting the lowest and highest sections of the stem. After this, measurements were taken between the central points of each section and the central line, with the greatest distance discrepancy being noted and visualized.
Figure 8 displays the entire point cloud, the identified tree stems, the central red line, the maximum distance measured from this line which presets the tree stem maximum curve value, and the lower measurements values presents the distance from the sensor. Figure 8 displays the highest measurement value for a targeted curved tree that was felled and measured manually, in contrast to another tree which was neither felled nor subjected to manual measurement. Tree stems located farther from the sensor, which were either unrecognized or incorrectly identified, did not pose significant challenges. It is anticipated that these stems will be accurately recognized as the machine moves closer to them. The primary focus of this study was on the identification of tree stem defects and the measurement of such detected defects.
In the same test forest, we conducted three LiDAR scans, each targeting a tree with a known defect that had been manually observed and measured in the field. The manual measurements of the trees showed maximum curve values of 0.025 m, 0.054 m, and 0.086 m. Conversely, the curve values automatically derived and measured from the point cloud data were 0.025844 m, 0.054814 m, and 0.086625 m. The RMSE recorded was 0.000767 m with an RMSE percentage of 1.39%, and the Bias was measured at 0.00761 with a Bias percentage of 1.38%.

4. Discussion

In this research, we explored the utilization of LiDAR technology, specifically focusing on MLS, in CTL forestry machines to improve tree selection processes. In our current study, we focused specifically on two variables, crook and curve, based on earlier research [31] indicating their significance in forest operations. These variables were selected because they pose challenges for harvester operators and require specialized handling, as supported by industry perspectives. However, we acknowledge that tree selection involves numerous other variables contributing to the distinction between acceptable and unacceptable growing stock. While our study is limited in scope, it serves as an initial step towards understanding the potential of MLS technology in improving the tree selection process.
Indeed, MLS on harvesters has the potential to enhance efficiency by automating certain aspects of tree selection. However, we agree that the most effective decision-making process often involves the expertise of a forester on the ground. Our intention is not to replace the role of the forester but to complement it with technological assistance. By integrating MLS technology with expert forestry knowledge, we aim to achieve both efficiency and effectiveness in tree selection processes. Relevant prior art suggested that there is great potential in using MLS technology in these applications, as pointed out by Ling et al. [40]. Panagiotidis and Abdollahnejad [41] employed the random sampling consensus method (RANSAC) method for Terrestrial laser scanner (TLS) point cloud data, which achieved a notable degree of accuracy in estimating tree height and diameter, resulting in high merchantable volume estimations (97.7% for deciduous and 96.1% for conifer) trees. Our investigation addressed two primary research questions. The methodology for processing both synthetic and real-world data is in Section 2.4.2. For synthetic data, we utilized a 3D modeling engine, such as Blender, to create tree stems with predefined defects. Conversely, the real-world data collection commenced in a forest, employing an MLS sensor mounted on a CTL harvester. The detection accuracies for tree stems and their defects were promising; synthetic data showcased a 100% stem detection and the stem defect detection rate with an RMSE percentage of 0.77%, whereas real-world data achieved a stem defect detection accuracy of an RMSE percentage of 1.39%. The primary focus in the real-world scenario was on identifying defective tree stems and quantifying detected defects, without estimating the total number of stems.
Addressing the second research question, we identified key challenges in stem detection, particularly in real-world contexts, including proximity of trees, intertwining branches, stem-to-sensor distance, sensor positioning, sensor resolution limitations, and algorithmic constraints. The mobility of the harvesting machine, expected to mitigate the issue of tree proximity, and rapid advancements in sensor technology are anticipated to address many of these challenges. Continuous development in machine learning and data mining is crucial for overcoming algorithmic limitations.
Synthetic data offer advantages such as the swift creation of test environments with adjustable properties to mimic desired real-world conditions, including stem number and position, and types of predefined defects, offering a cost-effective approach. Synthetic data plays a crucial role in testing MLS technology in real forest harvesting scenarios by providing a controlled and customizable environment for experimentation. Synthetic data allows researchers to simulate various forest stand conditions and scenarios, including different tree species, terrain types, and environmental factors, which may be challenging or impractical to replicate in real-world settings. By generating synthetic data, researchers can systematically assess the performance and limitations of MLS technology under diverse conditions, without the constraints of time, cost, or logistical challenges associated with field testing. This approach enables the evaluation of MLS systems in hypothetical scenarios, allowing researchers to fine-tune algorithms, optimize sensor configurations, and validate algorithms’ robustness before deployment in actual forestry operations. Ultimately, synthetic data serves as a valuable tool for enhancing the efficiency, accuracy, and effectiveness of MLS technology in real-world forestry applications. However, real-world data are essential for validating the reliability and efficacy of the developed systems, ensuring their applicability in practical forest operations.
While the accuracy assessment of our model yielded promising results, they are based on a relatively small sample size. As highlighted in the Results section, the assessment was based on a modest data set comprising only three measured values. Although these data points provided initial insights into the model’s performance, a broader validation set, ideally consisting of more than 10 or even 30 measured values, would offer a more reliable evaluation of its prediction capability. The limited sample constrains the generalizability of our findings and warrants caution in interpreting the accuracy of the model. Future studies should collect a larger and more diverse data set to validate and refine the model further.
Despite demonstrating high defect detection accuracy in both data sets, our study revealed limitations, including the variability in sensor performance and the complexities of proper sensor placement and protection on CTL harvesters. The core of our research centered on understanding the impact of these MLS technologies on forest operations, particularly on operational efficiency, accuracy, and sustainability. MLS technology can improve sustainability in forestry operations in several ways:
  • Reduced environmental impact: By providing accurate and detailed data on tree characteristics and forest inventory, MLS technology enables more precise planning and management of harvesting activities. This can minimize unnecessary tree removal, reduce habitat disturbance, and decrease the risk of soil erosion and other environmental degradation associated with forest operations.
  • Enhanced resource utilization: MLS technology facilitates efficient tree selection and harvesting processes, leading to optimized utilization of timber resources. By accurately identifying trees with defects such as crooks and curves, MLS can help maximize the utilization of merchantable timber while minimizing waste. This contributes to sustainable forestry practices by ensuring the efficient use of available resources.
  • Improved operational efficiency: MLS technology enables faster and more accurate data collection compared to traditional manual methods. These efficiency gains in data collection translate to more efficient forest operations overall, reducing the time and resources required for field surveys and inventory assessments. By streamlining operations, MLS can help the forest industries reduce costs and improve productivity, contributing to long-term sustainability.
However, it is important to acknowledge that poorly implemented MLS technology could potentially detract from sustainability objectives. For example, if MLS data is not properly analyzed or interpreted, it may lead to inaccurate decision-making, resulting in unsustainable harvesting practices or environmental damage. Additionally, the reliance solely on technology without considering broader ecological and social factors could lead to negative consequences for forest ecosystems and local communities.
Therefore, while MLS technology offers significant potential benefits for sustainability in forestry operations, its implementation must be carefully planned and monitored to ensure that it aligns with broader sustainability goals and considers the complex interplay of environmental, economic, and social factors. Through responsible use and integration with existing forestry practices, MLS technology can contribute to more sustainable and environmentally sound forest management strategies. Challenges in achieving universal tree stem detection highlighted the critical need for tailored algorithm development and the adaptation of sensor technologies to diverse environmental conditions. Furthermore, the study revealed the potential and limitations of synthetic data in simulating real-world forest scenarios, emphasizing the importance of comprehensive data sets that represent a broad range of forest types and conditions.
The challenges posed by steep and varied terrain were not the focus of the present research but are areas left for subsequent studies. Nevertheless, certain strategies can be employed to address these challenges. For instance, slopes aligned with the harvester’s driving direction can be scanned by adjusting the tilt of the LiDAR unit accordingly. Additionally, slopes perpendicular to the driving direction can be navigated by adjusting the harvester’s trajectory accordingly. It is important to note that the simulated terrain in our study included perspective effects (cf. Figure 2), resulting in the appearance of trees at varying elevations. While our current system is optimized for relatively flat terrain, we maintain optimism regarding its adaptability to the dynamic changes inherent in real-world terrains.
The efficiency of the laser sensor in assessing log quality in the upper parts of the stem primarily relies on its ability to accurately capture and analyze key attributes such as diameter, taper, and defects. By emitting laser pulses and measuring the time it takes for the light to return, the sensor can precisely determine the distance to various points on the stem, even in challenging upper regions. This enables the generation of detailed 3D models of the stem, facilitating thorough quality assessment.
It is acknowledged that the efficacy of the laser sensor may be influenced by forest stand characteristics. Monocultural stands with uniform tree spacing and canopy structure provide optimal conditions for laser-based measurements, as they minimize interference and ensure consistent data acquisition. In such stands, the laser sensor can effectively penetrate the canopy and capture accurate measurements throughout the stem. However, in more complex stand structures or mixed-species forests, the performance of the sensor may be compromised due to increased variability and occlusion.
Addressing this limitation, future research could explore adaptations or enhancements to the sensor technology to accommodate a broader range of forest stand types and configurations. By refining the sensor’s capabilities and expanding its applicability beyond single-story monocultural stands, we can enhance its utility and contribute to more comprehensive forestry assessment practices.
While our proposal advocates for leveraging advanced sensor technologies such as MLS to assist in forest operations, it is important to recognize the nuanced role of foresters in decision-making. The intention is not to entirely replace the forester’s expertise but rather to enhance their capabilities and streamline tasks through technological assistance. The effectiveness of MLS-based systems in selecting stems to leave or cut may indeed vary depending on forest types and stand characteristics. While such systems may show promise in conifer plantations where uniformity and visibility are favorable, their applicability in natural stands, particularly hardwood forests, may present challenges.
In natural forest stands, the complexity of vegetation structure, diverse species composition, and variable terrain pose unique challenges to automated decision-support systems. Human expertise remains invaluable in assessing the ecological context, identifying desirable and undesirable trees, and considering broader management objectives such as biodiversity conservation and ecosystem resilience [26,27,28]. Therefore, it is essential to acknowledge that MLS-assisted decision-making may be more feasible and effective in certain contexts, such as managed plantations, where stand characteristics are relatively homogeneous. In natural stands, a more nuanced approach that integrates MLS data with forester expertise and local knowledge may be necessary to achieve optimal outcomes.
Compared to state-of-the-art technologies in the forestry sector, our results corroborate the findings in general, and particularly the findings on near-field LiDAR’s effectiveness in extracting tree structural details. The studies highlight the necessity for additional software for data preprocessing and post-processing. These findings underline the challenges in achieving universal LiDAR-based tree detection due to variations in sensor systems and environmental factors [6]. Liang et al. [40] highlighted significant advancements in close-range remote sensing over the past two decades, noting reductions in sensor costs and size, and improvements in mobility, reliability, and computational power. These changes have transformed traditional forest data collection, transitioning from expensive manual methods to more cost-effective and efficient automated processes. This comparative analysis not only underlines the novelty of our approach but also illuminates the path for future investigations aimed at overcoming the identified challenges.

5. Conclusions

Acknowledging identified challenges, this study underscored the necessity for further R&D to refine LiDAR-based tree stem and defect detection methods. Future work should enhance data collection and analysis, expand LiDAR’s application in varied forests, and evaluate different sensor models for accuracy, with multiple units potentially yielding superior insights. A key objective is real-time data processing to aid harvester operators. Successfully integrating LiDAR sensors onto CTL machines has demonstrated their value, though challenges like managing the vast data volume and ensuring sensor durability and optimal placement remain. Despite reduced costs, LiDAR sensors are still a significant investment.
While MLS technology holds promise for streamlining forestry tasks, including stem selection, its implementation should be approached with caution and tailored to the specific characteristics and objectives of the forest management context. The findings suggest potential for supporting foresters in their work, aiming to assist rather than replace them, thereby enhancing the efficiency of their tasks. However, realizing these prospects necessitates additional research addressing challenges such as rough terrain and varying weather conditions is needed.
This research used two data sets that may not fully represent all forest conditions, highlighting the need for broader scenario coverage in future work. While synthetic data provided controlled environments for testing, real-world data revealed the complexity of the practical application, suggesting automation of certain processes to improve future research efficacy. This groundwork paves the way for advancing LiDAR applications in forestry, aiming to overcome current limitations and unlock new efficiencies in forest management. Future research will include broader experimentation in virtual settings, such as simulations, enhanced field testing across different forest types, and denser dataset compilation through point cloud registration to boost algorithmic efficiency in tree stem and defect identification. In conclusion, we have developed two processes for tree stem and defect identification based on LiDAR technology and analyzed the challenges and advantages. The testing of the processes gave promising results and pointed directions for further development.

Author Contributions

Conceptualization, A.S. and K.E.; data curation, A.S.; formal analysis, A.S. and A.K.; methodology, A.S. and A.K.; software, A.S.; supervision, K.K. and K.E.; visualization, A.S.; writing—original draft, A.S.; writing—review and editing, A.S., K.K. and K.E. All authors have read and agreed to the published version of the manuscript.

Funding

This research was funded by PONSSE Plc and NextGenerationEU—European Union through “Nappaa hiilestä kiinni” program and the Ministry of Agriculture and Forestry (grant number VN/27353/2022 for IlmoStar).

Data Availability Statement

The synthetic data set can be provided upon request from the corresponding author.

Acknowledgments

The authors would like to thank the following people for their great support and help with this research Taneli Heikkilä, Tuomo Kohvakka, Tomi Piirainen, Panu Johansson and Kalervo Järvelin. We also would like to express our sincere appreciation to the reviewers for their insightful feedback and constructive criticism, which greatly contributed to the enhancement of this manuscript. Their valuable input has helped to improve the quality and clarity of our work.

Conflicts of Interest

Author Anwar Sagar was employed by the company Ponsse Plc. Author Anssi Koivusalo was employed by the company Epec Plc. The remaining authors declare that the research was conducted in the absence of any commercial or financial relationships that could be construed as a potential conflict of interest.

References

  1. Ponsse Plc. Ponsse Scorpion Harvester. Available online: https://www.ponsse.com/en/web/guest/products/harvesters/product/-/p/scorpion#/ (accessed on 20 February 2024).
  2. Picchi, G.; Sandak, J.; Grigolato, S.; Panzacchi, P.; Tognetti, R. Smart Harvest Operations and Timber Processing for Improved Forest Management. In Climate-Smart Forestry in Mountain Regions, Managing Forest Ecosystems 40; Tognetti, R., Smith, M., Panzacchi, P., Eds.; Springer: Cham, Switzerland, 2022; pp. 317–359. [Google Scholar] [CrossRef]
  3. Kärhä, K.; Ovaskainen, H.; Palander, T. Decision-Making Among Harvester Operators in Tree Selection and Need for Advanced Harvester Operator Assistant Systems (AHOASs) on Thinning Sites. In Proceedings of the Joint 43rd Annual Meeting of Council on Forest Engineering (COFE) and the 53rd International Symposium on Forest Mechanization (FORMEC). Forest Engineering Family—Growing Forward Together, Corvallis, OR, USA, 27–30 September 2021; pp. 15–25. [Google Scholar]
  4. Kärhä, K.; Änäkkälä, J.; Hakonen, O.; Palander, T.; Sorsa, J.A.; Räsänen, T.; Moilanen, T. Analyzing the Antecedents and Consequences of Manual Log Bucking in Mechanized Wood Harvesting. Mech. Mater. Sci. Eng. J. 2017, 12, 1–15. [Google Scholar]
  5. Kerr, G.; Haufe, J. Thinning Practice A Silvicultural Guide. 2011. Available online: https://www.forestresearch.gov.uk/publications/thinning-practice-a-silvicultural-guide/ (accessed on 20 February 2024).
  6. Heupel, C.; Wolf, P.; Berns, K. Tree-SLAM: Localization and Mapping in Dense Forest Environments for Autonomous Vehicles. Available online: https://www.researchgate.net/publication/372288298_Tree-SLAM_Localization_and_Mapping_in_Dense_Forest_Environments_for_Autonomous_Vehicles (accessed on 20 February 2024).
  7. Kärhä, K.; Räsänen, M.; Palander, T. The Profitability of Cross-Cutting Practices in Butt-Rotten Picea abies Final-Felling Stands. Forests 2019, 10, 874. [Google Scholar] [CrossRef]
  8. Miettinen, M.; Kulovesi, J.; Kalmari, J.; Visala, A. New Measurement Concept for Forest Harvester Head. In Field and Service Robotics; Springer Tracts in Advanced Robotics 62; Howard, A., Iagnemma, K., Kelly, A., Eds.; Springer: Berlin/Heidelberg, Germany, 2010; pp. 35–44. [Google Scholar] [CrossRef]
  9. Hyyti, H.; Visala, A. Feature Based Modeling and Mapping of Tree Trunks and Natural Terrain Using 3D Laser Scanner Measurement System. IFAC Proc. Vol. 2013, 46, 248–255. [Google Scholar] [CrossRef]
  10. Li, J.; Thiel, M. Stem and Stand Characterization Using Mobile Terrestrial LiDAR in Plantation and Complex Multi-Cohort Stands; FPInnovations, Technical Report 38. 2018. Available online: https://library.fpinnovations.ca/media/FOP/TR2018N38.PDF (accessed on 20 February 2024).
  11. Liang, X.; Hyyppä, J.; Kukko, A.; Kaartinen, H.; Jaakkola, A.; Yu, X. The Use of a Mobile Laser Scanning System for Mapping Large Forest Plots. IEEE Geosci. Remote Sens. 2014, 11, 1504–1508. [Google Scholar] [CrossRef]
  12. Nevalainen, P.; Li, Q.; Melkas, T.; Riekki, K.; Westerlund, T.; Heikkonen, J. Navigation and Mapping in Forest Environment Using Sparse Point Clouds. Remote Sens. 2020, 12, 4088. [Google Scholar] [CrossRef]
  13. Bienert, A.; Georgi, L.; Kunz, M.; von Oheimb, G.; Maas, H.G. Automatic extraction and measurement of individual trees from mobile laser scanning point clouds of forests. Ann. Bot. 2021, 128, 787–804. [Google Scholar] [CrossRef] [PubMed]
  14. Morgan, C.J.; Powers, M.; Strimbu, B.M. Estimating Tree Defects with Point Clouds Developed from Active and Passive Sensors. Remote Sens. 2022, 14, 1938. [Google Scholar] [CrossRef]
  15. Panagiotidis, D.; Surový, P.; Kuželka, K. Accuracy of Structure from Motion models in comparison with terrestrial laser scanner for the analysis of DBH and height influence on error behaviour. J. For. Sci. 2016, 62, 357–365. [Google Scholar] [CrossRef]
  16. Hyyppä, E.; Kukko, A.; Kaartinen, H.; Yu, X.; Muhojoki, J.; Hakala, T.; Hyyppä, J. Direct and automatic measurements of stem curve and volume using a high-resolution airborne laser scanning system. Sci. Remote Sens. 2022, 5, 100050. [Google Scholar] [CrossRef]
  17. Yun, T.; Cao, L.; An, F.; Chen, B.; Xue, L.; Li, W.; Pincebourde, S.; Smith, M.J.; Eichhorn, M.P. Simulation of multi-platform LiDAR for assessing total leaf area in tree crowns. Agric. For. Meteorol. 2019, 276–277, 107610. [Google Scholar] [CrossRef]
  18. Lu, J.; Wang, H.; Qin, S.; Cao, L.; Pu, R.; Li, G.; Sun, J. Estimation of aboveground biomass of Robinia pseudoacacia forest in the Yellow River Delta based on UAV and Backpack LiDAR point clouds. Int. J. App. Earth Obs. 2020, 86, 102014. [Google Scholar] [CrossRef]
  19. De Paula Pires, R.; Olofsson, K.; Persson, H.J.; Lindberg, E.; Holmgren, J. Individual tree detection and estimation of stem attributes with mobile laser scanning along boreal forest roads. ISPRS J. Photogramm. Remote Sens. 2022, 187, 211–224. [Google Scholar] [CrossRef]
  20. Kukko, A.; Kaijaluoto, R.; Kaartinen, H.; Lehtola, V.V.; Jaakkola, A.; Hyyppä, J. Graph SLAM correction for single scanner MLS forest data under boreal forest canopy. ISPRS J. Photogramm. Remote Sens. 2017, 132, 199–209. [Google Scholar] [CrossRef]
  21. Gao, S.; Zhang, Z.; Cao, L. Individual Tree Structural Parameter Extraction and Volume Table Creation Based on Near-Field LiDAR Data: A Case Study in a Subtropical Planted Forest. Sensors 2021, 21, 8162. [Google Scholar] [CrossRef] [PubMed]
  22. Tatsumi, S.; Yamaguchi, K.; Furuya, N. ForestScanner: A mobile application for measuring and mapping trees with LiDAR-equipped iPhone and iPad. Methods Ecol. Evol. 2023, 14, 1603–1609. [Google Scholar] [CrossRef]
  23. Metsälehti. Finnmetko 2022: Ponsse toi Laserkeilaimen Hakkuukoneeseensa (Ponsse Introduced a Laser Scanner to Ponsse Scorpion Harvester). Metsälehti Uutinen 2 September 2022. Available online: https://www.metsalehti.fi/uutiset/finnmetko-2022-ponsse-toi-laserkeilaimen-hakkuukoneeseensa/#c79b2cfa (accessed on 20 February 2024).
  24. Finnish Forest Centre. Metsien Ensiharvennukset Eivät ole Suositusten Mukaisia (First Thinning’s Do Not Comply with Recommendations). Suomen Metsäkeskus, Uutinen 19 December 2022. Available online: https://www.metsakeskus.fi/fi/ajankohtaista/metsien-ensiharvennukset-eivat-ole-suositusten-mukaisia (accessed on 20 February 2024).
  25. Finnish Forest Centre. Tasaikäisrakenteisten Metsien Korjuujälkitarkastusten Aikasarja (Harvesting Result in Thinnings Reported by the Inventories of Finnish Forest Centre in 2016–2022 in Finland). Available online: https://www.metsakeskus.fi/sites/default/files/document/tiedote-liite-korjuujaljen-tarkastukset.pdf (accessed on 20 February 2024).
  26. Finnish Forest Industries. Roadmap for the Wood Processing Industry More Biodiverse Forests. 2023. Available online: https://assets-global.website-files.com/5f44f62ce4d302179b465b3a/6524e21683a1c9a3a0d53e85_Metry_Monimuotoisuus_2023_eng_low.pdf (accessed on 20 February 2024).
  27. Kärhä, K.; Malinen, J.; Hyyppä, J.; Kaartinen, H. Technological Opportunities in Measuring Biodiversity during Harvesting. Finnish Forest Industries, Blog 31 May 2023. Available online: https://www.metsateollisuus.fi/newsroom/technological-opportunities-in-measuringbiodiversity-during-harvesting (accessed on 20 February 2024).
  28. Korhonen, L.; Kärhä, K.; Maltamo, M.; Malinen, J.; Hyyppä, J.; Kaartinen, H.; Toivonen, J.; Packalen, P.; Koivula, M. Kaukokartoitus ja metsäkoneiden sensorit metsien monimuotoisuus indikaattorien seurannassa (Remote sensing and forest machine sensors in the monitoring of forest biodiversity indicators). Manuscript submitted, 2024.
  29. La Hera, P.M.; Trejo, O.M.; Lindroos, O.; Lideskog, H.; Lindbäck, T.; Latif, S.; Li, S.; Karlberg, M. Exploring the Feasibility of Autonomous Forestry Operations: Results from the First Experimental Unmanned Machine. Authorea 2023. [Google Scholar] [CrossRef]
  30. Visser, R.; Obi, O.F. Automation and Robotics in Forest Harvesting Operations: Identifying Near-Term Opportunities. Croat. J. For. Eng. 2021, 42, 13–24. [Google Scholar] [CrossRef]
  31. Sagar, A.; Einola, K.; Ghabcheloo, R. Tree stem geometry quality assist system for cut-to-length harvester operator—Defining needs & solutions. In Proceedings of the 18th Scandinavian International Conference on Fluid Power (SICFP’23), Tampere, Finland, 30 May–1 June 1 2023. [Google Scholar]
  32. Metsäteho. Opas, Sahapuurunkojen Apteeraus (Guidelines for Bucking Sawlog Stems). 1989. Available online: https://www.metsateho.fi/wp-content/uploads/Opas_sahapuurunkojen-apteeraus-1989.pdf (accessed on 20 February 2024).
  33. Keinänen, E.; Tahvanainen, V. Puutavaralajien Mitta-ja Laatuvaatimukset (Measuring and Quality Requirements for Timber Assortments). Keski-Suomen Metsäkeskuksen Julkaisu 7/1999. Available online: https://docplayer.fi/6113385-Puutavaralajien-mitta-ja-laatuvaatimukset.html (accessed on 20 February 2024).
  34. Blender Software. Open Source 3D Creation Suite. Available online: https://www.blender.org/ (accessed on 20 February 2024).
  35. Jones, M.H. Add-On for Importing and Exporting PCD Files. Available online: https://github.com/MarkHedleyJones/blender-pcd-io (accessed on 20 February 2024).
  36. Ouster Datasheet. Available online: https://data.ouster.io/downloads/datasheets/datasheet-rev06-v2p5-os0.pdf (accessed on 20 February 2024).
  37. CloudCompare. Available online: https://www.cloudcompare.org/main.html (accessed on 20 February 2024).
  38. Point Cloud Library (PCL). Available online: https://pointclouds.org/ (accessed on 20 February 2024).
  39. Microsoft Visual Studio 2022. Available online: https://visualstudio.microsoft.com/vs/professional/ (accessed on 20 February 2024).
  40. Liang, X.; Kukko, A.; Balenović, I.; Saarinen, N.; Junttila, S.; Kankare, V.; Holopainen, M.; Mokroš, M.; Surový, P.; Kaartinen, H.; et al. Close-Range Remote Sensing of Forests: The State of the Art, Challenges, and Opportunities for Systems and Data Acquisitions. IEEE Geosci. Remote Sens. Mag. 2022, 10, 32–71. [Google Scholar] [CrossRef]
  41. Panagiotidis, D.; Abdollahnejad, A. Reliable Estimates of Merchantable Timber Volume from Terrestrial Laser Scanning. Remote Sens. 2021, 13, 3610. [Google Scholar] [CrossRef]
Figure 2. Blender view: 3D models (a) and point cloud created from the 3D models (b).
Forests 15 00818 g002
Figure 3. The Ouster LiDAR OS0 on the Ponsse Scorpion (a) and the view from the test forest (b).
Forests 15 00818 g003
Figure 4. Visualization of the recoded point cloud data on pc.
Forests 15 00818 g004
Figure 5. The target curved tree before fell cut (a) the target tree after the felling, ran manual measurements with set up the measuring tape (b) and measured the curve using the digital Masser BT caliper (c).
Forests 15 00818 g005
Figure 6. Illustrates the point cloud of the synthetic data. Green dots represent the point cloud, the red line represents the center line, the white text represents the value of the measurement.
Forests 15 00818 g006
Figure 7. The synthetic stem point cloud: The original full tree stem with the measurement (a), down sampled point cloud (b), and more down sampled point cloud (c). Green dots represent the point cloud, the red line represents the center line and the white text represents the value of the measurement.
Forests 15 00818 g007
Figure 8. In the original full-point cloud, the red line presents the center line of the tree stem with the curve measurement in green. The bottom measurement presents the distance between the tree and the sensor in white.
Forests 15 00818 g008
Disclaimer/Publisher’s Note: The statements, opinions and data contained in all publications are solely those of the individual author(s) and contributor(s) and not of MDPI and/or the editor(s). MDPI and/or the editor(s) disclaim responsibility for any injury to people or property resulting from any ideas, methods, instructions or products referred to in the content.

