Reconstructing Long Term High Andean Forest Dynamics Using Historical Aerial Imagery: A Case Study in Colombia


1
Botanischer Garten und Botanisches Museum Berlin-Dahlem, Freie Universität Berlin, Königin-Luise-Straße 6-8, 14195 Berlin, Germany
2
Institut für Biologie—Systematische Botanik und Pflanzengeographie, Freie Universität Berlin, Altensteinstraße 6, 14195 Berlin, Germany
3
Facultad de Ciencias Naturales, Universidad del Rosario, Programa de Biología, Carrera 24#63C-69, Bogotá 111221, Colombia
*
Author to whom correspondence should be addressed.
Forests 2020, 11(8), 788; https://doi.org/10.3390/f11080788
Submission received: 2 June 2020
/
Revised: 10 July 2020
/
Accepted: 18 July 2020
/
Published: 22 July 2020
(This article belongs to the Section Forest Inventory, Modeling and Remote Sensing)
Abstract
:High Andean forests are biodiversity hotspots that also play key roles in the provisioning of vital ecosystem services for neighboring cities. In past centuries, the hinterland of Andean fast-growing cities often experienced a dramatic decline in forested areas, but there are reports that forest cover has been recovering recently. We analyzed aerial imagery spanning the years 1940 to 2007 from nine administrative localities in the Eastern Andean Cordillera of Colombia in order to elucidate precise patterns of forest vegetation change. To this aim, we performed image object-based classification by means of texture analysis and image segmentation. We then derived connectivity metrics to investigate whether forest cover trajectories showed an increase or decrease in fragmentation and landscape degradation. We observed a forest cover recovery in all the examined localities, except one. In general, forest recovery was accompanied by an increase in core habitat areas. The time scale of the positive trends identified partially coincides with the creation of protected areas in the region, which very likely furthered the recovery of forest patches. This study unveils the long-term dynamics of peri-urban high Andean forest cover, providing valuable information on historical vegetation changes in a highly dynamic landscape.
1. Introduction
Landscape change is the result of a broad variety of human activities with various effects on ecosystems, which depends on the nature and intensity of these activities [1,2]. Land cover change does not only interfere with the structure and functioning of ecosystems, but also affects the interactions with the atmosphere, ultimately contributing to local and global climate change [3,4]. In this context, habitat fragmentation modifies the availability of resources by creating artificial patch edges and by altering the degree of isolation of patches [5,6]. This, in turn, alters species distribution, abundance, and diversity [7,8], as well as carbon stocks [9], and ecosystems nutrient fluxes [10]. Particularly, landscape fragmentation poses severe threats to the native tree flora [11] and induces higher individual mortality [12] and extinction rates either at the species level [13] or at the population level [14,15]. Ultimately, the resulting biotic homogenization affects the resilience of forest remnants to current and future changes in environmental conditions [16,17].
In Latin America, one of the major drivers of forest loss and habitat fragmentation is the conversion of forests into arable lands and pastures [18,19]. The expansion of pastures into forest fragments is perceived by local inhabitants as a direct improvement of their economic situation. On the other hand, the associated biodiversity loss, and the alteration of local climate patterns and hydrological cycles [4,20] involve negative economic effects in the long term, at different geographical scales [19].
While deforestation is happening at an alarming rate in economic frontier zones [21], abandoned peri-urban farmlands and pastures are often in the process of natural recovery, which results in the establishment of shrublands or the regrowth of forest cover [22,23]. In the more recent past, i.e., the last five decades [24], the impacts of globalization (new flows of labor, capital, commodities, and ideas [25]), the intensification of agriculture and industrialization profoundly affected rural economies and led to the migration of significant parts of the rural population to urban areas. As a consequence, former agricultural areas were abandoned [24,26]. On the other hand, in many Latin American rural landscapes that remain densely inhabited, forest recovery may be driven by the drop in crop prices followed by the abandonment of agriculture [21]. Nevertheless, the landscape mosaic dynamics in coupled urban–rural systems of the Andes, such as the hinterland of Bogotá, Colombia, are very complex in space and time [27], and are still influenced by the substantial deforestation that took place during the last centuries [24].
High Andean forests represent a characteristic ecosystem in the Northern Andes, between 2600 and 3500 m [28]. They harbor a high diversity of species, high levels of endemism and are therefore recognized as a conservation priority [29]. Regrettably, these ecosystems are generally fragmented and poorly protected [30], while being essential in the provisioning of key ecosystem services to neighboring cities, including hydrologic regulation and soil conservation [31,32]. The forests in the Eastern Andean Cordillera of Colombia experienced substantial human-induced modifications throughout the last centuries, leading to a drastic reduction of their extension [30,33]. The resultant urban–rural forest mosaic has been extensively studied with regard to species composition [34,35,36,37,38] and more recently, regarding the regeneration stadia of forest fragments [39,40,41], human impact on vegetation, and the provisioning of ecosystem services [42,43,44].
Most cases studies on vegetation or land cover change rely on satellite imagery, which has been available since the 1970s [45,46]. In order to analyze several decades of landscape dynamics, we used aerial imagery. Although such photographs are available for the study area, they have only been scarcely employed to date (but see e.g., [33,47,48]). Aerial photographs are compatible with satellite remote sensing data, but usually come with different spatial and spectral resolution [32]. Such historical aerial imagery depicts past landscape structure and its change across decades often representing an underutilized source of information. The analysis of such multi-temporal data has been shown to play an important role in the detection of long-term landscape changes and the reconstruction of ecosystem transformations at a fine resolution [45,49]. Unveiling historical patterns of landscape connectivity is relevant to evaluate the effects of past human activities, and it is crucial for understanding the current species diversity patterns and ecosystem functioning [50]. A reconstruction of forest cover changes at a fine scale is also instrumental for correlating the observed vegetation changes with land use activities. Taken together, a detailed spatial reconstruction of the landscape dynamics can significantly contribute to planning and evaluating the potential impact of conservation measures.
Land-use and land-cover studies from the study area indicate forest fragmentation on one hand [4,31,51], but on the other hand also a recent increase in forest cover [27,47,52,53]. Although forest recovery can be taken as a positive sign, past land-use history may have resulted in severe habitat deterioration [22], leaving lands vulnerable to soil degradation [54] or invasive species [22,55]. In this context, analyses over a long period of time and at fine spatial resolution are lacking, despite their importance for the assessment of historical trends in landscape transformation and degradation. A better understanding of the main drivers of forest loss or recovery requires the precise monitoring of changes in forest cover at a small geographical scale. Recent studies on vegetation composition, structure, and the anthropogenic impact on biodiversity and biomass underpins the need for precise information on the permanency of forest fragments, as well as the clear identification of regrown forest patches with corresponding age estimates (secondary succession) and their spatial configuration through time [44].
This study aims to investigate long-term changes in the extension and structure of high Andean forests by gathering detailed information on landscape history and patterns of landscape change through several decades. Specific objectives are: (i) to assess the forest cover change in the surroundings of Bogotá by means of aerial imagery covering a range of 60 years; and (ii) to evaluate the forest cover structure as described by spatial pattern indicators in relation to forest cover trends in the region.
2. Materials and Methods
2.1. Study Area
The study area encompassed nine localities in the hinterland of Bogotá, the capital city of Colombia (Figure 1). Six of the study localities are situated in an arc north of the city in the department of Cundinamarca (Tabio, Soacha, San Francisco, El Rosal, Guasca, and Guatavita) and three are located within the capital district Bogotá D.C. (Torca, Pasquilla, and Sumapaz). These localities were selected because they match a network of permanent plots that was established as a basis for various botanical and ecological studies between 2013 and 2019 [39,40,41,44]. The high Andean forests close to Bogotá reach a modest height (15–25 m) and are typically dominated by trees and tall shrubs of the genera Weinmannia, Miconia, Cavendisha, Myrsine, Myrcianthes, Xylosma, and Daphnopsis [38,41,44,56]. Around the city, the forest remnants appear as scattered and fragmented patches. Some of these forested areas form part of a natural reserves network, created in the 1970s, and some have received their protection status only recently (as in the case of Los Encenillales in Pasquilla and El Encenillo in Guasca). The remaining forest patches are reported to be threatened by urban expansion, road construction [27,30], and by the opening of new areas to create pastures, especially in more rural localities [31,57,58]. Detailed information related to the study localities is presented in Supplementary Table S1.
2.2. Land Cover Mapping
2.2.1. Acquisition and Processing of Aerial Photos
A total of 71 aerial greyscale photos of the selected localities (Figure 1) was obtained from the Colombian Geographical Institute Agustín Codazzi (IGAC), covering a period from the 1940s up to the year 2007 (i.e., roughly one photo per decade and locality). The photos were scanned in high resolution and georeferenced in two consecutive steps using QGIS 2.18 [59]. To this aim, we used the thin plate spline as a transformation method for data interpolation, since it led to the highest precision among all the methods tested (first and second order polynomials). After a first georeferencing step, the overlapping areas were clipped to obtain a series of aerial scenes for each of the localities, which is equivalent in shape, size, and position (Figure 2a). A subsequent, second georeferencing step was performed to achieve the highest precision possible. All photos were resampled at 1 m pixel size. From the initial 71 scenes, we selected 41 that covered the very same area in each of the study localities through the time series (Table 1).
2.2.2. Texture and Object-Based Image Analysis
Traditionally, aerial photographs were classified through manual interpretation into land-cover/land-use categories. This required well trained specialists, and imposed numerous challenges [45]. In recent years, automated classification techniques have been used in interpreting aerial imagery [49,60,61,62]. Object-based classification is used to efficiently delineate homogeneous polygons of land-cover/land-use based on panchromatic aerial imagery [63]. Object-based approaches rely on grouping neighboring pixels of similar properties to form objects, a process known as segmentation, before carrying out further image-processing analysis [64]. Resulting objects can be classified using properties such as tone and color, size, shape, texture, and contextual relationships [45]. Texture analysis was performed to enhance the pixel classification of the greyscale pictures using the glcm package [65] in RStudio 1.0.153 [66]. A moving window size of 7 × 7 pixels was adopted as an average value in order to avoid the drawbacks of either too large or too small window sizes [67,68]. Texture metrics were calculated for the four directions and the generated raster layers were examined. Based on the most informative metrics to visually distinguish our land cover classes, we retained three metrics for classification purposes: entropy, mean and second moment [69]. Segmentation for the object-based image analysis (OBIA) was carried out using the ‘Seeded Region Growing Algorithm’ [70] on a layer stack of the selected three texture metrics and the greyscale original aerial picture with the OBIA module in SAGA GIS 2.1.4 [71] to enhance the image classification at the pixel level by reducing the within-class variability [72,73]. We specified 5 pixels as the minimum object size in accordance with the smallest recognizable entity, i.e., the approximate average width of a tree canopy in the high Andean forests under study.
2.2.3. Supervised Classification and Accuracy Assessment
In order to perform the supervised classification, we manually selected our training polygons among the ones generated by the segmentation algorithm. We distinguished three classes: B (bare ground/built-up including main and secondary roads, houses, and bare fields), G (grass, cultivated fields, and low shrubs), and T (trees and tall shrubs). We did not distinguish forest plantations and natural forests because the quality of the aerial imagery did not allow for it. Supervised classification was carried out with all the selected aerial photos using the maximum likelihood criterion in SAGA GIS 2.1.4. [71] (Figure 2b) due to its efficacy in performing a classification when there are well separated land cover classes, as was the case in our study [74].
An accuracy assessment was carried out to derive the overall accuracy (OA), class-specific user accuracy (UA) and the producer accuracy (PA). We used a balanced, random sampling response design to obtain a more accurate estimate of the user’s accuracy for the proportionally smallest class B and allocated an adequate sample size to it [75]. The three land cover classes (B, G, T) were defined as strata and 100 validation points were randomly generated for each class. When object-based segmentation is used as a means to improve classification results, it is recommendable to adopt a pixel-based response sampling design, due to its simplicity and lack of specific boundary or structural quality control [76]. Thus, our response design was built of 300 blocks [77] of 3 × 3 pixels around the randomly generated points. Within the blocks, we applied a majority criterion. When a precise block-based class attribution was not possible due to the low quality of the greyscale picture, an additional visual interpretation of the land cover classes based on the neighboring pixels was carried out. Good practice recommendations stipulate that the reference classification should be of higher quality than the map classification [78]. For this reason, the visual validation was carried out on the original higher-resolution greyscale aerial picture. Stratified area estimators as well as the overall and class-specific accuracy were obtained following the equations proposed by Oloffson et al. [79]. The error matrices resulting from this response sampling design, all accuracy values, and class area statistics are presented in the Supplementary Material (Tables S2 and S3).
2.2.4. Morphological Spatial Pattern Analysis (MSPA)
In order to get some insights into the quality of the underlined forest recovery, we complemented the land cover classification with the morphological spatial pattern analysis (MSPA). In principle, a classification of forest fragments would also need data on the floristic composition and structure of the vegetation over time. However, by deriving MSPA classes from geometric patterns within the forest cover, we can infer the information on the structural features of the forest cover trends. We are well aware that other fragmentation metrics and frameworks exist and are available [80,81]. However, we chose to derive a limited set of robust indicators, which provides a simple interpretation of features in the landscape and which relates to the needs of wildlife populations and plant communities in the study area, while maintaining considerable sensitivity to pattern changes over time [82].
The classified images of all localities were analyzed for geometry and connectivity using the MSPA QGIS plugin [83]. The MSPA uses a series of mathematical morphological operators to describe the geometrical properties of raster binary maps, e.g., forest (or foreground) = 1, non-forest (or background) = 0. The MSPA returns a raster layer with a minimum of seven mutually exclusive feature classes (core, islet, loop, bridge, perforation, edge, and branch) [83] that trace the geometry and connectivity of the binary layer components’ spatial arrangement [84]. We performed the MSPA focusing on the forest class (T) and thus defined the remaining two classes (B and G) as background.
The definition of each MSPA category is provided in Table 2. According to their morphology, these categories can be subdivided into four main groups: (i) core, (ii) islet, (iii) connectors and branches, and (iv) edge [80].
We produced forest/non-forest binary layers from the land cover imagery, removed the raster polygons smaller than the selected threshold size (50 pixels), and replaced them with the pixel value of the largest neighboring polygon (Figure 2c). Subsequently, we performed the MSPA by using the following parameterization: Foreground Connectivity = 4 pixels, Edge Width (s) = 5, Transition = 1, and Intext = 0. Foreground Connectivity was set to four pixels to constrain to cardinal directions only [84], but also to take into account the maps’ high spatial resolution and to avert an overestimation of the connectivity in the connector’s classes. Edge width was set to five meters, which we considered to be an adequate threshold in our particular study system, to distinguish between the fragment edge and core areas. Transition was set to one to illustrate all the detected connections [84]. The Intext value was set to zero, as opposed to the default Intext = 1, to avoid the subdivision of the internal background into the two categories core-opening and border-opening [84] (Figure 2d). The processing workflow is exemplified in Figure 2 and all the processing steps of the aerial imagery are summarized in the Supplementary Figure S4. Finally, an analysis of the correlation was performed to investigate the relationships between the class T area and MSPA groups defined in Table 2.
3. Results
The supervised land cover classification performed satisfactorily, returning good OA values (see Supplementary Tables S2 and S3 for the complete error matrices and accuracy indices of all the classes and localities through the time series). Regarding the class-specific accuracy values, the class T and G returned good values of UA and PA. Finally, the class B returned satisfactory values for UA but had low PA values in few cases indicating omission errors.
In the period between 1940 and 2007, we found an overall increasing proportion of forested surface in eight of the nine study localities (Figure 3 and Supplementary Table S5). The only exception with a net loss of forest cover was found in Pasquilla (−6.77 ha), while the highest increase was observed in Torca (+289.40 ha, Figure 3 and Figure 4a–e). A consistent increase in forest cover was detected in Guasca and Guatavita (+141.19 ha and 115.61 ha, respectively), and also in Soacha (+106.88 ha) and Tabio (+99.64 ha; Figure 3 and Supplementary Table S5).
Based on the forest cover trends identified, the study localities can be divided into three groups: (i) Group 1 includes Guatavita, Soacha, Guasca, and Tabio. This group is characterized by a well defined increase in forest cover with no or very little decrease during the study period; (ii) Group 2 includes Torca, San Francisco, and Sumapaz, and is characterized by an initial increase in forest cover, followed by a decrease occurring around the 1990s and then, again, a final increase; (iii) Group 3 includes Pasquilla and El Rosal, which are characterized by an initial decrease of forest cover and a later increase that started in the 80ies.
The results of the Morphological Spatial Pattern Analysis (MSPA) are presented in Figure 5 and in the Supplementary Table S6. Overall, due to the peri-urban nature of the sampled area, the class background (i.e., non-forested areas corresponding to classes B and G) was the most abundant one in terms of percentage through time, except for El Rosal in 2007, Guatavita in 2007, and Torca from 1962 until 2004.
The MSPA category core was the second most abundant one. As shown in Figure 5, its net area share increased through time in all localities. A particularly high increase in the core area proportion was determined in Torca between 1940 and 1962 (+122%) as the most striking example here. In some localities, certain phases of decreasing core areas were found, e.g., in Pasquilla (1941–1961), Guatavita (1958–1962), El Rosal (1962–1977 and 1987–1996), San Francisco (1993–1998), and Torca (1978–1993). The proportion of islets, decreased through the time series in all the localities, with the exception of Sumapaz, where it increased slightly after the 1990s (+23%), and San Francisco as well as Tabio, where it increased markedly (+190% and +85%, respectively) in the 2000s.
The share of the connector group (loops, bridges, and branches), which includes the potential corridors for the species dispersal that connects the core areas [86], decreased noticeably through time only in Guasca and Pasquilla. The share of the edge group (perforations and edge MSPA classes), which is directly related to fragmentation [5,86,87], increased constantly through time in Guatavita and Tabio, and also slightly in Sumapaz.
Considering all the localities, the correlation analysis carried out between the area of class T (trees or high shrubs) and MSPA groups, i.e., core, islet, connectors and edge (see Supplementary Table S7 for correlation coefficients and relative p-values), showed a significant positive correlation between the forest cover and the group core (r = 0.97, p < 0.001) and a slightly positive correlation with the group edge (r = 0.59, p = 0.001), which was often was stronger at an individual locality level (e.g., El Rosal: r = 0.987, p = 0.02; San Francisco: r = 0.913, p = 0.031; Tabio r = 0.969, p = 0.031). Only two localities that showed a positive correlation between the forest cover and core (Guasca: r = 0.868, p = 0.057; Torca: r = 0.987, p = 0.002), also showed a negative correlation between the forest cover and the group connectors (Guasca: r = -0.858, p = 0.063; Torca: r = −0.904, p = 0.035). Interestingly, the localities belonging to the first and second groups defined on general forest cover trends, had overall positive values of correlation with the group core (e.g., Guatavita: r = 0.953, p = 0.012; Torca r = −0.987, p = 0.002; Sumapaz: r = 0.95, p = 0.046) and negative values with the islet (e.g., Guatavita: r = −0.924, p = 0.025; Torca: r = −0.983, p = 0.003). The localities belonging to the third group did not show relevant correlation with the core, islet or connectors, but showed a positive correlation tendency with the group edge (e.g., El Rosal).
4. Discussion
4.1. Spatial Resolution Potential of Historical Aerial Imagery and Time Coverage
Our approach carries the advantage of analyzing a longer time series than normally allowed by mere satellite data at a very high spatial resolution. It allows tracking forest cover changes at a forest fragment scale, which becomes particularly useful for discussing the actual forest species composition and structural parameters, when related to vegetation assessment in the same sites.
On the other hand, the land cover classification generated by aerial images lacks multispectral information and thus limits classification performance. We found that this is particularly true for the accuracy of the rare class B. Even though OA, UA and PA values for classes T, G and B generally fulfilled a minimum threshold of goodness, some omission errors are noticeable for the PA values for class B in some of the aerial scenes. User’s and producer’s accuracy are sensitive to a number of factors, including the number of random validation points generated and the sampling method employed [88]. However, in our case the low values are most likely due to the relatively small proportion of class B (cf. Figure 2b). In some cases, the area’s proportion of the mapped class (W), as incorporated in equations 1–5 of the accuracy calculations found in Oloffson et al. [79], was several times smaller in comparison to the other classes, which led to overall lower accuracy values for class B. Additionally, the lack of ground-truth data for past aerial scenes may have also influenced the goodness of selected training polygons. However, classes B and G were not in the focus of the present study.
Due to the unavailability of more recent, aerial photographs for our study area, our analysis stops in 2007. Our limited timeframe does not allow us to assume that general land cover trends have not changed in the more recent past (i.e., after 2007), considering that there are several urbanization and infrastructure development projects currently being planned or already implemented that may interfere with the recovery of the forests under study. For instance, there is evidence that forested areas close to El Rosal have been substantially decreasing between 2000 and 2015 [89]. Today, unfortunately, only a very little proportion of the study area in El Rosal (and contiguous Subachoque) is under some regime of protection, i.e., the nature reserve Hacienda la Laja, Subachoque, created in 2015 [90]. To the contrary, in Guasca, the suspension of mining activities in the 1990s culminating with the creation of the protected area “El Encenillo” in 2007, leading to a continuous recovery of the forest cover (Figure 3). In a few cases, the limitations to the interpretation of forest cover trends are caused by the incomplete time series of the aerial images, as in the case of Soacha, for which only three aerial scenes were available.
4.2. Individual History of Localities and Forest Cover Trends
The observed locality-specific variation in the forest cover trends appears to be connected to the individual history of each of the localities. In those rural localities that did not experience the worst effects of the country’s five decade-long armed conflict between the government, the paramilitary groups and the guerrilla [91,92], and which possess a rather ‘smooth’ topography, at least within the analyzed area, as Guasca, Tabio, Soacha, San Francisco, El Rosal, and Guatavita, the general forest cover recovery identified here probably is related to a mix of abandonment of rural practices by those seeking better economic opportunities in urban conglomerates [22] and an increase in low-density settlements of secondary homes of people living in Bogotá, who allow forest regrowth within their properties [27], jointly with the widespread implementation of protection efforts since the 1970s [24]. Within this general outline, Torca is exceptional since it is contiguous to the main urbanization of Bogotá and hosts various highly diverse and partially well conserved forest fragments in its steeper parts [41,44]. During the past century, Torca experienced a considerable decrease in agriculture and animal husbandry in favor of an urban expansion, which attracted middle- and upper-class residents that do not engage in rural activities [93]. The latter, together with both the implementation of the protected area “Bosque Oriental de Bogotá” in the 1970s [94] and the harsh topography of a large portion of this area, played a key role in regulating land use conversion. The major part of forest recovery took place in areas of low elevation close to the main motorways, which used to be cleared regularly. However, recent plans to expand the motorways [95] and to build up a massive urbanization project [96] pose new threats to recovered forest fragments, especially at low elevations, where the topography is less pronounced.
The case of Pasquilla, as the only locality in our study with an overall net forest cover loss, can be illustrative of a well populated agricultural landscape in the close vicinity of Bogotá. During the 1940s, Pasquilla became heavily populated and agriculturally exploited, due to the increasing violence in the country and the migration towards the cities [57]. This is consistent with our observations of an initial decrease in forest cover in Pasquilla, right from the 1940s, followed by a phase of slow recovery from the 1980s. Between 1995 and 2009, the main land use shifted from agriculture to animal husbandry, especially affecting the forest cover and its ecological integrity [58]. This is visible in our results by the increased area of size class G (Figure 3). The land use shifts led to an expansion of human-induced azonal páramos and the opening of forest areas for cattle grazing, which affect both the margins and the interior of forest patches, leading to the perforation and size reduction of the fragments, altering the forest structure and its regenerative potential [31,97]. Finally, the considerable recovery of forest core areas in 2006 may be directly linked to the increased protection efforts, together with an emerging environmental commitment of the local population, culminating with the creation of the protected area “Los Encenillales” in 2004 [58]. The impact of the 1940s migrations on forest cover changes is also evident in Sumapaz, which is far from the city of Bogotá. In the mountainous region of Sumapaz, and the eastern portion of the Tolima department, the violence and the armed conflict started already in 1920 and caused the displacement of the population [98]. Consistently, we found an initial increase in forested areas during the 1950s and 1960s in the Sumapaz region, which may result from the rural depopulation that brought farmers from remote areas such as Sumapaz to Pasquilla and other localities considered safer. It may be noted that our study locality in Sumapaz is outside the limits of the National Park (PNN Sumapaz) and thus is not under any protection regime.
4.3. Insights from MSPA on Forest Cover Trends
Besides the core areas, a particularly relevant MSPA class for the dynamic of secondary forest fragments is islets. These correspond to patches of forest vegetation that are potentially vulnerable to disappearance due to their shape and size (i.e., they are small and/or elongated, thin, and isolated). Islets may also act as nuclei for forest growth by serving as stepping stones for pollination and plant dispersal [99,100]. A decrease in islets alone can be either interpreted as a sign of a re-gained connectivity between fragments and the inclusion of former stepping stones into a more extended forest fragment network or as a proof of a more stringent delimitation of cultivated areas, and therefore a more extensive exploitation of the land by the cutting of standing trees within pastures. In our sample, all the localities that recorded a decrease in the class islet for the last period of the time series were also characterized by an increase in the class core. This indicates that the observed islet decrease is mostly due to their inclusion into the forest fragment network and a general restoration of connectivity. Overall, we found a general positive correlation tendency between the forest cover and the core group, and a negative correlation tendency between the forest cover and islets. This was particularly significant for Soacha and Guatavita, where the islet decrease was constant through time, and for Torca, where the decrease trend was only interrupted in the year 1993, as underlined by the positive correlation of forested area with the group core (Guatavita: r = 0.953, p = 0.012; Torca: r = 0.987, p = 0.002) and its negative correlation with the group islet (Guatavita: r = −0.924, p = 0.025; Torca: r = −0.983, p = 0.003).
In the localities with increased islet values for the last period (Sumapaz, San Francisco, and Tabio) the interpretation is more complex: in Sumapaz, the final increase in islets was accompanied by a total gain in the forest class T (+18% in 1996, Supplementary Tables S5 and S6), a slight increase in core (+6%), a stationary edge (+0%), and a slight decrease in the background (−2%) and connectors (−5%). This indicates that new forest nuclei have formed, as there is no major change in any of the other classes. In San Francisco, the increase in islets was particularly high and it was accompanied by a total gain of forest (+27% in 2007), a slight decrease in background (−13%), a little increase in core (+4%), and a marked increase in connectors (+113%) and edges (+43%). This indicates that new tree nuclei have formed and then connected to other fragments, however, the high edge value implies that cores might be broken or changed in shape and so an increased fragmentation of the main forested area is assumed here and is supported by the positive correlation between the forested area and the edge group (r = 0.913, p = 0.031). In Tabio, the increase in islet is linked to an overall forest gain (+17% in 2007, Supplementary Table S6), a decrease in core (−6%) and background (−9%), and a marked increase in connectors (+64%) and edges (+4%). This indicates the formation of new tree nuclei in previous background areas, but also a certain degree of fragmentation at the borders of the major forest fragments. This interpretation is confirmed by an increase in edges and connectors, and a decrease in core and background, which is also underlined by the strong positive correlation of forested area and the edge group (r = 0.969, p = 0.031). The mountains of Tabio are included together with other portions of our study area in the special management area “Reserva Forestal Protectora Productora de la Cuenca Alta del Río Bogotá” [101] since the 1970s. This light protection status still allows for agricultural activities and infrastructure development, inevitably resulting in forest clearing to create pastures, and thus the fragmentation of the previously continuous forest cover. However, except for Guatavita and Tabio, the other localities covered by this special management area are also under other protection figures, and the limits of the Reserva overlap with protected areas with stricter regulations. For Guatavita, the establishment of the Reserva seems to have been beneficial in promoting forest cover and islet inclusion in the main core areas, even though the positive correlation between the forest cover and the edge group for this locality may indicate fragmentation. Conversely, our findings for Tabio underscore that a mild protection regime, extensive agricultural exploitation, and infrastructure development together can hamper the protection and regeneration of forests considerably. Thus, the hazards associated with urbanization and road construction, already reported as key drivers of deforestation in the area [27,30,31,57,58], should be taken into consideration when formulating forest management strategies.
4.4. Possible Factors Influencing Forest Recovery
Our results show a significant increase in forest cover and a general recovery of forest connectors in the examined localities between the 1940s and the early 2000s. Forest regeneration on abandoned agricultural lands, by enhancing landscape connectivity, can potentially contain the ecological damage of deforestation and land degradation [53,102,103]. Restored connectivity, together with the increase in size forest fragments is essential to guarantee the freedom of movement and availability of resources to local fauna populations [104,105,106,107,108].
The overall forest recovery, first described by Etter [47] for two localities in the Bogotá high plain for the period 1940–1996, was recently confirmed for the region north of Bogotá for the years 1985–2015 [27], and for the Colombian Andes in general, for the years 2001–2010 [52]. Our study, which incorporates localities in the southern part of the Bogotá high plain and evaluates a large time scale, further supports and extends these regional evidences.
However, the identified positive trend diverges from the high deforestation rates outlined for Andean lowlands [24] or the Amazon region [109,110]. It also differs from another locality in the Colombian high Andean department of Quindío, where a reduction in forest cover was reported for the period 1954–2009 [48]. The trend of forest recovery in the hinterland of Bogotá also differs from the results from other high Andean regions, such as southern Ecuador [111,112] and southeastern Bolivia [113], which experienced continuous forest loss. Nevertheless, forest recovery was also identified in other similar high Andean systems, such as in the San Martín department, in northern Peru [114].
As observed by Hecht [21], the patterns and drivers of deforestation are likely to vary between localities due to their individual history and accessibility. Dramatic deforestation takes place mainly in economic frontier zones [21] such as the Andean lowlands, the Amazon [24,109,110] or Southern Ecuador [111,112], where population growth, the expansion of road networks, and the lack of protection favors timber extraction [112]. On the other hand, the hinterland of heavily populated cities, such as our study region, is a complex system, where the observed forest regrowth is mainly driven by rural–urban migration and population decline, eventually leading to the abandonment of rural activities [22,27,47,53]. These factors considerably contribute to forest regrowth together with the inaccessibility of steep and remote forested areas [27,47].
Even though forest cover dynamics are likely to be higher in peri-urban areas than in more remote forest fragments [27], the positive impacts of protected areas are evident in our study area, despite the proximity of the city. Conservation efforts through the establishment of protected areas appear to be effective at limiting deforestation and land-use change, as previously reported for Colombian montane forests [24,47], even without the rigorous and efficient implementation of conservation strategies in place and despite the transformation of areas inside national parks to some degree through anthropogenic activities [30].
5. Conclusions
The unique time coverage of the here employed, generally under-utilized, aerial imagery allowed us to provide a detailed reconstruction of vegetation dynamics at the landscape level, which in several cases clearly mirrors the historical changes that occurred during the occupation and exploitation of these rural areas. Forest recovery alone is expected to improve the systems’ ecological conditions, but both the land cover types prior to a transition, and the land cover established by the transition, impact the ecosystem structure and functioning (see [115,116]). Accordingly, in the continuously intervened systems this study is focused on, it is highly likely that the legacy of centuries of land use is still relevant for todays’ ecosystem remnants [117,118]. Similarly, when it comes to forest tree diversity and resilience, the effects from interventions in past centuries are likely to be relevant and noticeable even in a not-so-close future [119,120]. For this reason, generating locality-scale, longer-term information on land cover changes is key, considering that the majority of the studies focuses on broader geographical scales and employs satellite data with a shorter time-coverage. Moreover, elucidating not only the extent but also the nature of forest recovery as to its spatial configuration provides deep insights into forest fragment-related cover changes, and helps to understand the drivers and the processes shaping plant communities and the associated provision of ecosystem services [121].
Our findings of forest-recovery in the peri-urban region around Bogotá are encouraging. Nevertheless, they only apply to a limited sampling area. The aerial pictures that we used are available for all Colombia and are currently being georeferenced by the IGAC. Thus, an upscaling of the approach described in this study is possible and would be important to model the developments in adjacent administrative departments and high Andean forests ecosystems in general. This is very relevant, considering that the understanding of regional patterns of land use and land cover conversion in heavily populated high Andean systems is necessary to formulate sound land management plans that can potentially prevent broader scale, irreversible landscape degradation [113].
Supplementary Materials
The following are available online at https://www.mdpi.com/1999-4907/11/8/788/s1, Table S1: “Detailed information on study localities”, Table S2: “Accuracy indices values for each class in each locality through time series”, Table S3: “Error matrices for each locality through time series”, Figure S4: “Processing steps of the aerial imagery”, Table S5: “Forest cover extent and its changes in the study localities”, Table S6: “MSPA classes groups percent change through time series in each locality”, Table S7: “Correlation coefficients of forest cover and MSPA groups”.
Author Contributions
Conceptualization, M.C., N.C. and T.B.; data curation, M.C.; formal analysis, M.C., N.C. and G.B.; funding acquisition, T.B. and G.B.; investigation, M.C.; methodology, M.C. and N.C.; project administration, G.B.; resources, G.B.; supervision, N.C. and T.B.; validation, M.C. and N.C.; visualization, M.C. and N.C.; writing—original draft, M.C. and N.C.; writing—review and editing, M.C., N.C., T.B. and G.B. All authors have read and agreed to the published version of the manuscript.
Funding
This research was funded by the Federal Ministry of Education and Research of Germany (BMBF, ColBioDiv—01DN17006). The publication of this article was funded by the open access fund of Freie Universität Berlin.
Acknowledgments
We would like to acknowledge the help of members of the Rastrojo project at the University of Rosario and the Instituto de Investigación de Recursos Biológicos Alexander von Humboldt (IAvH) for their help and useful comments. We are also grateful for the logistic support from the members of the herbarium of the Jardín Botánico de Bogotá (JBB) during field trips. Finally, we thank Janina Wiederkehr for support in data processing and Francisco Fajardo Gutiérrez and Markus Rauchecker for the useful discussion on the interpretation of the results.
Conflicts of Interest
The authors declare no conflict of interest. The founding sponsors had no role in the design of the study; in the collection, analyses, or interpretation of data; in the writing of the manuscript, and in the decision to publish the results.
References
- Vitousek, P.M.; Mooney, H.A.; Lubchenco, J.; Melillo, J.M. Human domination of Earth’s ecosystems. Science 1997, 277, 494–499. [Google Scholar] [CrossRef] [Green Version]
- Newbold, T.; Hudson, L.N.; Hill, S.L.; Contu, S.; Lysenko, I.; Senior, R.A.; Börger, L.; Bennett, D.J.; Choimes, A.; Collen, B.; et al. Global effects of land use on local terrestrial biodiversity. Nature 2015, 520, 45–50. [Google Scholar] [CrossRef] [PubMed] [Green Version]
- Pielke, R.A. Land use and climate change. Science 1995, 310, 1625–1626. [Google Scholar] [CrossRef] [Green Version]
- Rodríguez Eraso, N.; Armenteras-Pascual, D.; Alumbreros, J.R. Land use and land cover change in the Colombian Andes: Dynamics and future scenarios. J. Land Use Sci. 2013, 8, 154–174. [Google Scholar] [CrossRef]
- Cojoc, E.I.; Postolache, C.; Olariu, B.; & Beierkuhnlein, C. Effects of anthropogenic fragmentation on primary productivity and soil carbon storage in temperate mountain grasslands. Environ. Monit. Assess. 2016, 188, 653. [Google Scholar] [CrossRef] [PubMed]
- Ziv, Y.; Davidowitz, G. When Landscape Ecology Meets Physiology: Effects of Habitat Fragmentation on Resource Allocation Trade-Offs. Front. Ecol. Evol. 2019, 7, 137. [Google Scholar] [CrossRef] [Green Version]
- Ewers, R.M.; Thorpe, S.; Didham, R.K. Synergistic interactions between edge and area effects in a heavily fragmented landscape. Ecology 2007, 88, 96–106. [Google Scholar] [CrossRef]
- Öckinger, E.; Lindborg, R.; Sjödin, N.E.; Bommarco, R. Landscape matrix modifies richness of plants and insects in grassland fragments. Ecography 2012, 35, 259–267. [Google Scholar] [CrossRef]
- Brinck, K.; Fischer, R.; Groeneveld, J.; Lehmann, S.; De Paula, M.D.; Pütz, S.; Sexton, J.O.; Song, D.; Huth, A. High resolution analysis of tropical forest fragmentation and its impact on the global carbon cycle. Nat. Commun. 2017, 8, 1–6. [Google Scholar] [CrossRef] [Green Version]
- Billings, S.A. Soil organic matter dynamics and land use change at a grassland/forest ecotone. Soil Biol. Biochem. 2006, 38, 2934–2943. [Google Scholar] [CrossRef]
- Fahrig, L. Effects of habitat fragmentation on biodiversity. Annu. Rev. Ecol. Evol. Syst 2003, 34, 487–515. [Google Scholar] [CrossRef] [Green Version]
- Hubbell, S.P. The unified neutral theory of biodiversity and biogeography. Monogr. Populat. Biol. 2001, 32, 1–375. [Google Scholar] [CrossRef]
- MacArthur, R.H.; Wilson, E.O. The Theory of Island Biogeography; Princeton University Press: Princeton, NJ, USA, 2001. [Google Scholar]
- Brooks, T.M.; Mittermeier, R.A.; Mittermeier, C.G.; Da Fonseca, G.A.; Rylands, A.B.; Konstant, W.R.; Flick, P.; Pilgrim, J.; Oldfield, S.; Magin, G.; et al. Habitat loss and extinction in the hotspots of biodiversity. Conserv. Biol. 2002, 16, 909–923. [Google Scholar] [CrossRef] [Green Version]
- Aynekulu, E.; Aerts, R.; Denich, M.; Negussie, A.; Friis, I.; Demissew, S.; Boehmer, H.J. Plant diversity and regeneration in a disturbed isolated dry Afromontane forest in northern Ethiopia. Folia Geobot. 2016, 51, 115–127. [Google Scholar] [CrossRef]
- Olden, J.D. Biotic homogenization: A new research agenda for conservation biogeography. J. Biogeogr. 2006, 33, 2027–2039. [Google Scholar] [CrossRef]
- Norden, N.; Chazdon, R.L.; Chao, A.; Jiang, Y.; Vílchez-Alvarado, B. Resilience of tropical rain forests: Tree community reassembly in secondary forests. Ecol. Lett. 2009, 12, 385–394. [Google Scholar] [CrossRef] [PubMed]
- Steinfeld, H.; Gerber, P.; Wassenaar, T.D.; Castel, V.; Rosales, M.; Rosales, M.; de Haan, C. Livestock’s Long Shadow: Environmental Issues and Options; Food & Agriculture Org: Rome, Italy, 2006. [Google Scholar]
- Wassenaar, T.; Gerber, P.; Verburg, P.H.; Rosales, M.; Ibrahim, M.; Steinfeld, H. Projecting land use changes in the Neotropics: The geography of pasture expansion into forest. Glob. Environ. Chang. 2007, 17, 86–104. [Google Scholar] [CrossRef]
- Rudel, T.K.; Defries, R.; Asner, G.P.; Laurance, W.F. Changing drivers of deforestation and new opportunities for conservation. Conserv. Biol. 2009, 23, 1396–1405. [Google Scholar] [CrossRef]
- Hecht, S. The new rurality: Globalization, peasants and the paradoxes of landscapes. Land Use Policy 2010, 27, 161–169. [Google Scholar] [CrossRef]
- Aide, T.M.; Grau, H.R. Globalization, migration, and Latin American ecosystems. Science 2004, 305, 1915. [Google Scholar] [CrossRef]
- Grau, H.R.; Aide, T.M. Globalization and Land-Use Transitions in Latin America. Ecol. Soc. 2008, 13, 16. [Google Scholar] [CrossRef] [Green Version]
- Armenteras, D.; Rodríguez, N.; Retana, J.; Morales, M. Understanding deforestation in montane and lowland forests of the Colombian Andes. Reg. Environ. Chang. 2011, 11, 693–705. [Google Scholar] [CrossRef]
- Hecht, S.B.; Kandel, S.; Gomes, I.; Cuellar, N.; Rosa, H. Globalization, forest resurgence, and environmental politics in El Salvador. World Dev. 2006, 34, 308–323. [Google Scholar] [CrossRef]
- Grau, H.R.; Aide, T.M.; Zimmerman, J.K.; Thomlinson, J.R.; Helmer, E.; Zou, X. The ecological consequences of socioeconomic and land-use changes in postagriculture Puerto Rico. BioScience 2003, 53, 1159–1168. [Google Scholar] [CrossRef]
- Rubiano, K.; Clerici, N.; Norden, N.; Etter, A. Secondary forest and shrubland dynamics in a highly transformed landscape in the Northern Andes of Colombia (1985–2015). Forests 2017, 8, 216. [Google Scholar] [CrossRef] [Green Version]
- Cleef, A.M. Origen, evolución, estructura y diversidad biológica de la alta montaña colombiana. In Visión socioecosistémica de los páramos y la alta montaña colombiana: Memorias del proceso de definición de criterios para la delimitación de páramos; Cortés-Duque, J., Pinzón, C.E.S., Suárez Mejía, A.P., Eds.; Instituto de Investigación de Recursos Biológicos Alexander von Humboldt: Bogotà, Colombia, 2013; pp. 3–21. [Google Scholar]
- Myers, N.; Mittermeier, R.A.; Mittermeier, C.G.; Da Fonseca, G.A.; Kent, J. Biodiversity hotspots for conservation priorities. Nature 2000, 403, 853. [Google Scholar] [CrossRef]
- Armenteras, D.; Gast, F.; Villareal, H. Andean forest fragmentation and the representativeness of protected natural areas in the eastern Andes, Colombia. Biol. Conserv. 2003, 113, 245–256. [Google Scholar] [CrossRef]
- Etter, A.; Villa, L.A. Andean forests and farming systems in part of the Eastern Cordillera (Colombia). Mt. Res. Dev. 2000, 20, 236–246. [Google Scholar] [CrossRef] [Green Version]
- Balthazar, V.; Vanacker, V.; Molina, A.; Lambin, E.F. Impacts of forest cover change on ecosystem services in high Andean mountains. Ecol. Indic. 2015, 48, 63–75. [Google Scholar] [CrossRef]
- Etter, A.; McAlpine, C.; Wilson, K.; Phinn, S.; Possingham, H. Regional patterns of agricultural land use and deforestation in Colombia. Agr. Ecosyst. Environ. 2006, 114, 369–386. [Google Scholar] [CrossRef]
- Cleef, A.M. The vegetation of the páramos of the Colombian Cordillera Oriental. Mededelingen van het Botanisch Museum en Herbarium van de Rijksuniversiteit te Utrecht 1981, 481, 1–320. [Google Scholar]
- Sturm, H.; Rangel-Ch., O. Ecología de los páramos andinos: Una visión preliminar integrada; Universidad Nacional de Colombia: Bogotà, Colombia, 1985. [Google Scholar]
- Van der Hammen, T. Plan ambiental de la cuenca alta del río Bogotá: Análisis y orientaciones para el ordenamiento territorial; Corporación Autónoma Regional de Cundinamarca: Bogotá, Colombia, 1998. [Google Scholar]
- Van der Hammen, T. La Cordillera Oriental Colombiana Transecto Sumapaz vol. 7; J. Cramer: Berlin, Germany, 2008. [Google Scholar]
- Cortés, S. La vegetación boscosa y arbustiva de la cuenca alta del río Bogotá/Forest and shrub vegetation of the upper basin of the Bogotá river. In La Cordillera Oriental Colombiana Transecto Sumapaz vol. 8; J. Cramer: Berlin, Germany, 2008. [Google Scholar]
- Acuña Cabanzo, A. Potencial de regeneración de rastrojos y bosques secundarios en la sabana de Bogotá. Bachelor’s Thesis, Pontificia Universidad Javeriana: Bogotá, Colombia, 2013. [Google Scholar]
- Muñoz-Camacho, J.C.; Hurtado, A.B.; Norden, N. Composición florística de tres fragmentos de bosque altoandino en los alrededores de la sabana de Bogotá: Parcelas permanentes del Proyecto Rastrojos; Instituto de Investigación de Recursos Biológicos Alexander von Humboldt: Bogotá, Colombia, 2017. [Google Scholar]
- Hurtado-Martilletti, A.B.; Echeverry-Galvis, M.A.; Salgado-Negret, B.; Muñoz, J.C.; Posada, J.M.; Norden, N. No trace of floristic homogenization in peri-urban Andean secondary forests despite high anthropogenic transformation. J. Ecol. under review.
- Rodríguez-Alarcón, S.; Rodríguez-Eraso, N.; Pineda-Rincón, I.; & López-Camacho, R. Effects of fragmentation on functional diversity associated with aboveground biomass in a high Andean forest in Colombia. Landsc. Ecol. 2018, 33, 1851–1864. [Google Scholar] [CrossRef]
- Clerici, N.; Cote-Navarro, F.; Escobedo, F.J.; Rubiano, K.; Villegas, J.C. Spatio-temporal and cumulative effects of land use-land cover and climate change on two ecosystem services in the Colombian Andes. Sci. Total Environ. 2019, 685, 1181–1192. [Google Scholar] [CrossRef] [PubMed]
- Calbi, M.; Fajardo-Gutiérrez, F.; Posada-Hostettler, J.; Lücking, R.; Brokamp, G.; Borsch, T. Seeing the wood despite the trees: Disentangling the impact of human disturbance on plant diversity, community structure, and standing biomass in fragmented high Andean forests. Ecol. Evol. under review.
- Morgan, J.L.; Gergel, S.E. Quantifying historic landscape heterogeneity from aerial photographs using object-based analysis. Landsc. Ecol. 2010, 25, 985–998. [Google Scholar] [CrossRef]
- Morgan, J.L.; Gergel, S.E. Automated analysis of aerial photographs and potential for historic forest mapping. Can. J. For. Res. 2013, 43, 699–710. [Google Scholar] [CrossRef]
- Etter, A. Multitemporal analysis (1940–1996) of land cover changes in the southwestern Bogotá highplain (Colombia). Landscape Urban Plan. 2002, 59, 147–158. [Google Scholar]
- Quintero-Gallego, M.E.; Quintero-Angel, M.; Vila-Ortega, J.J. Exploring land use/land cover change and drivers in Andean mountains in Colombia: A case in rural Quindío. Sci. Total Environ. 2018, 634, 1288–1299. [Google Scholar] [CrossRef]
- Lydersen, J.M.; Collins, B.M. Change in vegetation patterns over a large forested landscape based on historical and contemporary aerial photography. Ecosystems 2018, 21, 1348–1363. [Google Scholar] [CrossRef]
- Lindborg, R.; Eriksson, O. Historical landscape connectivity affects present plant species diversity. Ecology 2004, 85, 1840–1845. [Google Scholar] [CrossRef]
- Anselm, N.; Brokamp, G.; Schütt, B. Assessment of Land Cover Change in Peri-Urban High Andean Environments South of Bogotá, Colombia. Land 2018, 7, 75. [Google Scholar] [CrossRef] [Green Version]
- Sánchez-Cuervo, A.M.; Aide, T.M.; Clark, M.L.; Etter, A. Land cover change in Colombia: Surprising forest recovery trends between 2001 and 2010. PLoS ONE 2012, 7, e43943. [Google Scholar] [CrossRef] [PubMed] [Green Version]
- Sánchez-Cuervo, A.M.; Aide, T.M. Consequences of the armed conflict, forced human displacement, and land abandonment on forest cover change in Colombia: A multi-scaled analysis. Ecosystems 2013, 16, 1052–1070. [Google Scholar] [CrossRef]
- Vanwalleghem, T.; Gómez, J.A.; Amate, J.I.; de Molina, M.G.; Vanderlinden, K.; Guzmán, G.; Laguna, A.; Giráldez, J.V. Impact of historical land use and soil management change on soil erosion and agricultural sustainability during the Anthropocene. Anthropocene 2017, 17, 13–29. [Google Scholar] [CrossRef]
- Waldner, L.S. The kudzu connection: Exploring the link between land use and invasive species. Land Use Policy 2008, 25, 399–409. [Google Scholar] [CrossRef]
- Cortés, S.P.; Van der Hammen, T.; & Rangel-Ch, J.O. Comunidades vegetales y patrones de degradacion y sucesion en la vegetacion de los cerros occidentales de Chiacundinamarca-Colombia. Revista Acad. Colomb. Ci. Exact. 1999, 23, 529–555. [Google Scholar]
- Julio, M.Á. Ciudad Bolívar: Gestión ambiente y territorio. Bachelor’s Thesis, Universidad Nacional de Colombia, Bogotá, Colombia, 2003. [Google Scholar]
- Hernández-Gómez, A.; Rojas-Robles, R.; Sánchez-Calderón, F.V. Cambios en el uso del suelo asociados a la expansión urbana y la planeación en el corregimiento de Pasquilla, zona rural de Bogotá (Colombia). Cuad. Geogr. Rev. Colomb. Geogr. 2013, 22, 257–271. [Google Scholar] [CrossRef] [Green Version]
- QGIS Development Team. QGIS Geographic Information System, Version 2.18.14-Las Palmas. Open Source Geospatial Foundation. 2017. Available online: http://www.qgis.org/ (accessed on 20 January 2018).
- Willhauck, G.; Schneider, T.; De Kok, R.; Ammer, U. Comparison of object oriented classification techniques and standard image analysis for the use of change detection between SPOT multispectral satellite images and aerial photos. In Proceedings of XIX ISPRS Congress; IAPRS: Amsterdam, Netherlands, 2000; Volume 33, pp. 35–42. [Google Scholar]
- Varga, K.; Szabó, S.; Szabó, G.; Dévai, G.; Tóthmérész, B. Improved land cover mapping using aerial photographs and satellite images. Open Geosci. 2015, 7. [Google Scholar] [CrossRef] [Green Version]
- Eitzel, M.V.; Kelly, M.; Dronova, I.; Valachovic, Y.; Quinn-Davidson, L.; Solera, J.; de Valpine, P. Challenges and opportunities in synthesizing historical geospatial data using statistical models. Ecol. Inform. 2016, 31, 100–111. [Google Scholar] [CrossRef] [Green Version]
- Harb Rabia, A.; Terribile, F. Semi-automated classification of gray scale aerial photographs using geographic object based image analysis (GEOBIA) technique. In EGU General Assembly Conference Abstracts; EGU General Assembly: Vienna, Austria, 2013; Volume 15. [Google Scholar]
- Blaschke, T.; Burnett, C.; Pekkarinen, A. Image segmentation methods for object-based analysis and classification. In Remote Sensing Image Analysis: Including the Spatial Domain; Springer: Dordrecht, Germany, 2004; pp. 211–236. [Google Scholar]
- Zvoleff, A. Package ‘glcm’. 2019. Available online: https://CRAN.R-project.org/package=glcm (accessed on 10 March 2019).
- RStudio Team. RStudio: Integrated Development for R; RStudio, Inc.: Boston, MA, USA, 2016; Available online: http://www.rstudio.com/ (accessed on 20 January 2018).
- Huang, Y.; Yue, A.; Wei, S.; Li, D.; Luo, M.; Jiang, Y.; Zhang, C. Texture feature extraction for land-cover classification of remote sensing data in land consolidation district using semi-variogram analysis. WSEAS Trans. Comput. 2008, 7, 857–866. [Google Scholar]
- Wen, C.; Zhang, Y.; Deng, K. Urban area classification in high resolution SAR based on texture features. In Proceedings of the ISPRS 2009 Congress, Beijing, China, 14–16 September 2009; Zhang, J., Li, Z., Cheng, P., Yan, Q., Eds.; ISPRS: Sydney, Australia, 2009; pp. 281–285. [Google Scholar]
- Hall-Beyer, M. GLCM texture: A tutorial. National Council on Geographic Information and Analysis Remote Sensing Core Curriculum v.3. 2000. Available online: https://ojskrede.github.io/inf4300/additional_resources/uc_calgary_glcm_tutorial.pdf (accessed on 3 March 2019).
- Adams, R.; Bischof, L. Seeded region growing. IEEE T. Pattern Anal. 1994, 16, 641–647. [Google Scholar] [CrossRef] [Green Version]
- Conrad, O.; Bechtel, B.; Bock, M.; Dietrich, H.; Fischer, E.; Gerlitz, L.M.; Wehberg, J.; Wichmann, V.; Böhner, J. System for Automated Geoscientific Analyses (SAGA) v.2.1.4. Geosci. Model. Dev. 2015, 8, 1991–2007. [Google Scholar] [CrossRef] [Green Version]
- Blaschke, T. Object based image analysis for remote sensing. ISPRS J. Photogramm. 2010, 65, 2–16. [Google Scholar] [CrossRef] [Green Version]
- Radoux, J.; Bogaert, P. Accounting for the area of polygon sampling units for the prediction of primary accuracy assessment indices. Remot. Sens Environ. 2014, 142, 9–19. [Google Scholar] [CrossRef]
- Franklin, J.; Rogan, J.; Phinn, S.R.; Woodcock, C.E. Rationale and conceptual framework for classification approaches to assess forest resources and properties. In Remote Sensing of Forest Environments; Springer: Boston, MA, USA, 2003; pp. 279–300. [Google Scholar]
- Stehman, S.V. Sampling designs for accuracy assessment of land cover. Int. J. Remote. Sens. 2009, 30, 5243–5272. [Google Scholar] [CrossRef]
- Radoux, J.; Bogaert, P. Good practices for object-based accuracy assessment. Remote Sens. 2017, 9, 646. [Google Scholar] [CrossRef] [Green Version]
- Stehman, S.V.; Wickham, J.D. Pixels, blocks of pixels, and polygons: Choosing a spatial unit for thematic accuracy assessment. Remote Sens. Environ. 2011, 115, 3044–3055. [Google Scholar] [CrossRef]
- Olofsson, P.; Foody, G.M.; Herold, M.; Stehman, S.V.; Woodcock, C.E.; Wulder, M.A. Good practices for estimating area and assessing accuracy of land change. Remote Sens. Environ. 2014, 148, 42–57. [Google Scholar] [CrossRef]
- Olofsson, P.; Foody, G.M.; Stehman, S.V.; Woodcock, C.E. Making better use of accuracy data in land change studies: Estimating accuracy and area and quantifying uncertainty using stratified estimation. Remote Sens. Environ. 2013, 129, 122–131. [Google Scholar] [CrossRef]
- McGarigal, K. FRAGSTATS: Spatial Pattern Analysis Program for Quantifying Landscape Structure; US Department of Agriculture, Forest Service, Pacific Northwest Research Station: Portland, OR, USA, 1995.
- Kindlmann, P.; Burel, F. Connectivity measures: A review. Landsc. Ecol. 2008, 23, 879–890. [Google Scholar] [CrossRef] [Green Version]
- Vogt, P.; Riitters, K.H.; Estreguil, C.; Kozak, J.; Wade, T.G.; Wickham, J.D. Mapping spatial patterns with morphological image processing. Landsc. Ecol. 2007, 22, 171–177. [Google Scholar] [CrossRef]
- Soille, P.; Vogt, P. Morphological segmentation of binary patterns. Pattern Recognit. Lett. 2009, 30, 456–459. [Google Scholar] [CrossRef]
- Vogt, P.; Riitters, K. GuidosToolbox: Universal digital image object analysis. Eur. J. Remote Sens. 2017, 50, 352–361. [Google Scholar] [CrossRef]
- Kang, S.; Choi, W. Forest cover changes in North Korea since the 1980s. Reg. Environ. Chang. 2014, 14, 347–354. [Google Scholar] [CrossRef] [Green Version]
- Vogt, P.; Ferrari, J.R.; Lookingbill, T.R.; Gardner, R.H.; Riitters, K.H.; Ostapowicz, K. Mapping functional connectivity. Ecolo. Indic. 2009, 9, 64–71. [Google Scholar] [CrossRef]
- De Paula, M.D.; Groeneveld, J.; Huth, A. The extent of edge effects in fragmented landscapes: Insights from satellite measurements of tree cover. Ecol. Indic. 2016, 69, 196–204. [Google Scholar] [CrossRef]
- Araya, Y.H.; Cabral, P. Analysis and modeling of urban land cover change in Setúbal and Sesimbra, Portugal. Remote Sens. 2010, 2, 1549–1563. [Google Scholar] [CrossRef] [Green Version]
- Garcia Guerrero, D.A.; Bejarano Rojas, G.A. Análisis de Cambios de Usos y Coberturas del Suelo en los Municipios El Rosal y Subachoque. Bachelor’s Thesis, Universidad Distrital, Bogotá, Colombia, 2016. [Google Scholar]
- RUNAP. 2020. Available online: http://runap.parquesnacionales.gov.co/ (accessed on 20 January 2020).
- Dinámica Reciente de la Confrontación Armada en Cundinamarca. Available online: http://2014.derechoshumanos.gov.co/Observatorio/publicaciones/Paginas/estudiosregionales.aspx (accessed on 24 June 2020).
- Panorama Actual de la Región del Sumapaz. Available online: http://2014.derechoshumanos.gov.co/Observatorio/publicaciones/Paginas/estudiosregionales.aspx (accessed on 24 June 2020).
- Benavides Escobar, M.C. Una mirada a la gentrificación. El caso Bogotá. Ph.D. Thesis, Universidad Nacional de Colombia, Bogotá, Colombia, 2017. [Google Scholar]
- Cerrosorientales.com. Available online: https://cerrosorientales.com/cronologia/ (accessed on 20 January 2020).
- El Tiempo. 2018. Available online: https://www.eltiempo.com/bogota/comienza-la-ampliacion-de-la-autopista-norte-y-la-carrera-septima-213586 (accessed on 20 January 2020).
- El Tiempo. 2018. Available online: https://www.eltiempo.com/bogota/como-sera-el-proyecto-lagos-de-torca-de-bogota-246476 (accessed on 20 January 2020).
- Forman, R.T. Land Mosaics: The Ecology of Landscapes and Regions 1995; Cambridge University Press: Cambridge, MA, USA, 2014; p. 217. [Google Scholar]
- Cadavid, E. Historia de la Guerrilla en Colombia. Universidad Federal de Juiz de Fora. Available online: www.ecsbdefesa.com.br/defesa/fts/HGC.pdf (accessed on 20 January 2020).
- Latorre, L.F.L.; Arévalo, H.F.L. Comunidad de mamíferos no voladores en un área periurbana andina, Cundinamarca, Colombia. Acta Biol. Colomb. 2015, 20. [Google Scholar] [CrossRef]
- Da Luz, N.B.; Garrastazu, M.C.; Doetzer Rosot, M.A.; Maran, J.C.; de Oliveira, Y.M.M.; Franciscon, L.; Cardoso, D.J.; de Freitas, J.V. Brazilian National Forest Inventory-a landscape scale approach to monitoring and assessing forested landscapes. Brazil. J. For. Res. 2018, 38. [Google Scholar] [CrossRef]
- El Espectador. 2014. Available online: https://www.elespectador.com/noticias/bogota/reduccion-de-reserva-de-cuenca-alta-del-rio-bogota-articulo-473661 (accessed on 22 January 2020).
- Guariguata, M.R.; Ostertag, R. Neotropical secondary forest succession: Changes in structural and functional characteristics. For. Ecol. Manag. 2001, 148, 185–206. [Google Scholar] [CrossRef]
- Chazdon, R.L. Beyond deforestation: Restoring forests and ecosystem services on degraded lands. Science 2008, 320, 1458–1460. [Google Scholar] [CrossRef] [PubMed] [Green Version]
- Bierregaard, R.O.; Lovejoy, T.E.; Kapos, V.; dos Santos, A.A.; Huntchings, R.W. The biological dynamics of tropic rainforest fragments: A prospective comparison of fragments and continuous forest. Bioscience 1992, 42, 859–866. [Google Scholar] [CrossRef]
- Dunning, J.; Danielson, B.; Pulliam, H. Ecological processes that affect populations in complex landscapes. Oikos 1992, 65, 169–175. [Google Scholar] [CrossRef] [Green Version]
- Ferraz, G.; Nichols, J.D.; Hines, J.E.; Stouffer, P.C.; Bierregaard, R.O.; Lovejoy, T.E. A large scale deforestation experiment: Effects of patch area and isolation on Amazon birds. Science 2007, 315, 238–240. [Google Scholar] [CrossRef] [Green Version]
- Aubad, J.; Aragón, P.; Rodríguez, M.A. Human access and landscape structure effects on Andean forest bird richness. Acta Oecol. 2010, 36, 396–402. [Google Scholar] [CrossRef]
- Tinoco, B.A.; Astudillo, P.X.; Latta, S.C.; Strubbe, D.; Graham, C.H. Influence of patch factors and connectivity on the avifauna of fragmented Polylepis forest in the Ecuadorian Andes. Biotropica 2013, 45, 602–611. [Google Scholar] [CrossRef]
- Armenteras, D.; Rudas, G.; Rodriguez, N.; Sua, S.; Romero, M. Patterns and causes of deforestation in the Colombian Amazon. Ecol. Indic. 2006, 6, 353–368. [Google Scholar] [CrossRef]
- Etter, A.; McAlpine, C.; Phinn, S.; Pullar, D.; Possingham, H. Characterizing a tropical deforestation wave: A dynamic spatial analysis of a deforestation hotspot in the Colombian Amazon. Global Change Biol. 2006, 12, 1409–1420. [Google Scholar] [CrossRef]
- Curatola Fernández, G.F.; Obermeier, W.A.; Gerique, A.; López Sandoval, M.F.; Lehnert, L.W.; Thies, B.; Bendix, J. Land cover change in the Andes of Southern Ecuador—Patterns and drivers. Remote Sens. 2015, 7, 2509–2542. [Google Scholar] [CrossRef] [Green Version]
- Tapia-Armijos, M.F.; Homeier, J.; Espinosa, C.I.; Leuschner, C.; de la Cruz, M. Deforestation and forest fragmentation in South Ecuador since the 1970s–losing a hotspot of biodiversity. PLoS ONE 2015, 10, e0133701. [Google Scholar] [CrossRef] [PubMed] [Green Version]
- Brandt, J.S.; Townsend, P.A. Land use–land cover conversion, regeneration and degradation in the high elevation Bolivian Andes. Landsc. Ecol. 2006, 21, 607–623. [Google Scholar] [CrossRef]
- Kintz, D.B.; Young, K.R.; Crews-Meyer, K.A. Implications of land use/land cover change in the buffer zone of a national park in the tropical Andes. Environ. Manag. 2006, 38, 238–252. [Google Scholar] [CrossRef] [PubMed]
- Farley, K. Grasslands to tree plantations: Forest transition in the Andes of Ecuador. Ann. Assoc. Am. Geogr. 2007, 97, 755–771. [Google Scholar] [CrossRef]
- Hall, J.M.; Van Holt, T.; Daniels, A.E.; Balthazar, V.; Lambin, E.F. Trade-offs between tree cover, carbon storage and floristic biodiversity in reforesting landscapes. Landsc. Ecol. 2012, 27, 1135–1147. [Google Scholar] [CrossRef]
- Foster, D.; Swanson, F.; Aber, J.; Burke, I.; Brokaw, N.; Tilman, D.; Knapp, A. The importance of land-use legacies to ecology and conservation. BioScience 2003, 53, 77–88. [Google Scholar] [CrossRef] [Green Version]
- Bürgi, M.; Östlund, L.; Mladenoff, D.J. Legacy effects of human land use: Ecosystems as time-lagged systems. Ecosystems 2017, 20, 94–103. [Google Scholar] [CrossRef] [Green Version]
- Flinn, K.M.; Marks, P.L. Agricultural legacies in forest environments: Tree communities, soil properties, and light availability. Ecol.l Appl. 2007, 17, 452–463. [Google Scholar] [CrossRef]
- Comita, L.S.; Thompson, J.; Uriarte, M.; Jonckheere, I.; Canham, C.D.; Zimmerman, J.K. Interactive effects of land use history and natural disturbance on seedling dynamics in a subtropical forest. Ecol. Appl. 2010, 20, 1270–1284. [Google Scholar] [CrossRef] [Green Version]
- Eigenbrod, F. Redefining landscape structure for ecosystem services. Curr. Landsc. Ecol. Rep. 2016, 1, 80–86. [Google Scholar] [CrossRef] [Green Version]
Figure 1.
Study localities in the hinterland of Bogotá, in Cundinamarca department and Bogotá D.C., Colombia. Small map top left: Colombia; lower left: Cundinamarca department and Bogotá D.C. in Colombia. Cited protected areas (Cited PAs) in Legend refers to the reserves/natural parks cited and discussed in the text. Bogotá D.C. boundaries are outlined in blue, and Cundinamarca department borders are outlined in yellow.

Figure 2.
Example of the applied workflow (using data from the locality Guasca, 1985): (a) georeferenced, clipped, and resampled greyscale aerial photo; (b) derived land cover classification map (T = trees, high shrubs; G = grass, cultivated fields, and low shrubs; B = bare ground/built-up); (c) forest/non-forest binary raster (input for the Morphological Spatial Pattern Analysis, MSPA); (d) resulting map depicting MSPA classes.

Figure 3.
Forest cover change in the study localities (1940–2007). The distinguished groups of localities according to the general forest cover trend through time are marked with corresponding numbers: (1) well defined increase in forest cover, with no or very little decrease during the study period; (2) initial increase in forest cover, followed by a decrease around the 1990s and then, again, a final increase; (3) initial decrease in forest cover and then, an increase around 1980. B = bare ground/built up (including main and secondary roads, houses, and bare fields); G = grass/cultivated fields (including areas with low shrubs), and T = trees and tall shrubs (forest cover).
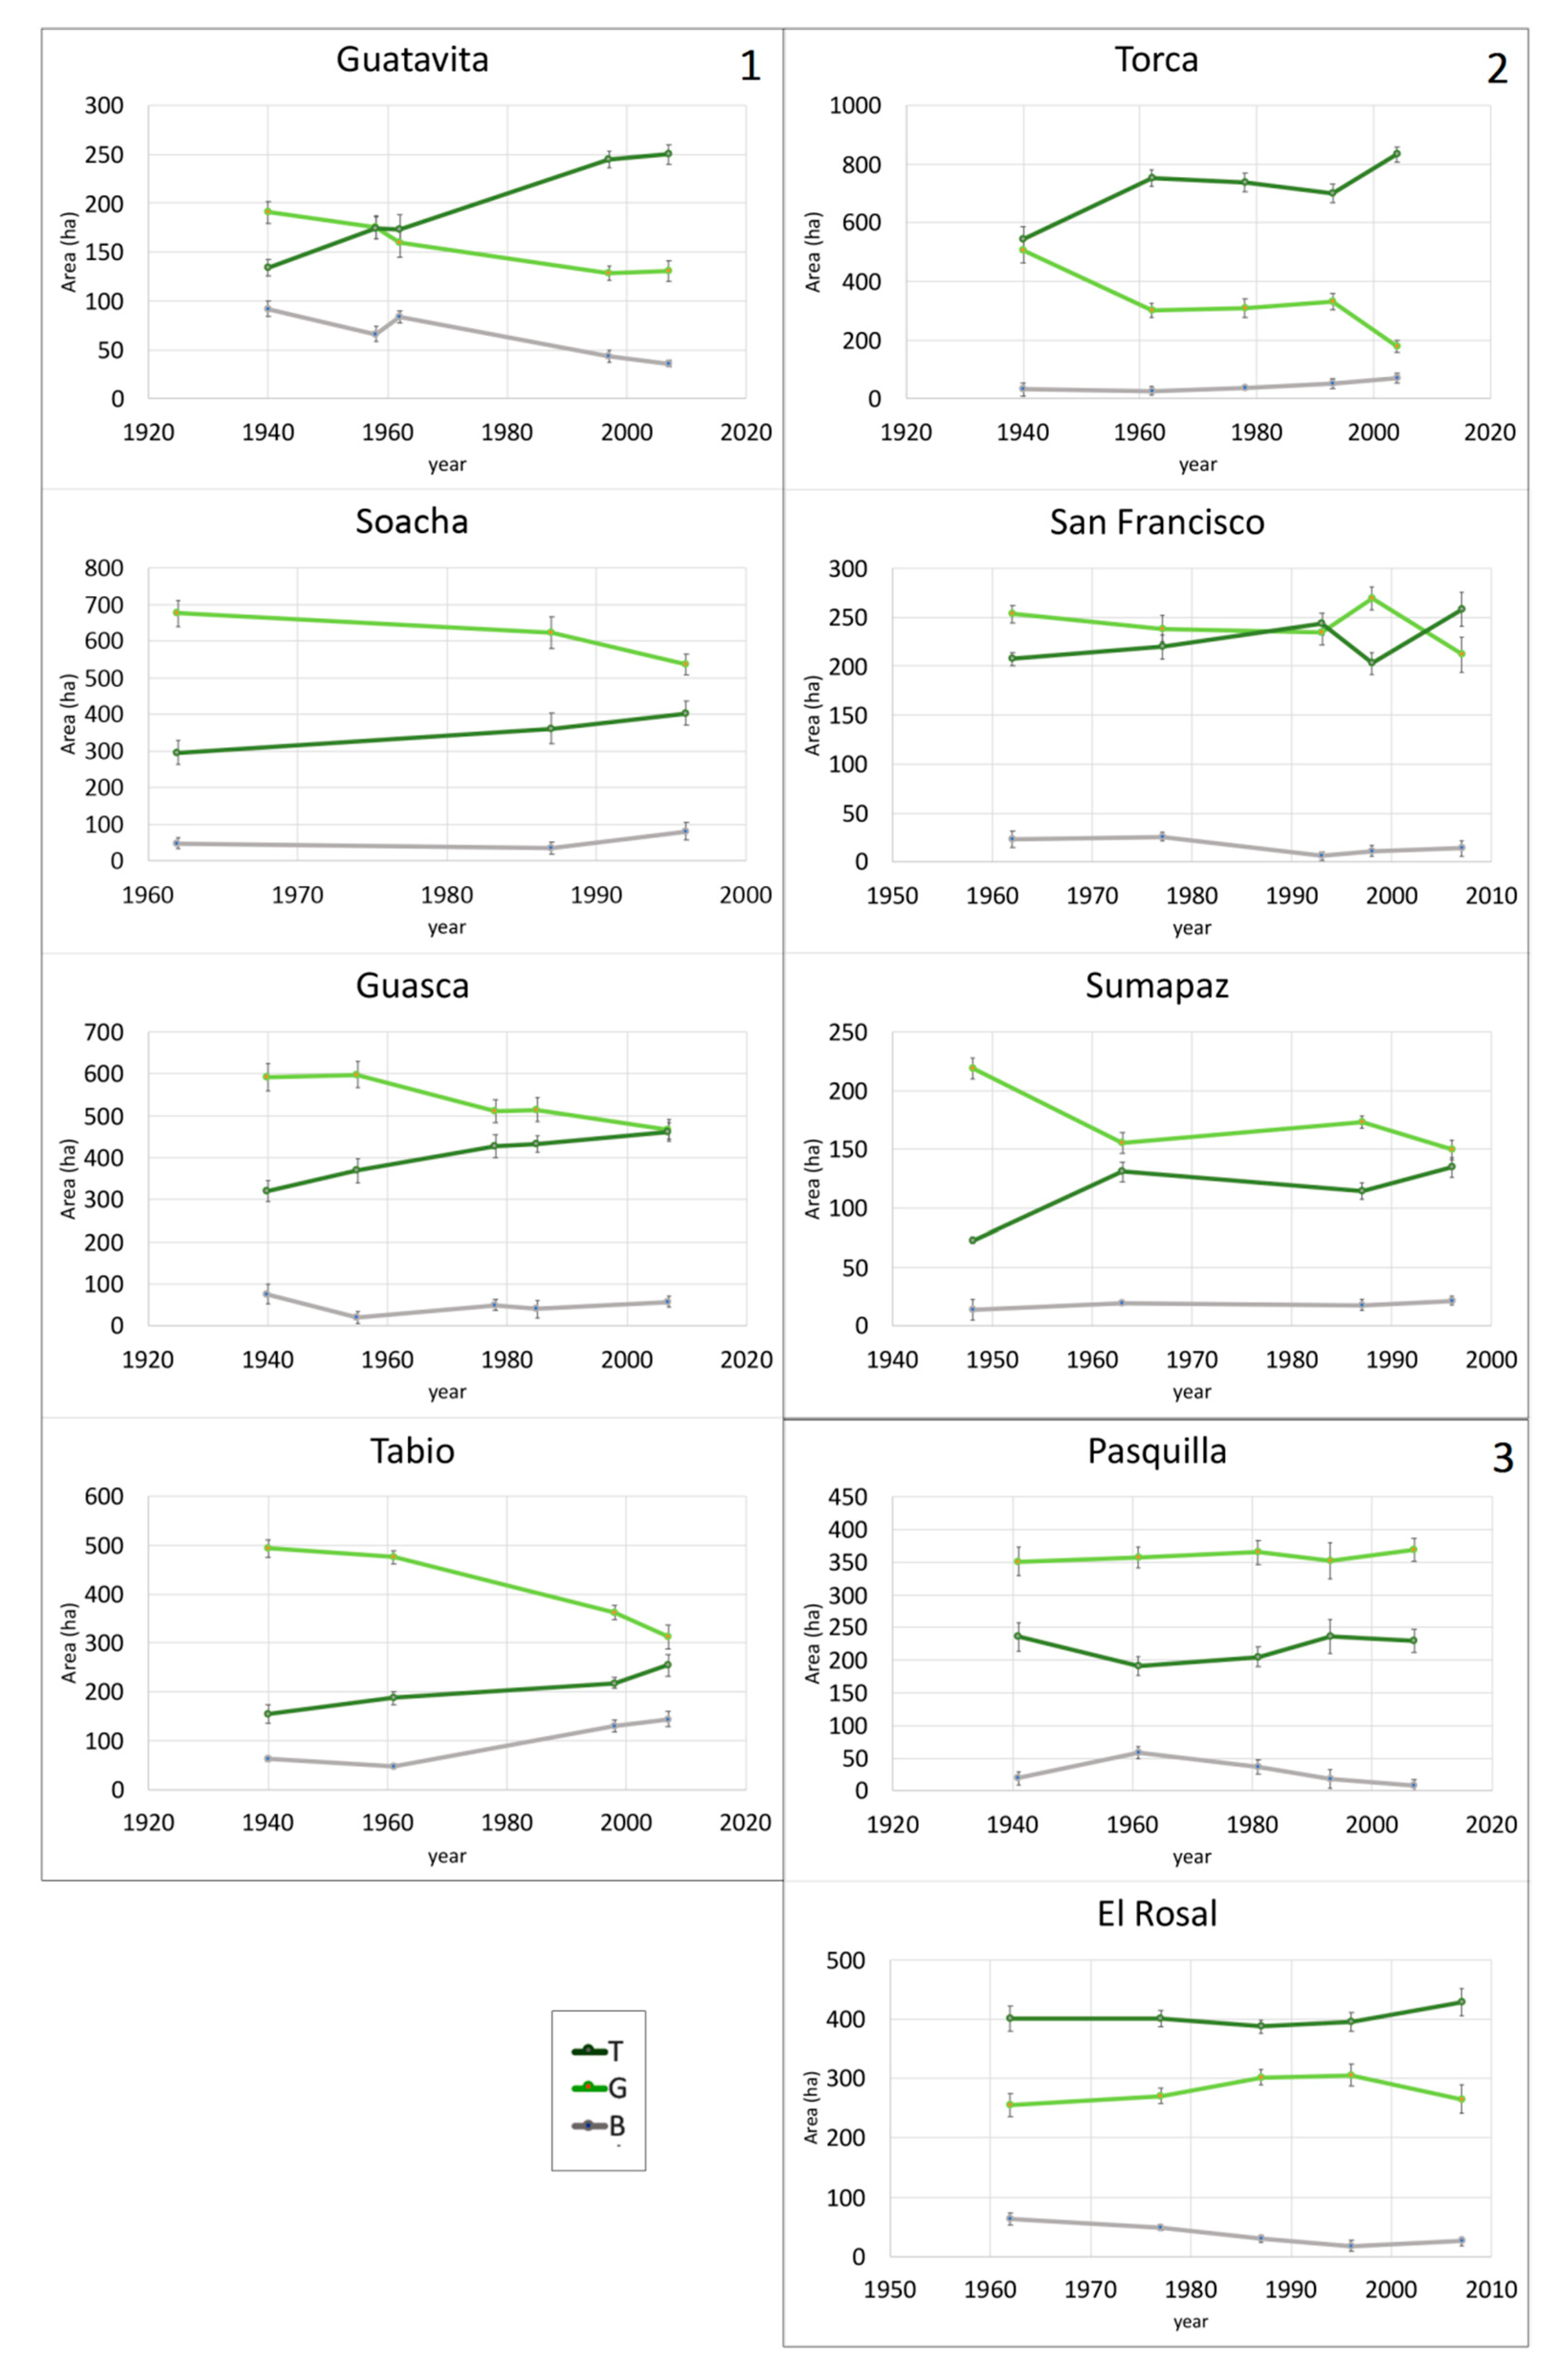
Figure 4.
Map series depicting the land cover change in the locality Torca between 1940 and 2004: (a) 1940, (b) 1962, (c) 1978, (d) 1993, (e) 2004.
Figure 4.
Map series depicting the land cover change in the locality Torca between 1940 and 2004: (a) 1940, (b) 1962, (c) 1978, (d) 1993, (e) 2004.
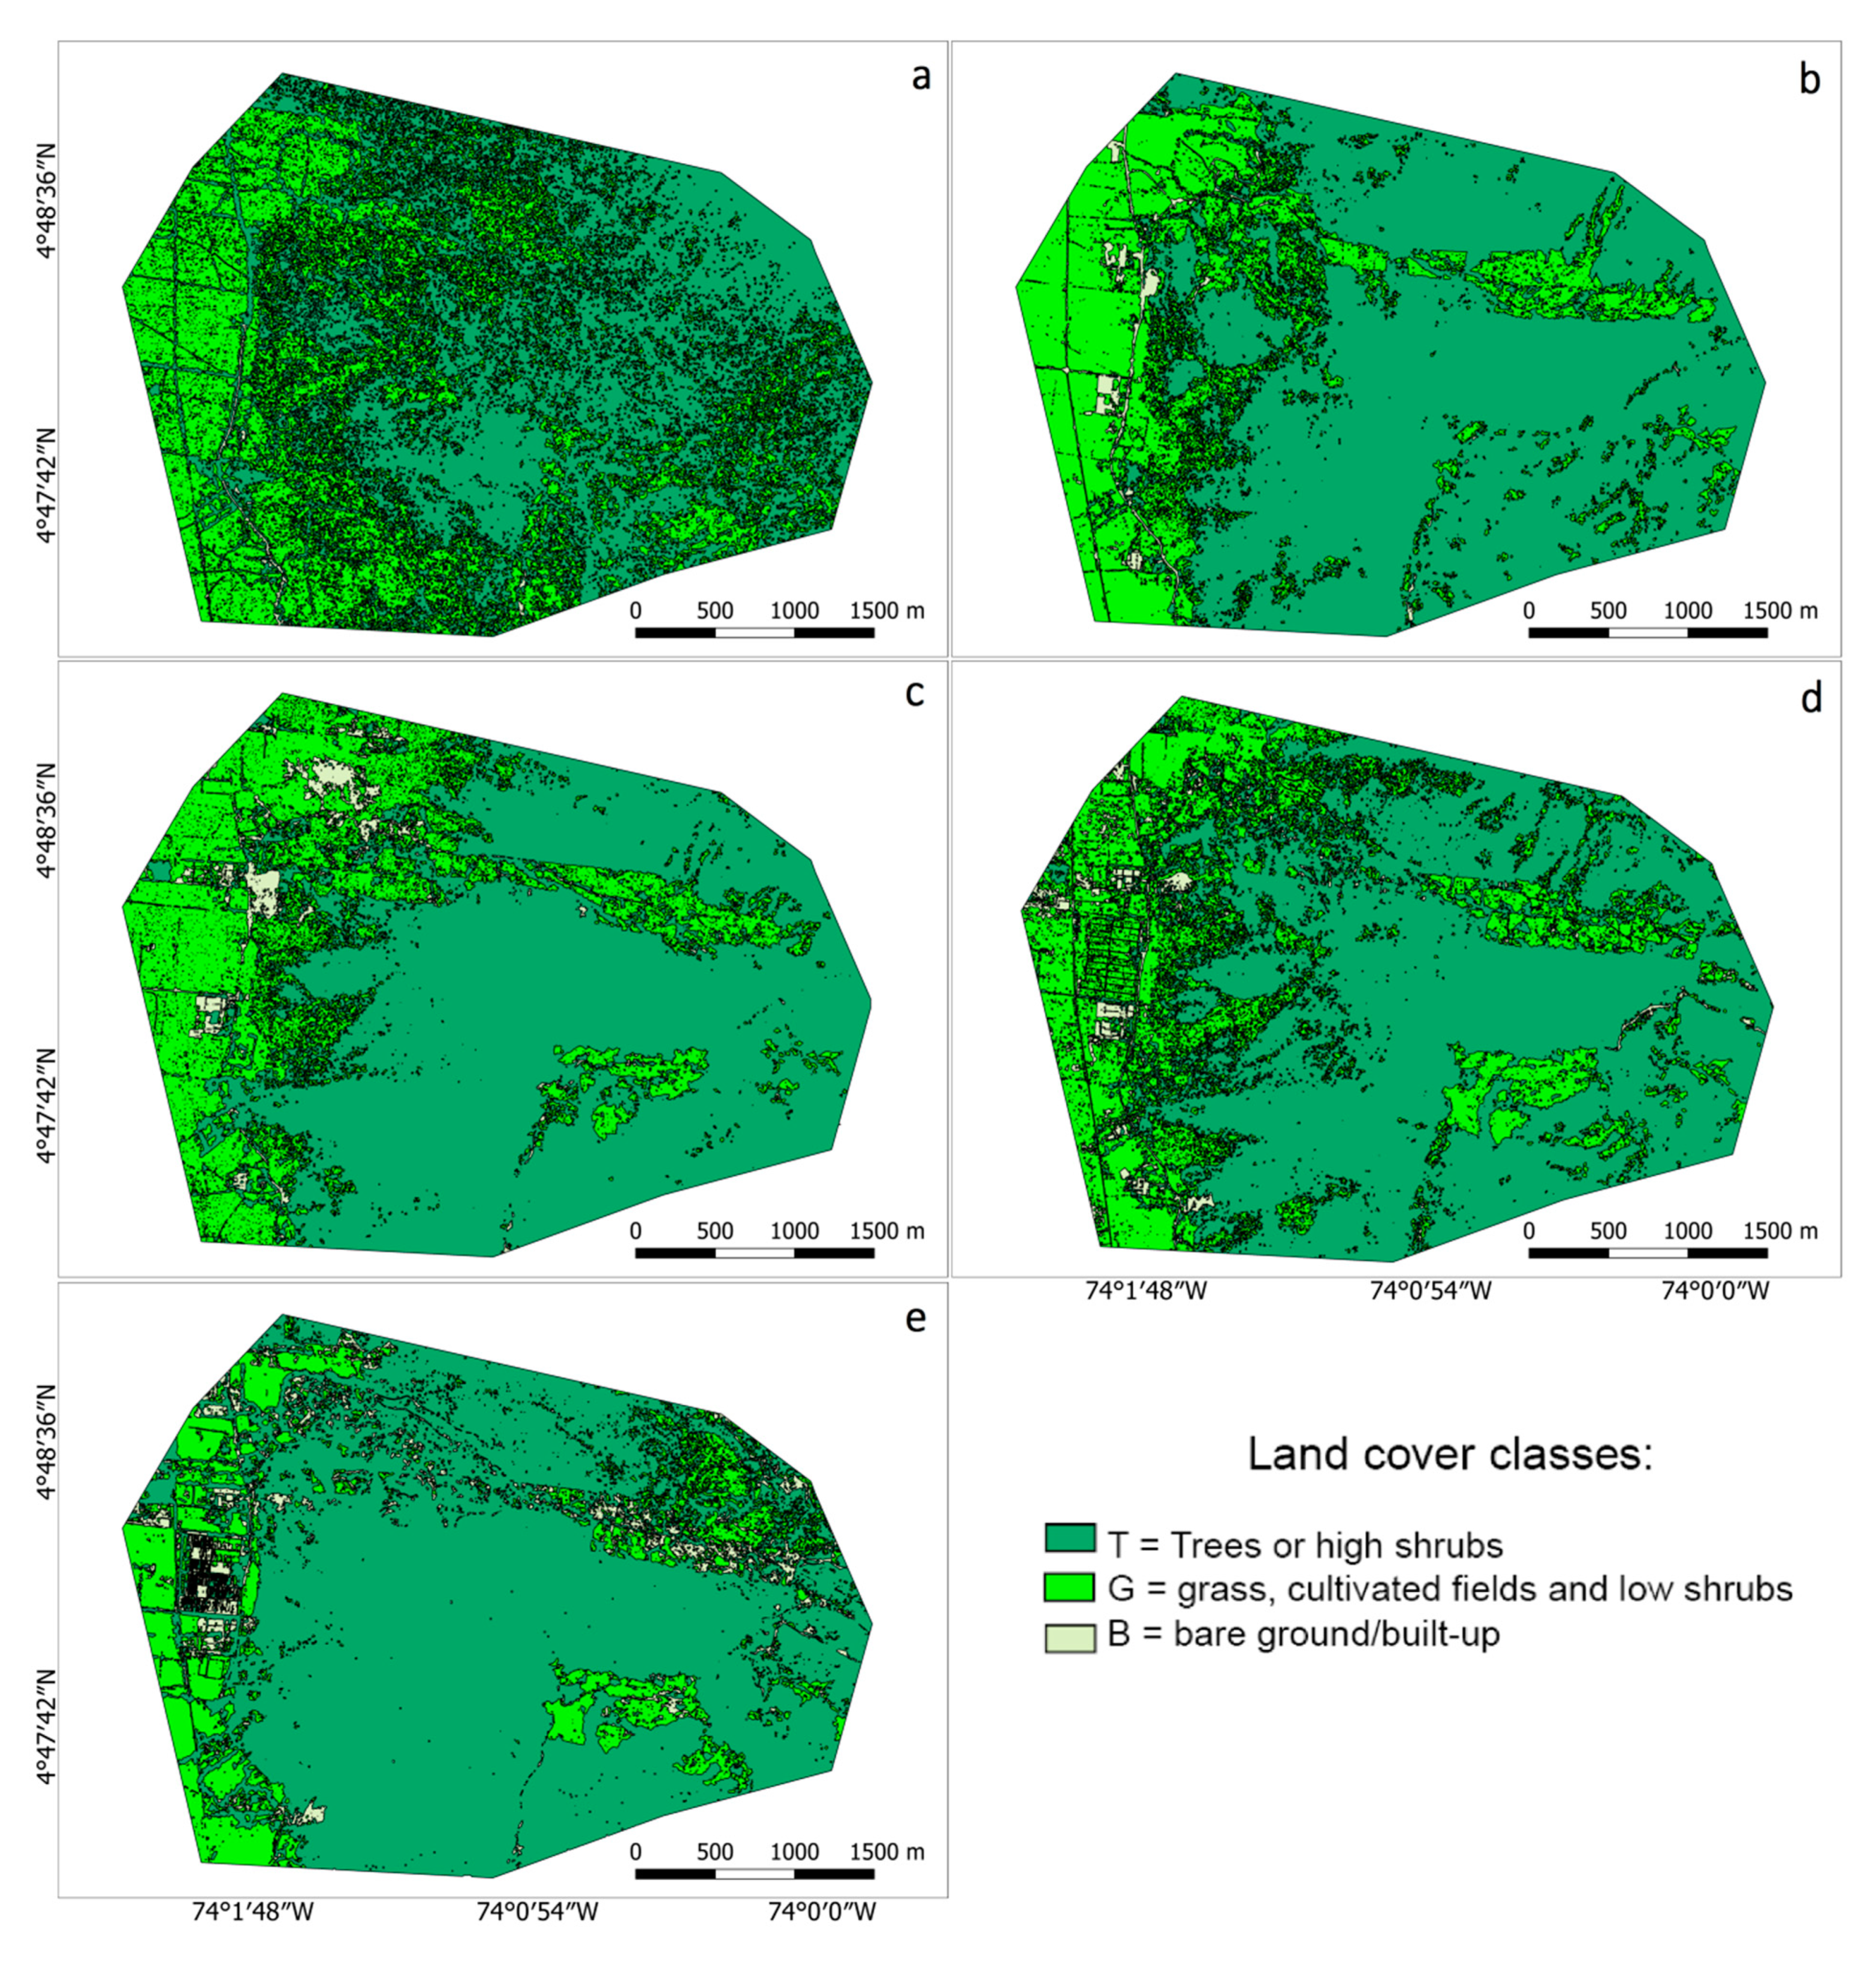
Figure 5.
Changes in the relative share of MSPA classes in the study localities (1940–2007): BG = background, CN = connectors and bridges, ED = edges, IS = islets, CO = core (class definitions are presented in Table 2).
Figure 5.
Changes in the relative share of MSPA classes in the study localities (1940–2007): BG = background, CN = connectors and bridges, ED = edges, IS = islets, CO = core (class definitions are presented in Table 2).


Table 1.
Information on the utilized aerial photo series for all study localities (1940–2007).
| Locality/Decade | 40s | 50s | 60s | 70s | 80s | 90s | 00s | No. of Scene | Area (ha) |
|---|---|---|---|---|---|---|---|---|---|
| Torca | 1940 | - | 1962 | 1978 | - | 1993 | 2004 | 5 | 1081 |
| Soacha | - | - | 1962 | - | 1987 | 1996 | - | 3 | 1019 |
| San Francisco | - | - | 1962 | 1977 | - | 1993/98 | 2007 | 5 | 484 |
| El Rosal | - | - | 1962 | 1977 | 1987 | 1996 | 2007 | 5 | 720 |
| Guasca | 1940 | 1955 | - | 1978 | 1985 | - | 2007 | 5 | 987 |
| Guatavita | 1940 | 1958 | 1962 | - | - | 1997 | 2007 | 5 | 417 |
| Tabio | 1940 | - | 1961 | - | - | 1998 | 2007 | 4 | 711 |
| Sumapaz | 1948 | - | 1963 | - | 1987 | 1996 | - | 4 | 306 |
| Pasquilla | 1941 | - | 1961 | - | 1981 | 1993 | 2007 | 5 | 606 |
Table 2.
Definition of the class groups and categories for the morphological spatial pattern analysis (MSPA) adapted from [85].
Table 2.
Definition of the class groups and categories for the morphological spatial pattern analysis (MSPA) adapted from [85].
| MSPA Class Group | MSPA Class Category | Definition |
|---|---|---|
| Core | Core | Internal forest pixels whose distance to the background is higher than a specified threshold value (here: 5 m) |
| Islet | Islet | Patch forest pixels that do not contain any core pixel, i.e., potentially vulnerable and isolated habitats |
| Connectors and branches | Bridge | Pixels that connect two or more disconnected core areas |
| Loop | Pixels that connect a core area to itself | |
| Branch | Extensions of pixels in a core area that do not connect with other areas | |
| Edge | Perforation | Pixels of the internal perimeter of a foreground object |
| Edge | Pixels of the external perimeter of a foreground object |
© 2020 by the authors. Licensee MDPI, Basel, Switzerland. This article is an open access article distributed under the terms and conditions of the Creative Commons Attribution (CC BY) license (http://creativecommons.org/licenses/by/4.0/).
Share and Cite
MDPI and ACS Style
Calbi, M.; Clerici, N.; Borsch, T.; Brokamp, G. Reconstructing Long Term High Andean Forest Dynamics Using Historical Aerial Imagery: A Case Study in Colombia. Forests 2020, 11, 788. https://doi.org/10.3390/f11080788
AMA Style
Calbi M, Clerici N, Borsch T, Brokamp G. Reconstructing Long Term High Andean Forest Dynamics Using Historical Aerial Imagery: A Case Study in Colombia. Forests. 2020; 11(8):788. https://doi.org/10.3390/f11080788
Chicago/Turabian StyleCalbi, Mariasole, Nicola Clerici, Thomas Borsch, and Grischa Brokamp. 2020. "Reconstructing Long Term High Andean Forest Dynamics Using Historical Aerial Imagery: A Case Study in Colombia" Forests 11, no. 8: 788. https://doi.org/10.3390/f11080788
Note that from the first issue of 2016, this journal uses article numbers instead of page numbers. See further details here.