The Relationship between Stem Diameter Shrinkage and Tree Bole Moisture Loss Due to Transpiration


College of Forestry, Inner Mongolia Agricultural University, Hohhot 010019, Inner Mongolia Autonomous Region, China
*
Author to whom correspondence should be addressed.
Forests 2019, 10(3), 290; https://doi.org/10.3390/f10030290
Submission received: 12 February 2019
/
Revised: 7 March 2019
/
Accepted: 21 March 2019
/
Published: 23 March 2019
(This article belongs to the Section Forest Ecophysiology and Biology)
Abstract
:The responsiveness of four types of stem diameter shrinkage indicators to sap flow changes was compared under four air temperature and cloudiness conditions: above 0 °C below 80% cloud cover days; above 0 °C large percentage cloud cover days; low temperature below 80% cloud cover days; and low temperature large percentage cloud cover days. In this study, we investigated the effects of indicative functions of relatively easy-to-access stem diameter shrinkage on variation characteristics of sap flow. High-resolution-based stem diameter shrinkage is related to changes in tree moisture content. Stem diameter shrinkage indicators are adopted to confirm sap flow changes resulting from transpiration pull, which may enhance the power of stem diameter shrinkage as an index for tree bole moisture loss. After measuring stem diameter variations, the following stem diameter shrinkage indicators were calculated: maximum daily shrinkage, daily stem diameter increment, daily stem diameter variation, and tree water deficit-induced stem shrinkage (TWD). Sap flow was measured synchronously, and stem diameter shrinkage indicators were analyzed to confirm their responses to sap flow. TWD was positively correlated (r ≥ 0.317) with daily variations in sap flow and reached extremely significant levels (p ≤ 0.001) under all conditions. TWD and maximum daily shrinkage were able to better reflect the correlation between changes in stem diameter and sap flow on a daily scale, except large percentage cloud cover days with low temperatures. Changes in stem diameter had no correlation with sap flow during low temperature and large percentage cloud cover days. Among all stem diameter shrinkage indicators, TWD showed the highest correlation (r ≥ 0.601 and p ≤ 0.001) with sap flow under all conditions, except during large percentage cloud cover days with low temperatures. The stem diameter shrinkage indicators did not reflect sap flow changes during large percentage cloud cover days with low temperatures. The indicator that best reflected moisture loss of trees was TWD.
1. Introduction
Stem diameter shrinkage based on high time resolution is closely related to changes in tree moisture levels [1,2]. High-resolution measurements of diameter shrinkage are considered very effective tools for evaluating growth changes in tree diameter in the context of tree bole moisture [3,4,5]. This approach has been widely used for agricultural irrigation guidance [6], crop growth monitoring [7,8], and forestry research [9,10]. Many studies [11,12] have shown that stem diameter shrinkage is mainly determined by sap flow changes. However, such studies are not extensive [5,8], and research into different stem diameter shrinkage indicator responses to sap flow still lacks theoretical support [13].
When trees’ transpiration rate surpasses that of root water uptake, trees face moisture deficit [14,15], and stem sap flow will indicate the process of moisture transfer from the xylem to the leaves [16,17]. Variations in stem diameter act in response to a tree’s daily absorption and loss of moisture [18]. Moisture loss caused by the consumption of moisture stored in stem organs can cause shrinkage of a tree’s bole diameter [19].
Stem diameter variations can be influenced by sap flow changes caused by transpiration pull [20]. Sevanto et al. [21] carried out a study on the calibration of stem diameter variations based on sap flow, using the heat transfer technology. They identified a linear correlation, and estimated that an accurate measurement of stem diameter variations could be used to estimate sap flow. After classification according to the formation mechanism of stem diameter variations, this correlation can be enhanced. Stem diameter variation is composed of two parts: one is due to the growth of cambium and living bark cells in terms of cell division and enlargement; the other is driven by the water potential gradient of trees [22]. Stem diameter variations due to growth contribute minimally to stem diameter shrinkage if the stem tissue structure suffers no degeneration.
Stem diameter variations follow completely different mechanisms during the vegetation phase compared to phases when temperature drops below or equal to 0 °C [15,22]. Stem sap flow shows different characteristics under different weather conditions. Weather conditions usually refer to a number of meteorological parameters. As a major factor for demonstrating weather conditions, total cloud cover can be used as a preliminary division of weather conditions. During each phase, we further divided the cloudiness conditions due to differences in sap flow changes between below 80% cloud cover days and large percentage cloud cover days. We separated data into four categories under different air temperatures and cloudiness conditions, and performed separate analyses. We, therefore, propose the following hypotheses: (1) stem diameter shrinkage indicators can help explain some characteristics of sap flow during above 0 °C below 80% cloud cover days; and (2) since the indicator tree water deficit-induced stem shrinkage (TWD) eliminates the influence of seasonal growth on stem diameter variations and retains the reversible shrinkage caused by water loss, TWD can better explain sap flow when compared to other stem diameter shrinkage indicators under all air temperature and cloudiness conditions.
Tree cambium can be activated when the average temperature reaches a certain threshold [23], which represents the prerequisite for stem diameter shrinkage division via TWD and stem growth [24]. Therefore, we carried out our research during the period when cambium is activated. In this study, data related to stem diameter shrinkage and sap flow were measured in Dahurian larch (Larix gmelini Rupr.) forest, during July–September 2017 and July–September 2018. The responses of stem diameter shrinkage indicators to sap flow—maximum daily shrinkage, daily stem diameter increment, daily stem diameter variation, and TWD—were studied to confirm the effect of indicative functions of relatively easy-to-access stem diameter shrinkage on the variation in characteristics of the sap flow. This served as theoretical support for the research on the physiological ecology characteristics of trees. This study can also contribute to the analysis of eco-environmental benefits of forest resources. It is of significance to the sustainable management of forests.
2. Materials and Methods
2.1. Study Area
The experiment was carried out at a permanent Dahurian larch forest sample plot (50.94° N, 121.51° E, 854 m a.s.l.) in the northeastern part of China (Figure 1). The average annual temperature in this area is −4.4 °C (2007–2017). The annual potential evapotranspiration is ~800–1200 mm. The annual precipitation is ~450–550 mm. Approximately 60% of the precipitation during the year is concentrated during July and August, and the snowfall period is from September to the beginning of the following May. The thickness of the average yearly snowfall is 30 cm. The warmest and wettest period of the year is from July to September—the time during which the experiment was performed. The average temperature during the experimental period in 2017 and 2018 was 11.5 °C. The average relative humidity during the two-years experimental period was 80.2%. The main tree species in the study was the Dahurian larch, which accounts for 79% of trees in the observed area. Dahurian larch has strong cold tolerance. Although it has a strong photophilic feature, adequate water regulation is required and long-time strong light under direct sun cannot be tolerated. It starts budding in early May and its needles litter in early October. Its growth period is short and mainly happens from July to August. There are large areas of seasonal frozen soil and perennial permafrost in this area.
2.2. Data Measurement of Stem Diameter Variations, Sap Flow, and Environmental Factors
The trees with the instruments installed on them in the sample plot were healthy trees with no sign of damage. These trees were selected based on the average height and the average breast height diameters in the sample plot (Table 1). Belt potentiometric diameter variation sensors (type DC2, Ecomatik, Munich, Germany) were mounted onto three selected trees, at 1.3 m from the ground, to measure variations in stem diameter (Figure 2). Special steel wires were adopted to wrap around the stem. They could pose pressure to sensors to generate resistance value changes and measure the stem diameter variation. The stem diameter variation range measured was ~0–9 mm, and the measuring accuracy was ±7 µm. Stem diameter variation measurements were taken on the bark, which we did not remove. These results included changes in the cortex and epidermis, considering that the tissue with weak physiological activity may affect the stem’s water storage [5]. In addition, given the low temperature at the experimental site, the preservation of bark reduced the effect of temperature change on trees. During the measurement, we ensured that the steel wire’s pressure was not too high on the sensor—if necessary, the instrument was reinstalled. The data logger (type DL15, Ecomatik, Munich, Germany) recorded data once every half hour. Lithium batteries of the data acquisition unit were exchanged regularly, while making sure that no litter was attached to the sensors for too long.
The thermal dissipation method [25] was adopted to monitor stem sap flow density of Dahurian larch. Sap flow sensors (type SF-G, Ecomatik, Munich, Germany) were installed at a stem height of 1.5 m facing north with flexible foamed plastic wrapping on the outside to protect them from rainfall and solar radiation interference. Although the potential azimuthal and radial variations of sap flux density should not be ignored [26], we only selected the north side for device setting, which is the usual practice when there is a limitation in the number of the sensors. Three sets of device sensors were installed on trees where diameter variation sensors were deployed. This kind of sensor is composed of two special-material probes and a heater strip for probes. For trees with similar breast height diameters measured by growth cones, their sapwood width is around 5 cm. One probe was inserted 3 cm deep into the sapwood, while the other was inserted 15 cm below the first one. The device can calculate the stem sap flow according to temperature difference. The measurable temperature scope of each probe was ~2.5–20 °C. This measuring technology ignored the natural temperature gradient of the stem, which might have resulted in ±1.5 °C measuring error. A type CR1000 (Campbell Scientific, Logan, UT, USA) data collector recorded data once every half hour. Sensors and data collectors were all powered by solar panels. Stem sap flow long after rainfall was confirmed to be zero flow.
where Qs is sap flow density; ΔTmax is maximum temperature difference between two needles after a long period of rain; ΔT is temperature difference between two needles. Total cloud cover, air relative humidity (HMP45C device, VAISALA, Helsinki, Finland), and air temperature (HMP45C device, VAISALA, Helsinki, Finland) measurements were guided by the observation methodology of the national standards of the People’s Republic of China for long-term forest ecosystem research (GB/T 33027-2016). Total cloud cover was measured by visual observation at a fixed observation location near the sample plot (to ensure a wide field of vision and to prevent a large area obstruction of the view by trees). The sky view that could be seen at the observation location was 100% visibility, and the percentage of sky covered by visible clouds was referred to as total cloud cover. Cloud observations were made at 8:00, 14:00, and 20:00 h every day. The average value of three observations was taken as the total cloud cover for the day. The vapor pressure deficit was calculated from the relative air humidity and air temperature.
2.3. Data Analysis
A statistical analysis of the data was carried out using SPSS v19.0 (IBM Corp., Armonk, NY, USA). Indicators of stem diameter shrinkage [12,27,28,29] were calculated using stem diameter variation data at a half-hour time scale. TWD was calculated based on the zero-growth assumption [29]:
where t represents the time of recording; <t indicates all history recording time except the present recording time; MDS is the maximum daily shrinkage; MXSD is the maximum stem diameter; MNSD is the minimum stem diameter; DSDI is the daily stem diameter increment; DSDV is the daily stem diameter variation; AGSD is the mean stem diameter; TWD is the tree water deficit-induced stem shrinkage and SD is the stem diameter.
After calculating total cloud cover during the daytime, we identified only 3 days (13 July 2017, 25 July 2018, and 12 August 2018) where the total cloud cover on the day was <20% during the experimental period. Therefore, we did not carry out a subdivision between below 20% cloud cover and below 80% cloud cover days. Days when cloud cover was less than or equal to 80% were considered below 80% cloud cover days, while days when the cloud cover was greater than 80% were considered large percentage cloud cover days.
3. Results
3.1. Environmental Conditions
The average temperature in 2018 (12.8 °C) obtained during the cambium activation period of Dahurian larch was slightly higher than that during 2017 (10.3 °C) (Figure 3). Taking the daily minimum temperature > 0 °C or ≤ 0 °C as the limit, we divided the 182 days of data obtained based on observations in 2017 and 2018. This resulted in 127 days with an appropriate at an average of 14.5 °C, and 55 days of low temperature with an average of 4.6 °C. Altogether, there were 6 days with an average temperature lower that 0 °C. Days were classified as below 80% cloud cover days and large percentage cloud cover days based on the standards of total cloud cover of ≥80% or <80%, on days with appropriate and low temperatures, respectively (Figure 4). In total, there were 76 below 80% cloud cover days and 51 large percentage cloud cover days with above 0 °C, as well as 39 below 80% cloud cover days and 16 large percentage cloud cover days with low temperatures (Table 2). The overall variation of vapor pressure deficit was smooth, and the rangeability of 2017 is slightly larger than that of 2018.
3.2. Daily Variation Trend of TWD and Sap Flow in the Dahurian Larch
Among all the stem diameter shrinkage indicators of Dahurian larch, TWD indicates diameter variation characteristics at a half-hour time resolution, which can therefore reveal daily variation trends. A comparison between TWD diurnal variation and sap flow of Dahurian larch was conducted under four air temperatures and cloudiness conditions including above 0 °C below 80% cloud cover days, above 0 °C large percentage cloud cover days, low temperature below 80% cloud cover days, and low temperature large percentage cloud cover days (Figure 5). The data showed that under different conditions, TWD and sap flow had the same changing trend. Furthermore, the most apparent change in TWD occurred in the above 0 °C below 80% cloud cover days condition, during which the daily variation initially dropped slightly and then gradually increased to reach the maximum daily value at about 16:00 h before dropping again; the stem sap flow of the Dahurian larch showed obvious diurnal variation characteristics, exhibiting a unimodal distribution every day with a peak value at approximately 14:00 h. TWD gradually decreased at 2 h following sap flow peak. During above 0 °C large percentage cloud cover days, the TWD changed with different sap flows. However, changes were relatively small during below 80% cloud cover day conditions, with no obvious responses to small sap flow fluctuations, and the delay time was longer compared to those on above 0 °C below 80% cloud cover days. On the days with a low temperature, the TWD on below 80% cloud cover days and large percentage cloud cover days usually conformed to changes in sap flow, with better responses to a rising sap flow. During the period when sap flow dropped, the TWD remained steady or decreased slightly. Pearson correlation analysis performed for above 0 °C below 80% cloud cover days, above 0 °C large percentage cloud cover days, low temperature below 80% cloud cover days, and low temperature large percentage cloud cover days (Table 3), identified an extremely significant (p ≤ 0.001) positive correlation (r ≥ 0.317) between the TWD and sap flow.
3.3. Change Trends in Stem Diameter Shrinkage Indicators and Sap Flow Under Daily Time Resolution
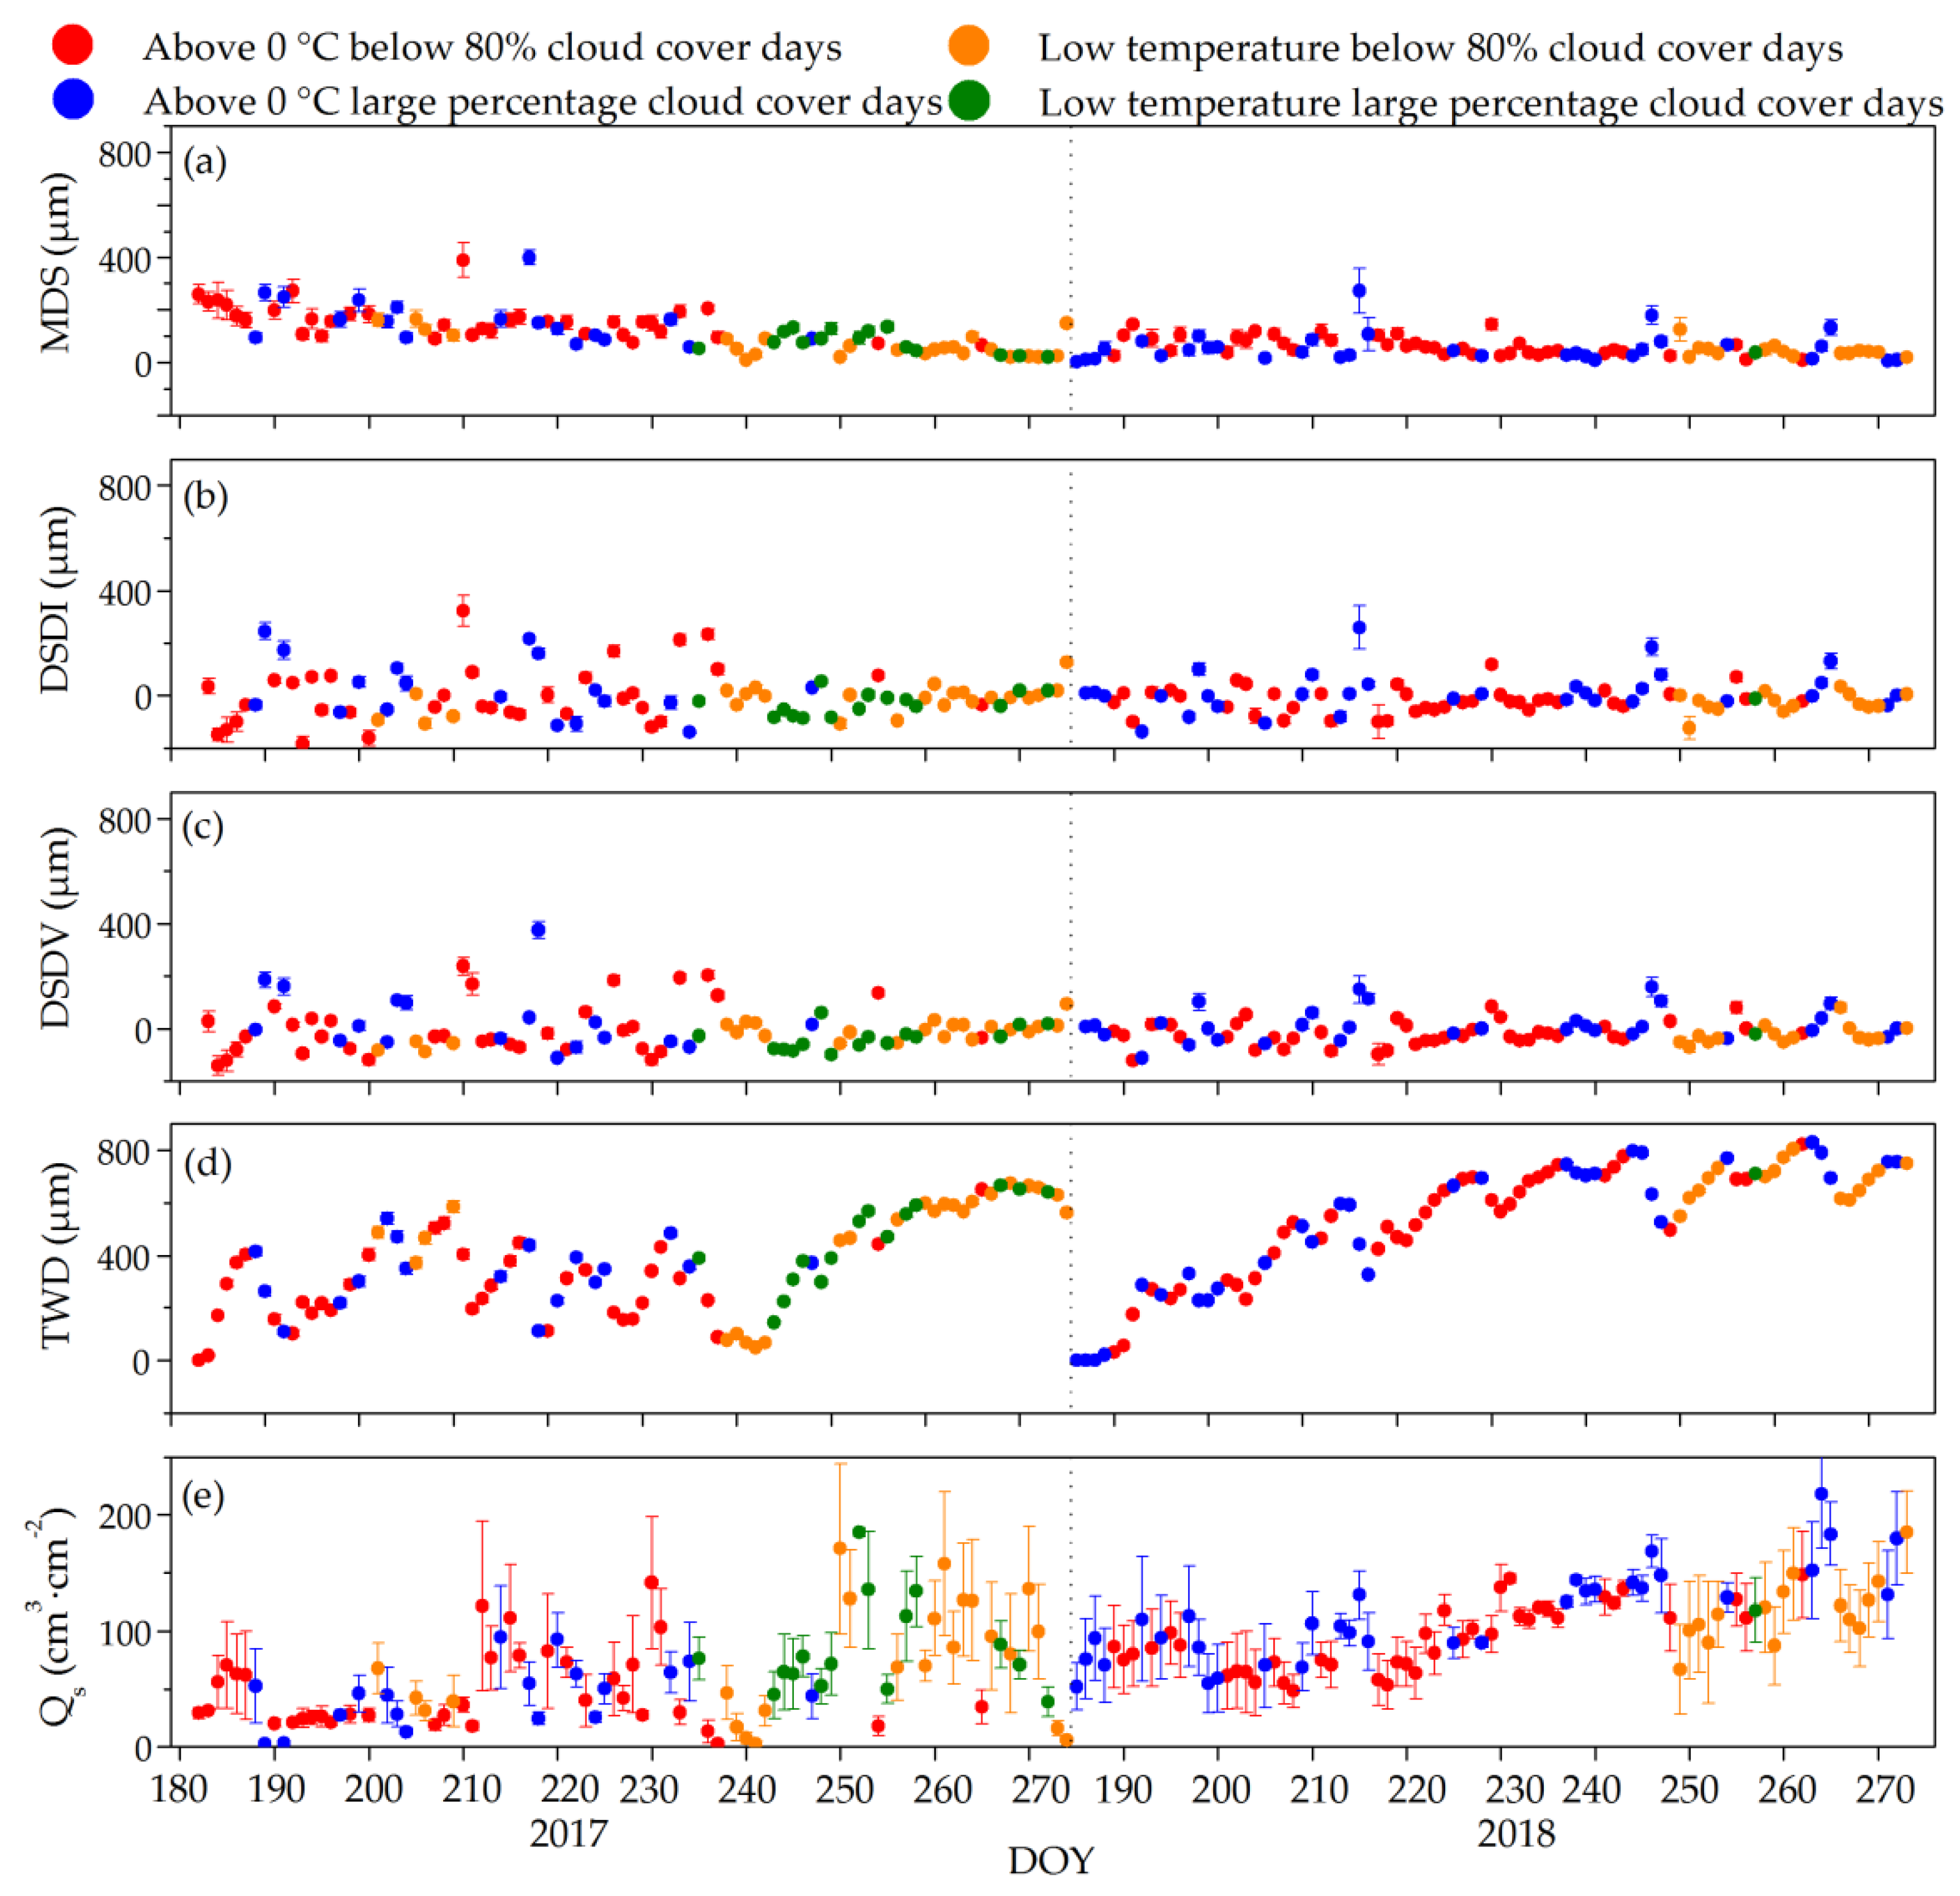
The time series of Dahurian larch stem diameter shrinkage indicators relative to sap flow changes at a daily time resolution were different (Figure 6). Of these, TWD amplitude, which was augmented and diminished with the increase and decrease in sap flow, respectively, except on low temperature large percentage cloud cover days when it was the largest, varied. On low temperature large percentage cloud cover days, we only observed somewhat elevated TWD during an increase in sap flow. However, it did not decrease with sap flow; TWD remained steady while sap flow was decreasing. Maximum daily shrinkage amplitude variation was the smallest among the four selected stem diameter shrinkage indicators, showing an opposite variation trend to that of sap flow. Maximum daily shrinkage showed better characteristics compared to daily stem diameter increment and variation relative to sap flow variations. Diurnal trends of daily stem diameter increment and variation with sap flow showed similar characteristics with poor sensitivity.
The Pearson correlation analysis was adopted to analyze the responses of each Dahurian larch stem diameter shrinkage indicator to changes in sap flow (Table 4). Among all the indicators, TWD showed the highest correlation (r ≥ 0.601 and p ≤ 0.001) with sap flow under all conditions except low temperature large percentage cloud cover days. Correlation strength between the maximum daily shrinkage and stem sap flow was second only to that between TWD and stem sap flow, except on low temperature large percentage cloud cover days. However, correlation between stem sap flow and TWD, or maximum daily shrinkage on low temperature large percentage cloud cover days was not significant (p > 0.05). Compared to the distribution of low temperature below 80% cloud cover days, that of low temperature large percentage cloud cover days was closer to the period of highest temperatures of the year, so the average temperature on low temperature large percentage cloud cover days was higher than that on low temperature below 80% cloud cover days (Table 2). In addition, stem sap flow correlated significantly (p ≤ 0.01) with both TWD (r = 0.652) and maximum daily shrinkage (r = −0.417) on low temperature below 80% cloud cover days; therefore, the cause of insignificant (p > 0.05) correlations was not low temperature alone. Sap flow on large percentage cloud cover days changed more than during below 80% cloud cover days. There was also a significant (p ≤ 0.01) correlation between TWD and sap flow (r = 0.601), as well as maximum daily shrinkage and sap flow (r = −0.545) on above 0 °C large percentage cloud cover days. Therefore, we believe that the insignificant (p > 0.05) correlations between sap flow and TWD, as well as those between maximum daily shrinkage and sap flow during low temperature, large percentage cloud cover days were an outcome of the combination of temperature and cloudiness conditions.
4. Discussion
Any water-related factors affecting stem diameter shrinkage are due to changes in the tree bole water potential gradient caused by tree transpiration [30], and transpiration could cause changes in stem sap flow [16,31]. Interpreting growth and water dynamic signals from automatic dendrometer data is not always straightforward [29,32]. After dividing stem diameter changes into TWD and growth-induced irreversible stem expansion, TWD was found to be an effective index for analyzing stem diameter responses to tree bole moisture loss. As a stem diameter shrinkage indicator, TWD was a good choice for reflecting sap flow changes at a half-hour time resolution. It should be noted that the division mode adopted in this study was based on the zero-growth assumption (diametral growth has little or no effect on stem shrinkage). Zweifel et al. [29] found TWD to be a very effective biological indicator for tree bole moisture, which is consistent with our results in this study. The hydration caused by relatively high stem sap flow can slow down the stem diameter contraction and increase water storage [33]. TWD is produced by stem volume changes caused by the moisture status, and it is therefore advantageous in reflecting stem sap flow. This study proves that TWD can reflect a tree’s moisture status at a half-hour time resolution. Since stem diameter shrinkage indicators such as the maximum daily shrinkage, daily stem diameter increment, and daily stem diameter variation cannot reflect sap flow at a half-hour time resolution, TWD is considered a better choice for indicating sap flow when the time scale required is less than 1 day. Transpiration can cause variations in plant moisture indices, including plant moisture content [34,35], water potential [36], and stem sap flow [37,38]. It would be good to acknowledge that coupled TWD and actual tree water content, for example, using time domain reflectometry probes or frequency domain reflectometry probes [39], should be analyzed to confirm whether TWD is a good tree moisture indicator.
TWD has advantages for indicating stem sap flow at a daily time resolution compared to other indices. These secondary thickening belt tissues can store water inside trees and play a positive role in water transportation whenever necessary [40]. Water loss and transportation via these tissues in the case of water deficit can be demonstrated by varying TWD and stem sap flow at a daily time resolution. To some extent, the stem diameter shrinkage indicator TWD can reduce or even eliminate the influence of division and enlargement of cambium living cells on stem diameter variations, which highlights the reversible stem shrinkage during daytime and moisture supply during the night. Compared to other indices, this represents an advantage for identifying sap flow changes caused by transpiration pull. The daily stem diameter increment places more emphasis on the seasonal growth of trees, and stem diameter variations due to moisture loss are considered to be noise. Daily stem diameter variation represents the swell of the stem diameter due to seasonal growth and moisture variation [41]. Some studies [42,43,44,45] found that the maximum daily shrinkage worked well in diagnosing a plant’s moisture storage. They also showed that it shares a certain correlation with stem sap flow, but this was less significant when compared with TWD in terms of explaining stem sap flow variations. Maximum daily shrinkage is obtained by subtracting minimum and maximum stem diameter values, which indicates the shrinkage of the stem diameter due to moisture variation based on the irreversible property of trees—seasonal growth. Assuming that a tree’s seasonal growth takes place at a constant rate, the maximum daily shrinkage works well for indicating stem moisture loss. However, in reality, it cannot be ensured that the division and enlargement of cambium living cells take place at a uniform speed. Moreover, Zweifel et al. [29] proved that some trees might stop their seasonal growth during a period of stem diameter shrinkage.
Although TWD was shown to effectively reflect the variation characteristics of sap flow on above 0 °C below 80% cloud cover days, above 0 °C large percentage cloud cover days, and low temperature below 80% cloud cover days, it could not demonstrate the variation in sap flow on low temperature large percentage cloud cover days (Table 4). We concluded that this is a combined effect of temperature and cloudiness conditions, and accounted for this phenomenon through variations in relevant environmental factors. We found that sap flow responded significantly (r = 0.55 and p ≤ 0.05) to variations in vapor pressure deficit on low temperature large percentage cloud cover days. However, the correlation was not significant (p > 0.05) under other conditions. The correlation between vapor pressure deficit and TWD did not reach significance (p ≤ 0.05) under any conditions. The vapor pressure deficit, determined by air temperature and relative humidity, may be responsible for the variation in sap flow on low temperature large percentage cloud cover days. Eliades et al. [26] found that during negative temperatures, reverse sap flow was occurring. This may be one of the explanations of the poor correlation of the TWD with sap flow. One of the main limitations of the thermal dissipation method [25] used in this study is that it cannot measure reverse flows. There was a significant correlation between stem diameter shrinkage and sap flow changes [46,47], despite the sap flow density being different among trees from different species. Moisture movement inside the xylem is caused by water tension. Not only in theory, the practice also proves that sap flow variation is linearly related to stem diameter variation [21]. This study found that such correlation can be more easily affected by other factors under low temperature, more cloud cover conditions. Effects of stem diameter shrinkage indicators on sap flow are reduced by other plant-specific physiological and biophysical processes [29]. Stem diameter shrinkage can significantly respond to moisture variations on the soil-plant-atmosphere continuum (SPAC) [1], and sap flow can only serve as a plant moisture variation index to indicate the response of tree growth to plant moisture in the SPAC. Plant growth responses to the combined action of the soil moisture [48], the atmospheric moisture [49], and other environmental factors [50,51] require further studies.
5. Conclusions
In this study, the responses of stem diameter shrinkage indicators to sap flow were studied to confirm the effect of indicative functions of relatively easy-to-access stem diameter shrinkage on the variation in characteristics of the sap flow under four air temperature and cloudiness conditions in Dahurian larch forest. We propose two hypotheses: (1) stem diameter shrinkage indicators can help explain some characteristics of sap flow during above 0 °C below 80% cloud cover days and (2) TWD can better explain sap flow when compared to other stem diameter shrinkage indicators under all air temperature and cloudiness conditions. We found that TWD was positively correlated (r ≥ 0.317) with daily variations in sap flow and reached extremely significant levels (p ≤ 0.001) under all conditions. TWD and maximum daily shrinkage were able to better reflect the correlation between changes in stem diameter and sap flow on a daily scale, except large percentage cloud cover days with low temperatures. Changes in stem diameter had no correlation with sap flow during low temperature and large percentage cloud cover days. Among all stem diameter shrinkage indicators, TWD showed the highest correlation (r ≥ 0.601 and p ≤ 0.001) with sap flow under all conditions, except during large percentage cloud cover days with low temperatures. The study preliminarily showed that the stem diameter shrinkage indicators cannot reflect changes in sap flow on low temperature large percentage cloud cover days. TWD can give information regarding variations in stem sap flow on a half-hour time scale. Among all stem diameter shrinkage indicators (maximum daily shrinkage, daily stem diameter increment, daily stem diameter variation, and TWD), TWD was the best choice for indicating stem sap flow variations in under a daily time resolution. This study provides support for understanding stem diameter shrinkage and tree bole moisture loss. Stem sap flow can only serve as a plant moisture variation index to indicate the response of tree stem diameter variations to plant moisture. Tree stem diameter variations responses to the combined action of environmental factors require further studies.
Author Contributions
Conceptualization, Q.Z. and Y.T.; Investigation, X.L. and M.M.; Formal Analysis, X.L. and M.M.; Writing—Original Draft Preparation, Y.T., B.W. and X.L.; Writing—Review and Editing, Q.Z., Y.T., X.L., M.M. and B.W.; Funding Acquisition, Q.Z., Y.T. and B.W.
Funding
This research was funded by the National Key Research and Development Program of China (grant number 2017YFC0504003), the Graduate Student Scientific Research Innovation Program of Inner Mongolia Autonomous Region of China (grant number B2018111936Z), the Young Teachers Science Foundation of Forestry College of Inner Mongolia Agricultural University.
Acknowledgments
This work is supported by the CFERN & BEIJING TECHNO SOLUTIONS Award Funds on excellent academic achievements. We thank the Inner Mongolia Daxing’anling Forest Ecosystem Research Station for field sites support and other support. We thank MDPI for its linguistic assistance during the preparation of this manuscript.
Conflicts of Interest
The authors declare no conflict of interest.
References
- Perämäki, M.; Nikinmaa, E.; Sevanto, S.; Ilvesniemi, H.; Siivola, E.; Hari, P.; Vesala, T. Tree stem diameter variations and transpiration in Scots pine: An analysis using a dynamic sap flow model. Tree Physiol. 2001, 21, 889–897. [Google Scholar] [CrossRef]
- Sarris, D.; Siegwolf, R.; Körner, C. Inter- and intra-annual stable carbon and oxygen isotope signals in response to drought in Mediterranean pines. Agric. For. Meteorol. 2013, 168, 59–68. [Google Scholar] [CrossRef]
- Cocozza, C.; Tognetti, R.; Giovannelli, A. High-resolution analytical approach to describe the sensitivity of tree–environment dependences through stem radial variation. Forests 2018, 9, 134. [Google Scholar] [CrossRef]
- Dietrich, L.; Zweifel, R.; Kahmen, A. Daily stem diameter variations can predict the canopy water status of mature temperate trees. Tree Physiol. 2018, 38, 941–952. [Google Scholar] [CrossRef]
- Steppe, K.; Der Crone, J.S.V.; De Pauw, D.J.W. TreeWatch.net: A water and carbon monitoring and modeling network to assess instant tree hydraulics and carbon status. Front. Plant Sci. 2016, 7, 993. [Google Scholar] [CrossRef] [PubMed]
- Ortuño, M.F.; Conejero, W.; Moreno, F.; Moriana, A.; Intrigliolo, D.S.; Biel, C.; Mellisho, C.D.; Pérez-Pastor, A.; Domingo, R.; Ruiz-Sánchez, M.C.; et al. Could trunk diameter sensors be used in woody crops for irrigation scheduling? A review of current knowledge and future perspectives. Agric. Water Manag. 2010, 97, 1–11. [Google Scholar] [CrossRef] [Green Version]
- Meng, Z.J.; Duan, A.W.; Chen, D.L.; Dassanayake, K.B.; Wang, X.S.; Liu, Z.G.; Liu, H.; Gao, S.G. Suitable indicators using stem diameter variation-derived indices to monitor the water status of greenhouse tomato plants. PLoS ONE 2017, 12, e0171423. [Google Scholar] [CrossRef]
- Steppe, K.; Sterck, F.; Deslauriers, A. Diel growth dynamics in tree stems: Linking anatomy and ecophysiology. Trends Plant Sci. 2015, 20, 335–343. [Google Scholar] [CrossRef] [PubMed]
- Siegmund, J.F.; Sanders, T.G.M.; Heinrich, I.; Der Maaten, E.V.; Simard, S.; Helle, G.; Donner, R.V. Meteorol.ogical drivers of extremes in daily stem radius variations of beech, oak, pine in northeastern Germany: An event coincidence analysis. Front. Plant Sci 2016, 7, 733. [Google Scholar] [CrossRef]
- Tian, Y.; Zhang, Q.L.; Liu, X.; Meng, M. Stem radius variation in response to hydro-thermal factors in larch. Forests 2018, 9, 602. [Google Scholar] [CrossRef]
- Butz, P.; Raffelsbauer, V.; Graefe, S.; Peters, T.; Cueva, E.; Hölscher, D.; Bräuning, A. Tree responses to moisture fluctuations in a neotropical dry forest as potential climate change indicators. Ecol. Indic. 2017, 83, 559–571. [Google Scholar] [CrossRef]
- González-Rodríguez, Á.M.; Brito, P.; Lorenzo, J.R.; Gruber, A.; Oberhuber, W.; Wieser, G. Seasonal cycles of sap flow and stem radius variation of Spartocytisus supranubius in the alpine zone of Tenerife, Canary Islands. Alp. Bot. 2017, 127, 97–108. [Google Scholar] [CrossRef]
- Berry, Z.C.; Looker, N.; Holwerda, F.; Gómez Aguilar, L.R.; Colin, P.O.; Martínez, T.G.; Asbjornsen, H. Why size matters: The interactive influences of tree diameter distribution and sap flow parameters on upscaled transpiration. Tree Physiol. 2018, 38, 263–275. [Google Scholar] [CrossRef] [PubMed]
- Fernández, J.E.; Cuevas, M.V. Irrigation scheduling from stem diameter variations: A review. Agric. For. Meteorol. 2010, 150, 135–151. [Google Scholar] [CrossRef]
- Zweifel, R.; Häsler, R. Frost-induced reversible shrinkage of bark of mature subalpine conifers. Agric. For. Meteorol. 2000, 102, 213–222. [Google Scholar] [CrossRef] [Green Version]
- Daley, M.J.; Phillips, N.G. Interspecific variation in nighttime transpiration and stomatal conductance in a mixed New England deciduous forest. Tree Physiol. 2006, 26, 411–419. [Google Scholar] [CrossRef] [PubMed] [Green Version]
- Lapa, G.; Morandini, F.; Ferrat, L. Sap flow and photosynthetic response to climate and drought of Pinus nigra in a Mediterranean natural forest. Trees 2017, 31, 1711–1721. [Google Scholar] [CrossRef]
- Irvine, J.; Grace, J. Continuous measurements of water tensions in the xylem of trees based on the elastic properties of wood. Planta 1997, 202, 455–461. [Google Scholar] [CrossRef]
- Zhang, J.G.; He, Q.Y.; Shi, W.Y.; Otsuki, K.; Yamanaka, N.; Du, S. Radial variations in xylem sap flow and their effect on whole-tree water use estimates. Hydrol. Processes 2016, 29, 4993–5002. [Google Scholar] [CrossRef]
- King, G.; Fonti, P.; Nievergelt, D.; Büntgen, U.; Frank, D. Climatic drivers of hourly to yearly tree radius variations along a 6°C natural warming gradient. Agric. For. Meteorol. 2013, 168, 36–46. [Google Scholar] [CrossRef]
- Sevanto, S.; Nikinmaa, E.; Riikonen, A.; Daley, M.; Pettijohn, J.C.; Mikkelsen, T.N.; Phillips, N.; Holbrook, N.M. Linking xylem diameter variations with sap flow measurements. Plant Soil 2008, 305, 77–90. [Google Scholar] [CrossRef]
- Zweifel, R. Radial stem variations—A source of tree physiological information not fully exploited yet. Plant Cell Environ. 2016, 39, 231–232. [Google Scholar] [CrossRef] [PubMed]
- Körner, C.; Basler, D.; Hoch, G.; Kollas, C.; Lenz, A.; Randin, C.F.; Vitasse, Y.; Zimmermann, N.E. Where, why and how? Explaining the low-temperature range limits of temperate tree species. J. Ecol. 2016, 104, 1076–1088. [Google Scholar] [CrossRef]
- Zweifel, R.; Häsler, R. Dynamics of water storage in mature subalpine Picea abies: Temporal and spatial patterns of change in stem radius. Tree Physiol. 2001, 21, 561–569. [Google Scholar] [CrossRef] [PubMed]
- Granier, A. Evaluation of transpiration in a Douglas-fir stand by means of sap flow measurements. Tree Physiol. 1987, 3, 309–320. [Google Scholar] [CrossRef] [Green Version]
- Eliades, M.; Bruggeman, A.; Djuma, H.; Lubczynski, M.W. Tree water dynamics in a semi-arid, Pinus brutia forest. Water 2018, 10, 1039. [Google Scholar] [CrossRef]
- Hu, L.F.; Fan, Z.X. Stem radial growth in response to microclimate in an Asian tropical dry karst forest. Acta Ecol. Sin. 2016, 36, 401–409. [Google Scholar] [CrossRef]
- Intrigliolo, D.S.; Castel, J.R. Continuous measurement of plant and soil water status for irrigation scheduling in plum. Irrig. Sci. 2004, 23, 93–102. [Google Scholar] [CrossRef]
- Zweifel, R.; Haeni, M.; Buchmann, N.; Eugster, W. Are trees able to grow in periods of stem shrinkage? New Phytol. 2016, 211, 839–849. [Google Scholar] [CrossRef] [Green Version]
- Espadafor, M.; Orgaz, F.; Testi, L.; Lorite, I.J.; González-Dugo, V.; Fereres, E. Responses of transpiration and transpiration efficiency of almond trees to moderate water deficits. Sci. Hortic. 2017, 225, 6–14. [Google Scholar] [CrossRef]
- Janbek, B.M.; Stockie, J.M. Asymptotic and numerical analysis of a porous medium model for transpiration-driven sap flow in trees. Siam J. Appl. Math. 2017, 78, 2028–2056. [Google Scholar] [CrossRef]
- Mencuccini, M.; Salmon, Y.; Mitchell, P.; Hölttä, T.; Choat, B.; Meir, P.; O’Grady, A.; Tissue, D.; Zweifel, R.; Sevanto, S.; et al. An empirical method that separates irreversible stem radial growth from bark water content changes in trees: Theory and case studies. Plant Cell Environ. 2017, 40, 290–303. [Google Scholar] [CrossRef]
- Chen, Y.J.; Bongers, F.; Tomlinson, K.; Fan, Z.X.; Lin, H.; Zhang, S.B.; Zheng, Y.L.; Li, Y.P.; Cao, K.F.; Zhang, J.L. Time lags between crown and basal sap flows in tropical lianas and co-occurring trees. Tree Physiol. 2016, 36, 736–747. [Google Scholar] [CrossRef]
- Zegaoui, Z.; Planchais, S.; Cabassa, C.; Djebbar, R.; Belbachir, O.A.; Carol, P. Variation in relative water content, proline accumulation and stress gene expression in two cowpea landraces under drought. J. Plant Physiol. 2017, 218, 26–34. [Google Scholar] [CrossRef] [Green Version]
- Wang, Z.; Zhou, Z.X.; Wang, X.M.; Chen, Z.J. Relationships between transpiration, water loss, and air conditions during physiological drying. Dry Technol. 2018, 36, 245–254. [Google Scholar] [CrossRef]
- Bitterlich, M.; Sandmann, M.; Graefe, J. Arbuscular mycorrhiza alleviates restrictions to substrate water flow and delays transpiration limitation to stronger drought in tomato. Front. Plant Sci. 2018, 9, 154. [Google Scholar] [CrossRef] [PubMed]
- Mares, R.; Barnard, H.R.; Mao, D.Q.; Revil, A.; Singha, K. Examining diel patterns of soil and xylem moisture using electrical resistivity imaging. J. Hydrol. 2016, 536, 327–338. [Google Scholar] [CrossRef] [Green Version]
- Shen, Q.; Gao, G.Y.; Fu, B.J.; Lü, Y.H. Sap flow and water use sources of shelter-belt trees in an arid inland river basin of Northwest China. Ecohydrology 2016, 8, 1446–1458. [Google Scholar] [CrossRef]
- Matheny, A.M.; Bohrer, G.; Garrity, S.R.; Morin, T.H.; Howard, C.J.; Vogel, C.S. Observations of stem water storage in trees of opposing hydraulic strategies. Ecosphere 2015, 6, 1–13. [Google Scholar] [CrossRef]
- Zweifel, R.; Drew, D.M.; Schweingruber, F.; Downes, G.M. Xylem as the main origin of stem radius changes in Eucalyptus. Funct. Plant Biol. 2014, 41, 520–534. [Google Scholar] [CrossRef]
- Oberhuber, W.; Gruber, A. Climatic influences on intra-annual stem radial increment of Pinus sylvestris (L.) exposed to drought. Trees 2010, 24, 887–898. [Google Scholar] [CrossRef] [PubMed] [Green Version]
- Conesa, M.R.; Torres, R.; Domingo, R.; Navarro, H.; Soto, F.; Pérez-Pastor, A. Maximum daily trunk shrinkage and stem water potential reference equations for irrigation scheduling in table grapes. Agric. Water Manag. 2016, 172, 51–61. [Google Scholar] [CrossRef]
- Gallardo, M.; Thompson, R.B.; Valdez, L.C.; Fernández, M.D. Use of stem diameter variations to detect plant water stress in tomato. Irrig. Sci. 2006, 24, 241–255. [Google Scholar] [CrossRef]
- De Swaef, T.; Steppe, K.; Lemeur, R. Determining reference values for stem water potential and maximum daily trunk shrinkage in young apple trees based on plant responses to water deficit. Agric. Water Manag. 2009, 96, 541–550. [Google Scholar] [CrossRef]
- Wang, X.S.; Meng, Z.J.; Chang, X.; Deng, Z.; Li, Y.; Lv, M. Determination of a suitable indicator of tomato water content based on stem diameter variation. Sci. Hortic. 2017, 215, 142–148. [Google Scholar] [CrossRef]
- Chiu, C.W.; Komatsu, H.; Katayama, A.; Otsuki, K. Scaling-up from tree to stand transpiration for a warm-temperate multi-specific broadleaved forest with a wide variation in stem diameter. J. For. Res. 2016, 21, 161–169. [Google Scholar] [CrossRef]
- Deslauriers, A.; Anfodillo, T.; Rossi, S.; Carraro, V. Using simple causal modeling to understand how water and temperature affect daily stem radial variation in trees. Tree Physiol. 2007, 27, 1125–1136. [Google Scholar] [CrossRef] [PubMed] [Green Version]
- Brinkmann, N.; Eugster, W.; Zweifel, R.; Buchmann, N.; Kahmen, A. Temperate tree species show identical response in tree water deficit but different sensitivities in sap flow to summer soil drying. Tree Physiol. 2016, 36, 1508–1519. [Google Scholar] [CrossRef] [PubMed]
- Sánchez-Costa, E.; Poyatos, R.; Sabaté, S. Contrasting growth and water use strategies in four co-occurring Mediterranean tree species revealed by concurrent measurements of sap flow and stem diameter variations. Agric. For. Meteorol. 2015, 207, 24–37. [Google Scholar] [CrossRef] [Green Version]
- Drew, D.M.; Richards, A.E.; Downes, G.M.; Cook, G.D.; Baker, P. The development of seasonal tree water deficit in Callitris intratropica. Tree Physiol. 2011, 31, 953–964. [Google Scholar] [CrossRef] [PubMed] [Green Version]
- Köcher, P.; Horna, V.; Leuschner, C. Environmental control of daily stem growth patterns in five temperate broad-leaved tree species. Tree Physiol. 2012, 32, 1021–1032. [Google Scholar] [CrossRef] [PubMed] [Green Version]
Figure 1.
Location of the study sample plot.
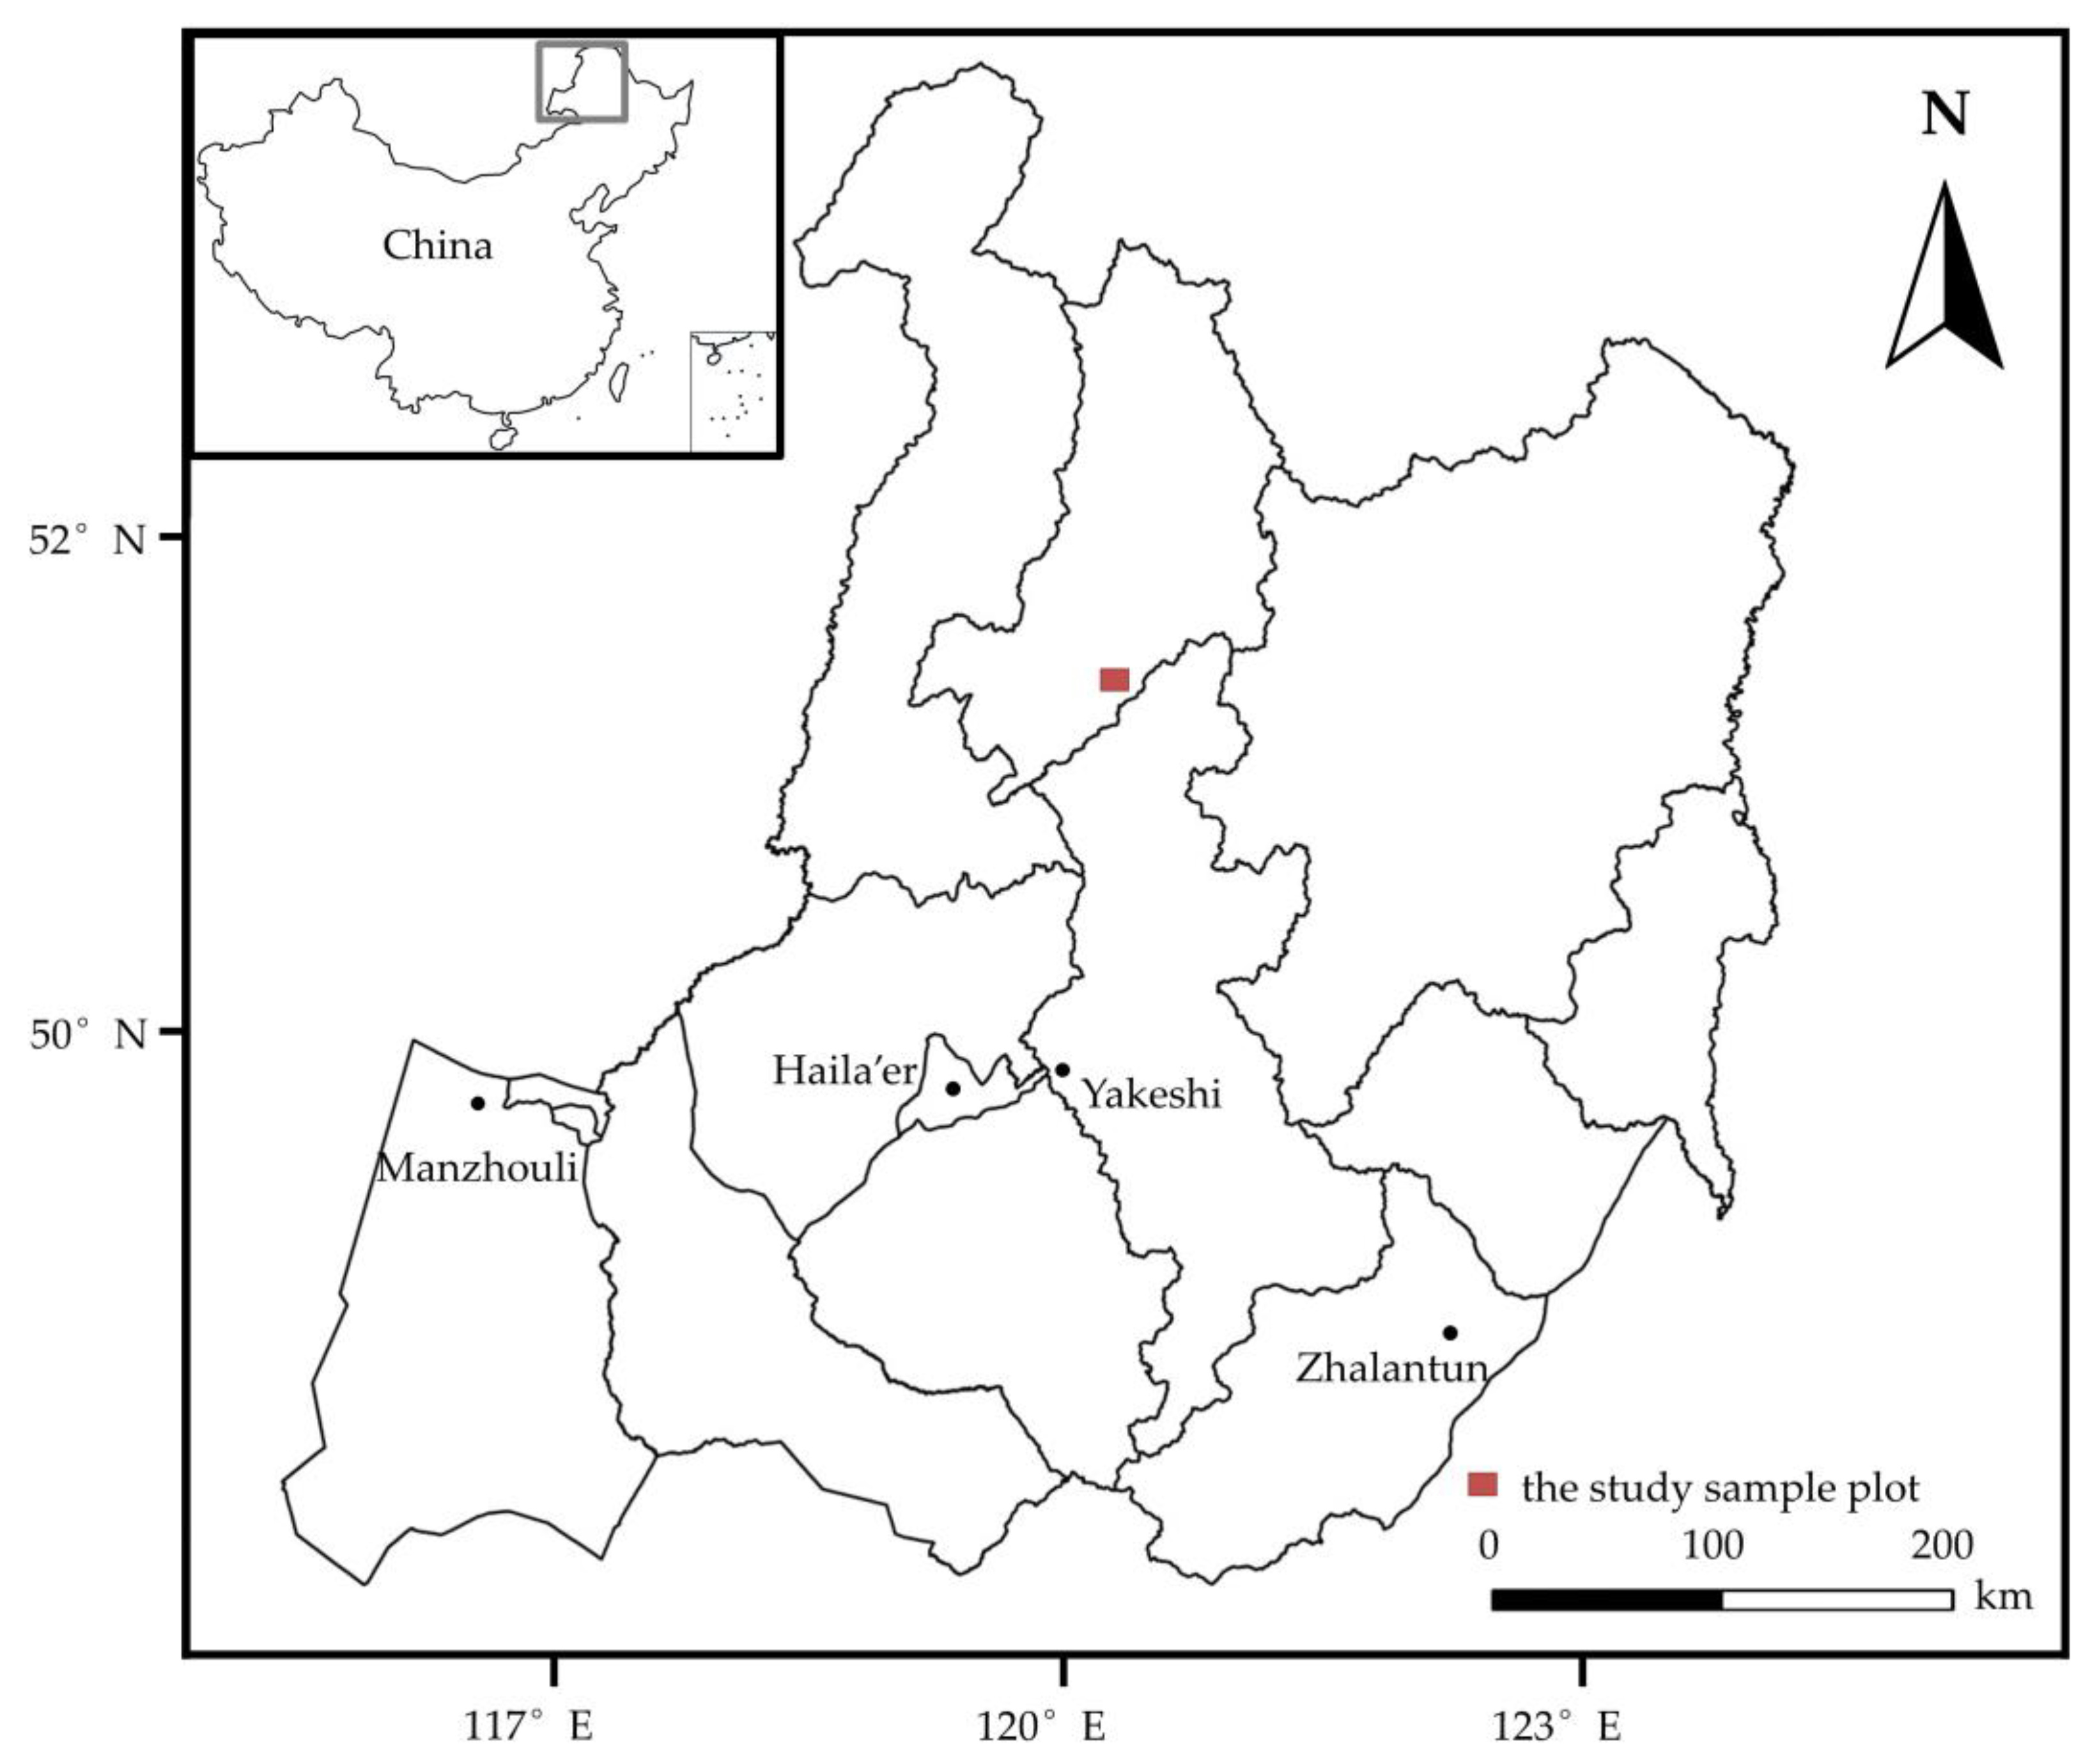
Figure 2.
The trees with the instruments installed on them in the study sample plot.

Figure 3.
Changes in mean and minimum air temperatures and variations in vapor pressure deficit under daily time resolution. DOY: Day of year. Error bars reflect the standard error.
Figure 3.
Changes in mean and minimum air temperatures and variations in vapor pressure deficit under daily time resolution. DOY: Day of year. Error bars reflect the standard error.
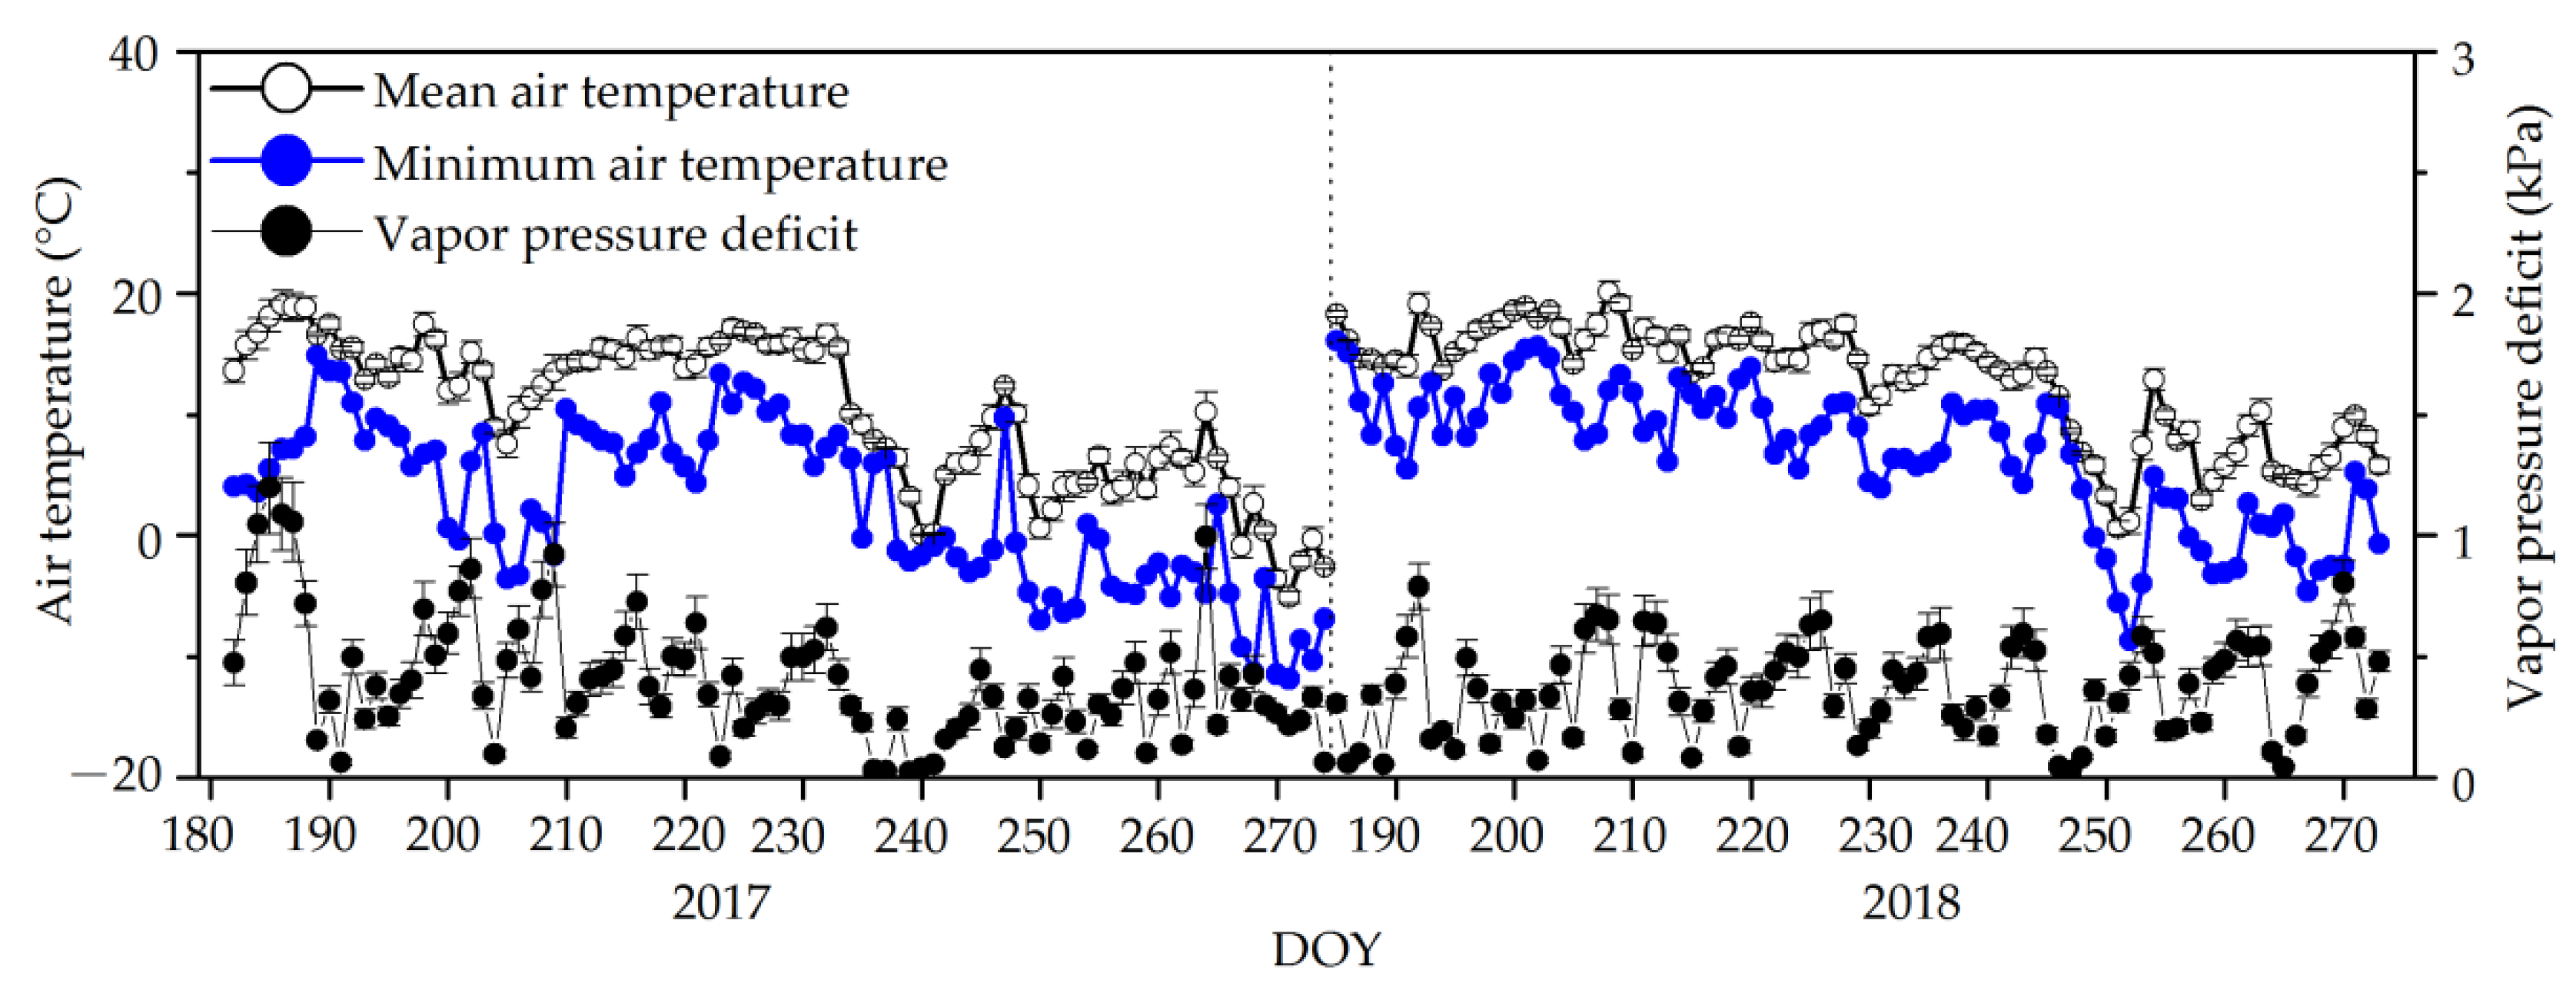
Figure 4.
Seasonal course of total cloud cover under daily time resolution. DOY: Day of year. Error bars reflect the standard error.
Figure 4.
Seasonal course of total cloud cover under daily time resolution. DOY: Day of year. Error bars reflect the standard error.
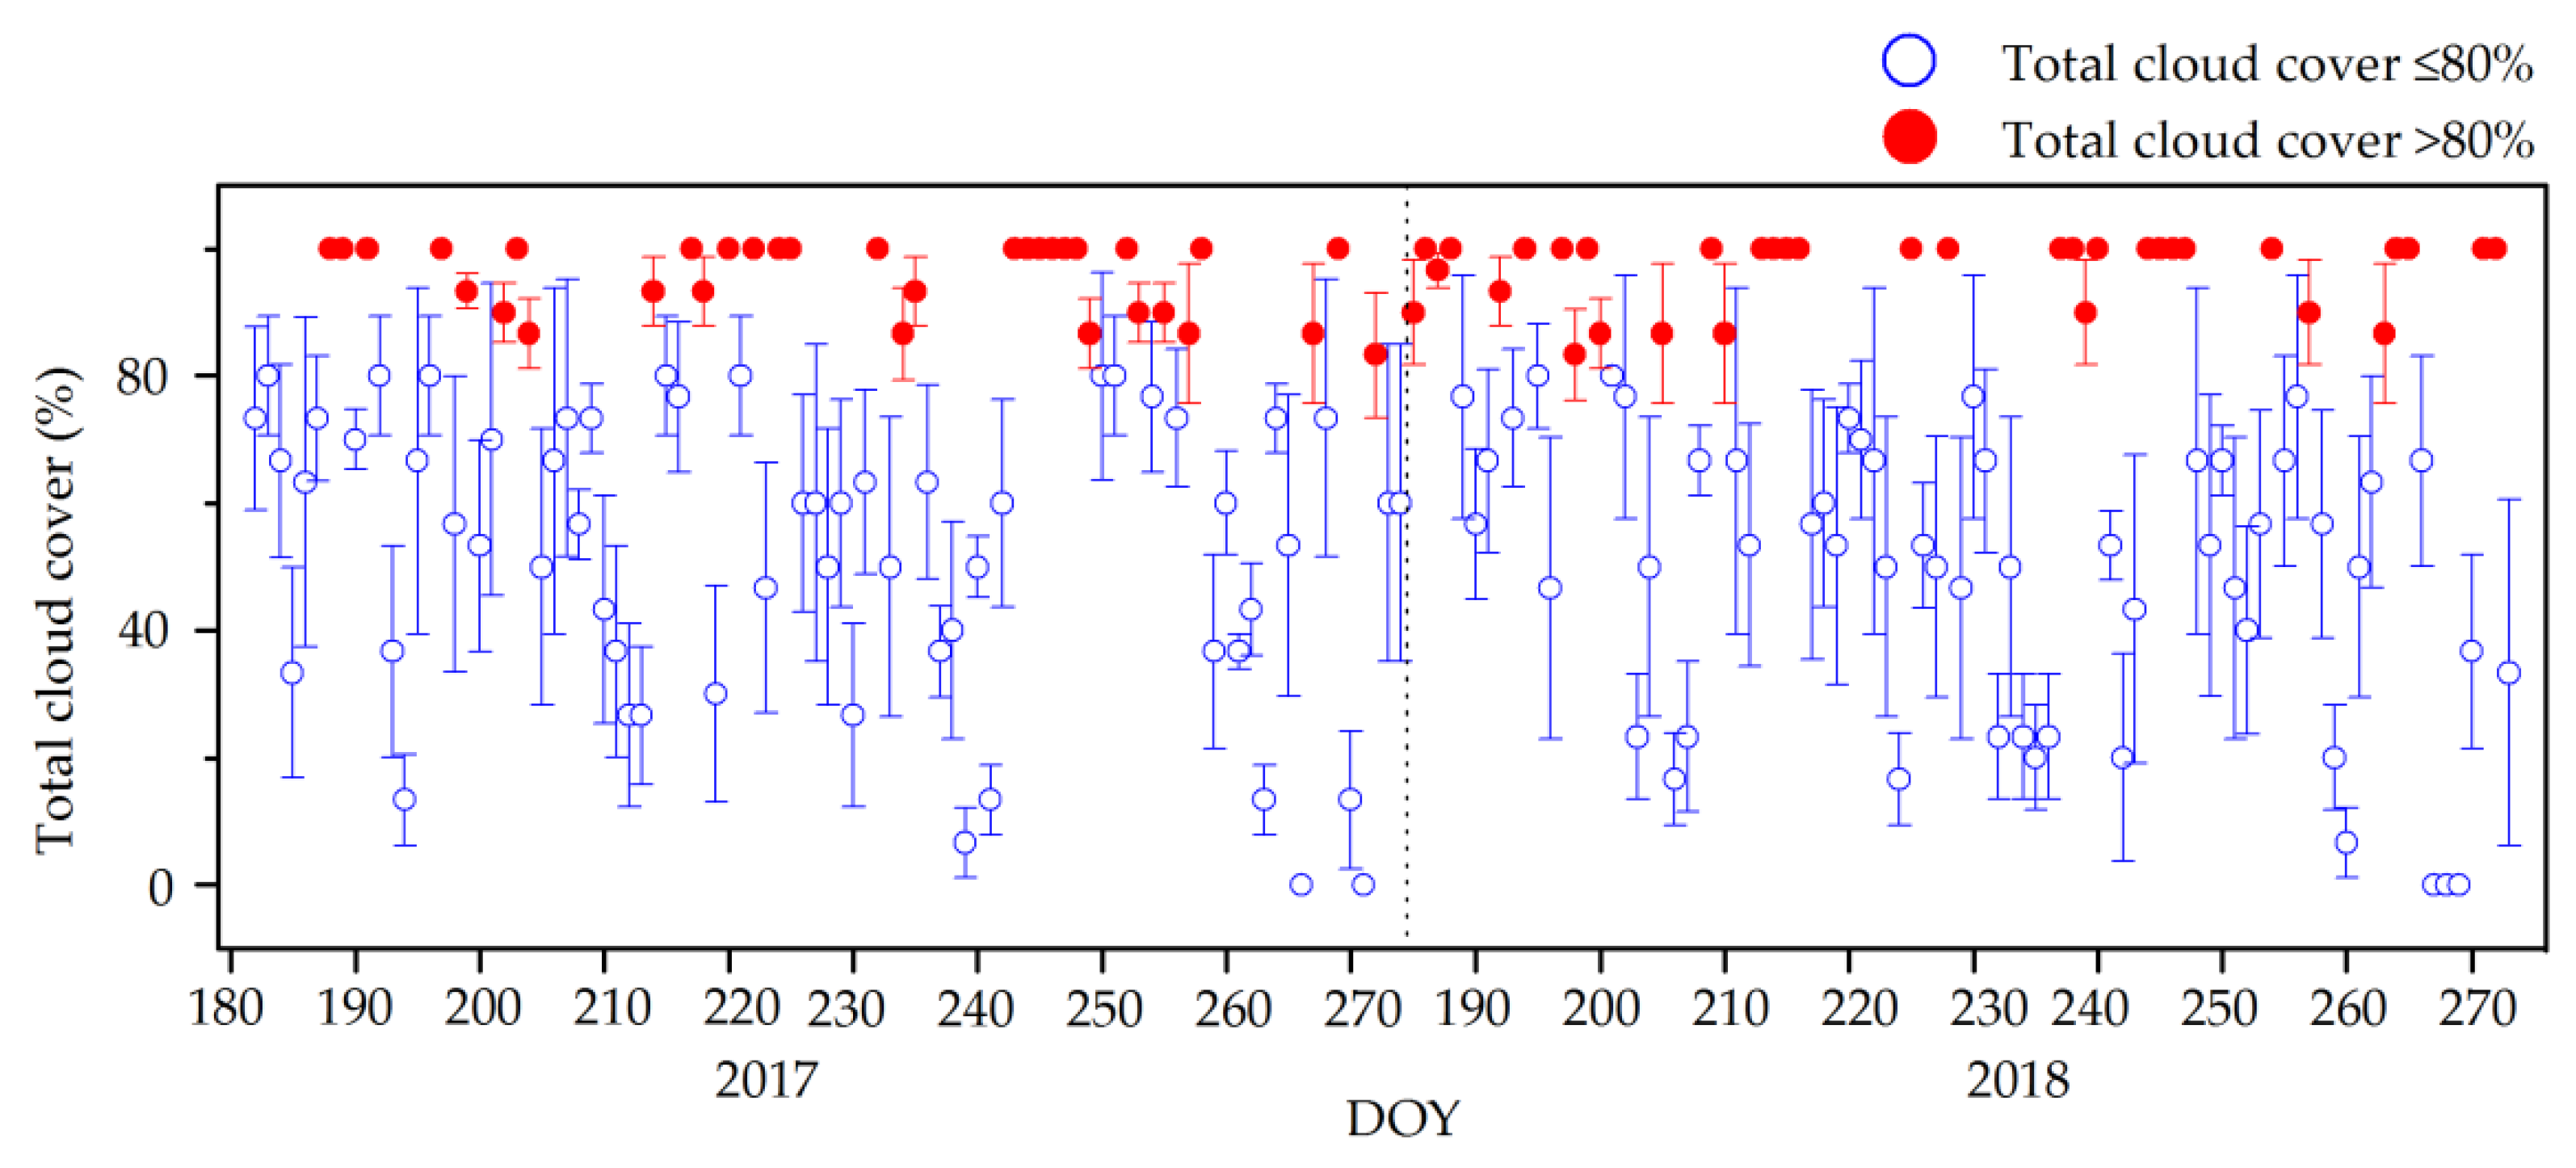
Figure 5.
Daily characteristics of both the tree water deficit-induced stem shrinkage (TWD) and the stem sap flow (Qs) in Dahurian larch on: (a) above 0 °C below 80% cloud cover days, (b) above 0 °C large percentage cloud cover days, (c) low temperature below 80% cloud cover days, and (d) low temperature large percentage cloud cover days. For each temperature and cloudiness condition, four consecutive days were selected to represent the daily variation trends in TWD and stem sap flow. Error bars reflect the standard error.
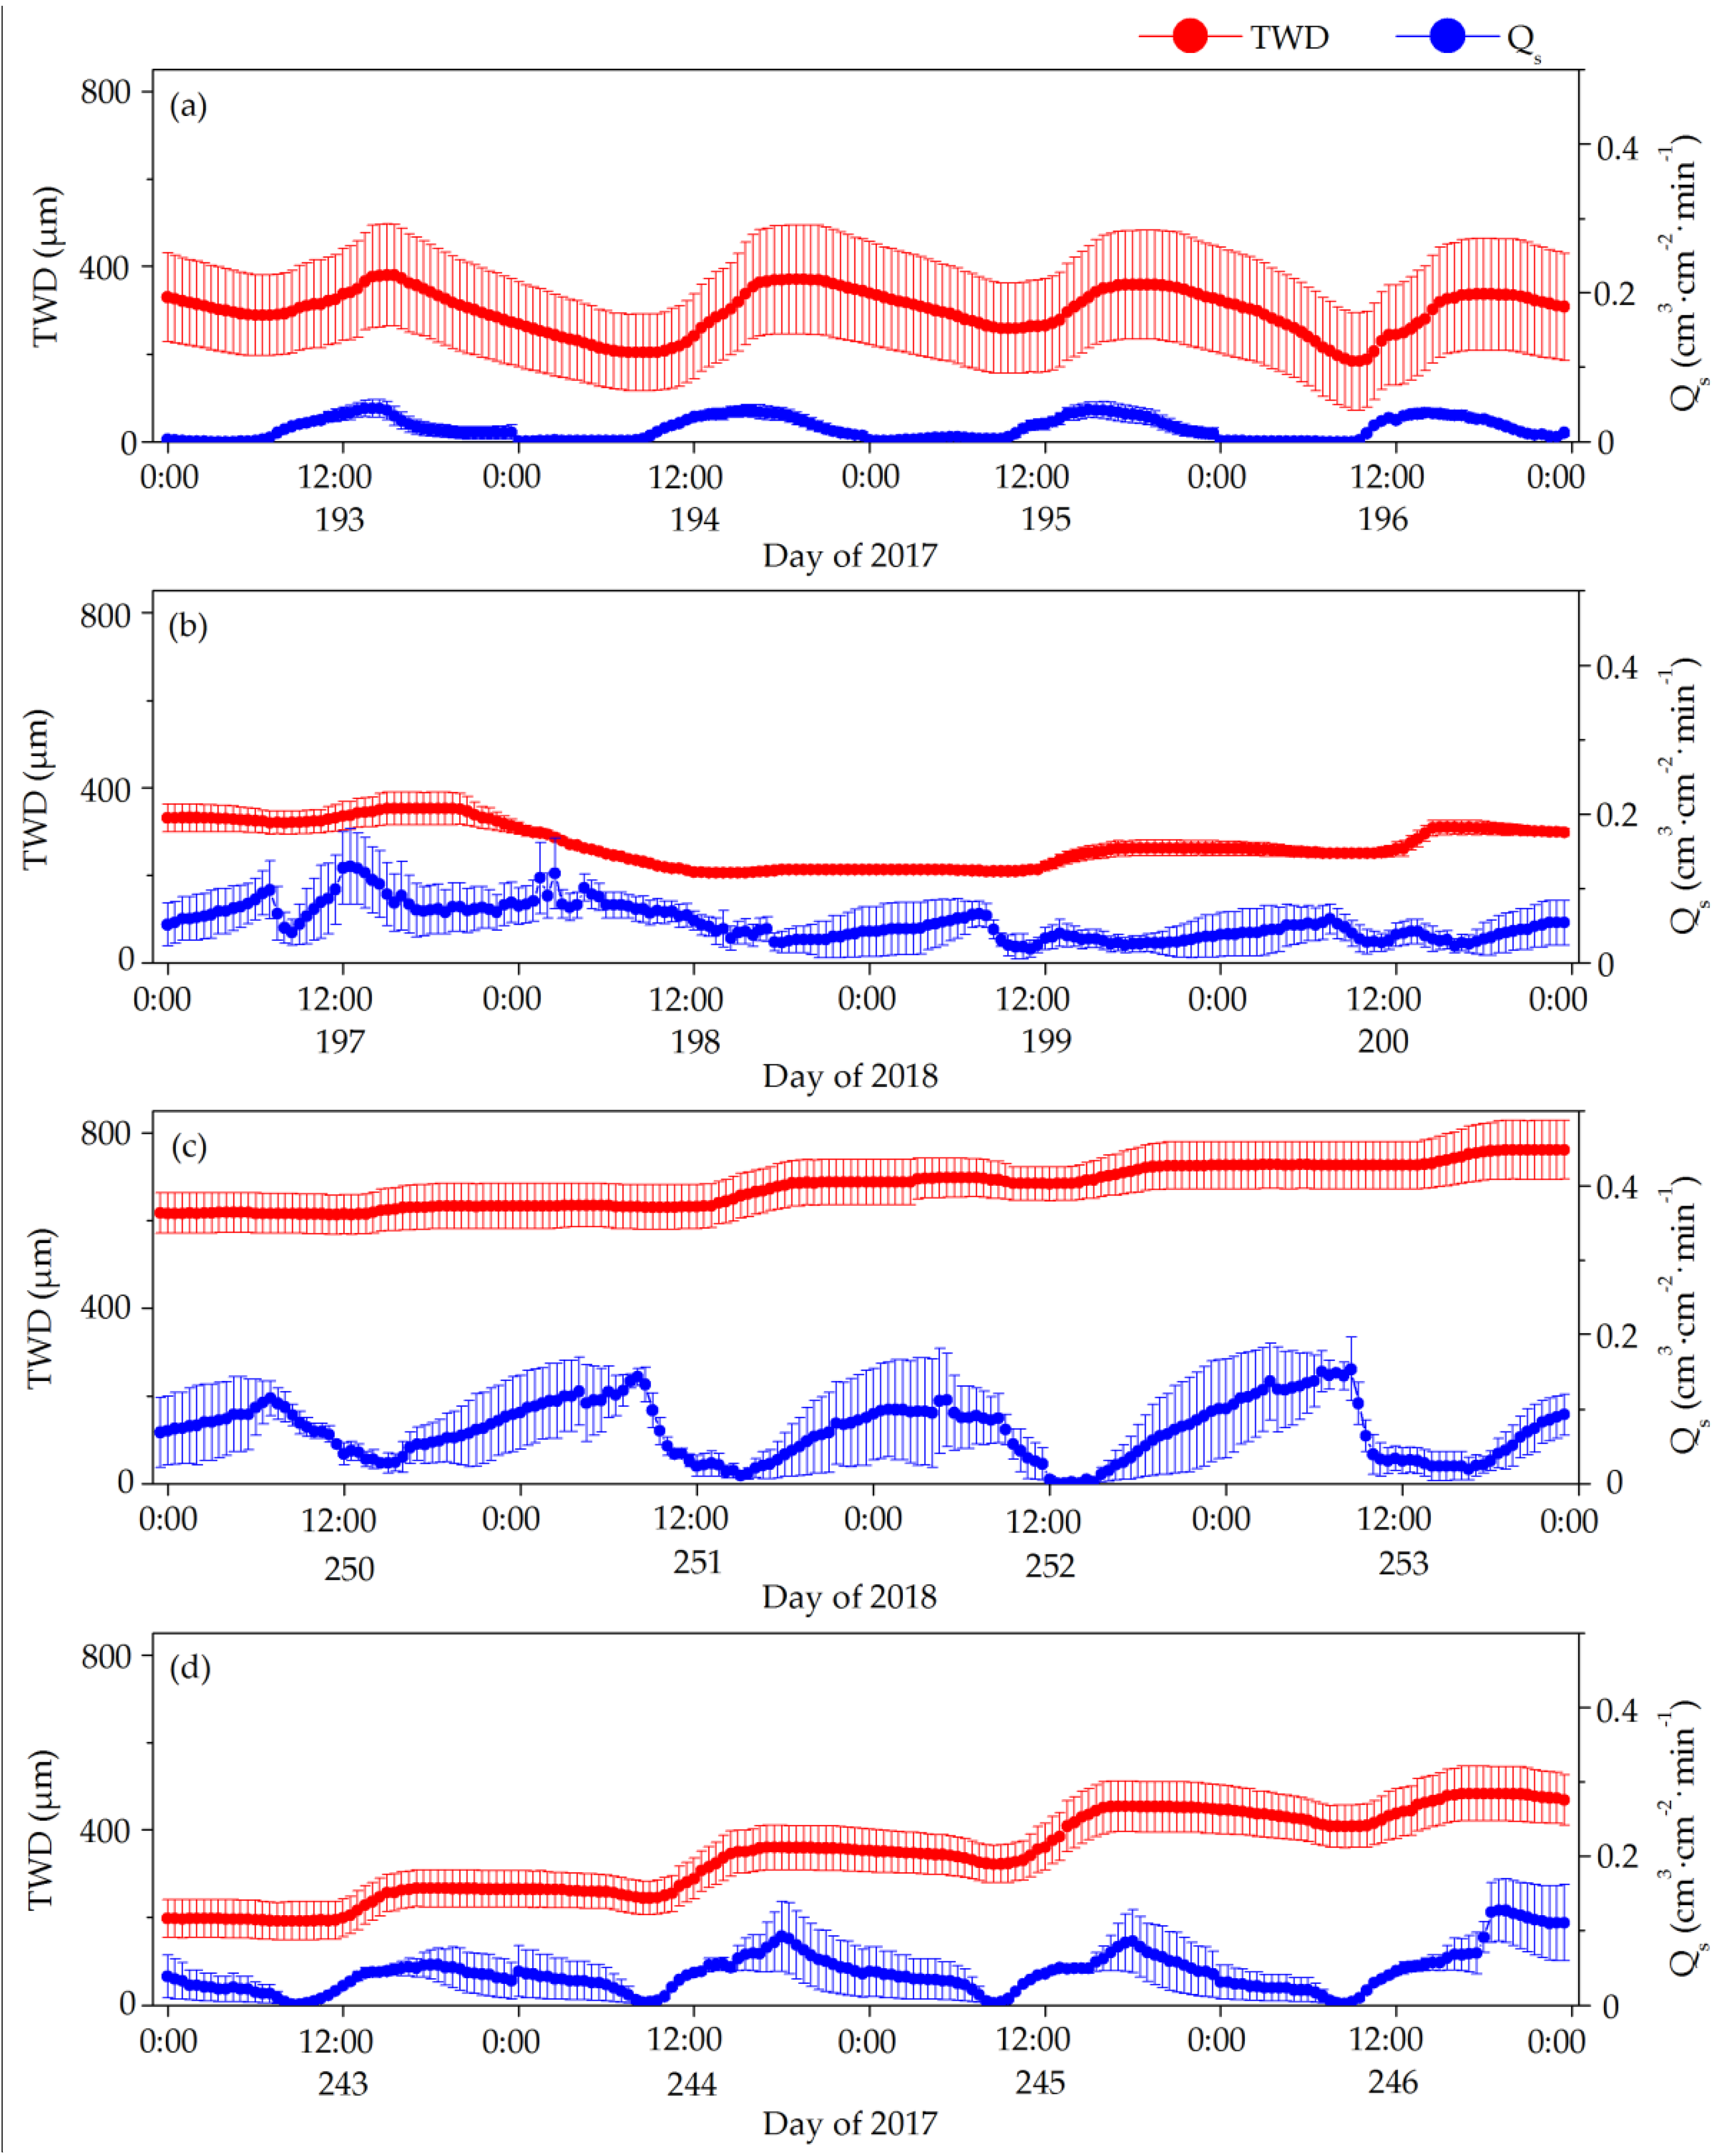
Figure 6.
(a) Changes in maximum daily shrinkage (MDS), (b) daily stem diameter increment (DSDI), (c) daily stem diameter variation (DSDV), (d) stem radius partitioned into tree water deficit-induced stem shrinkage (TWD), and (e) stem sap flow (Qs) under daily time resolution. DOY: Day of year. Error bars reflect the standard error.

Table 1.
Initial characteristics of the sample plot.
| Statistics | Breast Height Diameters (cm) | Tree Height (m) |
|---|---|---|
| maximum value | 46.3 | 25.5 |
| minimum value | 4.3 | 4.2 |
| mean ± SD | 19.6 ± 9.5 | 16.7 ± 5.7 |
| N | 62 | 62 |
Table 2.
The daily mean values of air temperature, total cloud cover, sap flow, and stem diameter shrinkage indicators.
Table 2.
The daily mean values of air temperature, total cloud cover, sap flow, and stem diameter shrinkage indicators.
| Air Temperature and Cloudiness Conditions | Air Temperature (°C) | Total Cloud Cover (%) | Stem Sap Flow (cm3·cm−2) | Maximum Daily Shrinkage (µm) | Daily Stem Diameter Increment (µm) | Daily Stem Diameter Variation (µm) | Tree Water Deficit-induced Stem Shrinkage (µm) |
|---|---|---|---|---|---|---|---|
| Above 0 °C below 80% cloud cover days | 14.5 | 55 | 71.89 | 110 | −10 | −9 | 399 |
| Above 0 °C large percentage cloud cover days | 14.4 | 97 | 89.96 | 92 | 19 | 20 | 441 |
| Low temperature below 80% cloud cover days | 4.4 | 43 | 90.23 | 58 | −19 | −17 | 548 |
| Low temperature large percentage cloud cover days | 5.2 | 94 | 86.42 | 78 | −29 | −37 | 470 |
Table 3.
Relation between the tree water deficit-induced stem shrinkage daily variations and the sap flow daily changes in Dahurian larch.
Table 3.
Relation between the tree water deficit-induced stem shrinkage daily variations and the sap flow daily changes in Dahurian larch.
| Stem Diameter Shrinkage Index | Above 0 °C Below 80% Cloud Cover Days | Above 0 °C Large Percentage Cloud Cover Days | Low Temperature Below 80% Cloud Cover Days | Low Temperature Large Percentage Cloud Cover Days | ||||||||
|---|---|---|---|---|---|---|---|---|---|---|---|---|
| r | p | n | r | p | n | r | p | n | r | p | n | |
| Tree water deficit-induced stem shrinkage | 0.371 | ≤0.001 | 3648 | 0.468 | ≤0.001 | 2448 | 0.389 | ≤0.001 | 1872 | 0.317 | ≤0.001 | 768 |
Significant correlations are in bold.
Table 4.
Comparison of Pearson correlation coefficients between stem diameter shrinkage indicators and sap flow under daily time resolution.
Table 4.
Comparison of Pearson correlation coefficients between stem diameter shrinkage indicators and sap flow under daily time resolution.
| Stem Diameter Shrinkage Indexes | Above 0 °C Below 80% Cloud Cover Days | Above 0 °C Large Percentage Cloud Cover Days | Low Temperature Below 80% Cloud Cover Days | Low Temperature Large Percentage Cloud Cover Days | ||||||||
|---|---|---|---|---|---|---|---|---|---|---|---|---|
| r | p | n | r | p | n | r | p | n | r | p | n | |
| MDS | −0.545 | ≤0.001 | 76 | −0.385 | ≤0.01 | 51 | −0.417 | ≤0.01 | 39 | −0.058 | >0.05 | 16 |
| DSDI | −0.236 | ≤0.05 | 76 | −0.049 | >0.05 | 51 | −0.224 | >0.05 | 39 | −0.064 | >0.05 | 16 |
| DSDV | −0.267 | ≤0.05 | 76 | −0.134 | >0.05 | 51 | −0.153 | >0.05 | 39 | −0.102 | >0.05 | 16 |
| TWD | 0.601 | ≤0.001 | 76 | 0.677 | ≤0.001 | 51 | 0.652 | ≤0.001 | 39 | 0.454 | >0.05 | 16 |
MDS: maximum daily shrinkage; DSDI: daily stem diameter increment; DSDV: daily stem diameter variation; and TWD: tree water deficit-induced stem shrinkage. Significant correlations are in bold.
© 2019 by the authors. Licensee MDPI, Basel, Switzerland. This article is an open access article distributed under the terms and conditions of the Creative Commons Attribution (CC BY) license (http://creativecommons.org/licenses/by/4.0/).
Share and Cite
MDPI and ACS Style
Tian, Y.; Zhang, Q.; Liu, X.; Meng, M.; Wang, B. The Relationship between Stem Diameter Shrinkage and Tree Bole Moisture Loss Due to Transpiration. Forests 2019, 10, 290. https://doi.org/10.3390/f10030290
AMA Style
Tian Y, Zhang Q, Liu X, Meng M, Wang B. The Relationship between Stem Diameter Shrinkage and Tree Bole Moisture Loss Due to Transpiration. Forests. 2019; 10(3):290. https://doi.org/10.3390/f10030290
Chicago/Turabian StyleTian, Yuan, Qiuliang Zhang, Xuan Liu, Meng Meng, and Bing Wang. 2019. "The Relationship between Stem Diameter Shrinkage and Tree Bole Moisture Loss Due to Transpiration" Forests 10, no. 3: 290. https://doi.org/10.3390/f10030290
Note that from the first issue of 2016, this journal uses article numbers instead of page numbers. See further details here.