Twenty-Five Years of Aboveground Biomass and Carbon Accumulation Following Extreme Wind Damage in an Old-Growth Forest


Department of Plant Biology, University of Georgia, Athens, GA 30602, USA
Forests 2019, 10(3), 289; https://doi.org/10.3390/f10030289
Submission received: 25 January 2019
/
Revised: 4 March 2019
/
Accepted: 21 March 2019
/
Published: 23 March 2019
(This article belongs to the Special Issue Characterization and Regionalization of Disturbance Regimes Affecting Forests)
Abstract
:Modeling of carbon dynamics at the landscape, regional, and continental scales is currently limited by few empirical studies of biomass and carbon accumulation after some types of disturbances. For temperate forests of North America, only three previous studies described biomass and carbon accumulation after wind disturbances, and those were limited by either coarse temporal resolution of the first several decades, or limited time span. Here, 25 years of aboveground biomass and carbon accumulation following severe wind disturbance of an old-growth hemlock-northern hardwoods forest of northwestern Pennsylvania are documented to characterize the temporal trends with fine temporal resolution and extend into the third decade post-disturbance. Mature undisturbed forest at the site supported roughly 296 Mg ha−1 live aboveground biomass and 148 Mg ha−1 of carbon. The disturbance reduced the aboveground woody biomass to ~7 Mg ha−1, and carbon to ~3.5 Mg ha−1. During regrowth, biomass and carbon accumulated slowly at first (e.g., 2–4 Mg ha−1 year−1 for biomass and 1–2 Mg ha−1 year−1 for carbon), but at increasing rates up through approximately 17 years post-disturbance, after which accumulation slowed somewhat to roughly 3.4 Mg ha−1 year−1 of biomass and 1.7 Mg ha−1 year−1 of carbon. It appears that the rates reported here are similar to rates observed after wind disturbance of other temperate forests, but slower than accumulation in some tropical systems. Notably, in tropical forests, post-windthrow accumulation is often very rapid in the first decade followed by decreases, while in the results reported here, there was slow accumulation in the first several years that increased in the second decade and then subsequently slowed.
1. Introduction
Forests of North America have recently been a carbon sink, with a net uptake of 217 Tg (teragrams) carbon (C) per year [1]. This valuable C sink may change in the coming decades as forests transition from middle to late successional stages [2], and if climate change alters disturbance regimes and therefore forest stand age distributions [1,3]. Shorter intervals between disturbances would cause a greater fraction of a forested landscape to be in early recovery, or equivalently, a greater fraction of centennial or millennial time scales to be spent in the first decades after disturbance. Under such a scenario, the rate of post-disturbance increase in net primary productivity (NPP) will strongly influence short term C storage in the recovering forest.
In addition to temporal trends with stand age, the type of disturbance is likely to be a major influence on C dynamics during recovery [4]. Although biomass and C accumulation, as well as NPP and net ecosystem production, have been widely characterized after harvesting, insect outbreaks, and fire [4,5,6,7], these quantities have seldom been reported for more than short time intervals after wind disturbances. Unquestionably, an abundance of post-wind recovery research reports trends in species composition, density, and basal area over time [8,9], but few of those studies allow estimation of C cycle components. Indeed, in a review by [5] for North American forests, the single integrated C flux study discussed was in a Florida mangrove system [10,11,12]. Several authors have examined contemporary or historical hurricane events to estimate the amount of C transferred from living biomass to necromass [13,14,15], but have not addressed recovery dynamics. For North American terrestrial forests, the reporting of temporal trends in biomass and C accumulation after wind disturbance rests on two studies [16,17]. Available accumulation information is slightly better for Central and South American tropical forests [18,19,20,21,22], and in Japan [23,24,25], while still very limited in Europe [26]. A number of eddy covariance studies after wind disturbance in North America [10,11,12] and Europe [27,28,29,30,31] report integrated C cycle components, such as net ecosystem productivity or net ecosystem exchange, but do not present biomass or C accumulation.
Addressing such scarcity of the available data will contribute to improved modelling of the C cycle in forests after disturbance. Empirical work, such as that reported here, can provide both inputs to C cycle models, as well as tests of model predictions. Currently, modelling of the C cycle after wind disturbance is limited by empirical field data [1,7,32]; extrapolating from pools and fluxes measured after other types of disturbances is risky because the impact of various types of disturbances on C transfer among pools and environmental change (in turn affecting flux rates) is distinct for each type of disturbance.
Considering the above, the primary objective of this report is to present the aboveground woody biomass and C accumulation across 25 years in a Pennsylvania hemlock-northern hardwood forest following a catastrophic wind disturbance. Biomass and C accumulation rates are assumed to be reliable surrogates for NPP. If true, then the biomass and C accumulation rates may further suggest trends in the net ecosystem exchange, since a solid body of research indicates that heterotrophic respiration does not greatly change during the first several decades of forest recovery [4,7].
2. Materials and Methods
2.1. Study Site
The study site is an old-growth, primary forest preserve (the Tionesta Scenic Area) within Allegheny National Forest of northwestern Pennsylvania (41.663° N, 78.946° W). Dominant woody vegetation at the time of disturbance was Fagus grandifolia Ehrh. (American beech) and Tsuga canadensis L (Eastern hemlock), with smaller components of Acer saccharum Marshall (sugar maple), Betula alleghaniensis Britton (yellow birch), Betula lenta L. (sweet birch), Prunus serotina Ehrh. (black cherry), and Acer rubrum L (red maple). Soils of the Tionesta site are moderately well drained Cavode silt loams, 66–91 cm deep (soil descriptions based on the U.S. Soil Taxonomy); these are fine-loamy, mixed, mesic Aquic Fragiudults. The site has a mean annual temperature of 6.8 °C and mean annual precipitation of 1188 mm [33]. It was disturbed on 30 May 1985, by an exceptionally large F4-rated tornado (tornado intensity prior to 2007 was ranked F0 (lowest intensity) to F5 (highest intensity)), which caused nearly complete canopy destruction across a 700–900 m wide swath (Figure 1) [34]. A variety of aspects of tree damage, vegetation dynamics, and recovery after the 1985 event have been reported elsewhere [34,35,36,37,38,39,40].
Historical information confirms the study area is a true primary, old-growth forest that had been free of major disturbance for at least several centuries [33,41,42]. However, from the early 20th century through to the early 2000s, it was subject to intense deer browsing, resulting in an understory woody community of low density and dominated by Fagus grandifolia of vegetative origin (i.e., root sprouts or suckers) and very sparse Acer rubrum and Tsuga canadensis [38,40,43].
2.2. Methods
2.2.1. Field Sampling
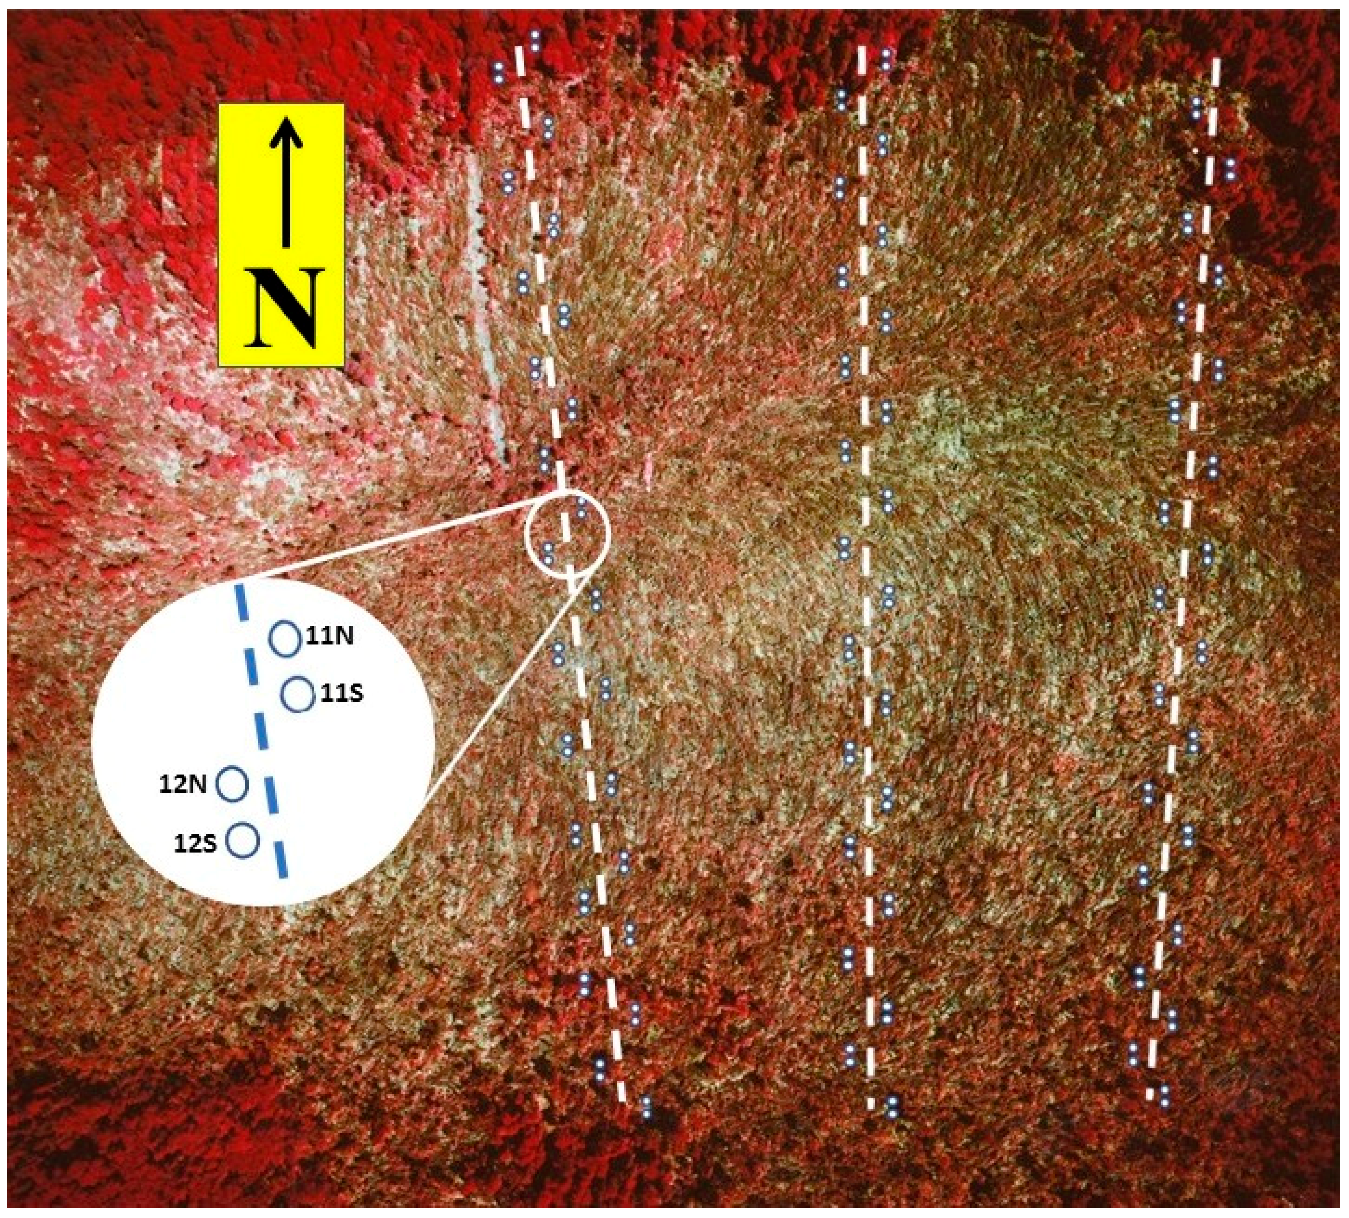
The surviving (standing) pre-disturbance woody vegetation was sampled in 1986 using the point-centered quarter method. 141 points were distributed along three north-south oriented transects that spanned the tornado damage swath (Figure 1); all points were within areas subjectively classified as damaged. At each of these random points, the nearest live standing woody stem >5 cm dbh (diameter breast height, or 1.4 m) and within 6.0 m of the point was recorded in each of the four quadrants.
Sampling of regeneration during the first 8 years was carried out in 0.5 m2 quadrats, arranged on the same three north-south transects (Figure 1). The first and last few quadrats on each transect were in intact forest, leaving 289 quadrats in the disturbed area; the results reported here will be based on these 289 quadrats. Spatial distribution of the quadrats was stratified random, with two quadrats positioned in a pair randomly within each 20 m segment of each transect. Quadrat numbering was based on the location relative to the north end of the transect as well as a designation of ‘north’ or ‘south’ within each pair, e.g., the first pair was 1N and 1S, the second pair was 2N and 2S, etc. Quadrats were sampled annually from 1987 to 1991, and in 1993, 1997, and 1999 in August; composition and other community-level characteristics through 1991 were reported in [34]. During each sampling, all woody stems were tagged, identified to species, and measured for height (some stems may have been of vegetative origin; the term, ‘regeneration’, refers to small stems regardless of origin). Regeneration stems >300 cm tall were measured for trunk diameter (cm) at 1.4 m (dbh).
After 1999, regeneration stems had grown sufficiently large and had undergone competitive thinning such that sampling in the 0.5 m2 quadrats was discontinued. Instead, in 2002, 58 larger quadrats of 28.27 m2 (3 m radius) were sampled. These were superimposed over the north 0.5 m2 quadrat of even-numbered quadrat pairs (e.g., quadrats 2N, 4N, etc.) along the center and west transects described above. The same 3 m radius quadrats were sampled a final time in 2010; thus, the 2002 and 2010 sampling was based on the same location, size, and number of quadrats, and since the larger quadrats were superimposed over a subset of the smaller (original) quadrats, there was substantial spatial overlap between the two sampling regimes. This represents a roughly 11-fold increase in area sampled over the original 0.5 m2 quadrats, despite the reduced number. All woody stems (regeneration or pre-disturbance survivors) >2 m tall and within the enlarged quadrat boundaries were measured for dbh (trunk diameter at 1.4 m), and identified to species. In 2002, all sampled stems were classified as regeneration or pre-disturbance survivors, but by 2010, this distinction was no longer possible.
2.2.2. Estimation of Intact Forest Aboveground Biomass
Estimation of pre-disturbance aboveground biomass (AGB) was based on the adjacent Tionesta Research Natural Area, which served as a reference site that was not disturbed by the tornado. This nearby site had identical climate, soils, elevation, and management history, as well as very similar species composition and size distributions; therefore, it was considered a suitable reference stand, and used to estimate pre-disturbance biomass and carbon for the Tionesta Scenic Area impacted by the 1985 tornado [33]. Complete inventory of 2.50 ha was carried out in the reference stand, including the mapping of x, y coordinates, of all woody stems >5 cm dbh; this sampling was done in 1996 as part of the research reported in [39]. Tree dbh was converted to aboveground biomass with the species-specific equations of [44] and per ha values were calculated (Table 1). Note that throughout this paper, AGB refers to the biomass in woody, arborescent species; the herbaceous layer is sparse and would contribute miniscule amounts to the total.
2.2.3. Estimation of Survivor Tree Biomass
Because of the extreme severity of wind damage, many point-centered quarter quadrants had no stem within 6.0 m and were therefore recorded as blanks; Warde and Petranka’s [45] correction factor was employed to avoid statistical biases in the calculation of the stem density. On this basis, the total density of surviving trees >5 cm dbh was estimated as 63.4 stems ha−1. The AGB of live standing (survivor) stems was estimated as follows. The AGB was calculated for each of the observed trees (n = 86) using observed dbh and species-specific allometric equations from [44]; the total AGB for observed survivor trees was 9.643 Mg. The area sampled in the point-quarter sampling was 1.481 ha, therefore, to convert to per-hectare AGB, the total AGB was multiplied by 0.737 (1.0/1.481), yielding an AGB biomass estimate for survivors of 7.11 Mg ha−1.
2.2.4. Estimation of Regeneration Biomass
For data from the small quadrats, the aboveground biomass was calculated for each seedling >25 cm tall on the basis of its height, using equations developed from the harvesting of small stems (~25–300 cm tall) of common species in Allegheny National Forest (A. Royo et al. unpublished data; Table 1). For seedlings >300 cm tall, but <10 cm dbh, allometric equations from [46] were used to calculate the aboveground biomass. The formulas from [44] were used to calculate the biomass of any stems >10 cm dbh. Aboveground biomass was summed for the 0.5 m2 quadrats and multiplied by 20,000 to obtain values per hectare. For data from 2002 and 2010, the aboveground biomass was calculated based on stem diameter, using species-specific formulas from [46] for saplings (>300 cm tall, but <10 cm dbh) and [44] for stems >10 cm diameter (Table 1). Totals per 3-m radius quadrat (28.27 m2) were multiplied by 353.7 to obtain values per hectare. Subsequently, for all totals, the aboveground biomass was converted to carbon by multiplying by 0.5.
3. Results
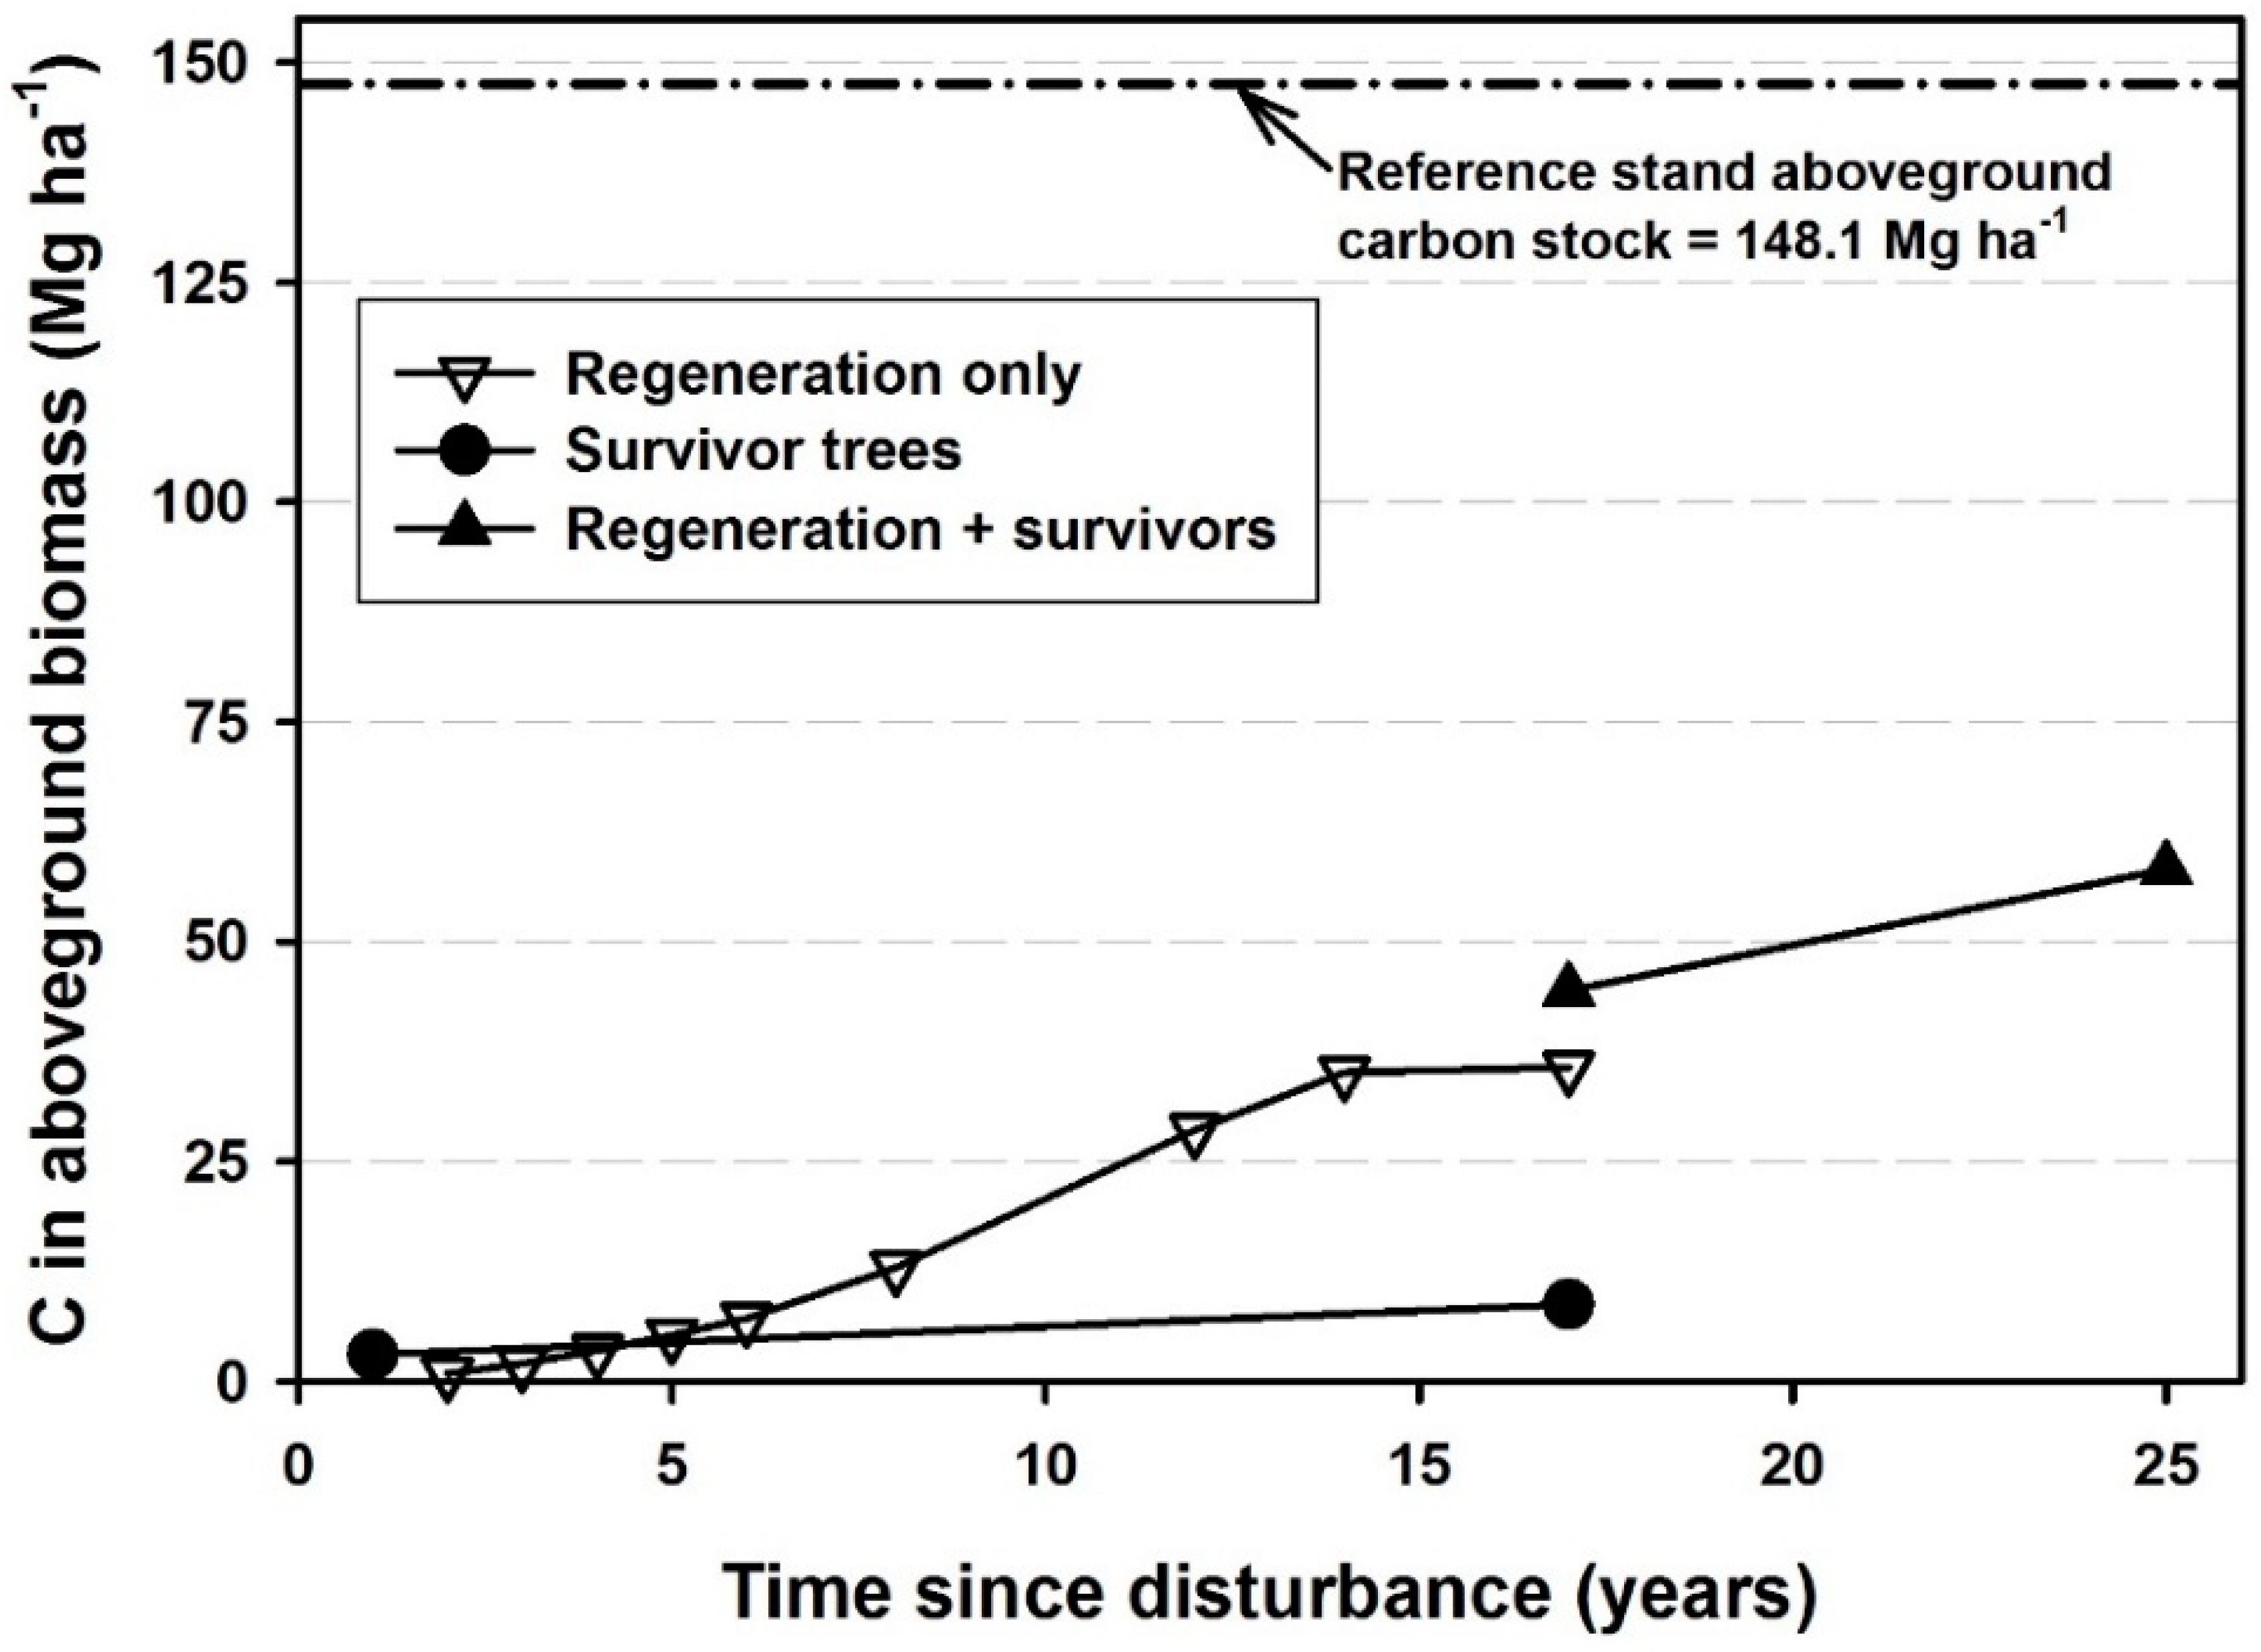
Intact forest in the reference stand (Tionesta Research Natural Area) supported 296.2 Mg ha−1 of biomass and 148.1 Mg ha−1 of carbon (Figure 2). Localized biomass reached exceptionally high values, occasionally exceeding 1000 Mg ha−1 at the 100 m2 scale.
One year after the disturbance, surviving trees >5 cm dbh made up 7.11 Mg ha−1 of biomass and 3.55 Mg ha−1 of carbon, nearly half of which was Fagus grandifolia. Regeneration biomass increased from 1.84 Mg ha−1 in 1987 (2 years post-disturbance) to 25.9 Mg ha−1 in 1993 (8 years post-disturbance); it reached 70.3 Mg ha−1 in 1999 (analogous amounts for carbon are 0.92, 12.95, and 35.15 Mg ha−1; Figure 2). Regeneration stems in the larger quadrats sampled in 2002 totaled 71.39 Mg ha−1 of biomass and 35.7 Mg ha−1 of carbon. Regeneration and surviving stems together totaled 88.9 Mg ha−1 by 2002, and 116.5 Mg ha−1 by 2010, equivalent to 44.45 and 58.25 Mg ha−1 of carbon, respectively. The difference between the total AGB and regeneration AGB in 2002 is the AGB of survivors, which was 17.5 Mg ha−1, equivalent to 8.75 Mg ha−1 of carbon. Based on the AGB increasing from 7.1 Mg ha−1 immediately after the disturbance to 116.5 Mg ha−1, or 39% of the intact forest in the 25th year after disturbance, it is likely that biomass and carbon levels would reach one half of the intact forest levels after an additional 7 years, or 32 years post-disturbance.
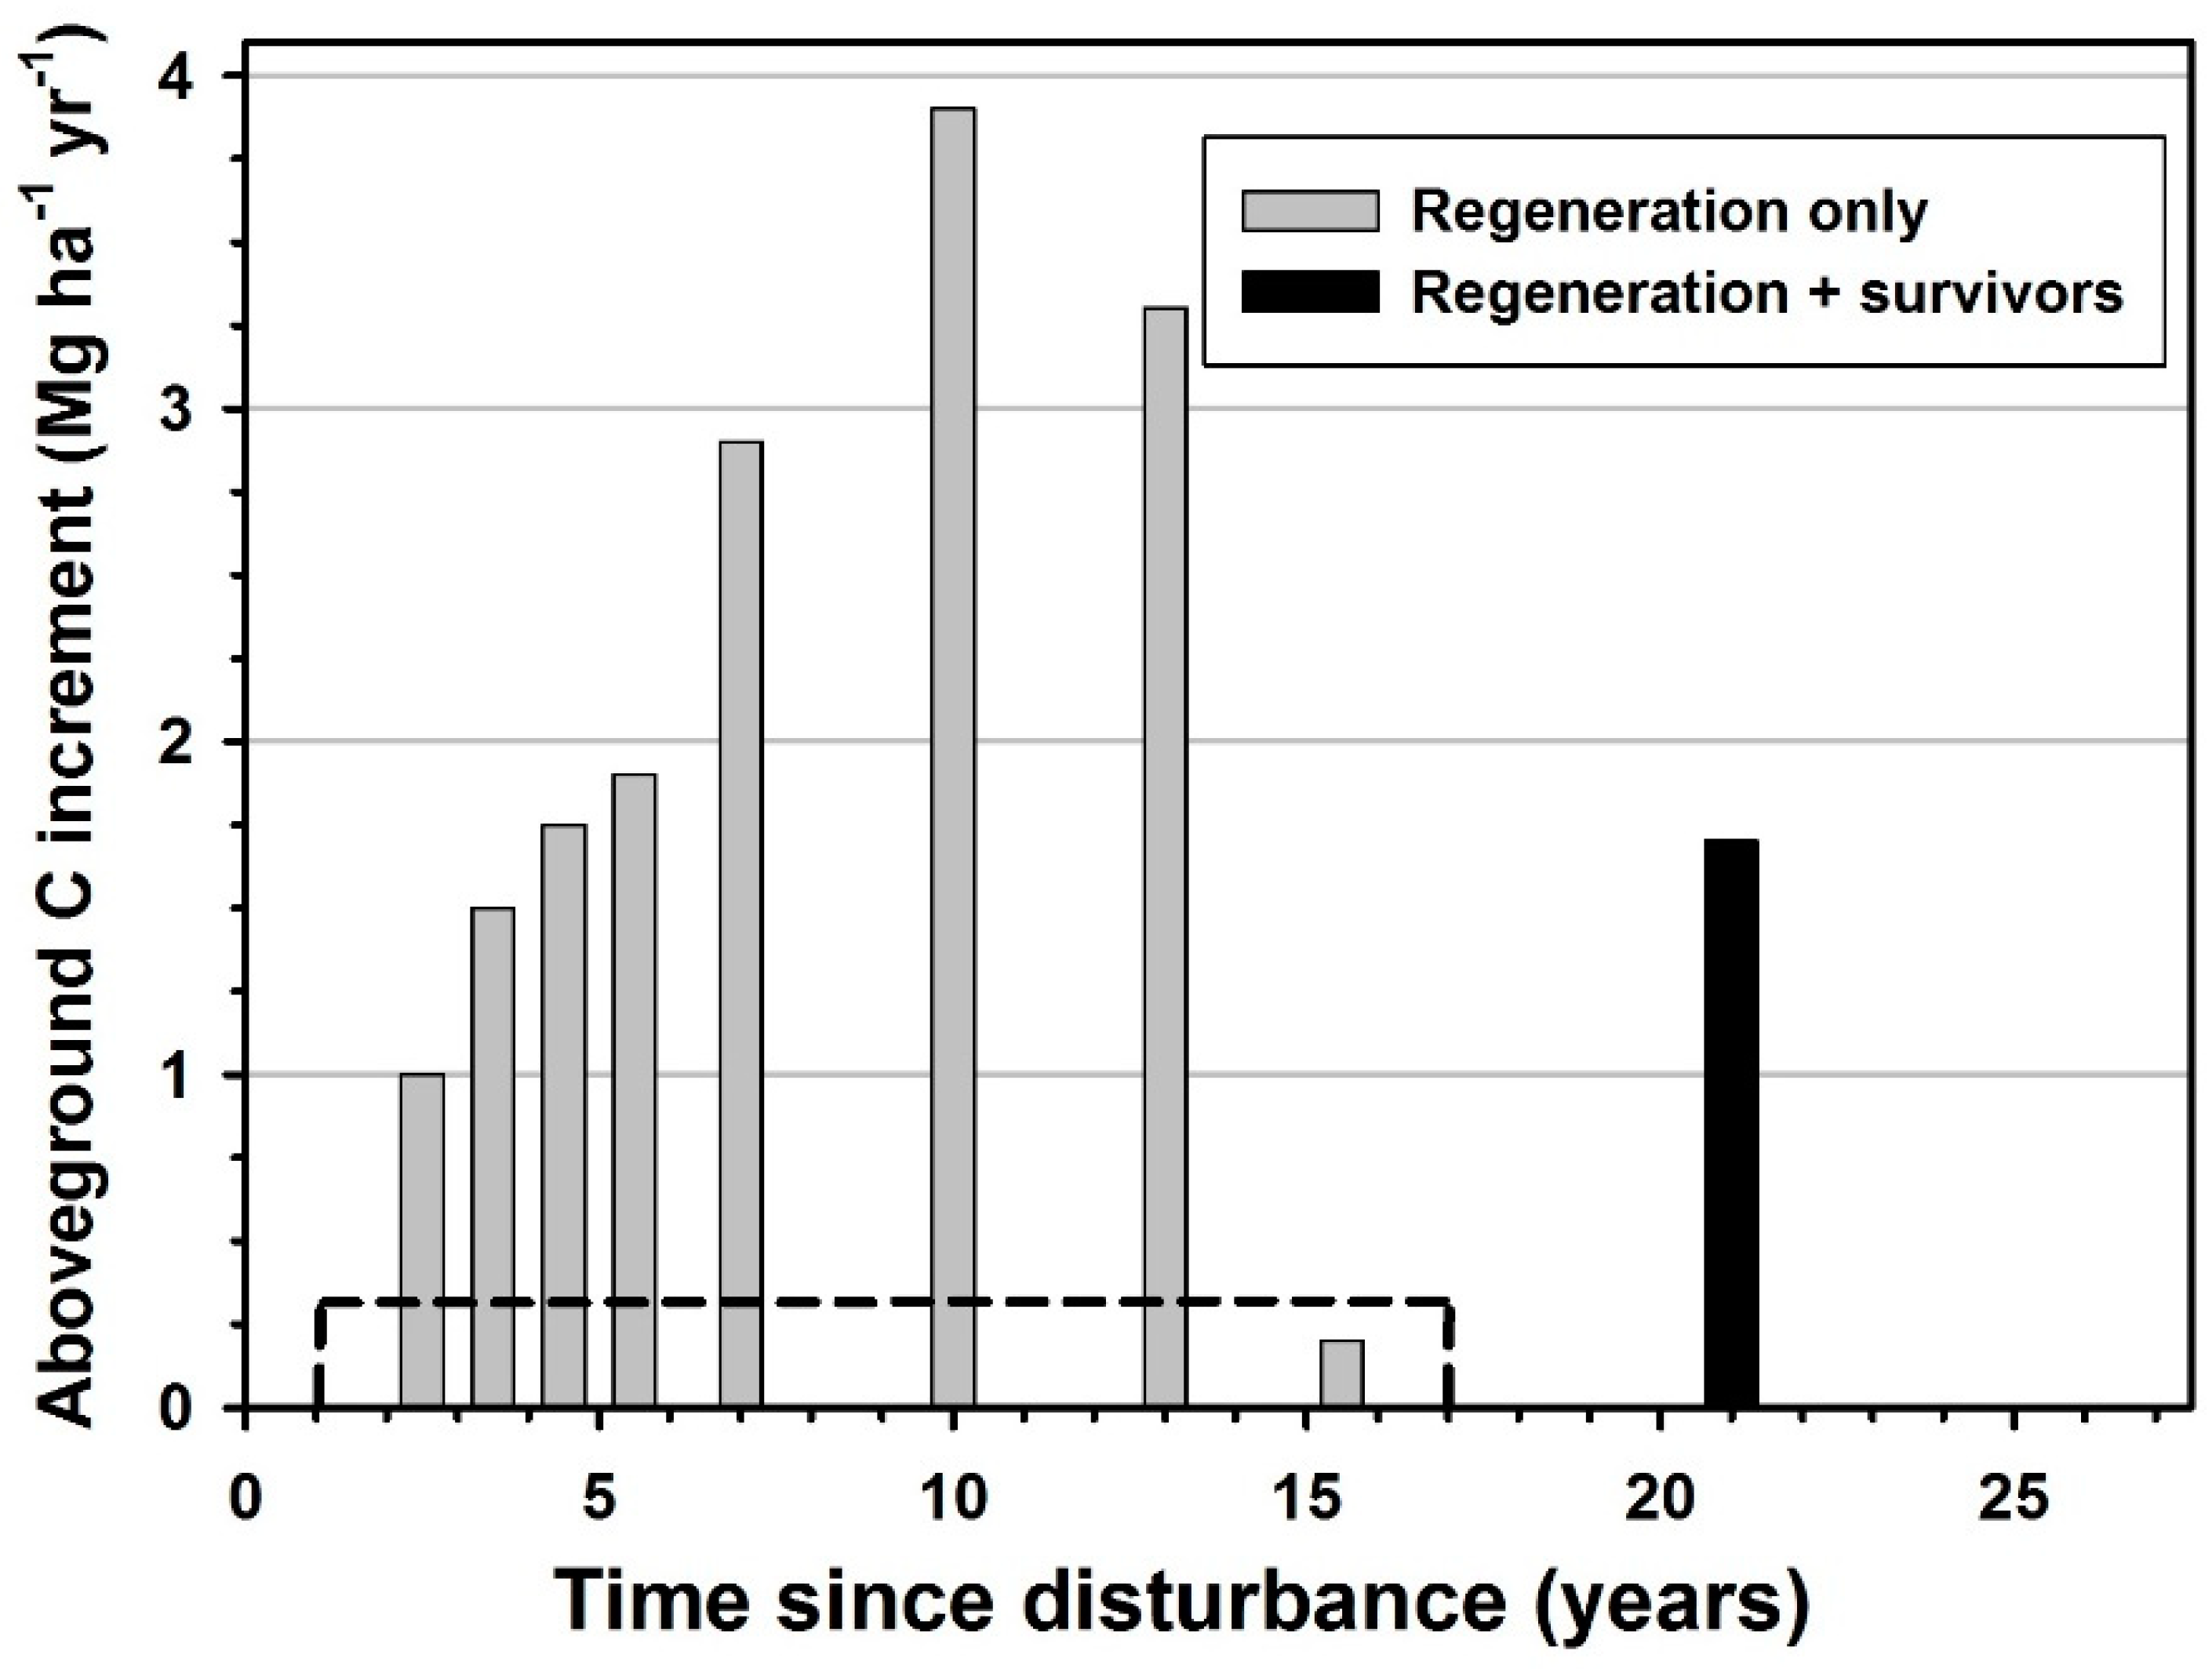
The annual increment in aboveground biomass and carbon of necessity was calculated for both single-year and multi-year time intervals. Nonetheless, annual increment clearly showed a slow start, rapid increase, and then gradual decrease after 20 years (Figure 3). Throughout the 25 years post-disturbance, the regeneration increment was 2.0 Mg ha−1 biomass and 1.0 Mg ha−1 carbon in years 2 to 3, but increased to 5.8 Mg ha−1 biomass and 2.9 Mg ha−1 carbon during years 6 to 8. The highest regeneration increment in the study period was between years 8 and 15, when biomass increased more than 6.5 Mg ha−1 year−1 and carbon increased more than 3.2 Mg ha−1 year−1. Based on the survivor biomass of 7.11 Mg ha−1 in 1986 and 17.5 Mg ha−1 in 2002, survivors had added 10.39 Mg ha−1 during 16 years, or 0.65 Mg ha−1 year−1 of biomass and 0.32 Mg ha−1 year−1 of carbon (Figure 3). The abnormally low biomass and carbon increment of regeneration between years 14 and 17 is very likely an artifact of the regeneration stems becoming very large and sparse relative to the size of the 0.5 m2 survey quadrats by year 14 (1999) and after. The increasing stem size and numerous quadrats with no stems would lead to potential overestimation of the biomass if especially robust regeneration occurred in those quadrats still retaining stems in year 14.
4. Discussion
The pre-disturbance old-growth forest at Tionesta supported a substantial amount of aboveground biomass, comparing favorably to the upper-limit values from old-growth hemlock-white pine stands described in [16,47,48]. Even higher values can be found in smaller plots (e.g., 10 m × 10 m [6]). The values more than 1000 Mg ha−1 observed for the undisturbed reference stand at Tionesta are among the highest reported for eastern North America. Other mature or primary hemlock-northern hardwoods forests in eastern North America have aboveground biomass levels ranging from 104 Mg ha−1 to 569 Mg ha−1 [48].
Research in both temperate and tropical forests after major wind disturbance has generally revealed less-severe damage than the reduction of aboveground biomass and carbon to roughly 2% of pre-disturbance levels that occurred at Tionesta [8,9]. While wind disturbance events as severe as the catastrophic damage found at Tionesta do occur, they are rare [49,50,51,52] and the limited research into such events has usually focused on community parameters and processes, such as species composition and succession [34,50,53,54]. Thus, only a few studies have documented immediate post-blowdown biomass levels in temperate forests of North America. In a scrub-oak ecosystem of Florida, Hurricane Frances caused extensive defoliation, but negligible stem damage [12] and the authors reported no reduction in AGB. In Florida mangrove systems, Barr et al. [10,11] did not report a loss of AGB, but found nearly 100% defoliation and up to 45% mortality of mangrove trees. Bradford et al. [55] reported carbon stocks in undisturbed forests and disturbed stands 9 years after a strong derecho, but their data did not allow estimation of immediate post-disturbance biomass or carbon stocks. Among four intermediate-severity blowdowns sampled in New York and Vermont [17], aboveground live biomass in the year of disturbance or one year after ranged from 31.4 (20.4% of the reference stand biomass) to 121.0 (63.1% of the reference stand biomass) Mg ha−1. Taking a broader geographic perspective, several studies provide analogous information for other temperate forests. The storms, ‘Kyrill’ and ‘Paula’, in the Austrian Alps reduced aboveground biomass carbon to 74% of pre-disturbance levels [26]. On Hokkaido Island, Japan, Typhoon Songda in 2004 caused a 28% reduction in biomass in a transitional birch-oak forest [24]. Elsewhere on Hokkaido Island, Japan, in the only study reporting a damage severity similar to that documented here [23,25], a 97% loss in AGB in a 45-year old Japanese larch plantation struck by the same typhoon was reported. The subtropical broadleaf forest of Bisley watershed in Puerto Rico experienced a 50% reduction in standing live biomass after Hurricane Hugo in 1989 [20,21]. Hurricane Jova in 2011 caused an 11% reduction in AGB in a tropical dry forest of Mexico [19]. Another example of tropical dry forest was reported in [56], who documented a 13.4% reduction in AGB following Cyclone Fanele’s impacts in Madagascar. In tropical Central America, Mascaro et al. [21] described the forest biomass reduction by Hurricane Joan (1988), averaging 76% across multiple large plots. Four years after wind damage in the central Amazon, [18] found AGB stocks were 42% of the undisturbed forest levels in their high-severity plots and 64% of the undisturbed forest levels in their low-severity plots. Consequently, it appears that the present study exceeds the severity of most existing investigations into post-wind disturbance biomass and carbon accumulation. Severity must be considered because of the potential impact of severity on ecosystem dynamics during the recovery period. Several reviews [5,7,32] suggest that higher severity results in a slower recovery of biomass and carbon stocks—this is likely due to both a lower initial biomass starting point as well as slower accumulation rates during early recovery after severe events.
Importantly, the obvious greater removal of photosynthetic capacity in high severity events may occur with heavy structural damage (e.g., the present study, [23,25]) or through defoliation with minimal structural damage [12]. Indeed, Lugo [57] suggests that defoliation is the predominant type of damage from hurricanes in tropical forests. Defoliation without structural damage may allow for a much more rapid recovery of photosynthetic capacity than in cases with extensive breakage and uprooting; Li et al. [12] found full recovery of CO2 assimilation and ecosystem respiration within a year. Conversely, the mangrove system studied in [10,11] (with greater structural damage) exhibited CO2 uptake rates below pre-disturbance rates four years after the hurricane. The present study and [23,25] are at the opposite end of the spectrum from Li et al. [12]: The 97%–98% reduction in AGB is almost entirely structural in both cases, and full recovery of AGB may take seven or more decades. Moreover, the temporal trend during the first 25 years in the present study is that biomass and carbon accumulation rates are initially slow, then increase through the middle of the second decade, and subsequently slowly decrease (Figure 3). This pattern may be general for severe wind disturbances that cause heavy structural damage, because the first several years post disturbance will be required to reestablish an arboreal stand structure that can support leaf areas greater than unity.
Severe disturbances of other types, such as clearcuts or intense fires, may cause regeneration to begin with standing biomass values that are extremely low or even near zero. For example, [58] report that regeneration of southern Appalachian clearcuts began with <1.6 Mg ha−1 of live biomass. Such situations would be analogous to high severity wind disturbances with heavy structural damage, since simply regrowing leaves will not fully reestablish photosynthetic capacity.
Other types of disturbance (e.g., fire, harvesting, insect defoliation) may favor different mechanisms of regeneration than those common after wind disturbances [8,9]. For example, following harvesting, sprouts from the root collar may grow very quickly due to access to abundant resources via a still-viable pre-cut root system [58,59]. This phenomenon implies that biomass accumulation in clearcuts may be quite rapid, but examples from three eastern United States locations suggest that AGB accumulation is not always rapid. Following clearcut in the Southern Appalachians, Elliott et al. [58] examined biomass accumulation across three forest community types at the Coweeta Hydrologic Laboratory in western North Carolina. These stands reached 81.7 Mg ha−1 (cove hardwoods), 96.9 Mg ha−1 (mesic mixed oak), and 85.4 Mg ha−1 (dry mixed oak) of aboveground biomass roughly 20 years after the clearcut; these amounts were 40.0%, 52.3%, and 67.1% of the pre-cutting AGB levels. Such values for standing crop of aboveground biomass implies that (if a linear increase is assumed) between 4.01 and 4.77 Mg ha−1 was added annually. In contrast, Shure et al. [60] found faster biomass accumulation, where 2-hectare clearcuts in the southern Appalachians (also western North Carolina) added 4.0 Mg ha−1 year−1 in years 1–2, and that accumulation increased to 10.18 Mg ha−1 year−1 in years 12–17. At the well-known Hubbard Brook Experimental Forest in New Hampshire, where ecosystem response to clearcutting has been extensively studied [61], aboveground biomass values of 7.53 Mg ha−1 in year 5, 24.44 Mg ha−1 in year 11, and 52.0 Mg ha−1 in year 20 were identified. These figures imply that the Hubbard Brook site added biomass at approximately 3.1 Mg ha−1 year−1 between years 11 and 20.
Accumulation rates documented here appear to be broadly similar to other reported rates following natural disturbance in temperate forests, although rates in tropical systems may be higher (Table 2). Indeed, the 3.4 Mg ha−1 year−1 for biomass and 1.7 Mg ha−1 year−1 found here during years 17–25 is in the upper one-third of the 31 eastern North American studies reviewed in [62]; those studies followed a variety of types of disturbances. Regeneration in the simulated blowdown at Harvard Forest in Massachusetts during years 4–24 averaged 4.7 Mg ha−1 year−1 for biomass (suggesting roughly 2.25 Mg ha−1 year−1 for carbon), very similar to the value reported here (A. Plotkin, personal communication; Table 2). D’Amato et al. [16] estimated AGB trends during 250 years of recovery of central New England forests; visual estimates from their Figure 4c suggest an approximate rate of AGB accumulation during years 51–71 of 1.75 Mg ha−1 year−1. For cold temperate forest in Hokkaido, Japan, a windthrow added biomass at a rate of 3.96 Mg ha−1 year−1 at 8 years post-disturbance [24]. Following Hurricane Patricia (2015), tropical dry forest in western Mexico recovered 1.83 Mg ha−1 year−1 of AGB during the 21 months immediately after disturbance [19]. The biomass increment of regeneration between 4 and 8 years post-disturbance in a central Amazon study [18] varied widely between 2.1 Mg ha−1 year−1 and 7.6 Mg ha−1 year−1; however, this trend was complicated by substantial delayed mortality that caused biomass losses of up to 7 Mg ha−1 year−1 or more. These authors further estimated that the biomass increment of regeneration would be lower at roughly 26 years post-disturbance than at roughly 4 years post-disturbance. The lowland tropical rainforest in Nicaragua [21] accumulated biomass at rates between 4.85 and 7.01 Mg ha−1 year−1 (average 5.67 Mg ha−1 year−1 for biomass and 2.83 Mg ha−1 year−1 of carbon during the first post-hurricane decade; this rate diminished to an average of 4.6 Mg ha−1 year−1 in years 10–12 (2.3 Mg ha−1 year−1 of carbon)). In Puerto Rico, after Hurricane Hugo, biomass accumulated very rapidly at first and then at diminishing rates: 16.2 Mg ha−1 year−1 in years 0–5; 6.6 Mg ha−1 year−1 in years 5–10; and 1.2 Mg ha−1 year−1 in years 10–15 [22] (Table 2). Since the latter two sites are subtropical or tropical wet forest, more rapid initial accumulation is perhaps to be expected, although the broad temporal trend (high rates initially that diminish after the first decade) is opposite to the trend reported here. Thus, biomass and carbon accumulation rates at Tionesta were similar to rates in other temperate forests after wind disturbance, and slightly less than the midpoint of the range of accumulation rates reported from tropical systems.
5. Conclusions
Several generalizations may be tentatively suggested from this work and from a comparison with previous findings. First, several post-windthrow accumulation studies in temperate forests exhibited rates of 3–5 Mg ha−1 year−1 for biomass and 1.5–2.5 Mg ha−1 year−1 for carbon; in lieu of detailed site and species information, such rates may be suitable as model inputs when simulating post-windthrow carbon dynamics of temperate forests. Second, the severity and type of damage appears to strongly influence temporal biomass and C accumulation patterns. Wind disturbance that causes only defoliation with limited structural damage will result in the least biomass reduction and the fastest recovery [12]. Disturbance that causes structural damage yet leaves most trunks standing can preclude new seedlings’ establishment or the release of advance regeneration. In those cases, regeneration derives from the resprouting of pre-disturbance canopy trees, and accumulation rates will be slow if the pre-disturbance canopy was dominated by slow-growing species [11,12,21]. More extreme structural damage that leaves few canopy trees will release advanced regeneration or prompt seedling recruitment from seeds, or both. Of these latter two regeneration mechanisms, the release of advanced regeneration is likely to accumulate biomass and C more quickly in post-disturbance years 1–5 (e.g., [59]) than the establishment from seeds; however, after just a few years, newly established seedlings that are pioneer species may grow very rapidly, contributing to a slow start, but then very rapid accumulation in the period of 5–15 years after disturbance (e.g., this study and [5]). Third, biomass and C accumulation rates after temperate forest wind disturbance may be broadly similar to those after clear-cutting (this study compared to [58,60,61]. Notably, [58] suggest that the slower accumulation (relative to other clearcut studies, [58,60]) at the well-known Hubbard Brook site in New Hampshire [61] may have been in part because the chemical suppression of regeneration for three years immediately after clearcutting likely killed sprouts from roots and cut stumps. Such a treatment would cause the initial regeneration at Hubbard Brook to be dominated by new recruits from seeds, perhaps slowing recovery in comparison to sites where sprouting could facilitate faster growth in years 1–5. If so, this comparison among post-clearcut studies is consistent with the suggestion that regeneration after wind disturbance will be faster in the first few years if sprouting is a dominant process [59].
Funding
Funding for this work was provided by various sources, most prominently NSF grant DEB 114-3511 from Population & Community Ecology, and a 1998 grant from the Andrew Mellon Foundation.
Acknowledgments
The Bradford Ranger District of Allegheny National Forest kindly granted permission to study in the Tionesta Scenic Area. S.T.A. Pickett generously provided invaluable guidance and encouragement in the early years of this work. Field sampling has been aided over the years by undergraduate assistants too numerous to list—their help is greatly appreciated. The U.S.D.A. Forest Service Forestry Sciences Lab in Irvine, PA has been supportive in terms of logistics, advice, and many other ways; in particular I thank Steve Horsley, Susan Stout and Alex Royo.
Conflicts of Interest
The author declares no conflict of interest. The funders had no role in the design of the study; in the collection, analyses, or interpretation of data; in the writing of the manuscript, or in the decision to publish the results.
References
- Domke, G.; Williams, C.A.; Birdsey, R.; Coulston, J.; Finzi, A.; Gough, C.; Haight, B.; Hicke, J.; Janowiak, M.; de Jon, B.; et al. Chapter 9: Forests. In Second State of the Carbon Cycle Report (SOCCR2): A Sustained Assessment Report; U.S. Global Change Research Program: Washington, DC, USA, 2018; pp. 365–398. [Google Scholar]
- Curtis, P.S.; Gough, C.M. Forest age, disturbance and the carbon cycle. New Phytol. 2018, 218, 1–6. [Google Scholar] [CrossRef]
- Kashian, D.M.; Romme, W.H.; Tinker, D.B.; Turner, M.G.; Ryan, M.G. Carbon storage on landscapes with stand-replacing fires. BioScience 2008, 56, 598–606. [Google Scholar] [CrossRef]
- Williams, C.A.; Gu, H.; MacLean, R.; Masek, J.G.; Collatz, G.J. Disturbance and the carbon balance of US forests: A quantitative review of impacts from harvests, fires, insects, and droughts. Glob. Planet. Chang. 2016, 143, 66–80. [Google Scholar] [CrossRef]
- Amiro, B.D.; Barr, A.G.; Barr, J.G.; Black, T.A.; Bracho, R.; Brown, M.; Chen, J.; Clark, K.L.; Davis, K.J.; Desai, A.R.; et al. Ecosystem carbon dioxide fluxes after disturbance in forests of North America. J. Geophys. Res. 2010, 115, G00K02. [Google Scholar] [CrossRef]
- Ghimire, B.; Williams, C.A.; Collatz, G.J.; Vanderhoof, M. Fire-induced carbon emissions and regrowth uptake in western U.S. forests: Documenting variation across forest types, fire severity, and climate regions. J. Geophys. Res. 2012, 117, G03036. [Google Scholar] [CrossRef]
- Kasischke, E.S.; Amiro, B.D.; Barger, N.N.; French, N.H.F.; Goetz, S.J.; Grosse, G.; Harmon, M.E.; Hicke, J.A.; Liu, S.; Masek, J.G. Impacts of disturbance on the terrestrial carbon budget of North America. J. Geophys. Res. Biogeosci. 2013, 118, 303–316. [Google Scholar] [CrossRef] [Green Version]
- Everham, E.E.; Brokaw, N.V.L. Forest damage and recovery from catastrophic wind. Bot. Rev. 1996, 62, 113–185. [Google Scholar] [CrossRef]
- Mitchell, S.J. Wind as a natural disturbace agent in forests—A synthesis. Forestry 2013, 86, 147–157. [Google Scholar] [CrossRef]
- Barr, J.G.; Engle, V.; Fuentes, J.D.; Zieman, J.C.; O’Halloran, T.L.; Smith, T.J.; Anderson, G.H. Controls on mangrove forest-atmosphere carbon dioxide exchanges in western Everglades National Park. J. Geophys. Res. 2010, 115, G02020. [Google Scholar] [CrossRef]
- Barr, J.G.; Engel, V.; Smith, T.J.; Fuentes, J.D. Hurricane disturbance and recovery of energy balance, CO2 fluxes and canopy structure in a mangrove forest of the Florida Everglades. Agric. For. Meteorol. 2012, 153, 54–66. [Google Scholar] [CrossRef]
- Li, J.; Powell, T.L.; Seiler, T.J.; Johnson, D.P.; Anderson, H.P.; Bracho, R.; Hungate, B.A.; Hinkle, C.R.; Drake, B.G. Impacts of Hurricane Frances on Florida scrub-oak ecosystem processes: Defoliation, net CO2 exchange and interactions with elevated CO2. Glob. Chang. Biol. 2007, 13, 1101–1113. [Google Scholar] [CrossRef]
- Chambers, J.Q.; Fisher, J.I.; Zeng, H.C.; Chapman, E.L.; Baker, D.B.; Hurtt, G.C. Hurricane Katrina’s carbon footprint on U.S. Gulf Coast forests. Science 2007, 318, 1107. [Google Scholar] [CrossRef]
- Zeng, H.C.; Chambers, J.Q.; Negrón-Juárez, R.I.; Hurtt, G.C.; Baker, D.B.; Powell, M.D. Impacts of tropical cyclones on U.S. forest tree mortality and carbon flux from 1851 to 2000. Proc. Natl. Acad. Sci. USA 2009, 106, 7888–7892. [Google Scholar] [CrossRef] [PubMed] [Green Version]
- Fisk, J.P. The impacts of tropical cyclones on the net carbon balance of eastern US forests (1851–2000). Environ. Res. Lett. 2013, 8, 045017. [Google Scholar] [CrossRef] [Green Version]
- D’Amato, A.W.; Orwig, D.A.; Foster, D.R.; Plotkin, A.B.; Schoonmaker, P.K.; Wagner, M.R. Long-term structural and biomass dynamics of virgin Tsuga canadensis-Pinus strobus forests after hurricane disturbance. Ecology 2017, 98, 721–733. [Google Scholar] [CrossRef] [PubMed]
- Meigs, G.W.; Keeton, W.S. Intermediate-severity wind disturbance in mature temperate forests: Legacy structure, carbon storage, and stand dynamics. Ecol. Appl. 2018, 28, 798–815. [Google Scholar] [CrossRef] [PubMed]
- Magnabosco Marra, D.; Trumbore, S.E.; Higuchi, N.; Ribeiro, G.H.P.M.; Negrón-Juárez, R.I.; Holzwarth, F.; Rifai, S.W.; dos Santos, J.; Lima, A.J.N.; Kinupp, V.F.; et al. Windthrows control biomass patterns and functional composition of Amazon forests. Glob. Chang. Biol. 2018, 2018, 1–15. [Google Scholar] [CrossRef]
- Parker, G.; Martinez-Yrizar, A.; Alvarez-Yepiz, J.C.; Maass, M.; Araiza, S. Effects of hurricane disturbance on a tropical dry forest canopy in western Mexico. For. Ecol. Manag. 2018, 426, 39–52. [Google Scholar] [CrossRef]
- Scatena, F.N.; Moya, S.; Estrada, C.; Chinea, J.D. The first five years in the reorganization of aboveground biomass and nutrient use following Hurricane Hugo in the Bisley Experimental Watersheds, Luquillo Experimental Forest, Puerto Rico. Biotropica 1996, 28, 424–440. [Google Scholar] [CrossRef]
- Mascaro, J.; Perfecto, I.; Barros, O.; Boucher, D.H.; Granzow de la Cerda, I.; Ruiz, J.; Vandermeer, J. Aboveground biomass accumulation in a tropical wet forest in Nicaragua following a catastrophic hurricane disturbance. Biotropica 2005, 37, 600–608. [Google Scholar] [CrossRef]
- Scalley, T.H.; Scatena, F.N.; Lugo, A.E.; Moya, S.; Estrada Ruiz, C.R. Changes in structure, composition, and nutrients during 15 years of hurricane-induced succession in a subtropical wet forest in Puerto Rico. Biotropica 2010, 42, 455–463. [Google Scholar] [CrossRef]
- Sano, T.; Hirano, T.; Liang, N.; Hirata, R.; Fujinuma, Y. Carbon dioxide exchange of a larch forest after a typhoon disturbance. For. Ecol. Manag. 2010, 260, 2214–2223. [Google Scholar] [CrossRef] [Green Version]
- Yamanoi, K.; Mizoguchi, Y.; Utsugi, H. Effects of a windthrow disturbance on the carbon balance of a broadleaf deciduous forest in Hokkaido, Japan. Biogeosciences 2015, 12, 6837–6851. [Google Scholar] [CrossRef] [Green Version]
- Yazaki, T.; Hirano, T.; Sano, T. Biomass accumulation and net primary production during the early stage of secondary succession after a severe forest disturbance in northern Japan. Forests 2016, 7, 287. [Google Scholar] [CrossRef]
- Kobler, J.; Jandl, R.; Dirnbock, T.; Mirtl, M.; Schindlbacher, A. Effects of stand patchiness due to windthrow and bark beetle abatement measures on soil CO2 efflux and net ecosystem productivity of a managed temperate mountain forest. Eur. J. For. Res. 2015, 134, 683–692. [Google Scholar] [CrossRef]
- Knohl, A.; Kolle, O.; Minayeva, T.Y.; Milyukova, I.J.; Vygodskaya, N.N.; Foken, T.; Schulze, E.D. Carbon dioxide exchange of a Russian boreal forest after disturbance by wind throw. Glob. Chang. Biol. 2002, 8, 231–246. [Google Scholar] [CrossRef]
- Lindroth, A.; Lagergren, F.; Grelle, A.; Klemedtsson, L.; Langvall, O.; Weslien, P.; Tuulik, J. Storms can cause Europe-wide reduction in forest carbon sink. Glob. Chang. Biol. 2009, 15, 346–355. [Google Scholar] [CrossRef]
- Fortin, M.; Albrecht, A.; Kohnle, U.; Ningre, F. The impact of windstorm damage in the assessment of the carbon balance in even-aged Fagus sylvatica L. stands. Forests 2014, 5, 784–801. [Google Scholar] [CrossRef]
- Lindauer, M.; Schmid, H.P.; Grote, R.; Mauder, M.; Steinbrecher, R.; Wolpert, B. Net ecosystem exchange over a non-cleared wind-throw-disturbed upland spruce forest—Measurements and simulations. Agric. For. Meteorol. 2014, 197, 219–234. [Google Scholar] [CrossRef]
- Matthews, B.; Mayer, M.; Katzensteiner, K.; Godbold, D.L.; Schume, H. Turbulent energy and carbon dioxide exchange along an early-successional windthrow chronosequence in the European Alps. Agric. For. Meteorol. 2017, 232, 576–594. [Google Scholar] [CrossRef]
- Liu, S.; Bond-Lamberty, B.; Hicke, J.A.; Vargas, R.; Zhao, S.; Chen, J.; Edburg, S.L.; Hu, Y.; Liu, J.; McGuire, A.D.; et al. Simulating the impacts of disturbances on forest carbon cycling in North America: Processes, data, models, and challenges. J. Geophys. Res. 2011, 116, G00K08. [Google Scholar] [CrossRef]
- Bjorkbom, J.C.; Larson, R.G. The Tionesta Scenic and Research Natural Areas. In USDA Forest Service General Technical Report; NE-31; U.S. Department of Agriculture, Forest Service, Northeastern Forest Experimental Station: Upper Darby, PA, USA, 1977. [Google Scholar]
- Peterson, C.J.; Pickett, S.T.A. Forest reorganization: A case study in an old-growth forest catastrophic blowdown. Ecology 1995, 76, 763–774. [Google Scholar] [CrossRef]
- Peterson, C.J.; Carson, W.P. Generalizing forest regeneration models: The dependence of propagule availability on disturbance history and stand size. Can. J. For. Res. 1996, 26, 45–52. [Google Scholar] [CrossRef]
- Peterson, C.J.; Carson, W.P.; McCarthy, B.C.; Pickett, S.T.A. Microsite variation and soil dynamics within newly created treefall pits and mounds. Oikos 1990, 58, 39–46. [Google Scholar] [CrossRef]
- Peterson, C.J.; Pickett, S.T.A. Microsite and elevational influences on forest regeneration three years after catastrophic windthrow. J. Veg. Sci. 1990, 1, 657–662. [Google Scholar] [CrossRef]
- Long, Z.T.; Carson, W.P.; Peterson, C.J. Can disturbance create refugia from herbivores: An example with hemlock regeneration on treefall mounds. J. Torrey Bot. Soc. 1998, 125, 165–168. [Google Scholar] [CrossRef]
- Peterson, C.J. Damage and recovery of tree species after two different tornadoes in the same old growth forest: A comparison of infrequent wind disturbances. For. Ecol. Manag. 2000, 135, 237–252. [Google Scholar] [CrossRef]
- Krueger, L.M.; Peterson, C.J. Effects of white-tailed deer on Tsuga canadensis regeneration: Evidence of microsites as refugia from browsing. Am. Midl. Nat. 2006, 156, 353–362. [Google Scholar] [CrossRef]
- Hough, A.F.; Forbes, R.D. The ecology and silvics of forests in the high plateaus of Pennsylvania. Ecol. Monogr. 1943, 13, 299–320. [Google Scholar] [CrossRef]
- Hough, A.F. A climax forest community on East Tionesta Creek in northwestern Pennsylvania. Ecology 1936, 17, 9–28. [Google Scholar] [CrossRef]
- Kain, M.; Battaglia, L.; Royo, A.; Carson, W.P. Over-browsing in Pennsylvania creates a depauperate forest dominated by an understory tree: Results from a 60-year-old deer exclosure. J. Torrey Bot. Soc. 2011, 138, 322–326. [Google Scholar] [CrossRef]
- Jenkins, J.C.; Chojnacky, D.C.; Heath, L.S.; Birdsey, R.A. National-scale biomass estimators for United States tree species. For. Sci. 2003, 49, 12–35. [Google Scholar]
- Warde, W.; Petranka, J.W. A correction factor table for missing point-center quarter data. Ecology 1981, 62, 491–494. [Google Scholar] [CrossRef]
- Fatemi, F.R.; Yanai, R.D.; Hamburg, S.P.; Vadeboncoeur, M.A.; Arthur, M.A.; Briggs, R.D.; Levine, C.R. Allometric equations for young northern hardwoods: The importance of age-specific equations for estimating aboveground biomass. Can. J. For. Res. 2011, 41, 881–891. [Google Scholar] [CrossRef]
- Woods, K.D. Multi-decade biomass dynamics in an old-growth hemlock-northern hardwood forest, Michigan, USA. PeerJ 2014, e598. [Google Scholar] [CrossRef]
- Keeton, W.S.; Whitman, A.A.; McGee, G.C.; Goodale, C.L. Late-successional biomass development in northern hardwood-conifer forests of the northeastern United States. For. Sci. 2011, 57, 489–505. [Google Scholar]
- Canham, C.D.; Loucks, O.L. Catastrophic windthrow in the presettlement forests of Wisconsin. Ecology 1984, 65, 803–809. [Google Scholar] [CrossRef]
- Canham, C.D.; Marks, P.L. The response of woody plants to disturbance: Patterns of establishment and growth. In The Ecology of Natural Disturbance and Patch Dynamics; Pickett, S.T.A., White, P.S., Eds.; Academic Press: New York, NY, USA, 1985; pp. 197–216. [Google Scholar]
- Seischab, F.K.; Orwig, D. Catastrophic disturbances in the presettlement forests of western New York. Bull. Torrey Bot. Club 1991, 118, 117–122. [Google Scholar] [CrossRef]
- Frelich, L.E.; Lorimer, C.G. Natural disturbance regimes in hemlock-hardwood forests of the upper Great Lakes region. Ecol. Monogr. 1991, 61, 145–164. [Google Scholar] [CrossRef]
- Dunn, C.P.; Guntenspergen, G.R.; Dorney, J.R. Catastrophic wind disturbance in an old-growth hemlock-hardwood forest, Wisconsin. Can. J. Bot. 1983, 61, 211–217. [Google Scholar] [CrossRef]
- Lang, K.D.; Schulte, L.A.; Guntenspergen, G.R. Windthrow and salvage logging in an old-growth hemlock-northern hardwoods forest. For. Ecol. Manag. 2009, 259, 56–64. [Google Scholar] [CrossRef] [Green Version]
- Bradford, J.B.; Fraver, S.; Milo, A.M.; D’Amato, A.W.; Palik, B.; Shinneman, D.J. Effects of multiple interacting disturbances and salvage logging on forest carbon stocks. For. Ecol. Manag. 2012, 267, 209–214. [Google Scholar] [CrossRef]
- Lewis, R.J.; Banner-Martin, K.H. The impact of Cyclone Fanele on a tropical dry forest in Madagascar. Biotropica 2012, 44, 135–140. [Google Scholar] [CrossRef]
- Lugo, A.E. Visible and invisible effects of hurricanes on forest ecosystems: An international review. Austral Ecol. 2008, 33, 368–398. [Google Scholar] [CrossRef]
- Elliott, K.J.; Boring, L.R.; Swank, W.T. Aboveground biomass and nutrient accumulation 20 years after clear-cutting a southern Appalachian watershed. Can. J. For. Res. 2002, 32, 667–683. [Google Scholar] [CrossRef]
- Barker-Plotkin, A.; Foster, D.; Carlson, J.; Magill, A. Survivors, not invaders, control forest development following simulated hurricane. Ecology 2013, 94, 414–423. [Google Scholar] [CrossRef] [Green Version]
- Shure, D.J.; Phillips, D.L.; Bostick, P.E. Gap size and succession in cutover southern Appalachian forests: An 18 year study of vegetation dynamics. Plant Ecol. 2006, 185, 299–318. [Google Scholar] [CrossRef]
- Reiners, W.A. Twenty years of ecosystem reorganization following experimental deforestation and regrowth suppression. Ecol. Monogr. 1992, 62, 503–523. [Google Scholar] [CrossRef]
- Fu, Z.; Li, D.; Hararuk, O.; Schwalm, C.; Luo, Y.; Yan, L.; Niu, S. Recovery time and state change of terrestrial carbon cycle after disturbance. Environ. Res. Lett. 2017, 12, 104004. [Google Scholar] [CrossRef] [Green Version]
Figure 1.
Aerial color infrared photo of the Tionesta Scenic Area study site, approximately two months after the tornado disturbance. Overlaid graphics show the distribution of the 0.5 m2 sampling quadrats (not all shown, and not to scale) along the three north-south transects. North-south distance shown in the aerial photo is approximately 1 km. The white band in the upper (north) central area of the aerial photo is a gas pipeline right-of-way that had been cleared part of the way across the tornado swath by the time of the photo.
Figure 2.
Carbon accumulation across 25 years following catastrophic windthrow at the Tionesta Scenic Area, Pennsylvania.
Figure 2.
Carbon accumulation across 25 years following catastrophic windthrow at the Tionesta Scenic Area, Pennsylvania.

Figure 3.
Annualized aboveground carbon increment between sample dates following catastrophic windthrow at the Tionesta Scenic Area, Pennsylvania. Bars are positioned at the midpoints of the sampling intervals; e.g., the combined (regeneration + survivors) bar is at 21 years because the endpoints of that period were 17 and 25 years. The dotted line represents the average annual carbon increment of survivors between years 1 and 17.

Table 1.
Equations used to estimate the aboveground biomass (AGB) from plant height or trunk diameter at 1.4 m (dbh). Sources: A—A. Royo, unpublished data for Allegheny National Forest; B—Fatemi et al. (2011); C—Jenkins et al. (2003). Separate equations not available for Acer pensylvanicum or Tsuga canadensis in sizes categories, A or B; therefore, equations for Acer rubrum and Fagus grandifolia, respectively, were substituted.
| Species | Form of Equation | a | b | R2 |
|---|---|---|---|---|
| A. Stems 25–300 cm tall | lnAGB = a + (b × ln(Height)) | |||
| Acer pensylvanicum | −7.702 | 2.569 | n.a. | |
| Acer rubrum. | −6.509 | 2.135 | 0.768 | |
| Betula spp. | −9.105 | 2.646 | 0.821 | |
| Fagus grandifolia | −7.702 | 2.569 | 0.768 | |
| Prunus spp. | −8.569 | 2.498 | 0.839 | |
| Tsuga canadensis | −6.509 | 2.135 | n.a. | |
| B. Stems > 300 cm tall and <10 cm dbh | log10AGB = a + (b × log10(dbh) | |||
| Acer pensylvanicum | 2.342 | 2.155 | n.a. | |
| Acer rubrum | 2.130 | 2.237 | 0.988 | |
| Betula spp. | 2.260 | 2.513 | 0.972 | |
| Fagus grandifolia | 2.342 | 2.155 | 0.959 | |
| Prunus spp. | 1.833 | 2.597 | 0.872 | |
| Tsuga canadensis | 2.130 | 2.237 | n.a. | |
| C. Stems ≥ 10 cm dbh | AGB = exp(a + b × ln(dbh)) | |||
| Acer rubrum | −1.912 | 2.365 | 0.958 | |
| Acer saccharum | −2.013 | 2.434 | 0.988 | |
| Betula spp. | −1.912 | 2.365 | 0.958 | |
| Fagus grandifolia | −2.013 | 2.434 | 0.988 | |
| Prunus pensylvanicum | −2.480 | 2.483 | 0.980 | |
| Prunus serotina | −2.480 | 2.483 | 0.980 | |
| Tsuga canadensis | 2.538 | 2.481 | 0.992 | |
Table 2.
Aboveground biomass increment of forests after various disturbance.
| Location | Forest Type | Disturbance Type | Years Post-Disturbance | AGBI * | Citation |
|---|---|---|---|---|---|
| Hokkaido, Japan | Temperate broadleaf | Windthrow | 2 | 1.84 | 1 |
| 8 | 3.96 | ||||
| Hokkaido, Japan | Temperate coniferous | Windthrow | 2–5 | 0.43 | 2 |
| 5–7 | 0.98 | ||||
| 7–10 | −0.02 | ||||
| Austria | Temperate coniferous | Windthrow + bark beetles | 1–4 | 4.62 | 3 |
| Massachusetts, USA | Temperate broadleaf | Simulated windthrow | 4–24 | 4.7 | 4 |
| New Hampshire, USA | Temperate mixed conifer-broadleaf | Windthrow | 51–71 | 1.75 ** | 5 |
| Pennsylvania, USA | Temperate broadleaf | Windthrow | 2–3 | 2 | This study |
| 3–4 | 3 | ||||
| 4–5 | 3.5 | ||||
| 5–6 | 3.8 | ||||
| 6–8 | 5.8 | ||||
| 8–12 | 7.8 | ||||
| 12–14 | 6.6 | ||||
| 14–17 | 0.4 | ||||
| 17–25 | 3.4 | ||||
| Puerto Rico, USA | Subtropical broadleaf | Windthrow | 0–5 | 16.2 | 6 |
| 5–10 | 6.6 | ||||
| 10–15 | 1.2 | ||||
| Central Amazon, Brazil | Tropical broadleaf | Windthrow | 4–8 | 2.1–7.6 | 7 |
| Nicaragua | Tropical broadleaf | Windthrow | 1–10 | 5.67 | 8 |
| 10–12 | 4.6 | ||||
| Mexico | Tropical dry | Windthrow | 0–2 | 1.83 | 9 |
* Mg ha−1 year−1, 1 = Yamanoi et al. 2015; 2 = Yazaki et al. 2016; 3 = Kobler et al. 2015; 4 = Plotkin, pers. Comm.; 5 = D’Amato et al. 2017; 6 = Scalley et al. 2010; 7 = Magnabosco Marra et al. 2018; 8 = Mascaro et al. 2005; 9 = Parker et al. 2018; ** Estimated by visual inspection of Figure 4c in D’Amato et al. 2017.
© 2019 by the author. Licensee MDPI, Basel, Switzerland. This article is an open access article distributed under the terms and conditions of the Creative Commons Attribution (CC BY) license (http://creativecommons.org/licenses/by/4.0/).
Share and Cite
MDPI and ACS Style
Peterson, C.J. Twenty-Five Years of Aboveground Biomass and Carbon Accumulation Following Extreme Wind Damage in an Old-Growth Forest. Forests 2019, 10, 289. https://doi.org/10.3390/f10030289
AMA Style
Peterson CJ. Twenty-Five Years of Aboveground Biomass and Carbon Accumulation Following Extreme Wind Damage in an Old-Growth Forest. Forests. 2019; 10(3):289. https://doi.org/10.3390/f10030289
Chicago/Turabian StylePeterson, Chris J. 2019. "Twenty-Five Years of Aboveground Biomass and Carbon Accumulation Following Extreme Wind Damage in an Old-Growth Forest" Forests 10, no. 3: 289. https://doi.org/10.3390/f10030289
Note that from the first issue of 2016, this journal uses article numbers instead of page numbers. See further details here.