Some Lessons Learned on Early Survival and Growth of Containerized, Locally-Sourced Ponderosa Pine Seedlings in the Davis Mountains of Western Texas, US

Abstract
:1. Introduction
2. Materials and Methods
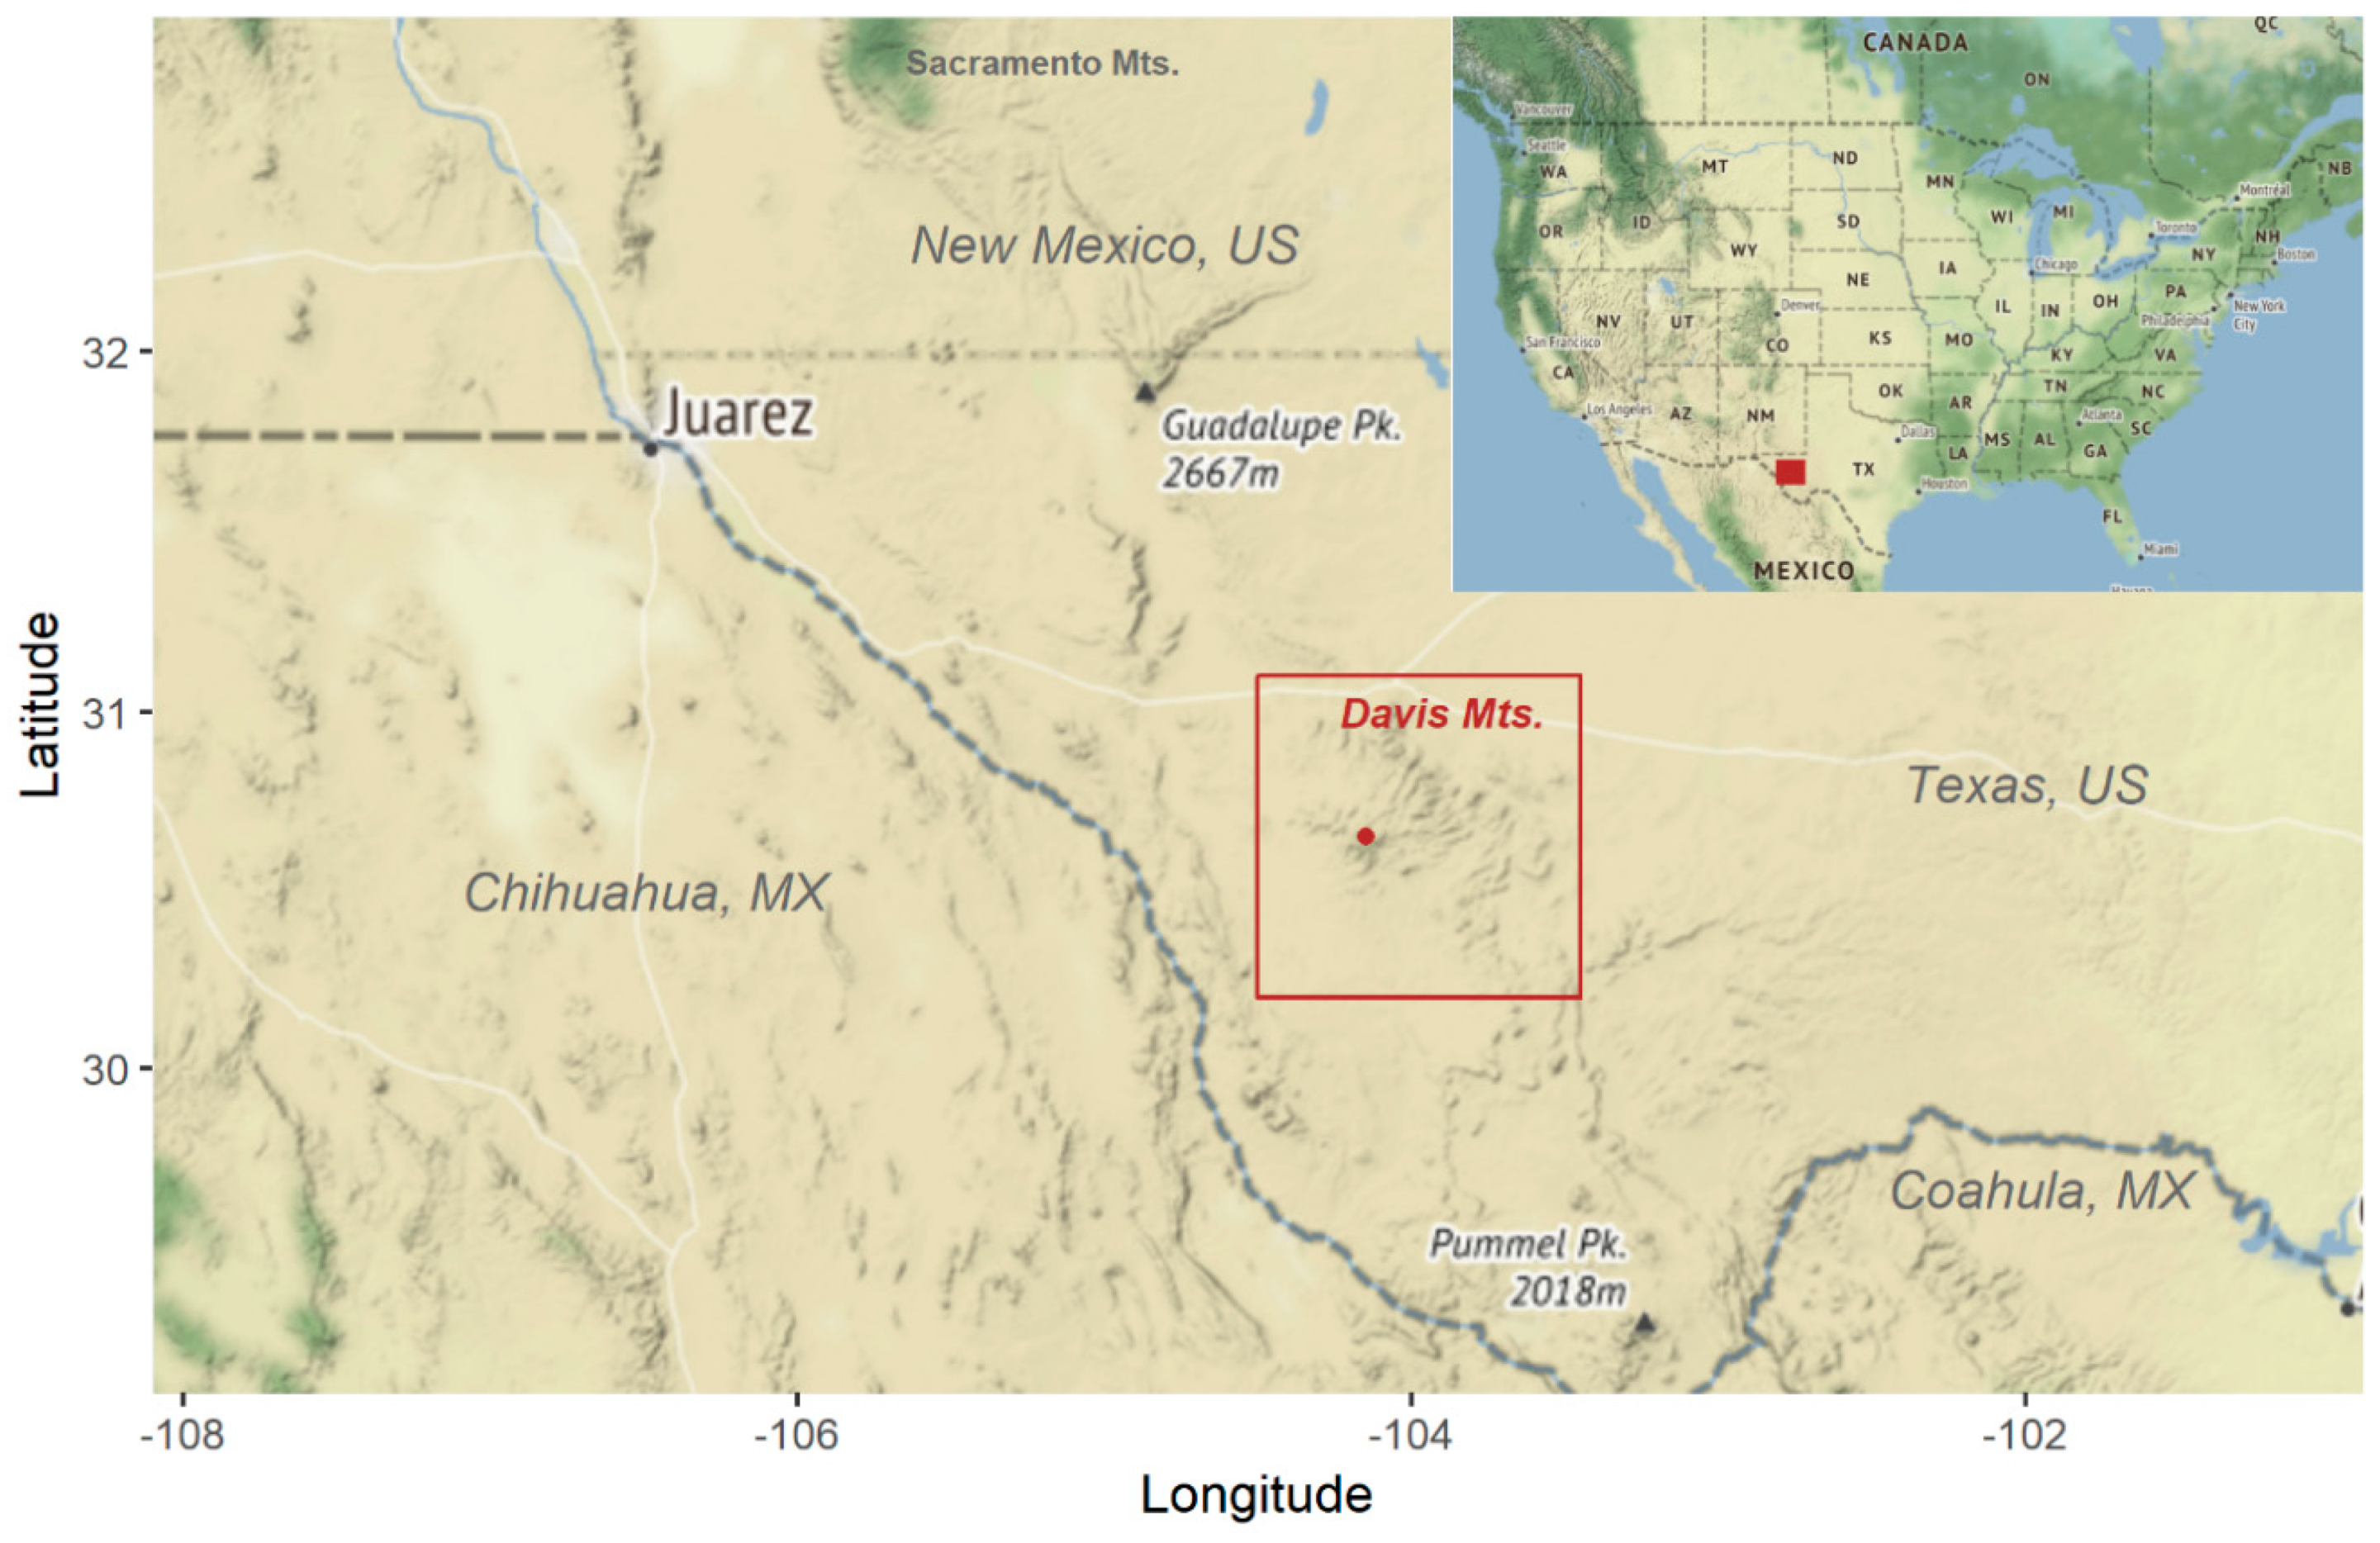
2.1. Study Sites
2.2. Study Design
2.3. Data Collection
2.4. Data Analysis
2.4.1. Survival
2.4.2. Herbivory
2.4.3. Growth
3. Results
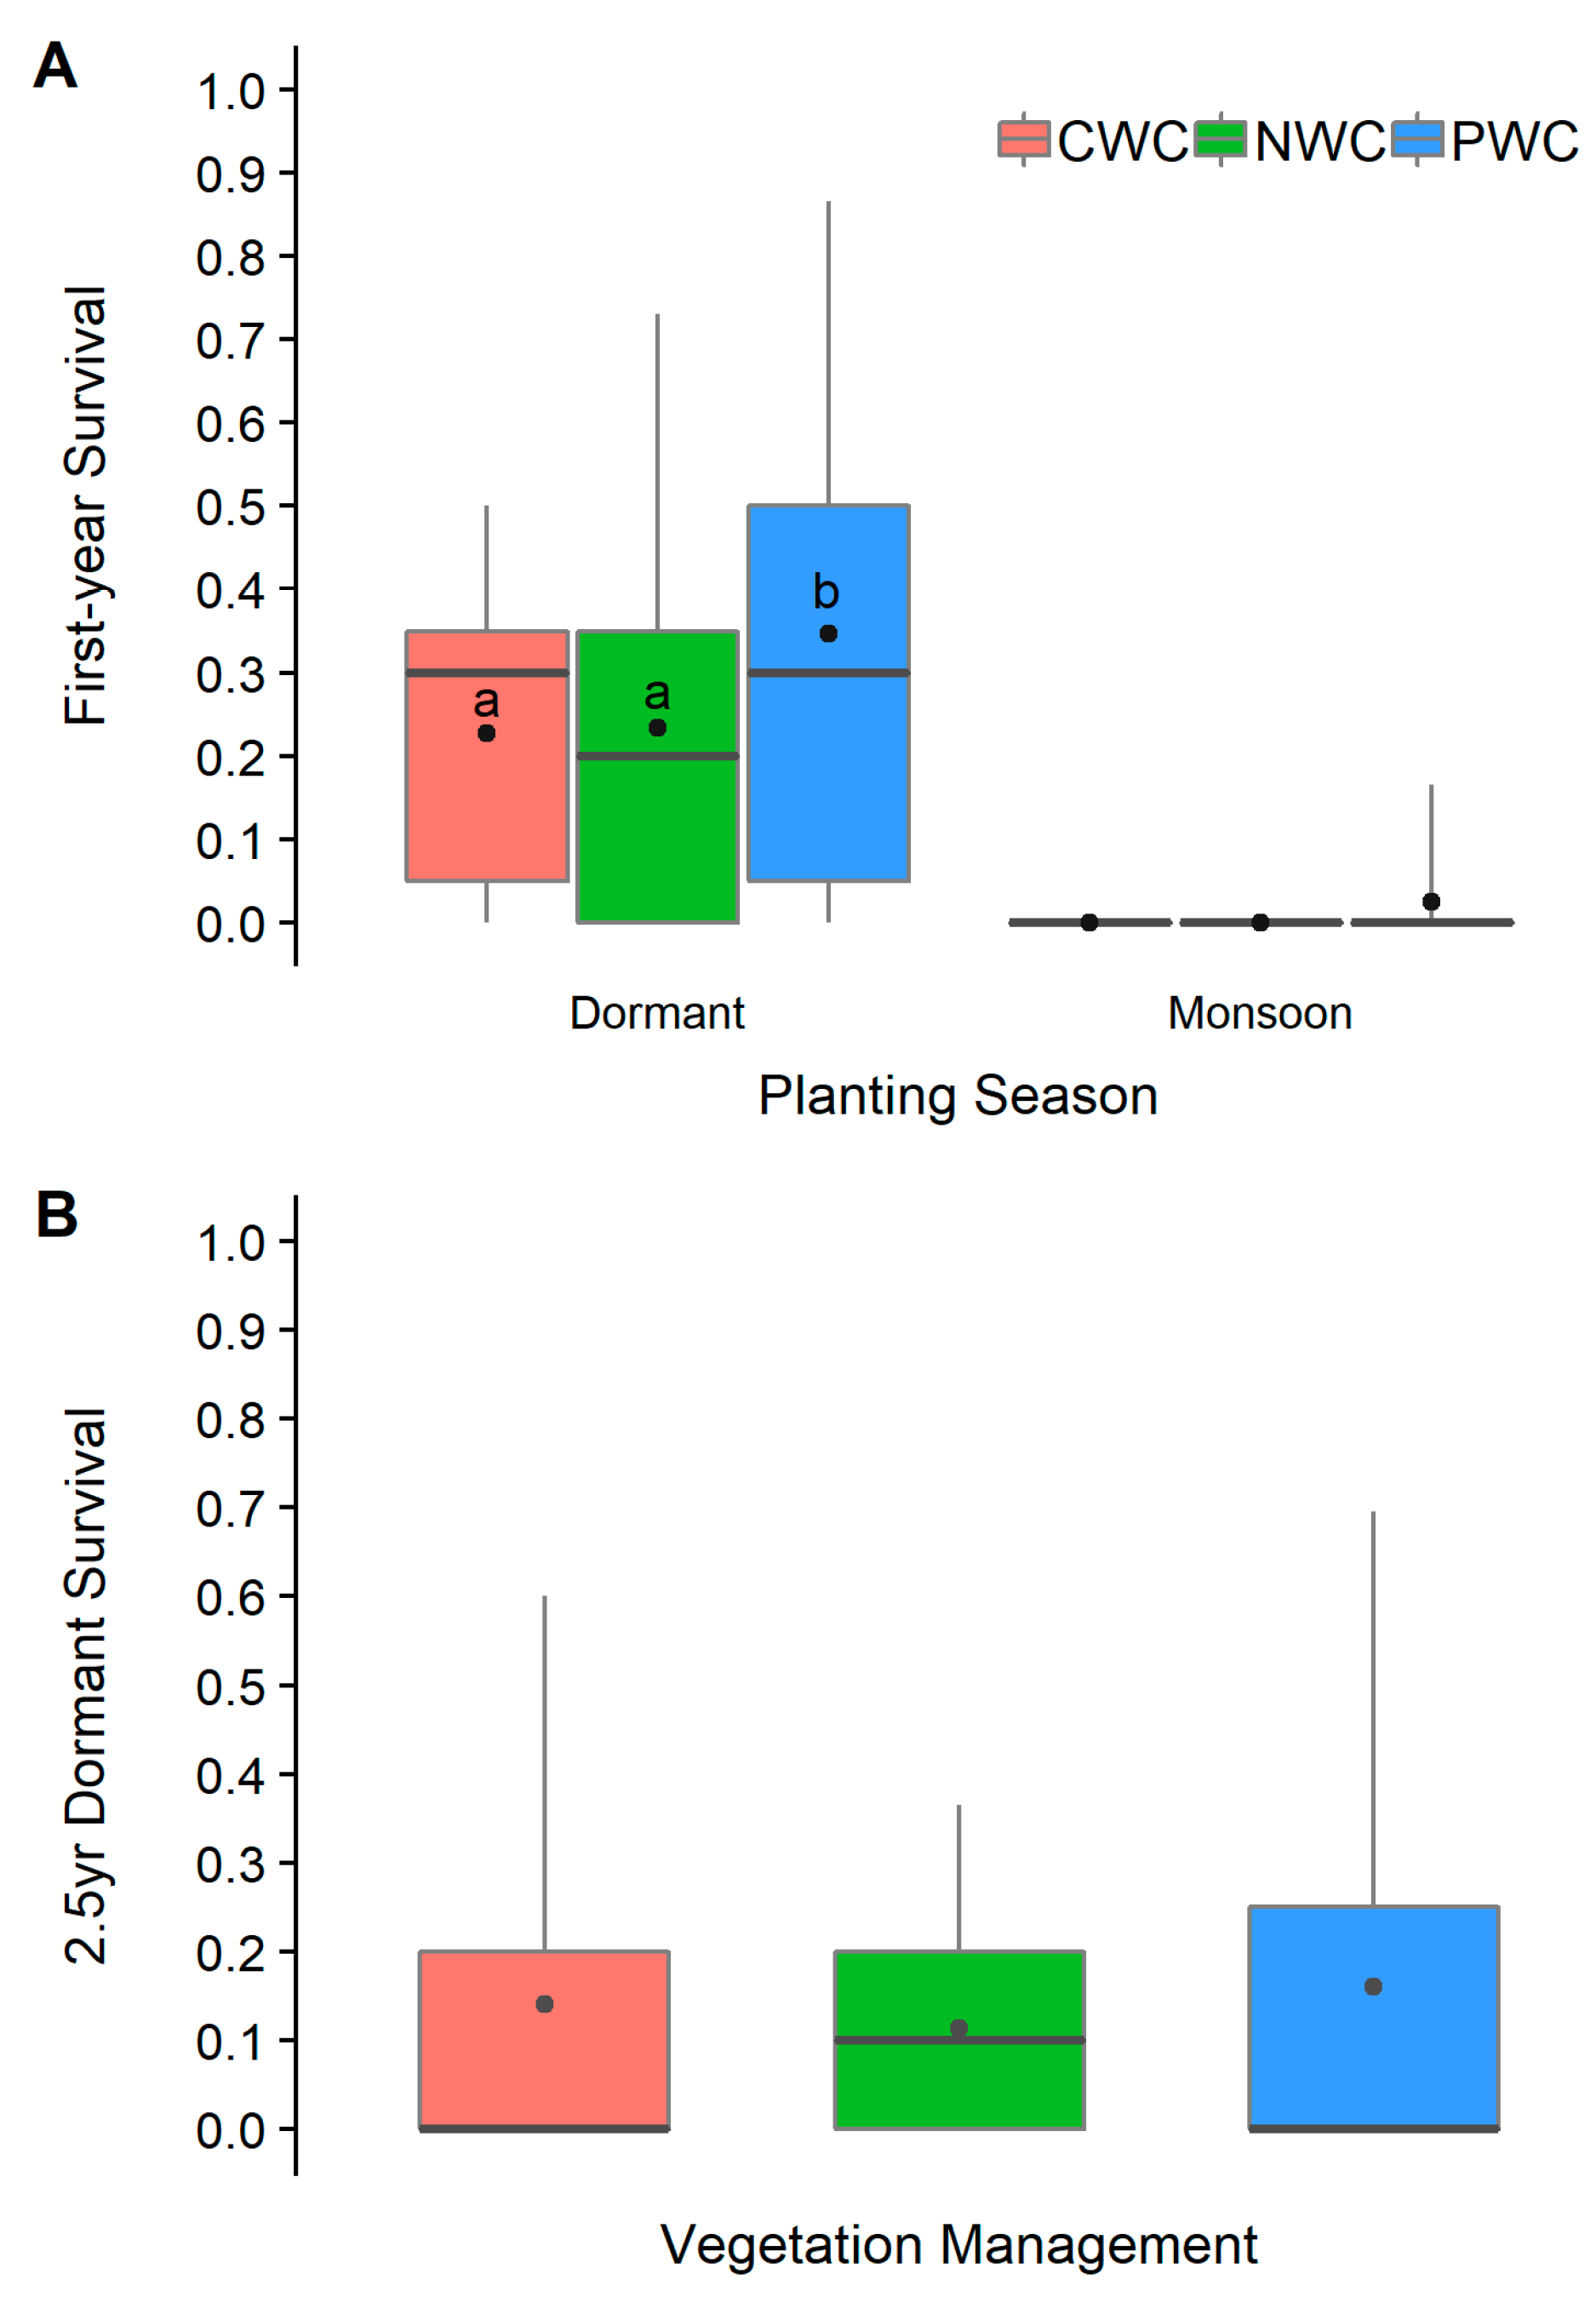
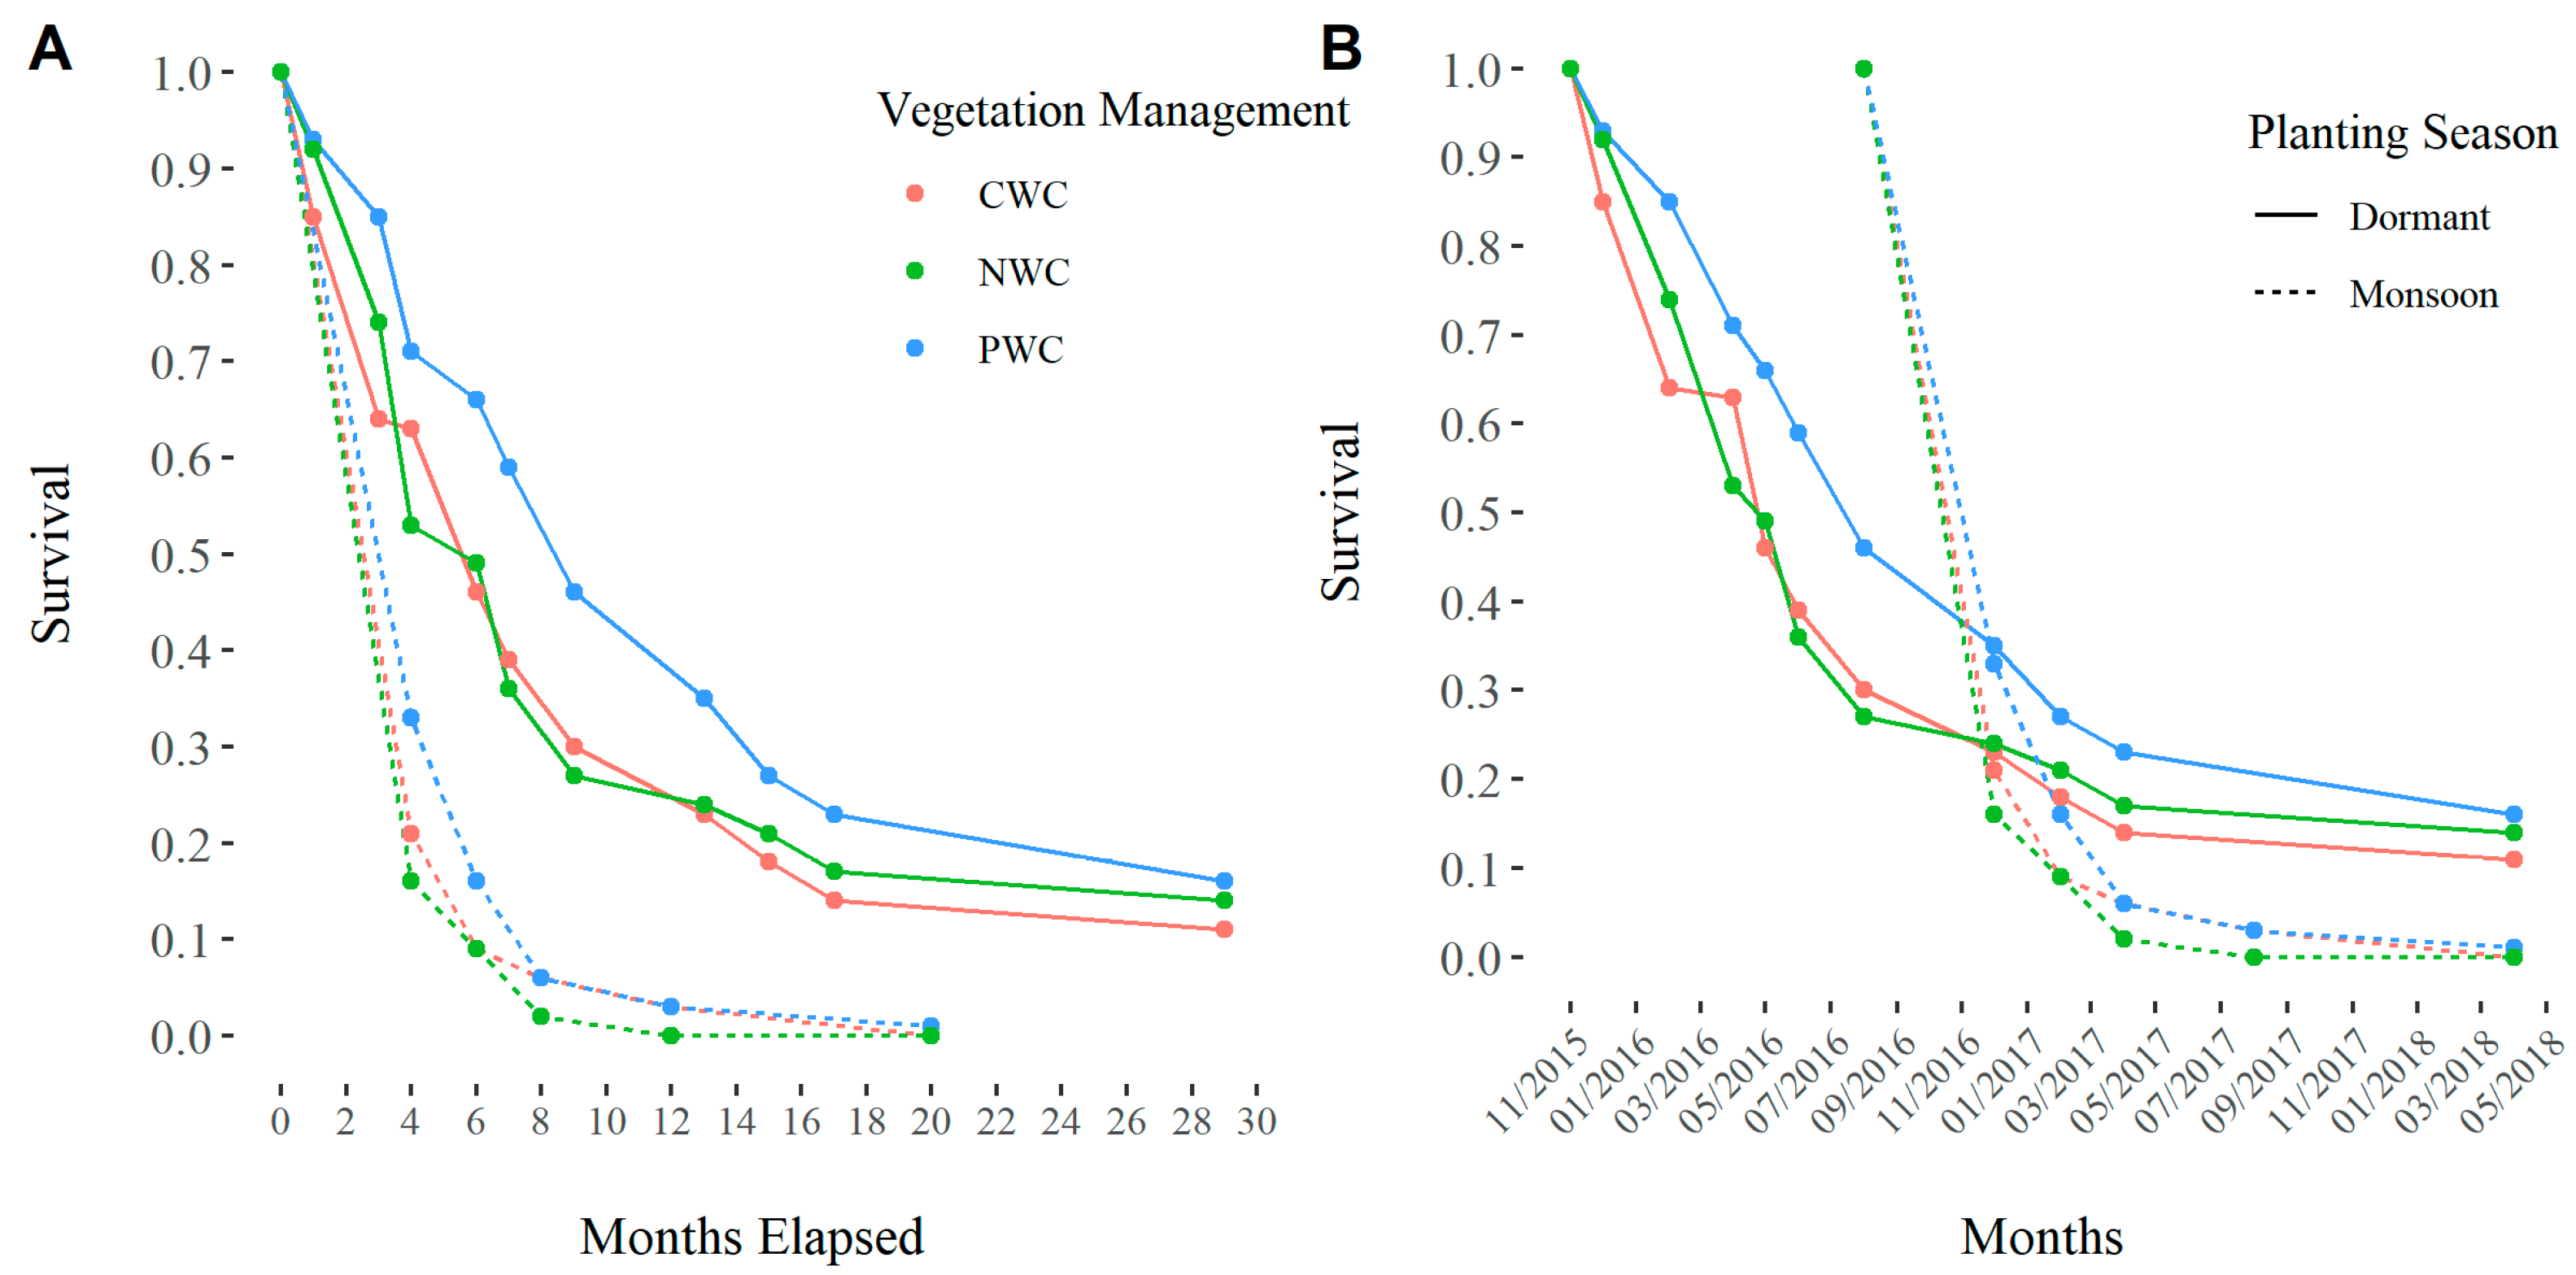
3.1. Survival
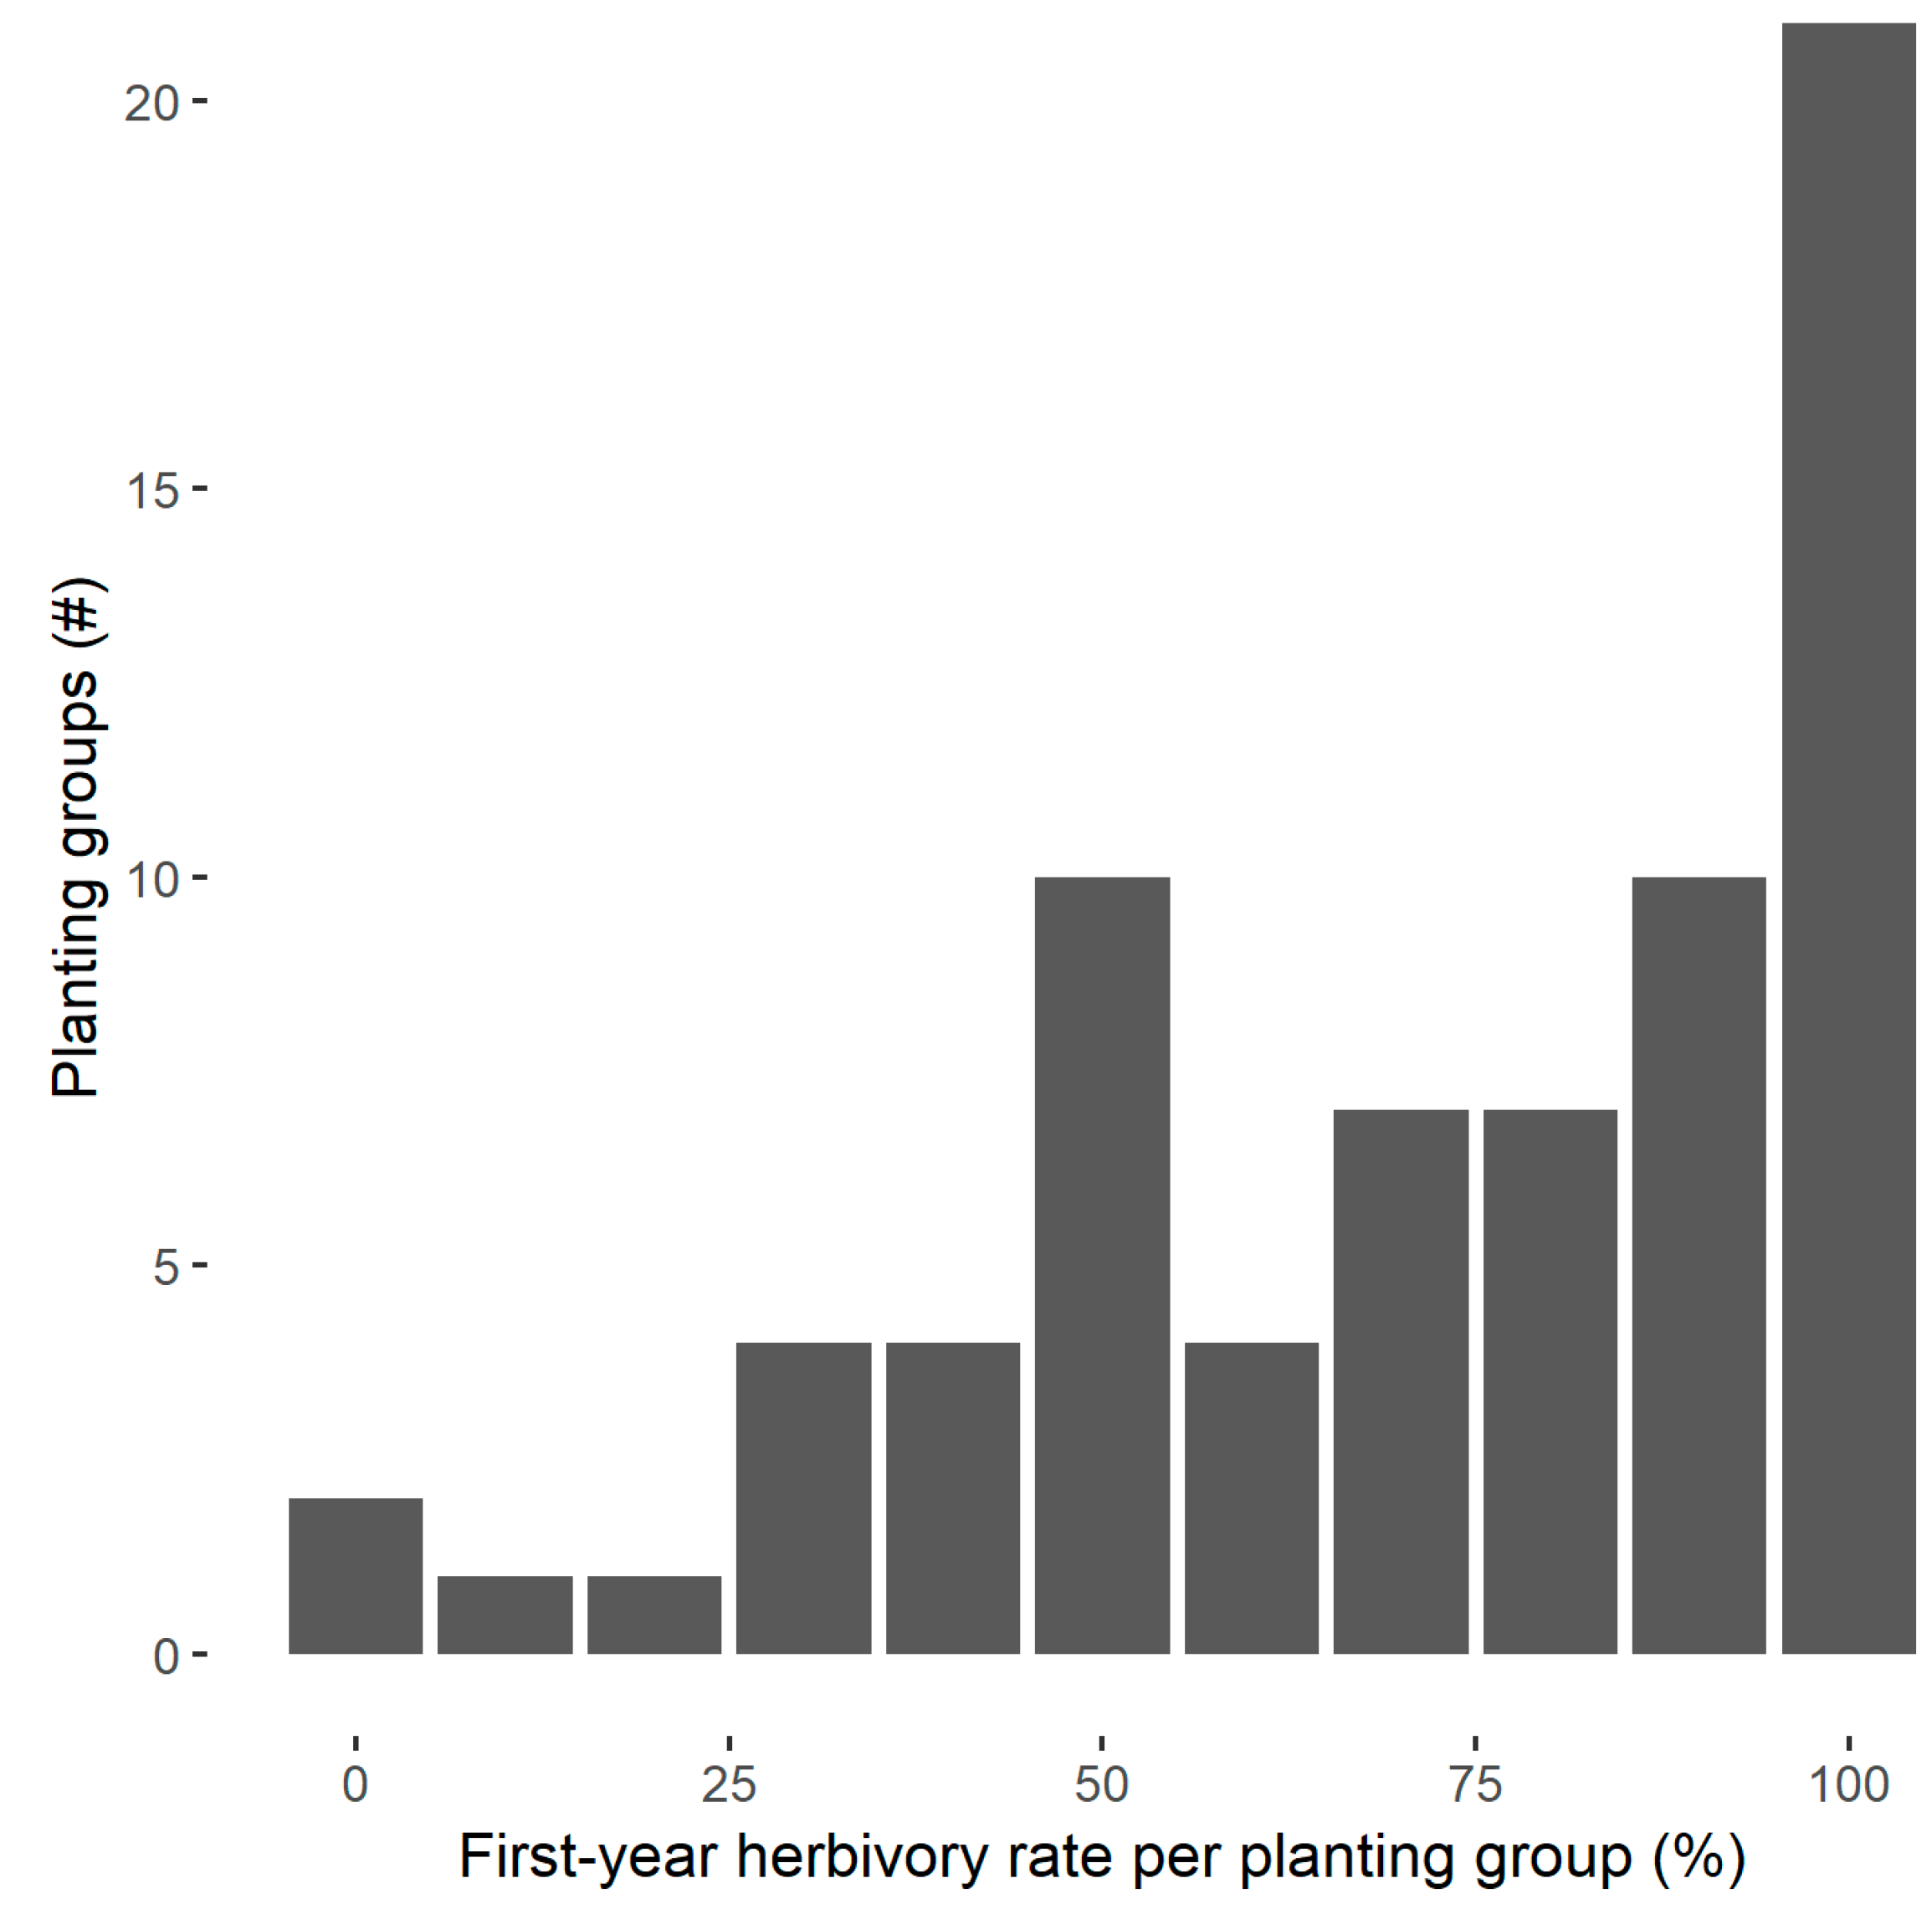
3.2. Herbivory
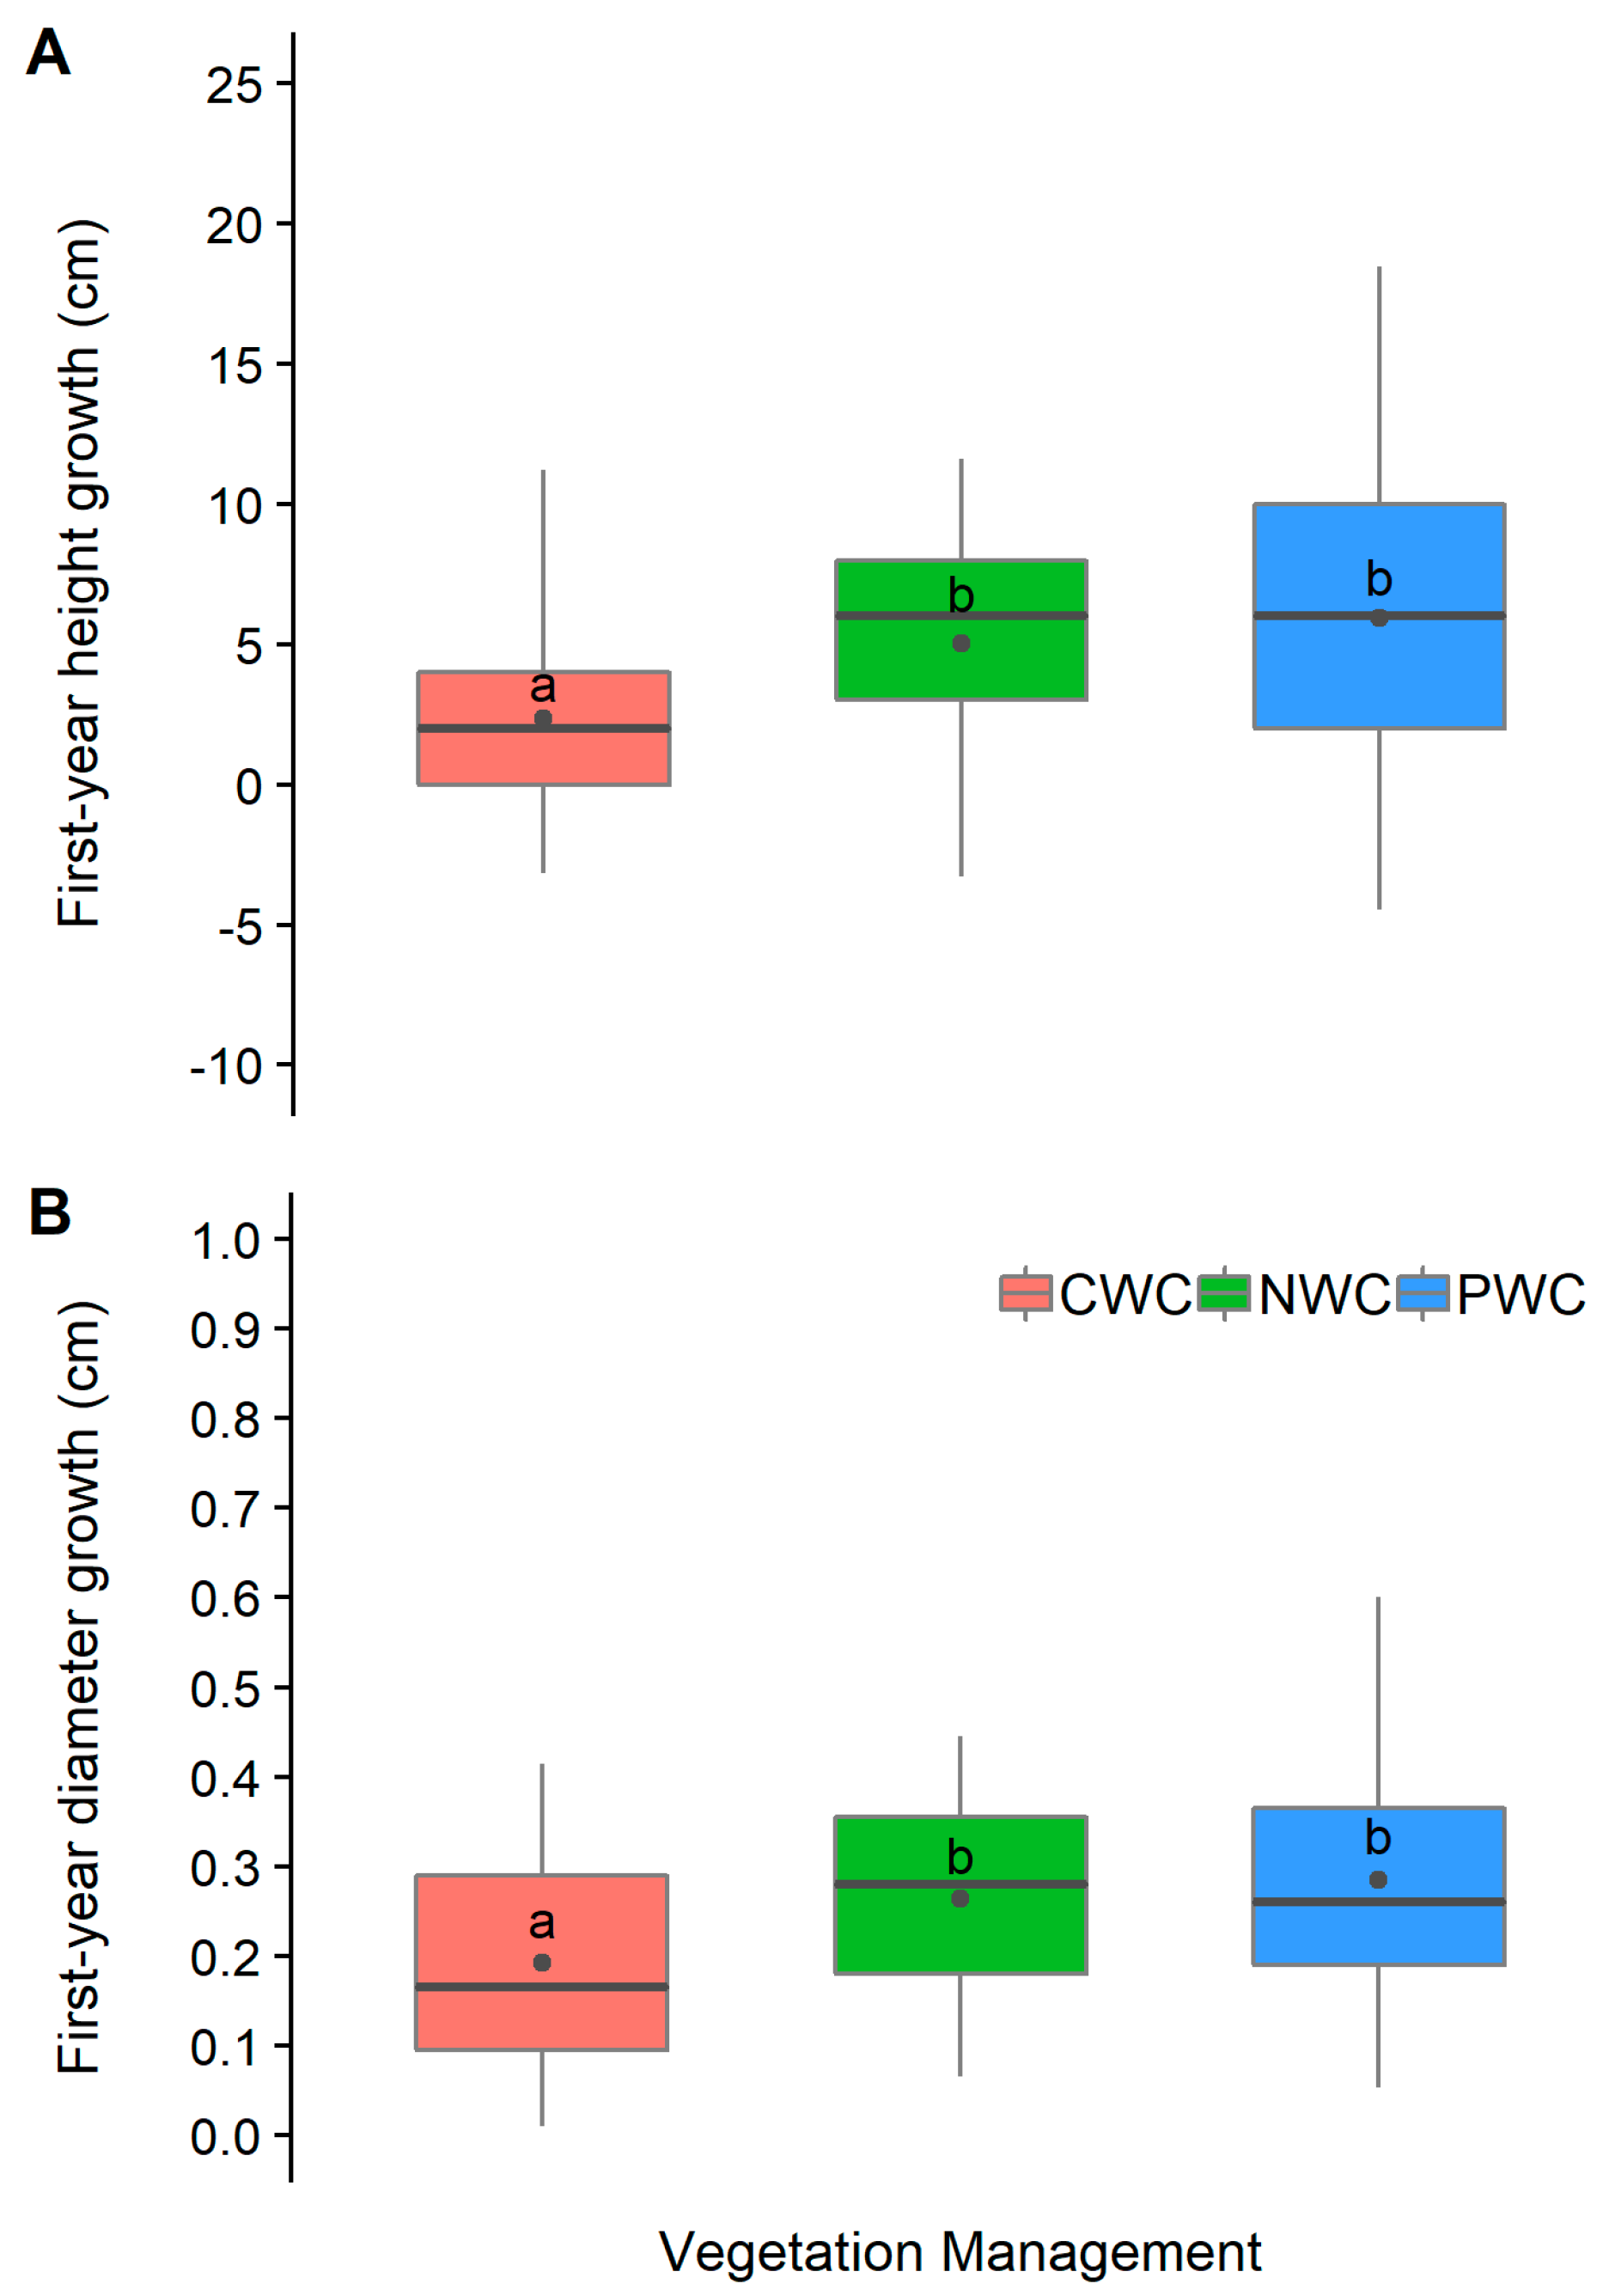
3.3. Growth
4. Discussion
4.1. Poor Survival and Herbivory Effects
4.2. Planting Season and Vegetation Management
4.3. Continuing Restoration Considerations
5. Conclusions
Author Contributions
Funding
Acknowledgments
Conflicts of Interest
References
- Oliver, W.W.; Ryker, R.A. Ponderosa pine. In Silvics of North America; Burns, R.M., Honkala, B.H., Eds.; United States Department of Agriculture Forest Service: Washington, DC, USA, 1990; pp. 413–424. [Google Scholar]
- Willyard, A.; Gernandt, D.S.; Potter, K.; Hipkins, V.; Marquardt, P.; Mahalovich, M.F.; Langer, S.K.; Telewski, F.W.; Cooper, B.; Douglas, C.; et al. Pinus ponderosa: A checkered past obscured four species. Am. J. Bot. 2017, 104, 161–181. [Google Scholar] [CrossRef] [PubMed]
- Callaham, R.Z. Pinus Ponderosa: A Taxonomic Review with Five Subspecies in the United States; United States Department of Agriculture Forest Service, Pacific Southwest Research Station: Albany, CA, USA, 2013. [Google Scholar]
- Ponderosa Pine. Available online: https://plants.usda.gov/core/profile?symbol=PIPOS (accessed on 6 February 2019).
- Cleland, D.T.; Freeouf, J.A.; Keys, J.E.; Nowacki, G.J.; Carpenter, C.A.; Mcnab, W.H. Ecological Subregions: Sections and Subsections for the Conterminous United States; United States Department of Agriculture Forest Service: Washington, DC, USA, 2007. [Google Scholar]
- Hinckley, L.C. The vegetation of the Mount Livermore area in Texas. Am. Mid. Nat. 1944, 32, 236–250. [Google Scholar] [CrossRef]
- Bataineh, M.M.; Oswald, B.P.; Bataineh, A.L.; Farrish, K.W.; Coble, D.W.; Edminster, C.B. Plant communities associated with Pinus ponderosa forests in the sky islands of the Davis Mountains, Texas. J. Torr. Bot. Soc. 2007, 134, 468–478. [Google Scholar] [CrossRef]
- Poulos, H.; Camp, A.E.; Gatewood, R.G.; Loomis, L. A hierarchical approach for scaling forest inventory and fuels data from local to landscape scales in the Davis Mountains, Texas, USA. For. Ecol. Manag. 2007, 244, 1–15. [Google Scholar] [CrossRef]
- Poulos, H.M.; Camp, A.E. Topographic influences on vegetation mosaics and tree diversity in the Chihuahuan Desert Borderlands. Ecology 2010, 91, 1140–1151. [Google Scholar] [CrossRef]
- Reynolds, R.T.; Sanchez Meador, A.J.; Youtz, J.A.; Nicolet, T.; Matonis, M.S.; Jackson, P.L.; Delorenzo, D.G.; Graves, A.D. Restoring Composition and Structure in Southwestern Frequent-Fire Forests: A Science-Based Framework for Improving Ecosystem Resiliency; United States Department of Agriculture Forest Service, Rocky Mountain Research Station: Fort Collins, CO, USA, 2013. [Google Scholar]
- Millar, C.I.; Stephenson, N.L. Temperate forest health in an era of megadisturbance. Science 2015, 349, 823–826. [Google Scholar] [CrossRef] [PubMed]
- Poulos, H.M.; Villanueva Diaz, J.; Cerano Paredes, J.; Camp, A.E.; Gatewood, R.G. Human influences on fire regimes and forest structure in the Chihuahuan Desert Borderlands. For. Ecol. Manag. 2013, 98, 1–11. [Google Scholar] [CrossRef]
- Bataineh, M.M. Stand Structure of Piñon-Juniper Communities in the Sky Islands of the Davis Mountains, Texas. Ph.D. Dissertation, Stephen F. Austin State University, Nacogdoches, TX, USA, 2006. [Google Scholar]
- Prestemon, J.; Pye, J.; Barbour, J.; Smith, G.R.; Ince, P.; Steppleton, C.; Xu, W.U.S. Wood-Using Mill Locations—2005. Available online: http://www.srs.fs.usda.gov/econ/data/mills (accessed on 7 February 2017).
- Mount Locke Cooperative Precipitation Data. Available online: https://www.weather.gov/maf/cli_maf_coop_annprecip_mount_locke (accessed on 1 October 2016).
- Mount Locke, TX Average of Average Temperature. Available online: https://wrcc.dri.edu/cgi-bin/cliMAIN.pl?tx6104 (accessed on 1 October 2016).
- Bataineh, M.M. Community Classification in the Davis Mountains Sky Islands: Ponderosa Pine (Pinus Ponderosa Laws) and Adjacent Communities. Master’s Thesis, Stephen F. Austin State University, Nacogdoches, TX, USA, 2004. [Google Scholar]
- Savage, M.; Brown, P.B.; Feddema, J. The role of climate in a pine forest regeneration pulse in the southwestern United States. Ecoscience 1996, 3, 310–318. [Google Scholar] [CrossRef]
- Savage, M.; Mast, J.N. How resilient are southwestern ponderosa pine forests after crown fires? Can. J. For. Res. 2005, 35, 967–977. [Google Scholar] [CrossRef] [Green Version]
- Renwick, K.M.; Rocca, M.E.; Stohlgren, T.J. Biotic disturbance facilities range shift at the trailing but not the leading edge of lodgepole pine’s altitudinal distribution. J. Veg. Sci. 2016, 27, 780–788. [Google Scholar] [CrossRef]
- Ozanne, C.M.P.; Anhuf, D.; Boulter, S.L.; Keller, M.; Kitching, R.L.; Körner, C.; Meinzer, F.C.; Mitchell, A.W.; Nakashizuka, T.; Silva Dias, P.L.; et al. Biodiversity meets the atmosphere: A global view of forest canopies. Science 2003, 301, 183–186. [Google Scholar] [CrossRef] [PubMed]
- Nakamura, A.; Kitching, R.L.; Cao, M.; Creedy, T.J.; Fayle, T.M.; Freiberg, M.; Hewitt, C.N.; Itioka, T.; Pin Koh, L.; Malhi, K.; et al. Forests and Their Canopies: Achievements and horizons in canopy science. Trends Ecol. Evol. 2017, 32, 438–451. [Google Scholar] [CrossRef] [PubMed]
- Schubert, G.H. Silviculture of Southwestern Ponderosa Pine: The Status of Our Knowledge; United States Department of Agriculture Forest Service, Rocky Mountain Research Station: Fort Collins, CO, USA, 1974. [Google Scholar]
- Turner, A. Soil Survey of Jeff Davis County, Texas. Available online: https://www.nrcs.usda.gov/Internet/FSE_MANUSCRIPTS/texas/TX243/0/Jeff%20Davis.pdf (accessed on 1 October 2016).
- R Development Core Team. R: A Language and Environment for Statistical Computing; R Version 3.3.2; R Foundation for Statistical Computing: Vienna, Austria, 2016. [Google Scholar]
- Bates, D.; Maechler, M.; Bolker, B.; Walker, S. Fitting linear mixed-effects models using lme4. J. Stat. Soft. 2015, 67, 1–48. [Google Scholar] [CrossRef]
- Fox, J.; Weisberg, S. An (R) Companion to Applied Regression, 2nd ed.; Sage: Thousand Oaks, CA, USA, 2011. [Google Scholar]
- Hothorn, T.; Bretz, F.; Westfall, P. Simultaneous inference in General Parametric Models. Biom. J. 2008, 50, 346–363. [Google Scholar] [CrossRef] [PubMed]
- Pinheiro, J.; Bates, D.; Debroy, S.; Sarkar, D.; R Core Team. Nlme: Linear and Nonlinear Mixed Effects Models. R Package Version 3.1-128. Available online: http://CRAN.R-project.org/package=nlme (accessed on 1 October 2016).
- Ouzts, J.; Kolb, T.; Huffman, D.; Sánchez Meador, A. Post-fire ponderosa pine regeneration with and without planting in Arizona and New Mexico. For. Ecol. Manag. 2015, 354, 281–290. [Google Scholar] [CrossRef] [Green Version]
- Davis, W.B.; Buechner, H.K. Pocket gophers (Thomomys) of the Davis Mountains, Texas. J. Mammal. 1946, 27, 265–271. [Google Scholar] [CrossRef]
- Reichman, O.J.; Baker, R.J. Distribution and movements of two species of pocket gophers (Geomyidae) in an area of sympatry in the Davis Mountains, Texas. J. Mammal. 1972, 53, 21–33. [Google Scholar] [CrossRef]
- Williams, S.L.; Baker, R.J. Vagility and local movements of pocket gophers (Geomyidae: Rodentia). Am. Mid. Nat. 1976, 96, 303–316. [Google Scholar] [CrossRef]
- Dingle, R.W. Pocket gophers as a cause of mortality in eastern Washington pine plantations. J. For. 1956, 54, 832–835. [Google Scholar]
- Hooven, E.F. Pocket gopher damage on ponderosa pine plantations in southwestern Oregon. J. Wild. Manag. 1971, 35, 346–353. [Google Scholar] [CrossRef]
- Barnes, V.G., Jr. Survival and growth of ponderosa pine seedlings injured by pocket gophers. Tree Plant. Notes 1978, 29, 20–23. [Google Scholar]
- Engeman, R.M.; Witmer, G.W. Integrated management tactics for predicting and alleviating pocket gopher (Thomomys spp.) damage to conifer reforestation plantings. Int. Pest Manag. Rev. 2000, 5, 41–55. [Google Scholar] [CrossRef]
- Lynn, J.S.; Canfield, S.; Conover, R.R.; Keene, J.; Rudgers, J.A. Pocket gopher (Thomomys talpoides) soil disturbance peaks at mid-elevation and is associated with air temperature, forb cover, and plant diversity. Arct. Antarct. Alp. Res. 2018, 50. [Google Scholar] [CrossRef]
- Millar, M.A. Seasonal trends in burrowing of Pocket Gophers (Thomomys). J. Mammal. 1948, 29, 38–44. [Google Scholar] [CrossRef]
- Godfrey, M.E.R. A novel strategy for pocket gopher control. In Eighth Great Plains Wildlife Damage Control Workshop Proceedings; United States Department of Agriculture Forest Service, Rocky Mountain Forest and Range Experiment Station: Fort Collins, CO, USA, 1988; pp. 103–107. [Google Scholar]
- Shepperd, W.D.; Battaglia, M.A. Ecology, Silviculture, and Management of Black Hills Ponderosa Pine; United States Department of Agriculture Forest Service, Rocky Mountain Research Station: Fort Collins, CO, USA, 2002. [Google Scholar]
- Castro, J.; Leverkus, A.B. Effect of herbaceous layer interference on the post-fire regeneration of a serotinous pine (Pinus pinaster Aiton) across two seedling ages. Forests 2019, 10, 74. [Google Scholar] [CrossRef]
- Maguire, W.P. Are ponderosa pine cone crops predictable? J. For. 1956, 54, 778–779. [Google Scholar]
- Petrie, M.D.; Wildeman, A.M.; Bradford, J.B.; Hubbard, R.M.; Lauenroth, W.K. A review of precipitation and temperature control on seedling emergence and establishment for ponderosa and lodgepole pine forest regeneration. For. Ecol. Manag. 2016, 361, 328–338. [Google Scholar] [CrossRef]
- Petrie, M.D.; Bradford, J.B.; Hubbard, R.M.; Lauenroth, W.K.; Andrews, C.M.; Schlaepfer, D.R. Climate change may restrict dryland forest regeneration in the 21st century. Ecology 2017, 98, 1548–1559. [Google Scholar] [CrossRef]
- Roccaforte, J.P.; Fulé, P.Z.; Walker Chancellor, W.; Laughlin, D.C. Woody debris and tree regeneration dynamics following severe wildfires in Arizona ponderosa pine forests. Can. J. For. Res. 2012, 42, 593–604. [Google Scholar] [CrossRef]
- Savage, M.; Mast, J.N.; Feddema, J.J. Double whammy: High-severity fire and drought in ponderosa pine forests of the Southwest. Can. J. For. Res. 2013, 43, 570–583. [Google Scholar] [CrossRef]
- Chambers, M.E.; Fornwalt, P.J.; Malone, S.L.; Battaglia, M.A. Patterns of conifer regeneration following high severity wildfire in ponderosa pine-dominated forests of the Colorado Front Range. For. Ecol. Manag. 2016, 378, 57–67. [Google Scholar] [CrossRef]
- Battaglia, M.; Smith, F.W.; Shepperd, W.D. Predicting mortality of ponderosa pine regeneration after prescribed fire in the Black Hills, South Dakota, USA. Int. J. Wild. Fire 2009, 18, 176–190. [Google Scholar] [CrossRef]
- Guldin, J.M. Silvicultural options in forests of the southern United States under changing climatic conditions. New For. 2019, 50, 71–87. [Google Scholar] [CrossRef]
- Linder, M.; Maroschek, M.; Netherer, S.; Kremer, A.; Barbati, A.; Garcia-Gonzalo, J.; Seidl, R.; Delzon, S.; Corona, P.; Kolström, M.; et al. Climate change impacts, adaptive capacity, and vulnerability of European forest ecosystems. For. Ecol. Manag. 2010, 259, 698–709. [Google Scholar] [CrossRef]
- Fuhrer, J.; Beniston, M.; Fischlin, A.; Frei, C.; Goyette, S.; Jasper, K.; Pfister, C. Climate risks and their impact on agriculture and forests in Switzerland. Clim. Chang. 2006, 79, 79–102. [Google Scholar] [CrossRef]


| Stand A | Stand B | Stand C | |
|---|---|---|---|
| Stand area | 5.8 ha | 14.6 ha | 17.2 ha |
| Residual basal area | 2.8 m2 ha−1 (SE: 0.6) | 3.4 m2 ha−1 (SE: 0.6) | 4.4 m2 ha−1 (SE: 1.0) |
| Ponderosa pine composition | 60% | 50% | 86% |
| Dormant·CWC planting groups | 5 | 5 | 5 |
| Dormant·NWC planting groups | 5 | 5 | 5 |
| Dormant·PWC planting groups | 5 | 5 | 5 |
| Monsoon·CWC planting groups | - | 4 | 5 b |
| Monsoon·NWC planting groups | - | 4 | 5 |
| Monsoon·PWC planting groups | - | 4 | 4 |
| ∑ Dormant planting groups | 15 | 15 | 15 |
| ∑ Dormant Seedlings (1-0, D40) | 150 | 150 | 150 |
| ∑ Monsoon planting groups | - | 12 | 14 |
| ∑ Monsoon Seedlings (2-0, D60) | - | 120 | 137 |
| ∑ Planting groups | 15 | 27 | 29 |
| ∑ Seedlings | 150 | 270 | 287 |
| Model # | Response Variable | Fixed Effects Parameters a | Random Effect b | GLM c Family | GLM Link | |||
|---|---|---|---|---|---|---|---|---|
| Type | Treatments | Year | Stand | Group in Stand | ||||
| 1 | Survival % | All | 1 | −1.23 − 0.04·X1 + 0.57·X2 − 19.66·X3 − 3.46·X4 − 16.74·X5 | 0.41 | - | Binomial | Logit |
| 2 | Dormant | 1 | −1.23 − 0.04·X1 + 0.57·X2 | 0.39 | - | Binomial | Logit | |
| 3 | Dormant | 2.5 | −1.95 − 0.25·X1 + 0.16·X2 | 0.64 | - | Binomial | Logit | |
| 4 | Herbivory % | All | 1 | 0.90 − 0.25·X1 − 0.72·X2 + 0.97·X3 + 0.41·X4 + 0.87·X5 | 0.49 | - | Binomial | Logit |
| 5 | All | 1.5 | 0.90 − 0.25·X1 − 0.72·X2 + 0.97·X3 + 0.41·X4 + 1.0 X5 | 0.49 | - | Binomial | Logit | |
| 6 | Dormant | 2.5 | 1.36 − 0.16·X1 − 0.37·X2 | 0.43 | - | Binomial | Logit | |
| 7 | Growth (cm) | Dormant (Height) | 1 | 5.1 − 2.64·X1 + 0.92·X2 | 0.68 | <0.01 | - | - |
| 8 | Dormant (Diameter) | 1 | 0.26 − 0.07·X1 + 0.02·X2 | <0.01 | 0.02 | - | - | |
| Model | Intercept | X1 | X2 | X3 | X4 | X5 | AIC |
|---|---|---|---|---|---|---|---|
| p-Values | |||||||
| 1 | <0.01 | 0.89 | 0.03 | 0.96 | 0.99 | 0.96 | 259.9 |
| 2 | <0.01 | 0.89 | 0.03 | - | - | - | 243.8 |
| 3 | <0.01 | 0.48 | 0.62 | - | - | - | 187.8 |
| 4 | <0.01 | 0.31 | <0.01 | <0.01 | 0.43 | 0.11 | 356.7 |
| 5 | <0.01 | 0.31 | <0.01 | <0.01 | 0.43 | 0.07 | 353.6 |
| 6 | <0.01 | 0.57 | 0.17 | - | - | - | 227.8 |
| 7 | <0.01 | 0.03 | 0.40 | - | - | - | 737.6 |
| 8 | <0.01 | 0.04 | 0.50 | - | - | - | −133.94 |
| Time | Planting Season | Vegetation Management | Alive | Desiccation | Herbivory | Total |
|---|---|---|---|---|---|---|
| number of planted seedlings | ||||||
| 1 year | Dormant | NWC | 35 (23%) | 10 (07%) | 105 (70%) | 150 |
| CWC | 35 (23%) | 18 (12%) | 97 (65%) | 150 | ||
| PWC | 53 (35%) | 16 (11%) | 81 (54%) | 150 | ||
| 123 (27%) | 44 (10%) | 283 (63%) | 450 | |||
| Monsoon | NWC | 0 (00%) | 12 (13%) | 78 (87%) | 90 | |
| CWC | 0 (00%) | 9 (10%) | 78 (90%) | 87 | ||
| PWC | 2 (03%) | 7 (09%) | 71 (89%) | 80 | ||
| 2 (01%) | 28 (11%) | 227 (88%) | 257 | |||
| 1.5 years | Dormant | NWC | 25 (17%) | 11 (07%) | 114 (76%) | 150 |
| CWC | 21 (14%) | 19 (13%) | 110 (73%) | 150 | ||
| PWC | 35 (24%) | 17 (11%) | 98 (65%) | 150 | ||
| 81 (18%) | 47 (10%) | 322 (72%) | 450 | |||
| Monsoon | NWC | 0 (00%) | 12 (13%) | 78 (87%) | 90 | |
| CWC | 0 (00%) | 9 (10%) | 78 (90%) | 87 | ||
| PWC | 1 (01%) | 7 (09%) | 72 (90%) | 80 | ||
| 1 (00%) | 28 (11%) | 228 (89%) | 257 | |||
| 2.5 years | Dormant | NWC | 21 (14%) | 11 (07%) | 118 (79%) | 150 |
| CWC | 17 (11%) | 19 (13%) | 114 (76%) | 150 | ||
| PWC | 24 (16%) | 18 (12%) | 108 (72%) | 150 | ||
| 62 (14%) | 48 (11%) | 340 (76%) | 450 | |||
© 2019 by the authors. Licensee MDPI, Basel, Switzerland. This article is an open access article distributed under the terms and conditions of the Creative Commons Attribution (CC BY) license (http://creativecommons.org/licenses/by/4.0/).
Share and Cite
Vickers, L.A.; Houser, J.; Rooni, J.; Guldin, J.M. Some Lessons Learned on Early Survival and Growth of Containerized, Locally-Sourced Ponderosa Pine Seedlings in the Davis Mountains of Western Texas, US. Forests 2019, 10, 267. https://doi.org/10.3390/f10030267
Vickers LA, Houser J, Rooni J, Guldin JM. Some Lessons Learned on Early Survival and Growth of Containerized, Locally-Sourced Ponderosa Pine Seedlings in the Davis Mountains of Western Texas, US. Forests. 2019; 10(3):267. https://doi.org/10.3390/f10030267
Chicago/Turabian StyleVickers, Lance A., James Houser, James Rooni, and James M. Guldin. 2019. "Some Lessons Learned on Early Survival and Growth of Containerized, Locally-Sourced Ponderosa Pine Seedlings in the Davis Mountains of Western Texas, US" Forests 10, no. 3: 267. https://doi.org/10.3390/f10030267