The Radial Growth of Schrenk Spruce (Picea schrenkiana Fisch. et Mey.) Records the Hydroclimatic Changes in the Chu River Basin over the Past 175 Years

 ,
,
Abstract
:1. Introduction
2. Data and Methods
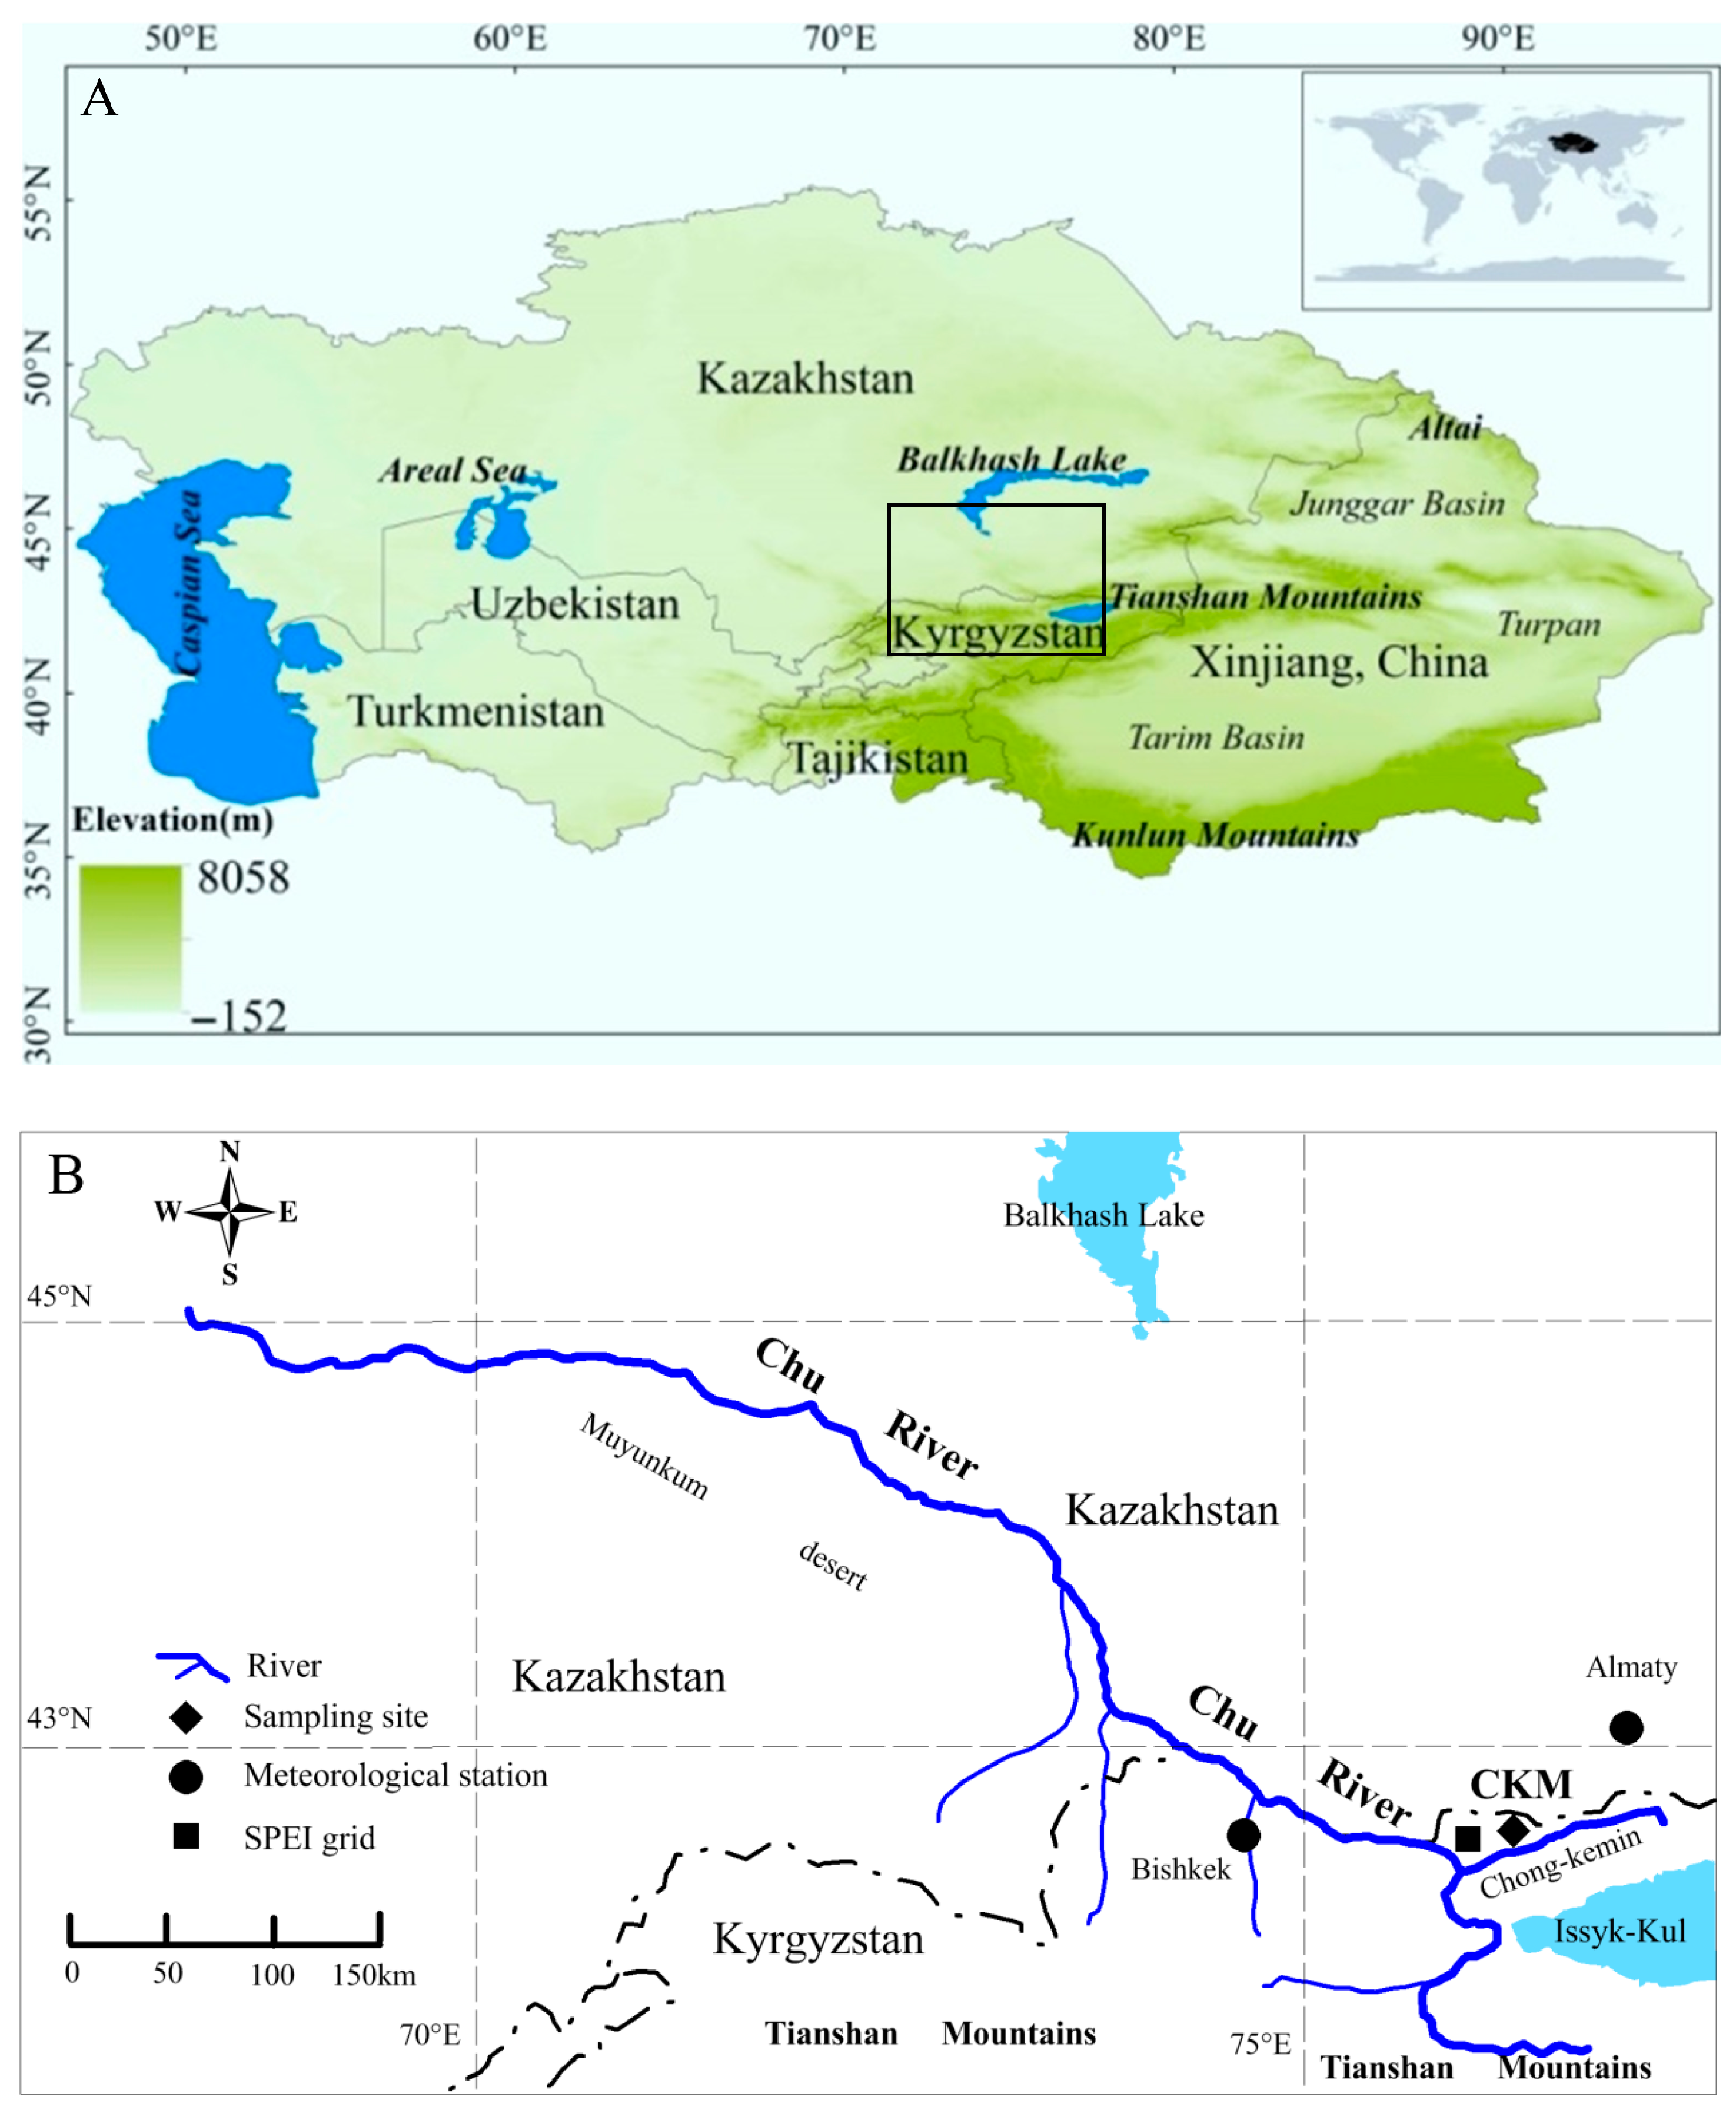
2.1. Study Area
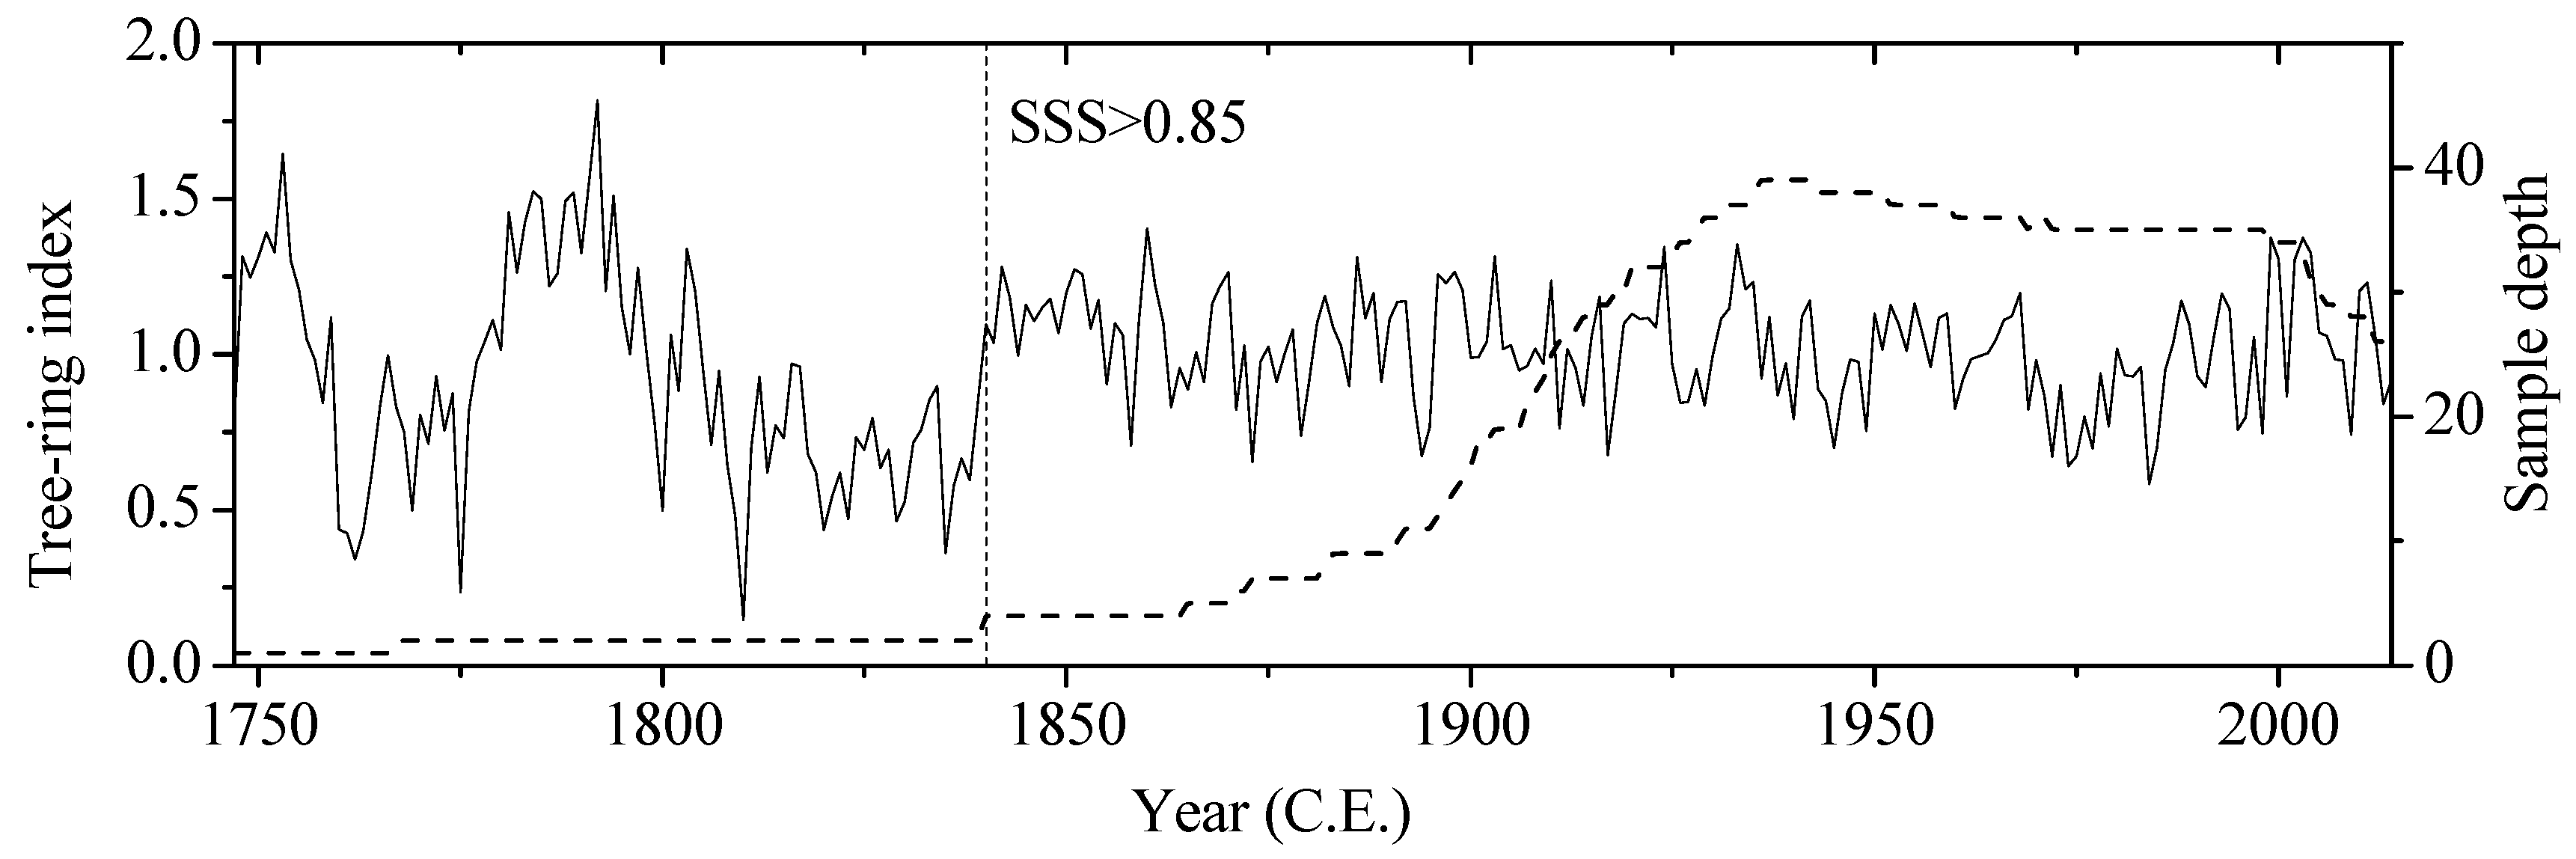
2.2. Tree-Ring Data
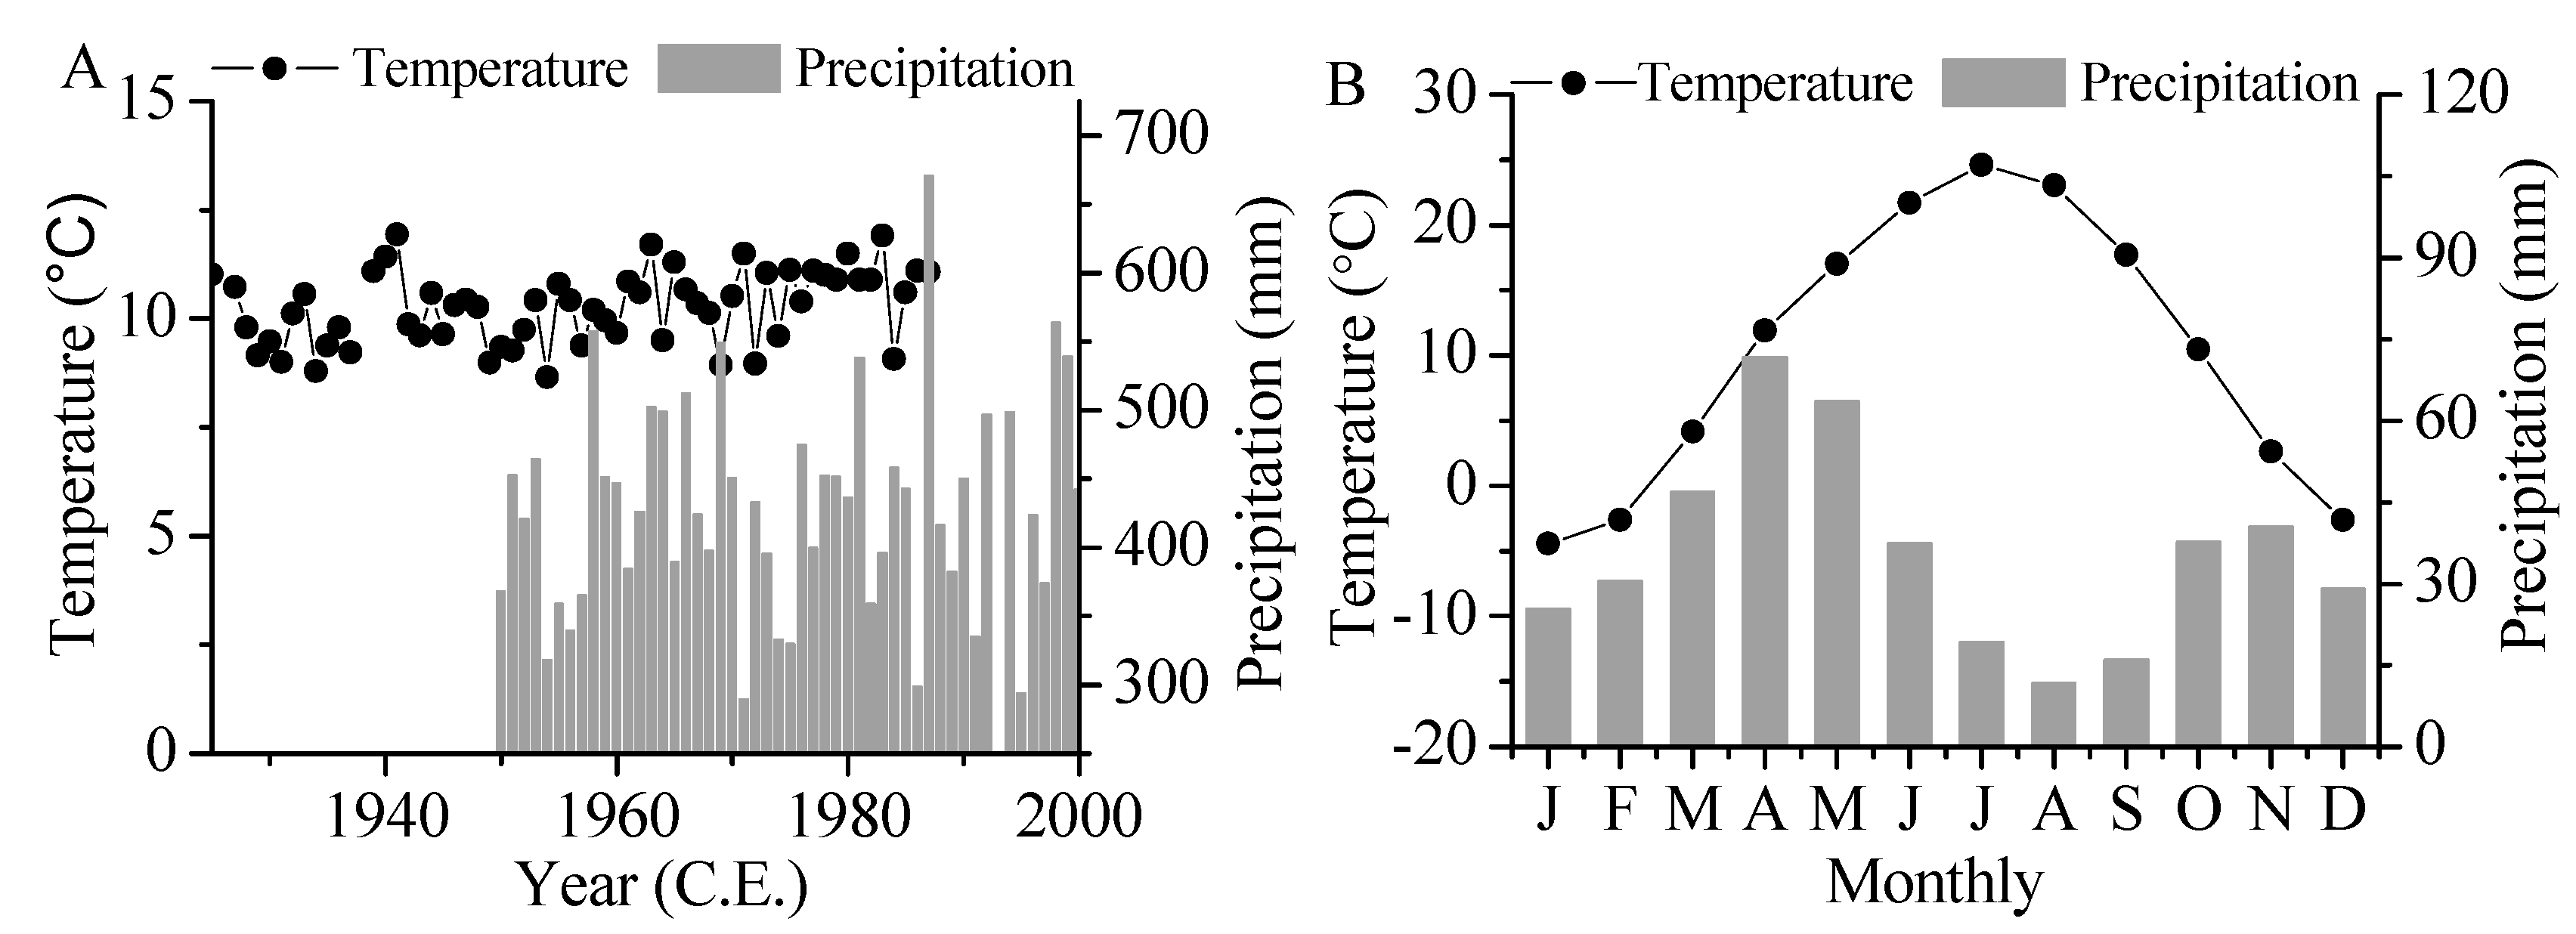
2.3. Meteorological and Hydrological Data
2.4. Methods
3. Results
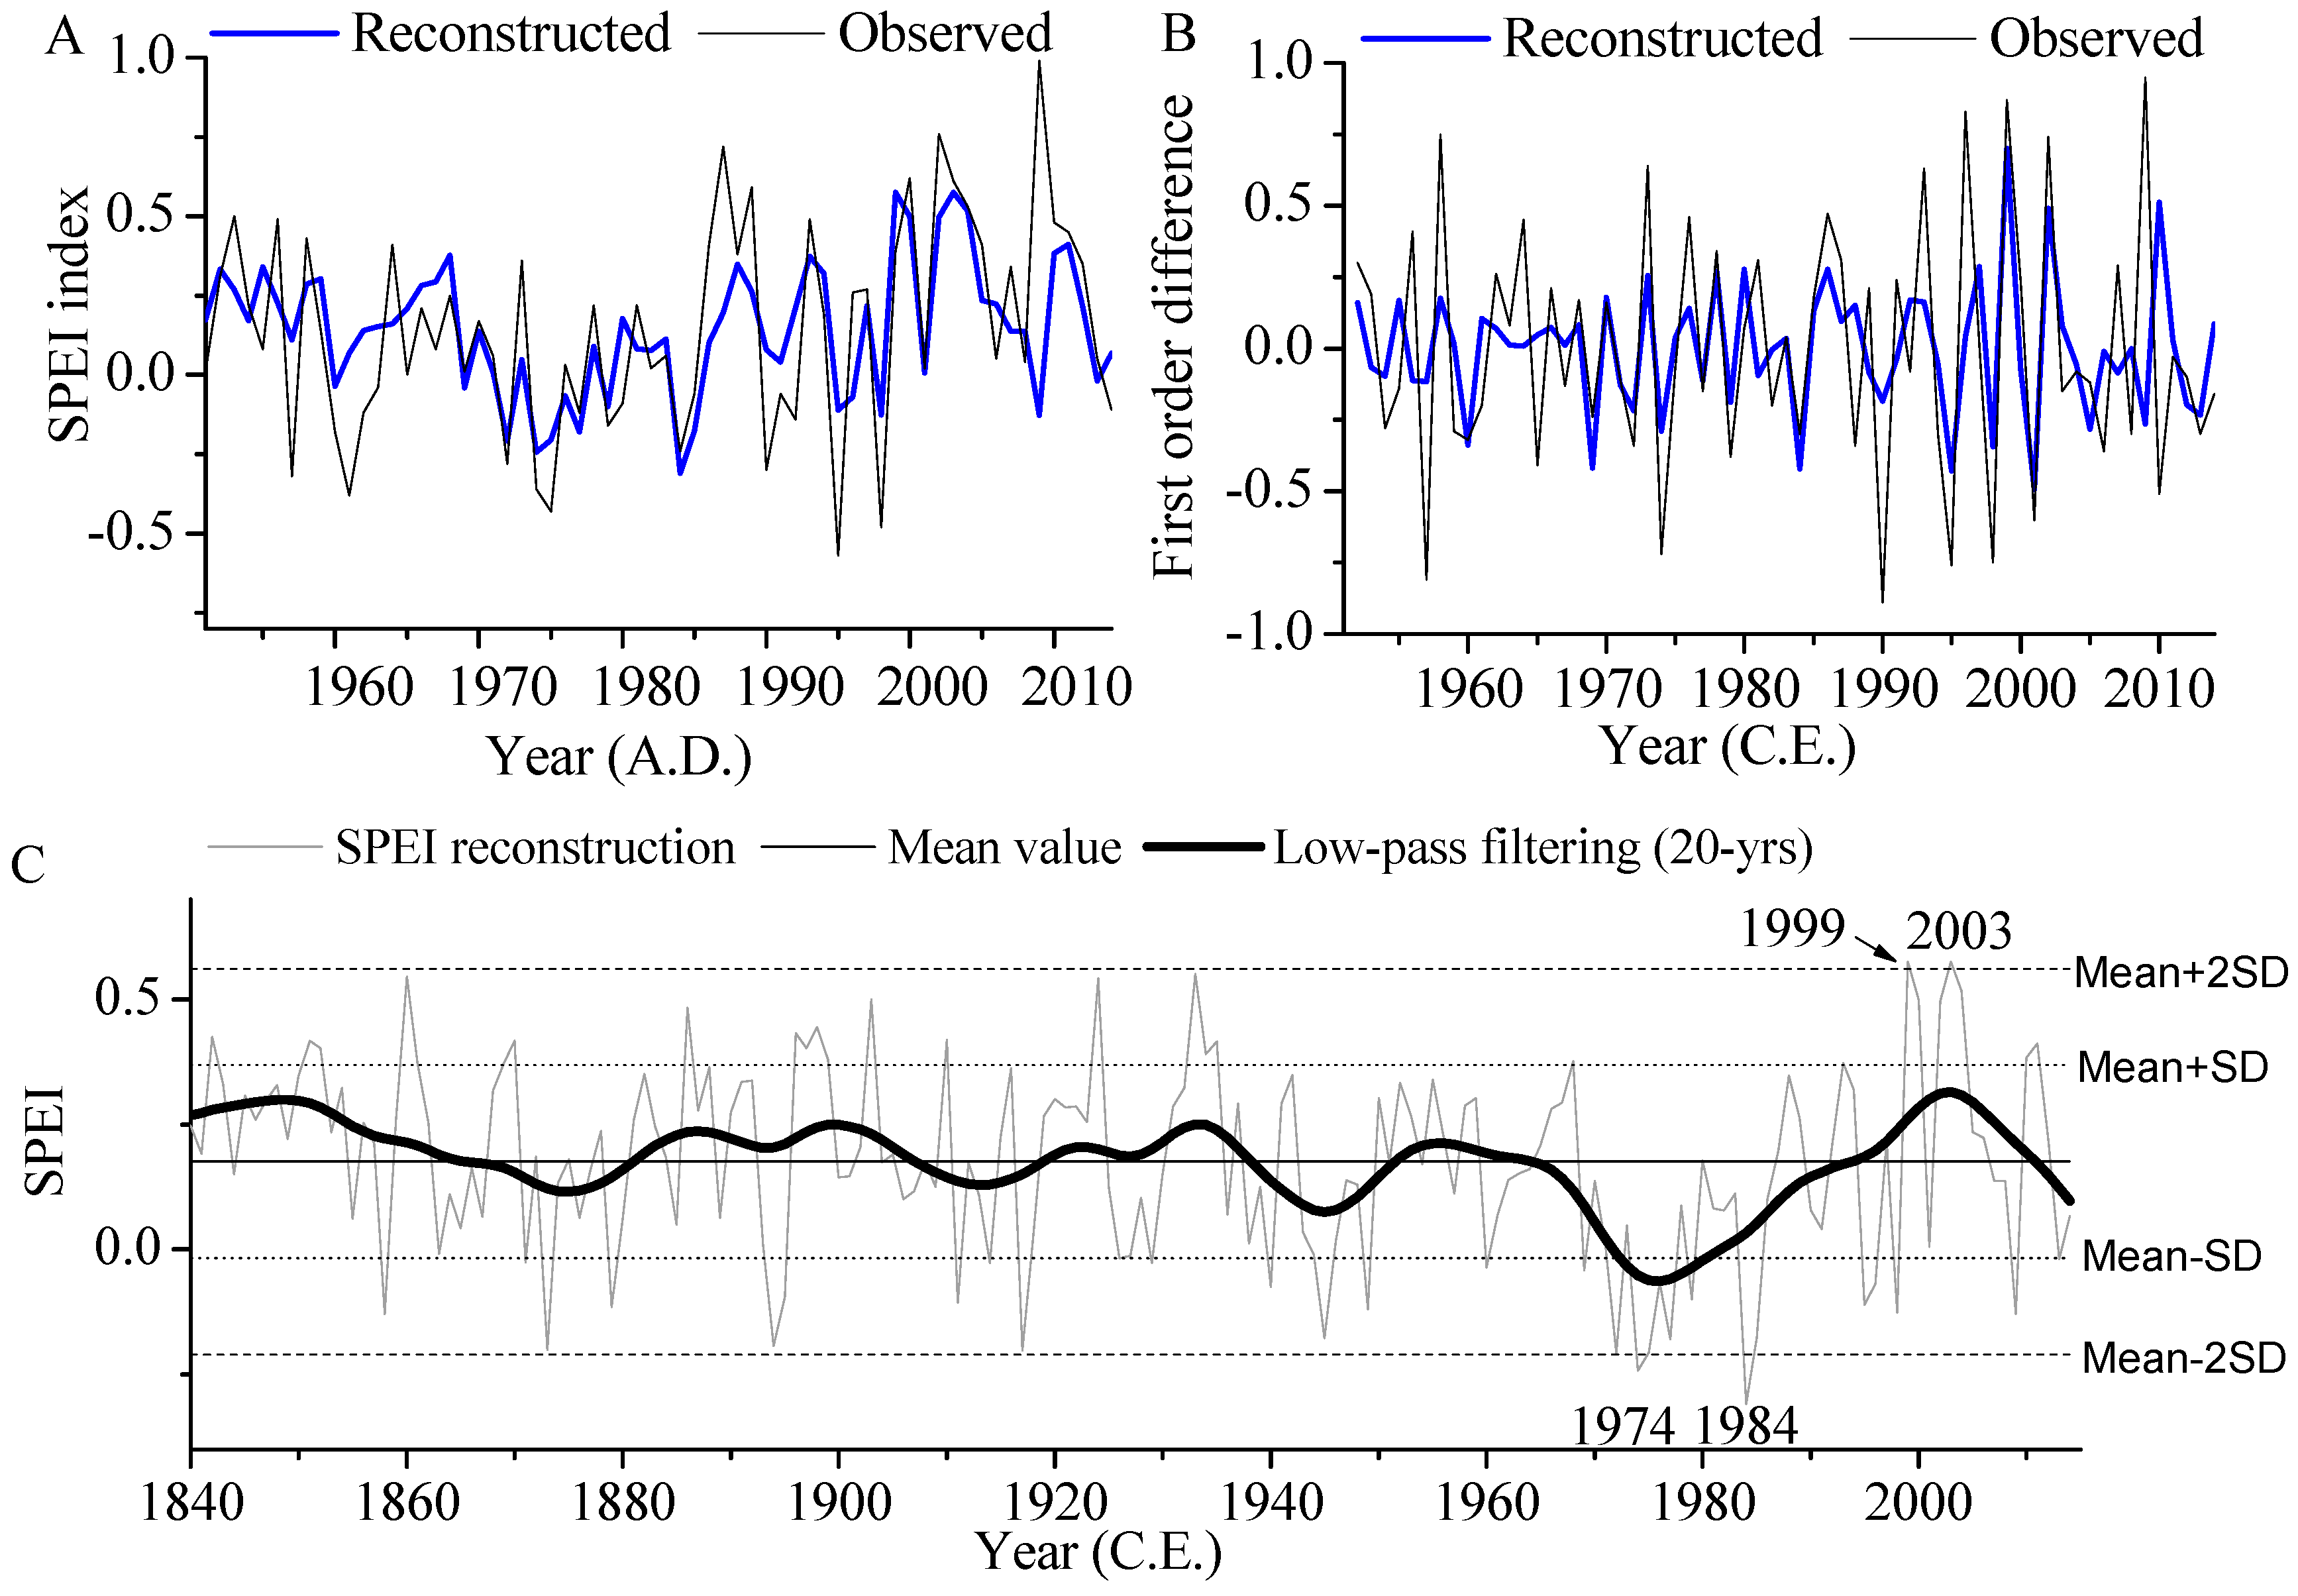
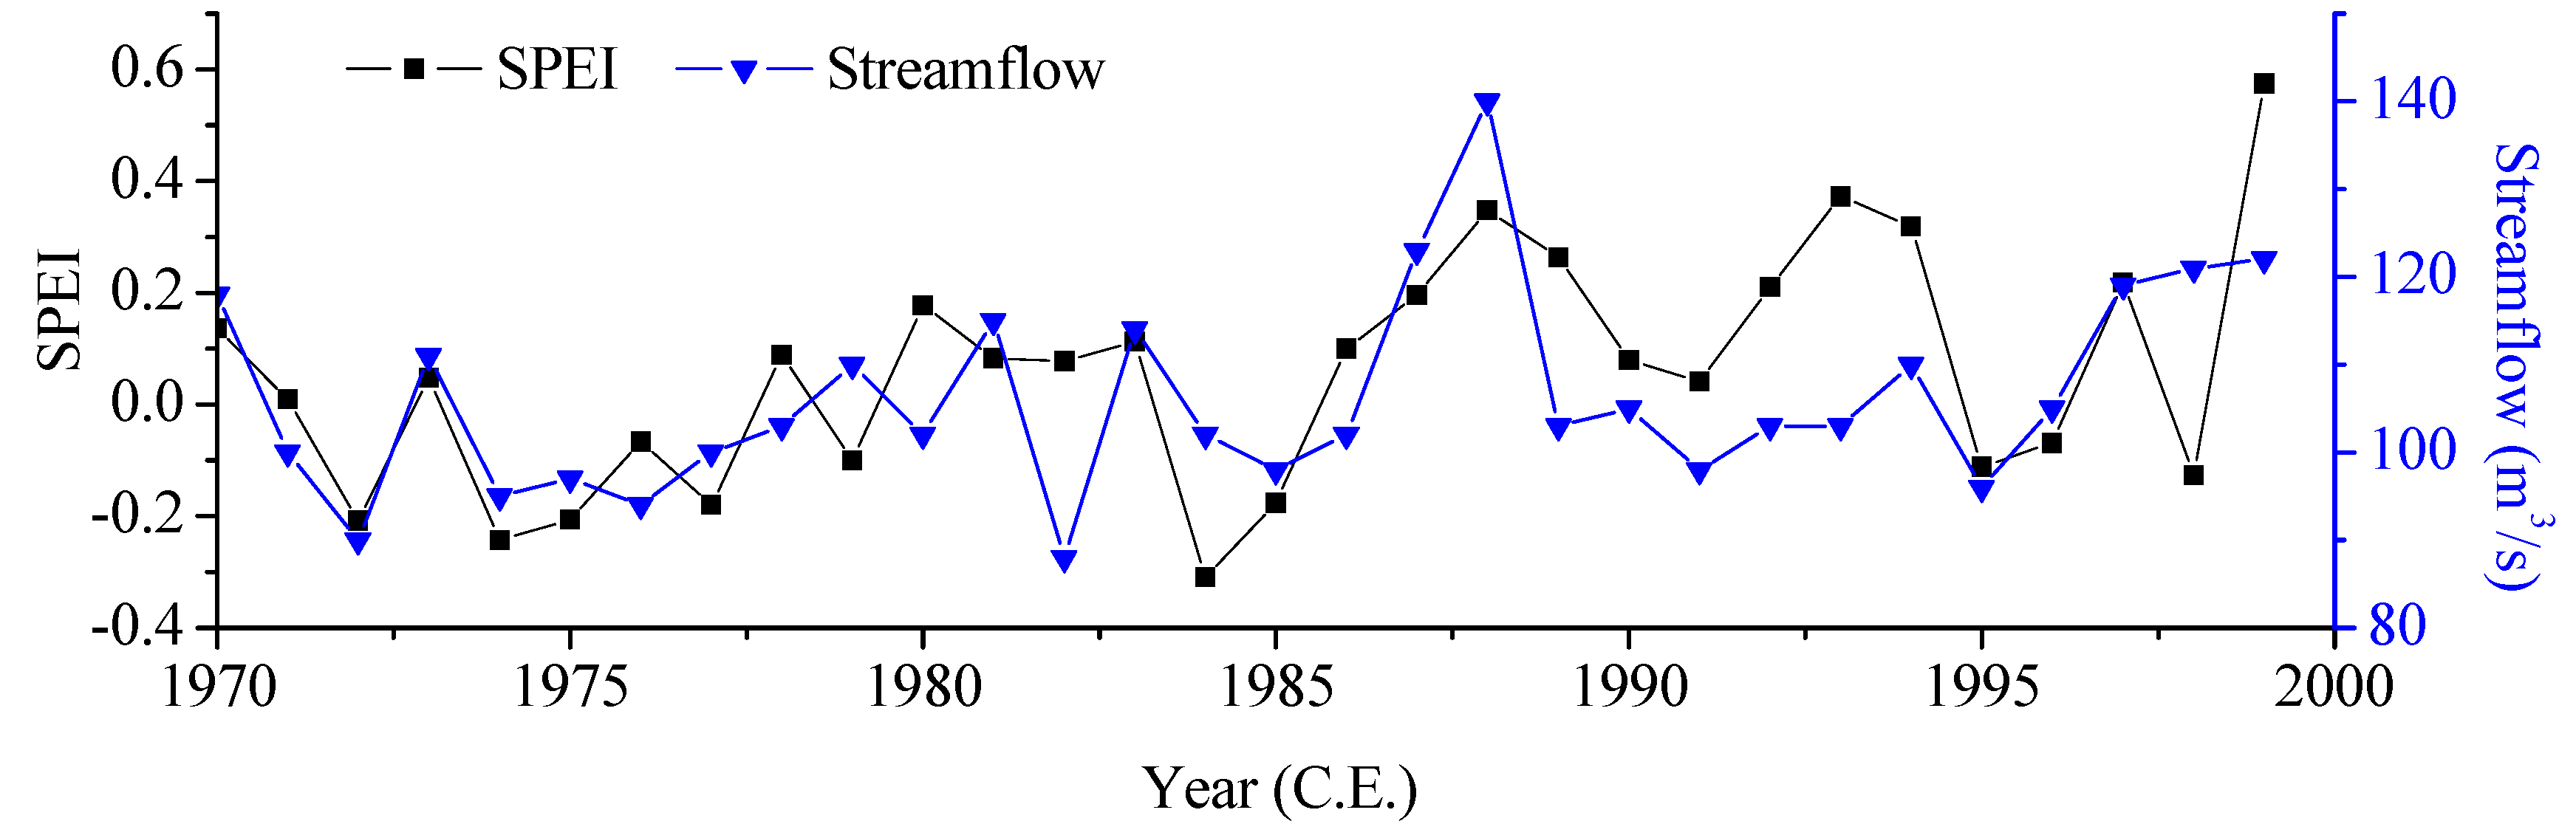
3.1. Tree-Ring Response to Climate and the Reconstructed SPEI
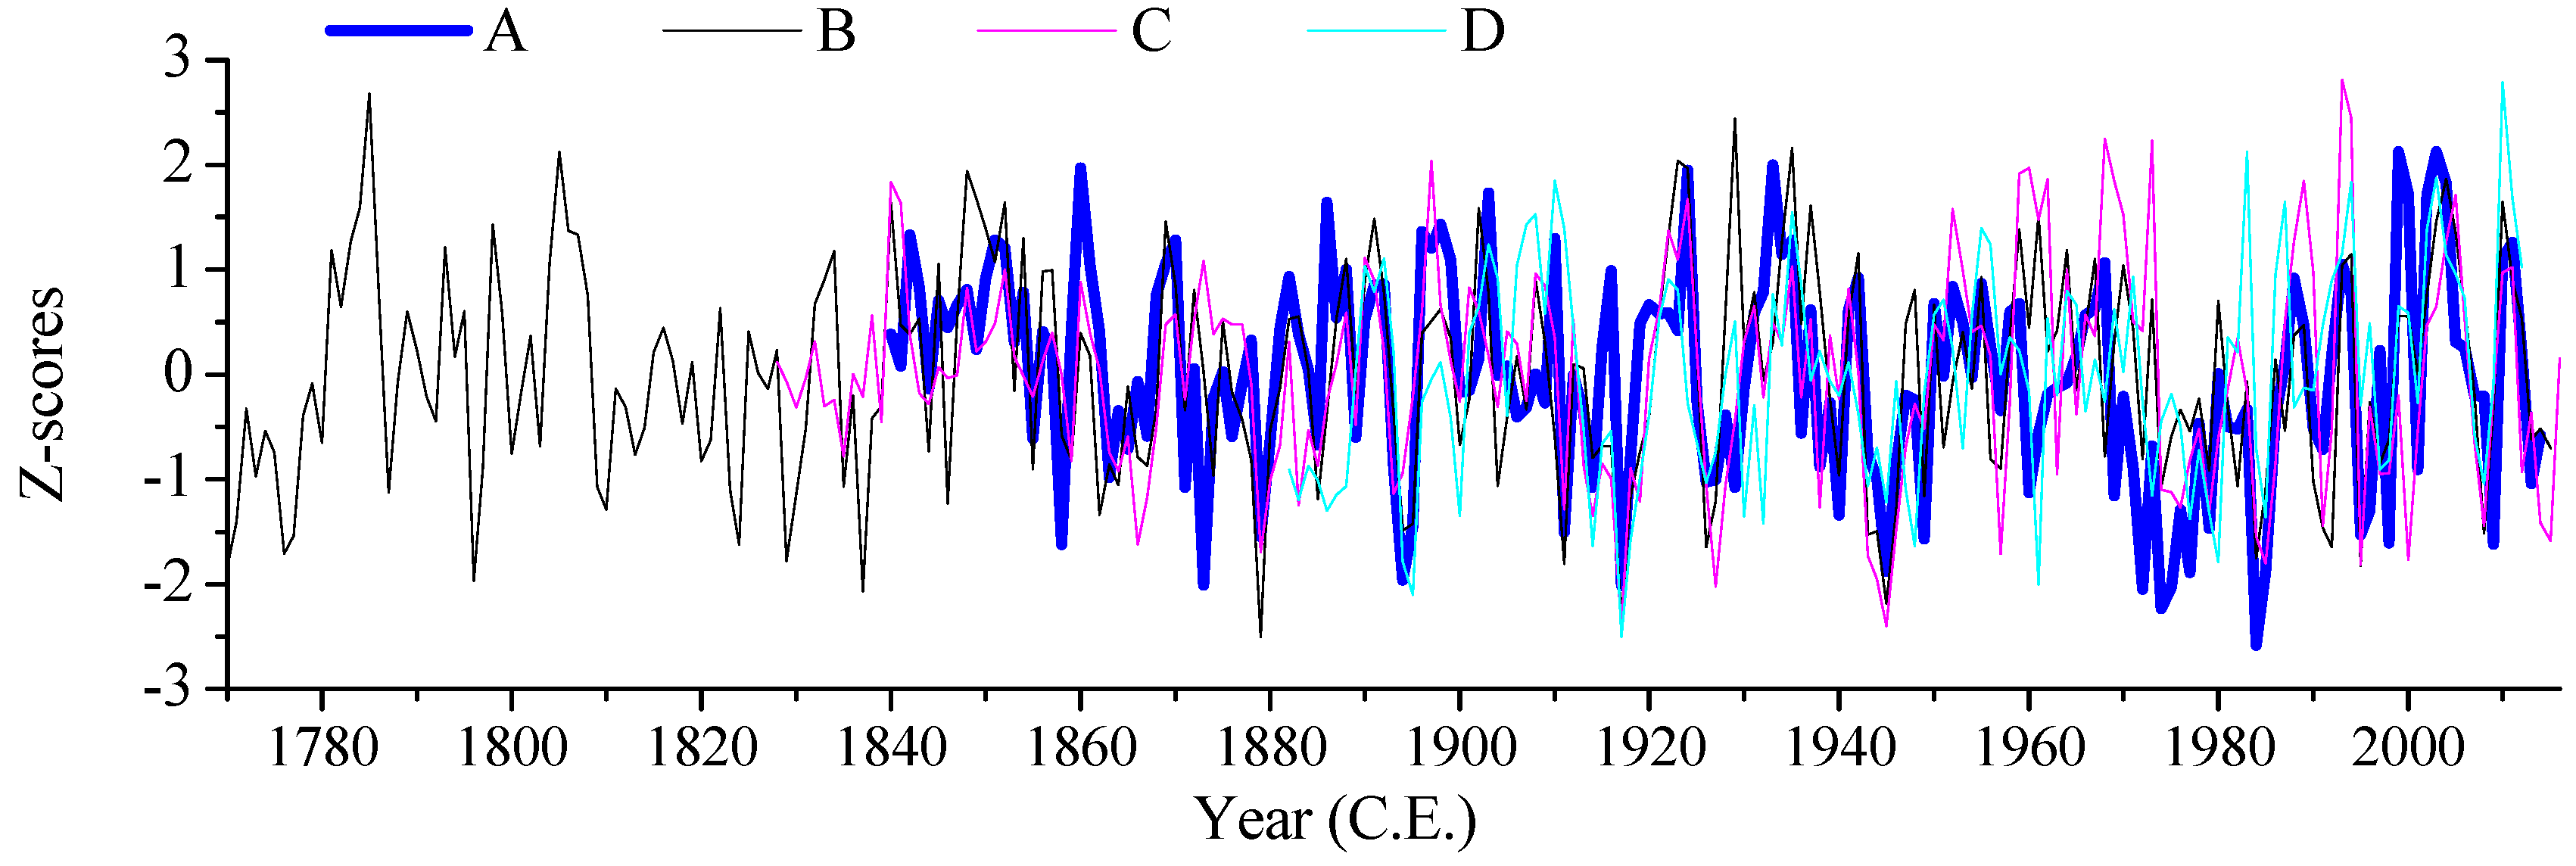
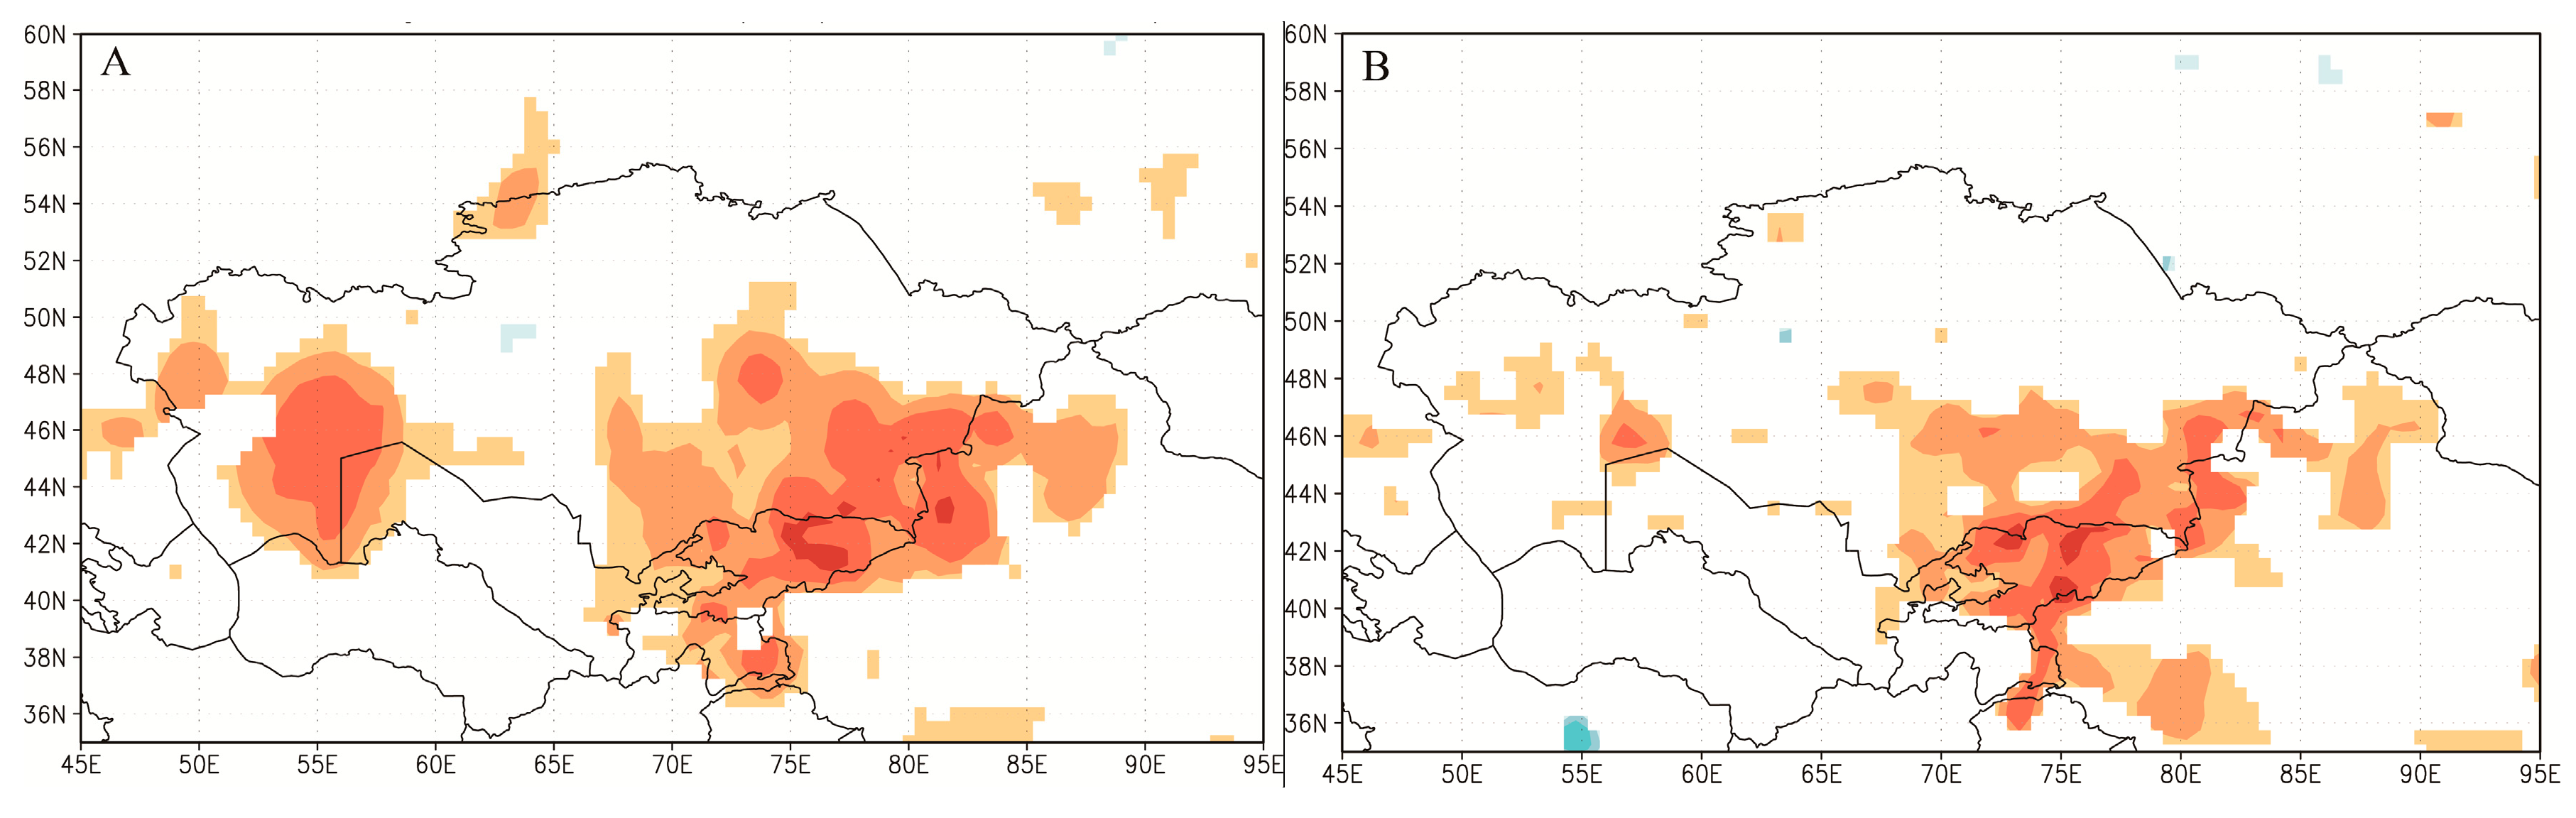
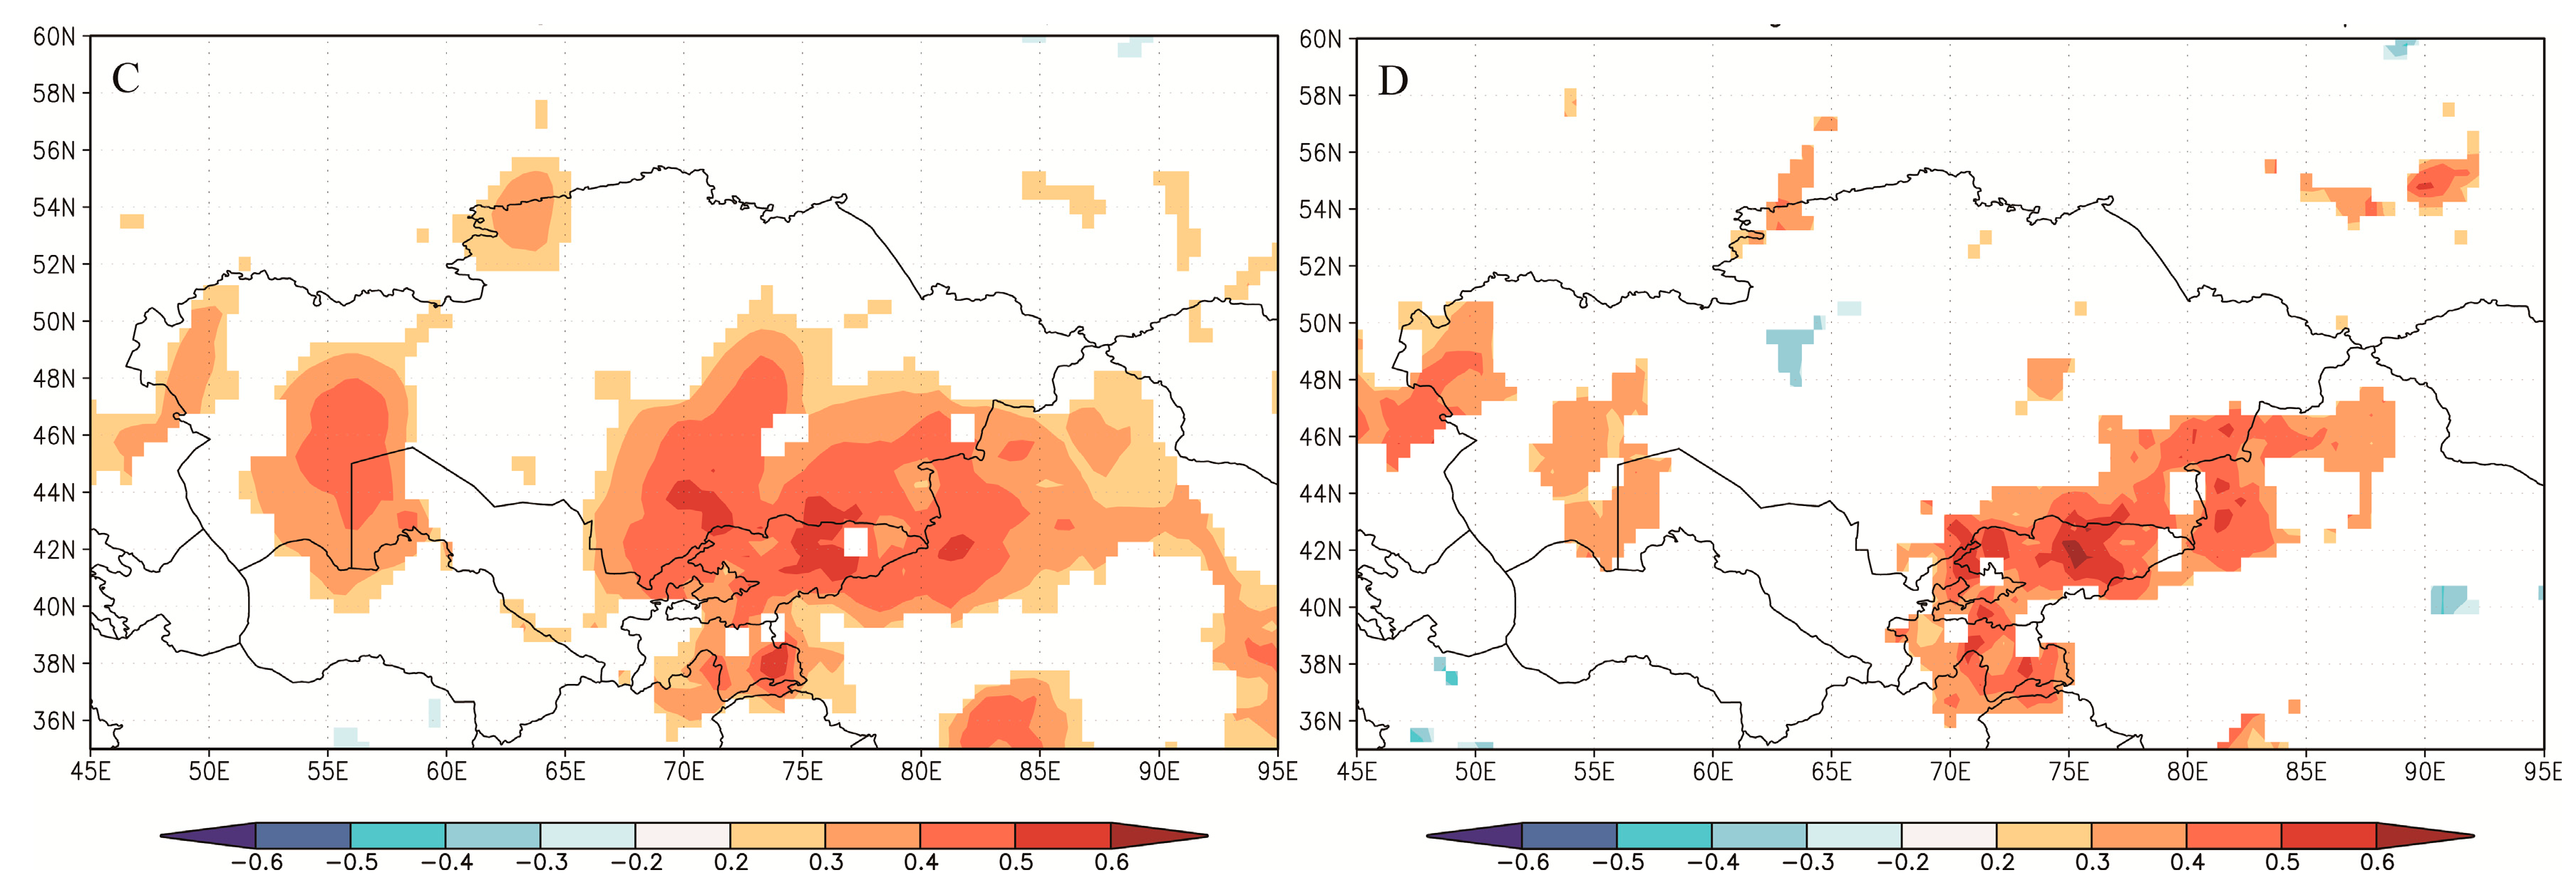
3.2. Changes in Moisture over the Past 175 Years
4. Discussion
5. Conclusions
Author Contributions
Funding
Acknowledgments
Conflicts of Interest
References
- IPCC. Climate Change 2013: The Physical Science Basis [M/OL]; Cambridge University Press: Cambridge, UK, 2013; Available online: http://www.ipcc.ch/report/ar5/wg1/#.Uq_tD7KBRR1. 2013 (accessed on 5 January 2019).
- Dai, A.G.; Trenberth, K.E.; Qian, T. A global data set of Palmer Drought Severity Index for 1870–2002: Relationship with soil moisture and effects of surface warming. J. Hydrometeorol. 2004, 5, 1117–1130. [Google Scholar] [CrossRef]
- UNDP. Central Asia Human Development Report; UN Development Programme: New York, NY, USA, 2005; 246p. [Google Scholar]
- Parry, M.L.; Canziani, O.F.; Palutikof, J.P.; van der Linden, P.J.; Hanson, C.E. (Eds.) Climate Change 2007: Impacts, Adaptation and Vulnerability; Cambridge University Press: Cambridge, UK, 2007; 976p. [Google Scholar]
- Chen, Y.; Li, W.; Deng, H.; Fang, G.; Li, Z. Changes in Central Asia’s WaterTower: Past, Present and Future. Sci. Rep. 2016, 6, 35458. [Google Scholar] [CrossRef] [PubMed]
- Hu, Z.; Zhang, C.; Hu, Q.; Tian, H. Temperature changes in Central Asia from 1979–2011 based on multiple datasets. J. Clim. 2014, 27, 1143–1167. [Google Scholar] [CrossRef]
- Zhang, R.; Yuan, Y.; Gou, X.; He, Q.; Shang, H.; Zhang, T.; Chen, F.; Ermenbaev, B.; Yu, S.; Qin, L.; et al. Tree-ring-based moisture variability in western Tianshan Mountains since A.D. 1882 and its possible driving mechanism. Agric. For. Meteorol. 2016, 218–219, 267–276. [Google Scholar] [CrossRef]
- PAGES Hydro2k Consortium. Comparing proxy and model estimates of hydroclimate variability and change over the Common Era. Clim. Past. 2017, 13, 1851–1900. [Google Scholar] [CrossRef] [Green Version]
- Zhang, R.; Shang, H.; Yu, S.; He, Q.; Yuan, Y.; Bolatov, K.; Mambetov, B.T. Tree-ring-based precipitation reconstruction in southern Kazakhstan, reveals drought variability since A.D. 1770. Int. J. Climatol. 2017, 37, 741–750. [Google Scholar] [CrossRef]
- Zhang, R.; Zhang, T.; Kelgenbayev, N.; He, Q.; Mambetov, B.T.; Dosmanbetov, D.; Shang, H.; Yu, S.; Yuan, Y. A 189-year tree-ring record of drought for the Dzungarian Alatau, arid Central Asia. J. Asian Earth Sci. 2017, 148, 305–314. [Google Scholar] [CrossRef]
- Ma, C.; Sun, L.; Liu, S.; Shao, M.; Luo, Y. Impact of climate change on the streamflow in the glacierized Chu River Basin, Central Asia. J. Arid Land 2015, 7, 501–513. [Google Scholar] [CrossRef] [Green Version]
- Fritts, H.C. Tree Rings and Climate; Academic Press, Inc. Ltd.: London, UK; New York, NY, USA, 1976. [Google Scholar]
- Holmes, R.L. Computer-assisted quality control in tree-ring dating and measurement. Tree-Ring Bull. 1983, 43, 69–75. [Google Scholar]
- Cook, E.R. A Time-Series Analysis Approach to Tree-Ring Standardization. Ph.D. Dissertation, The University of Arizona Press, Tucson, Arizona, 1985. [Google Scholar]
- Wigley, T.M.L.; Briffa, K.R.; Jones, P.D. On the average value of correlated time series, with application in dendroclimatology and hydrometeorology. J. Appl. Meteorol. Clim. 1984, 23, 201–213. [Google Scholar] [CrossRef]
- Buras, A. A comment on the Expressed Population Signa. Dendrochronologia 2017, 44, 130–132. [Google Scholar] [CrossRef]
- Vicente-Serrano, S.M.; Beguería, S.; López-Moreno, J.I. A Multi-scalar drought index sensitive to global warming: The Standardized Precipitation Evapotranspiration Index. J. Clim. 2010, 23, 1696–1718. [Google Scholar] [CrossRef]
- Litvak, R.G.; Morris, B.; Nemaltseva, E.I. Groundwater vulnerability assessment for intermontane valleys using Chu Valley of Kyrghyzstan as an example. In Groundwater and Ecosystems; Baba, A., Howard, K.W.F., Gunduz, O., Eds.; Springer: Dordrecht, The Netherlands; pp. 107–120.
- Cook, E.R.; Kairiukstis, L.A. Methods of Dendrochronology: Applications in the Environmental Sciences; Kluwer: Dordrecht, The Netherlands, 1990. [Google Scholar]
- Meko, D.M.; Graybill, D.A. Tree-ring reconstruction of Upper Gila River discharge. Water Res. Bull. 1995, 31, 605–616. [Google Scholar] [CrossRef]
- Mann, M.E.; Lees, J.M. Robust estimation of background noise and signal detection in climatic time series. Clim. Chang. 1996, 33, 409–445. [Google Scholar] [CrossRef]
- Yuan, Y.; Jin, L.; Shao, X.; He, Q.; Li, Z.; Li, J. Variations of the spring precipitation day numbers reconstructed from tree rings in the Urumqi River drainage, Tianshan Mts. over the last 370 years. Chin. Sci. Bull. 2003, 48, 1507–1510. [Google Scholar] [CrossRef]
- Yuan, Y.; Li, J.; Zhang, J. 348 year precipitation reconstruction from tree-rings for the North Slope of the middle Tianshan Mountains. Acta Meteorol. Sin. 2001, 15, 95–104. [Google Scholar]
- Solomina, O.N.; Maximova, O.E.; Cook, E.R. Picea Schrenkiana ring width and density at the upper and lower tree limits in the Tien Shan mts Kyrgyz republic as a source of paleoclimatic information. Geogr. Environ. Sustain. 2014, 1, 66–79. [Google Scholar] [CrossRef]
- Li, J.; Gou, X.; Cook, E.R.; Chen, F. Tree-ring based drought reconstruction for the central Tien Shan area in northwest China. Geophys. Res. Lett. 2006, 33, L07715. [Google Scholar] [CrossRef]
- Zhang, R.; Yuan, Y.; Gou, X.; Zhang, T.; Zou, C.; Ji, C.; Fan, Z.; Qin, L.; Shang, H.; Li, X. Intra-annual radial growth of Schrenk spruce (Picea schrenkiana Fisch. et Mey) and its response to climate on the northern slopes of the Tianshan Mountains. Dendrochronologia 2016, 40, 36–42. [Google Scholar] [CrossRef]
- Cheng, H.; Zhang, P.Z.; Spotl, C.; Edwards, R.L.; Cai, Y.J.; Zhang, D.Z.; Sang, W.C.; Tan, M.; An, Z.S. The climatic cyclicity in semiarid-arid central Asia over the past 500,000 years. Geophys. Res. Lett. 2012, 39, L01705. [Google Scholar] [CrossRef]
- Shi, Y.; Shen, Y.; Kang, E.; Li, D.; Ding, Y.; Zhang, G.; Hu, R. Recent and future climate change in Northwest China. Clim. Chang. 2007, 80, 379–393. [Google Scholar] [CrossRef]
- Thomson, D.J. Spectrum estimation and harmonic analysis. Proc. IEEE 1982, 70, 1055–1096. [Google Scholar] [CrossRef] [Green Version]
- Huang, W.; Chen, F.; Feng, S.; Chen, J.; Zhang, X. Interannual precipitation variations in the mid-latitude Asia and their association with large-scale atmospheric circulation. Chin. Sci. Bull. 2013, 58, 3962–3968. [Google Scholar] [CrossRef] [Green Version]
- Chen, F.; Huang, W.; Jin, L.; Chen, J.; Wang, J. Spatiotemporal precipitation variations in the arid Central Asia in the context of global warming. Sci. China Earth Sci. 2011, 54, 1812–1821. [Google Scholar] [CrossRef]
- Fang, K.; Gou, X.; Chen, F.; D’Arrigo, R.; Li, J. Tree-ring based drought reconstruction for the Guiqing Mountain (China): Linkages to the Indian and Pacific Oceans. Int. J. Climatol. 2010, 30, 1137–1145. [Google Scholar] [CrossRef]
- Fang, K.; Gou, X.; Chen, F.; Frank, D.; Liu, C.; Li, J.; Kazmer, M. Precipitation variability during the past 400 years in the Xiaolong Mountain (central China) inferred from tree rings. Clim. Dyn. 2012, 39, 1697–1707. [Google Scholar] [CrossRef]
- Meehl, G.A. The annual cycle and interannual variability in the tropical Pacific and Indian Ocean region. Mon. Weather Rev. 1987, 115, 27–50. [Google Scholar] [CrossRef]
- Wang, T.; Ren, G.; Chen, F.; Yuan, Y. An analysis of precipitation variations in the west-central Tianshan Mountains over the last 300 years. Quatern. Int. 2015, 358, 48–57. [Google Scholar] [CrossRef]
- Liang, E.; Shao, X.; Liu, X. Annual precipitation variation inferred from tree rings since A.D. 1770 for the western Qilian Mts., Northern Tibetan Plateau. Tree-Ring Res. 2009, 65, 95–103. [Google Scholar] [CrossRef]
- Liu, Y.; Sun, J.; Song, H.; Cai, Q.; Bao, G.; Li, X. Tree-ring hydrologic reconstructions for the Heihe River watershed, western China since AD 1430. Water Res. 2010, 44, 2781–2792. [Google Scholar] [CrossRef] [PubMed]
- Zhang, R.; Wei, W.; Shang, H.; Yu, S.; Gou, X.; Qin, L.; Bolatov, K.; Mambetov, B.T. A tree ring-based record of annual mass balance changes for the TS.Tuyuksuyskiy Glacier and its linkages to climate change in the Tianshan Mountains. Quat. Sci. Rev. 2019, 205, 10–21. [Google Scholar] [CrossRef]
- Zhang, R.; Yuan, Y.; Yu, S.; Chen, F.; Zhang, T. Past changes of spring drought in the inner Tianshan Mountains, China, as recorded by tree rings. Boreas 2017, 46, 688–696. [Google Scholar] [CrossRef]


| Leave-one-out Cross-validation Test | |||||||||
| r | rd | ST | ST1 | t | RE | ||||
| SPEI | 0.599 ** | 0.470 ** | 47+/17− ** | 42+/21− * | 4.803 ** | 0.357 | |||
| Split-sample Calibration-verification Test | |||||||||
| Calibration | Verification | ||||||||
| Period | r | R2 | F | Period | r | RE | CE | ST | ST1 |
| 1951–1982 | 0.653 | 0.426 | 22.33 | 1983–2014 | 0.594 | 0.409 | 0.263 | 22+/10− | 22+/9− * |
| 1983–2014 | 0.594 | 0.353 | 16.33 | 1951–1982 | 0.653 | 0.494 | 0.235 | 25+/7− ** | 19+/12− |
| 1951–2014 | 0.629 | 0.395 | 40.53 | ||||||
© 2019 by the authors. Licensee MDPI, Basel, Switzerland. This article is an open access article distributed under the terms and conditions of the Creative Commons Attribution (CC BY) license (http://creativecommons.org/licenses/by/4.0/).
Share and Cite
Zhang, R.; Ermenbaev, B.; Zhang, T.; Ali, M.; Qin, L.; Satylkanov, R. The Radial Growth of Schrenk Spruce (Picea schrenkiana Fisch. et Mey.) Records the Hydroclimatic Changes in the Chu River Basin over the Past 175 Years. Forests 2019, 10, 223. https://doi.org/10.3390/f10030223
Zhang R, Ermenbaev B, Zhang T, Ali M, Qin L, Satylkanov R. The Radial Growth of Schrenk Spruce (Picea schrenkiana Fisch. et Mey.) Records the Hydroclimatic Changes in the Chu River Basin over the Past 175 Years. Forests. 2019; 10(3):223. https://doi.org/10.3390/f10030223
Chicago/Turabian StyleZhang, Ruibo, Bakytbek Ermenbaev, Tongwen Zhang, Mamtimin Ali, Li Qin, and Rysbek Satylkanov. 2019. "The Radial Growth of Schrenk Spruce (Picea schrenkiana Fisch. et Mey.) Records the Hydroclimatic Changes in the Chu River Basin over the Past 175 Years" Forests 10, no. 3: 223. https://doi.org/10.3390/f10030223