Contrasting Differences in Responses of Streamflow Regimes between Reforestation and Fruit Tree Planting in a Subtropical Watershed of China

 , ,
, ,
Abstract
:1. Introduction
2. Materials and Methods
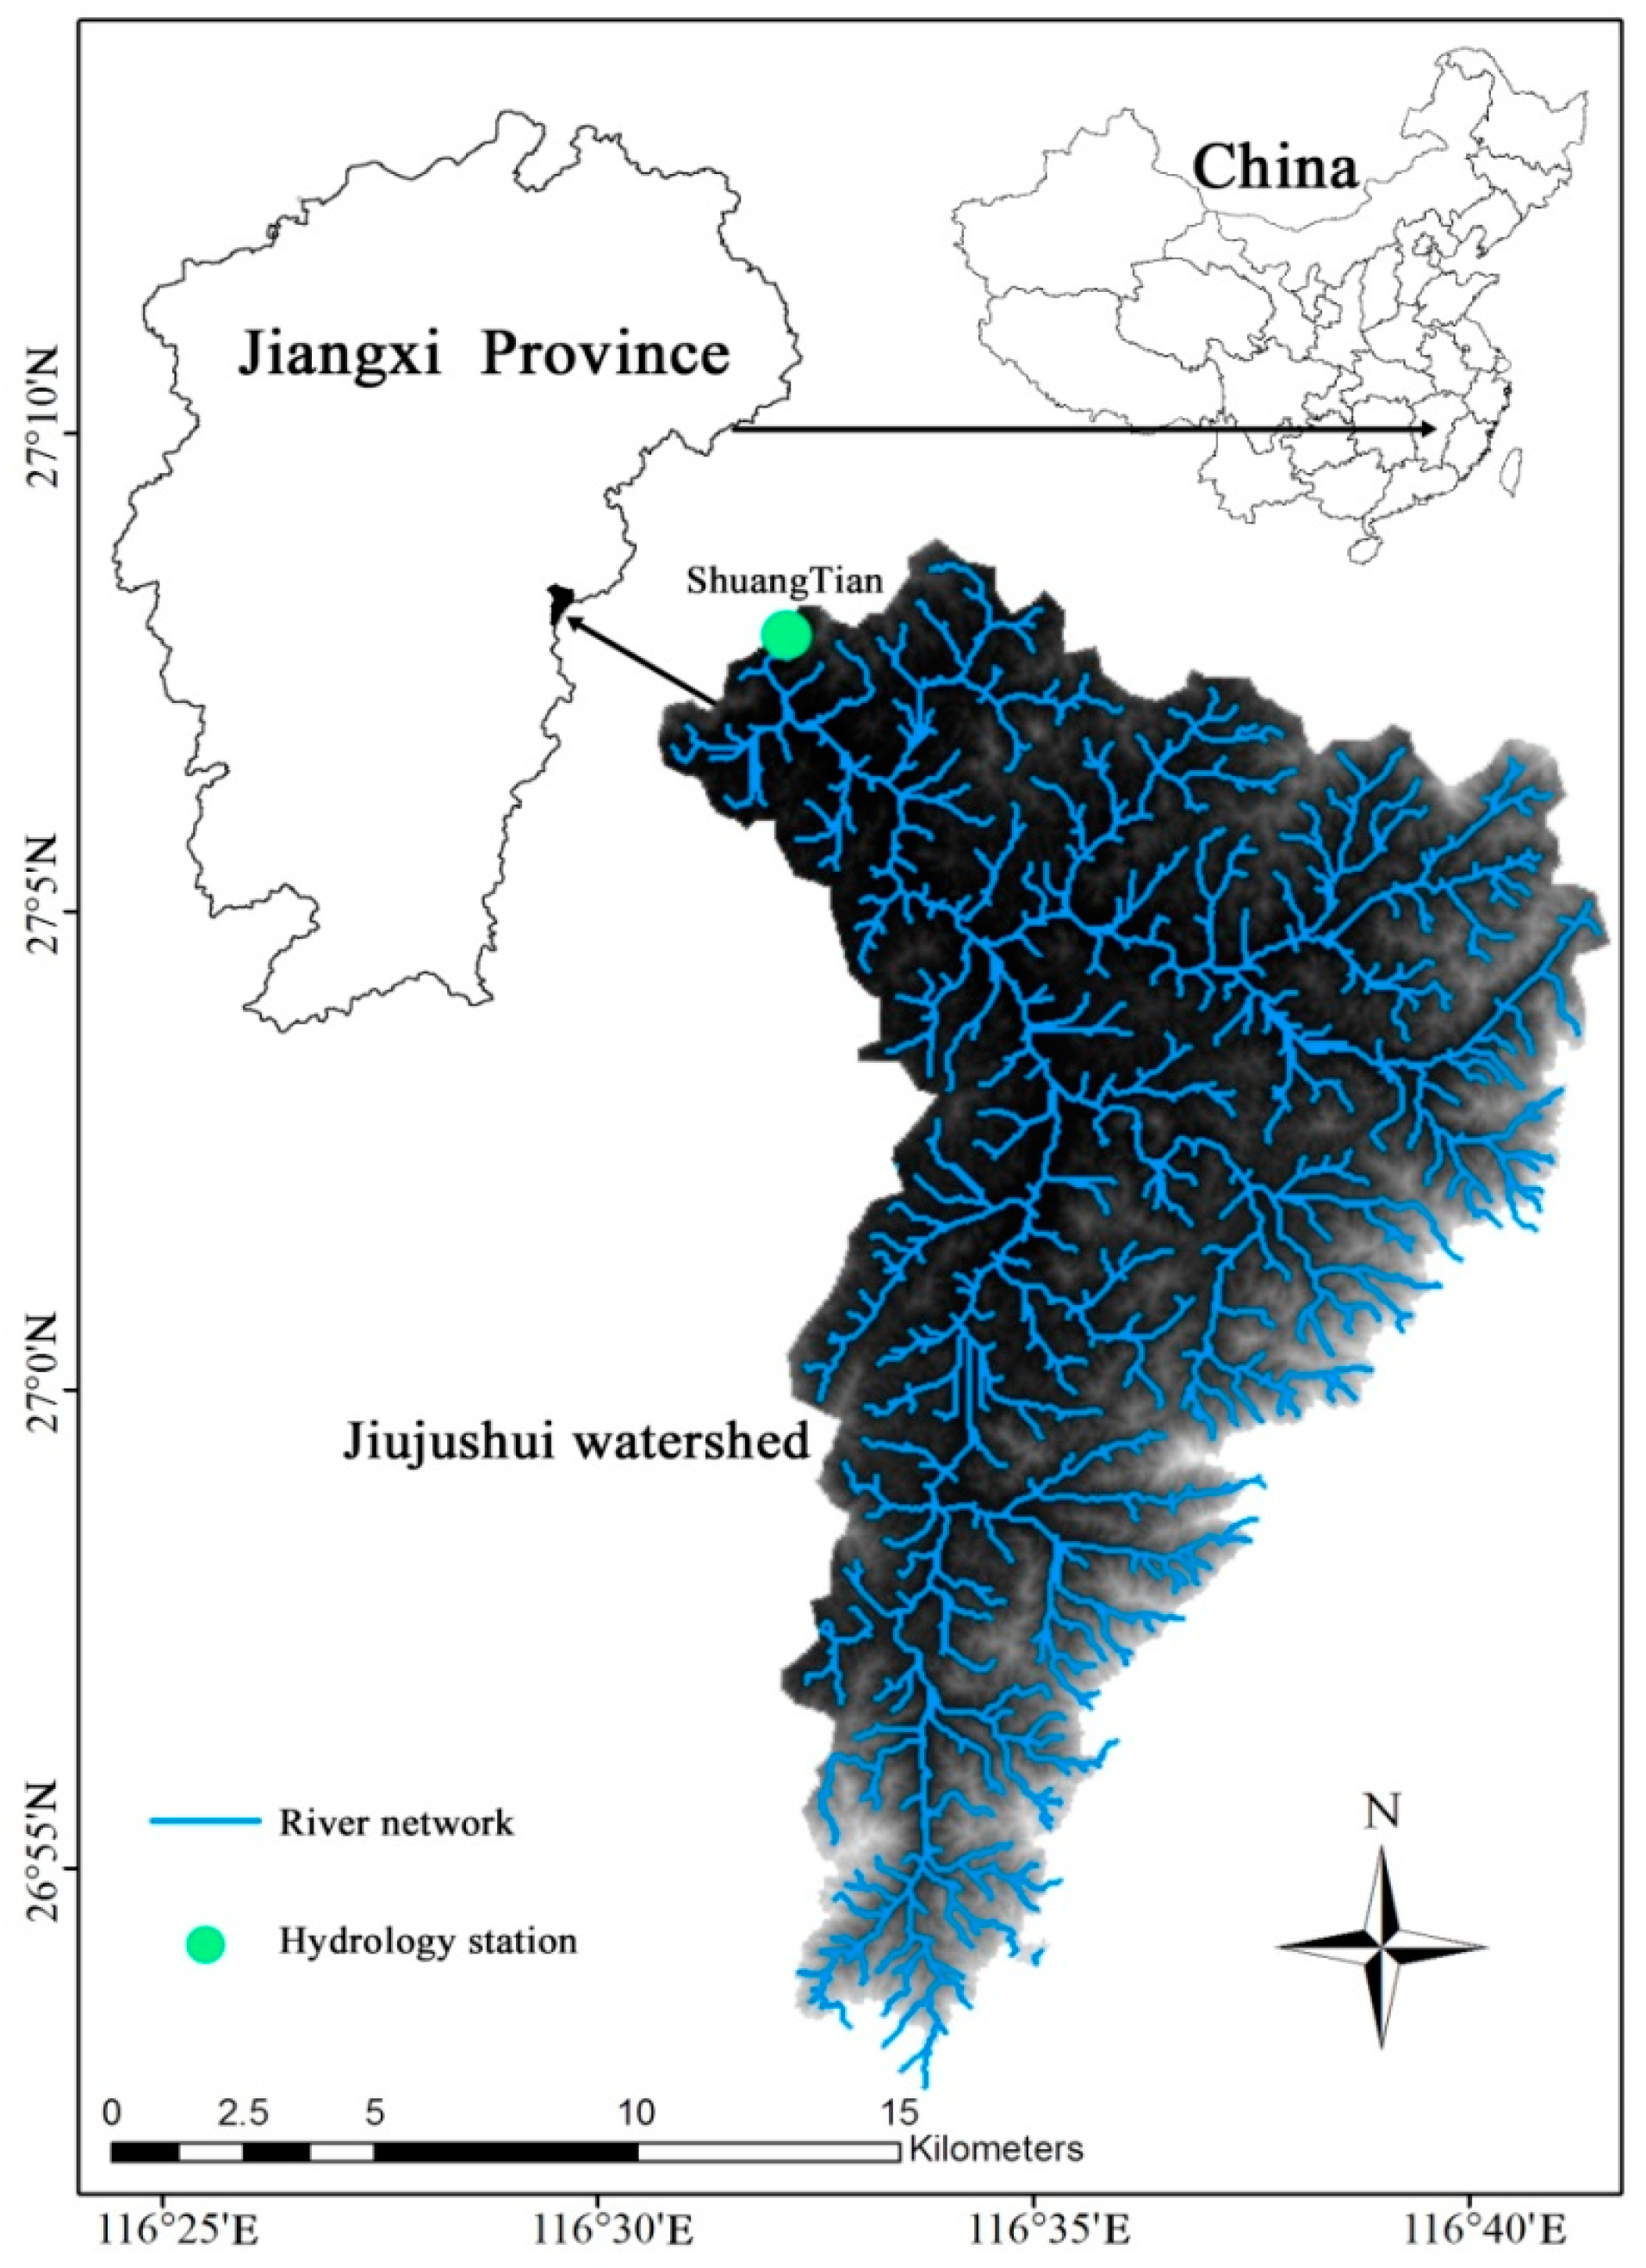
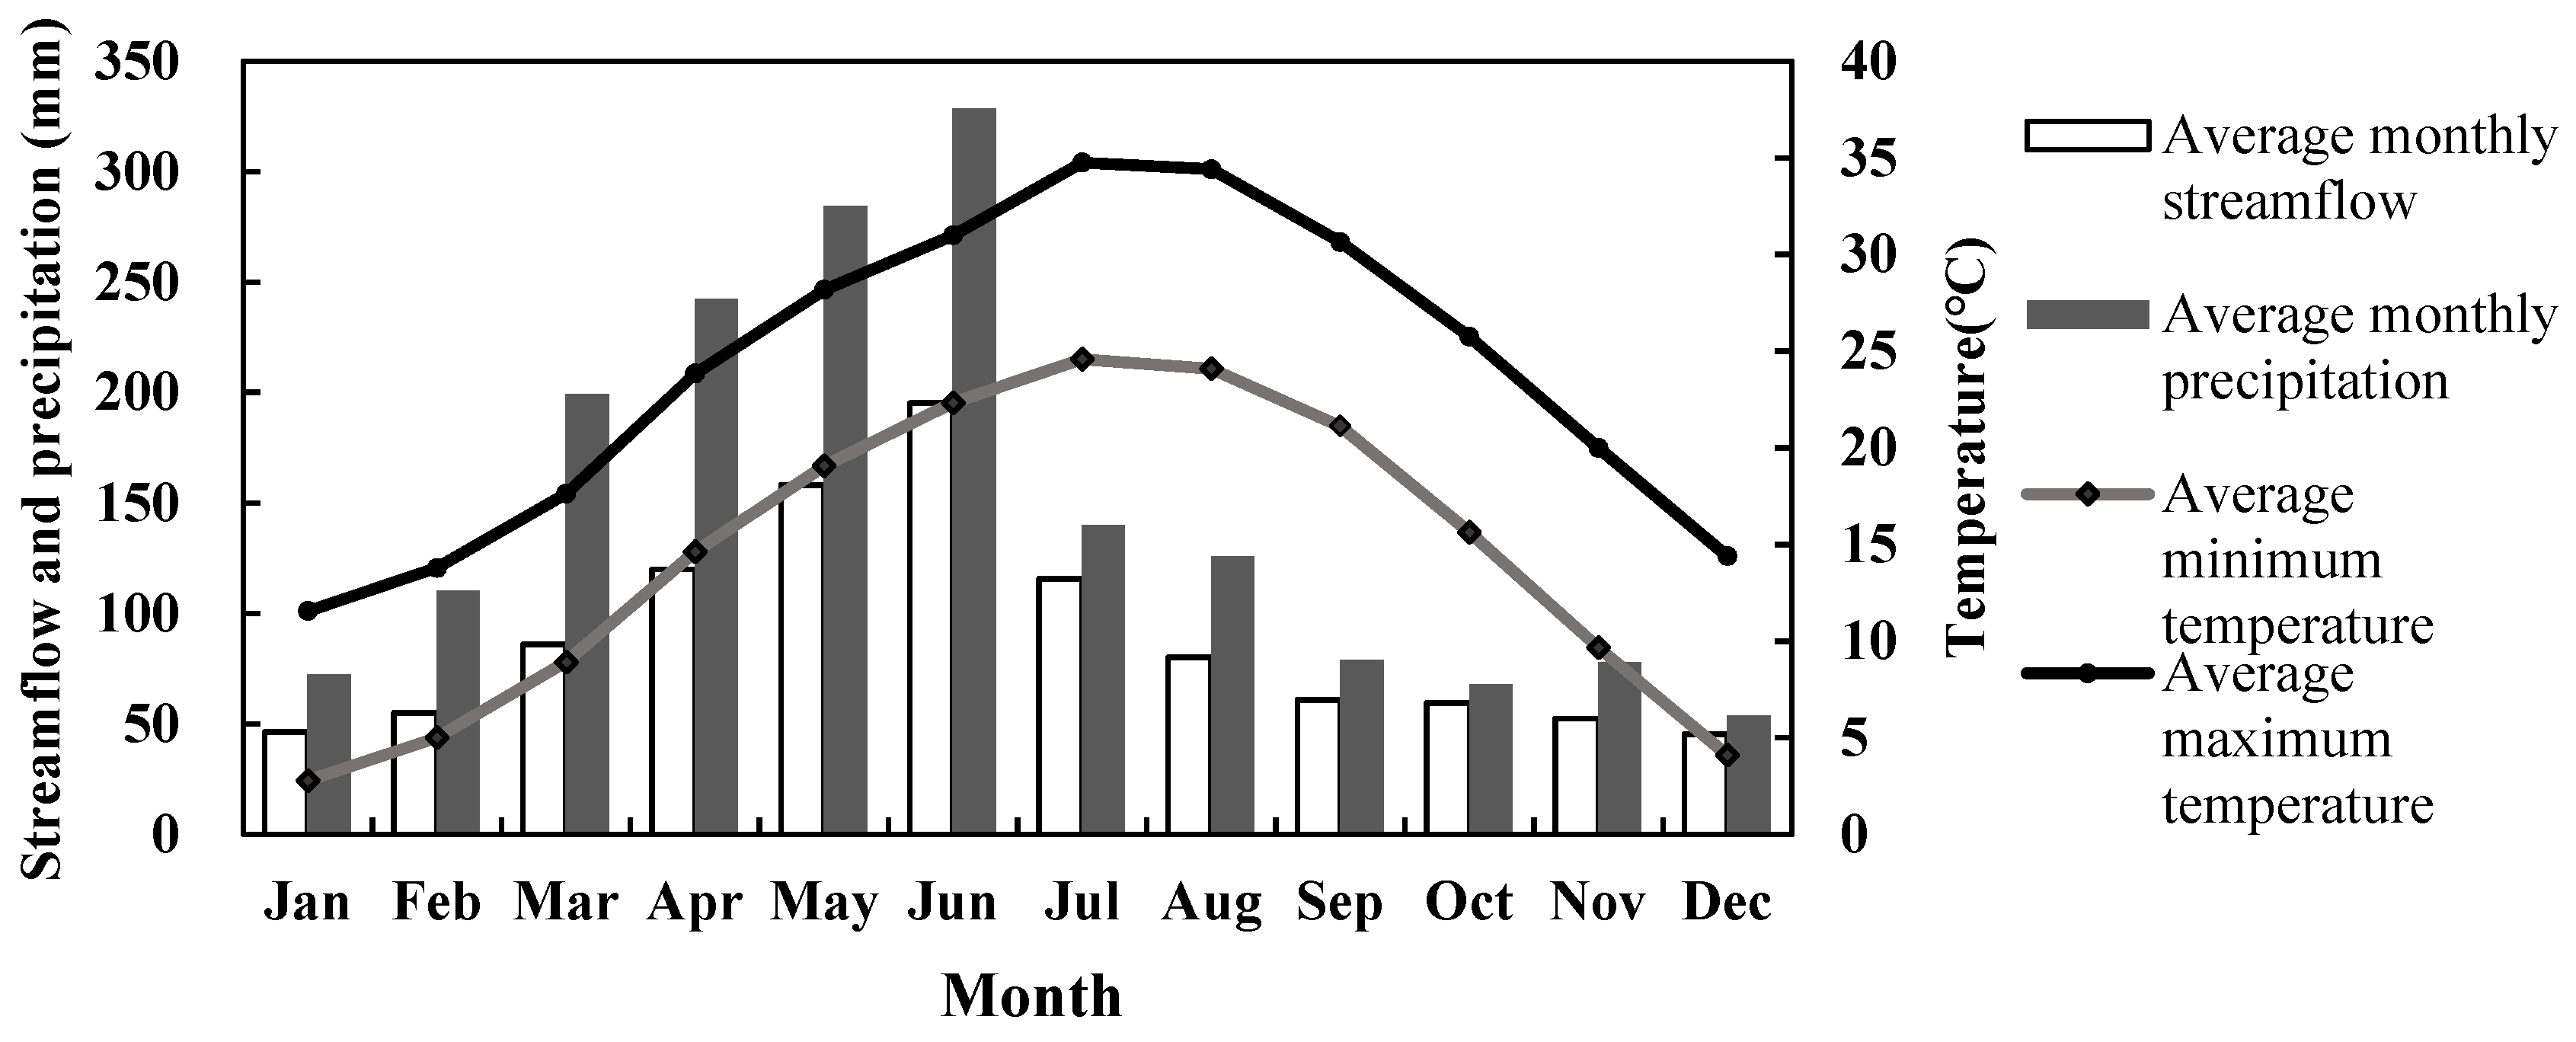
2.1. Study Area
2.2. Data Collection
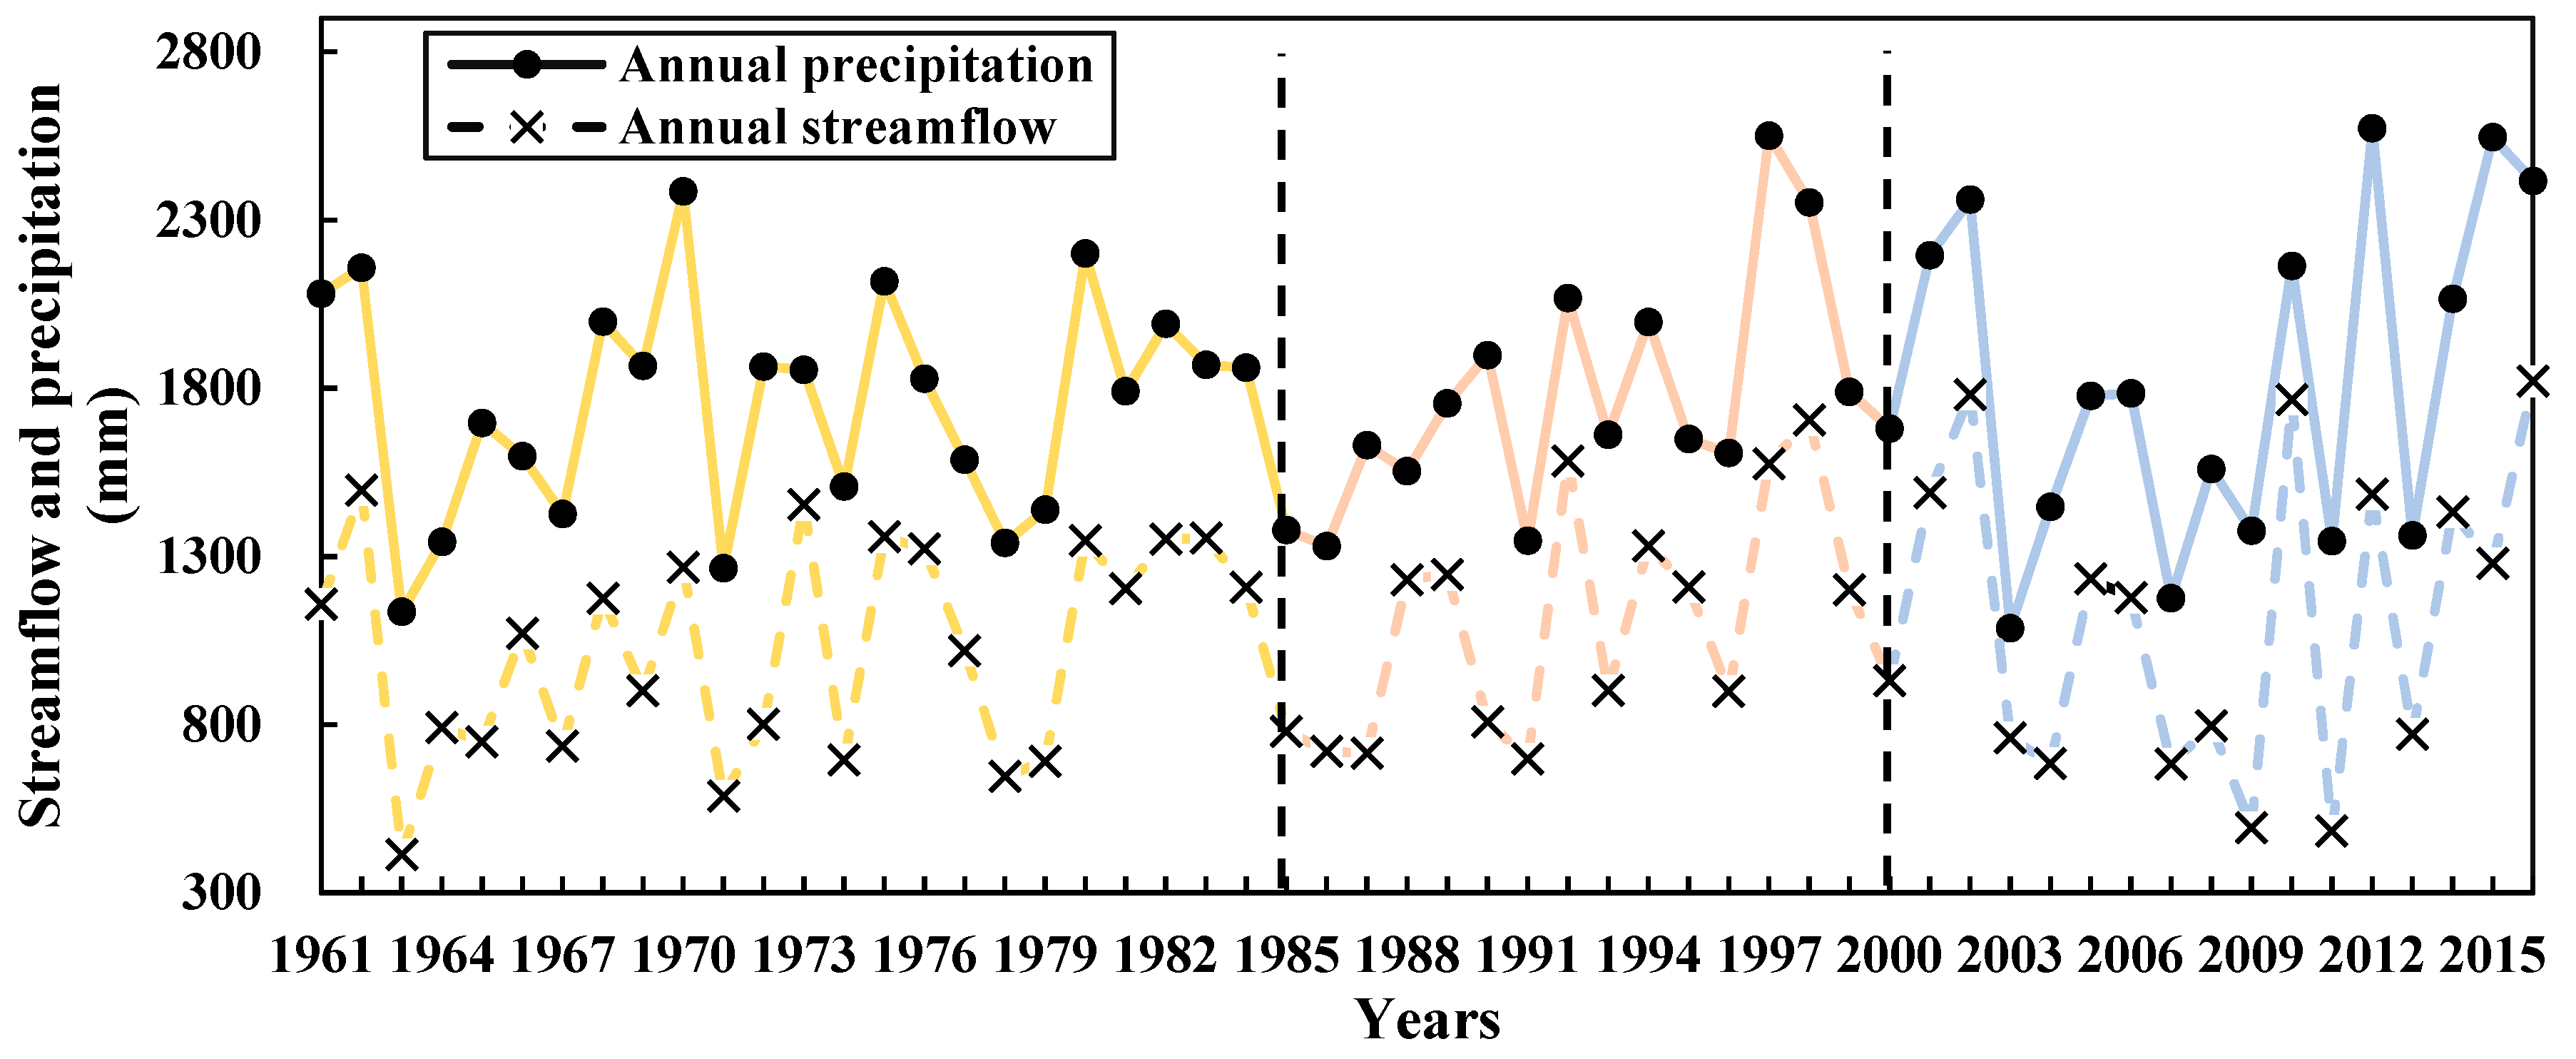
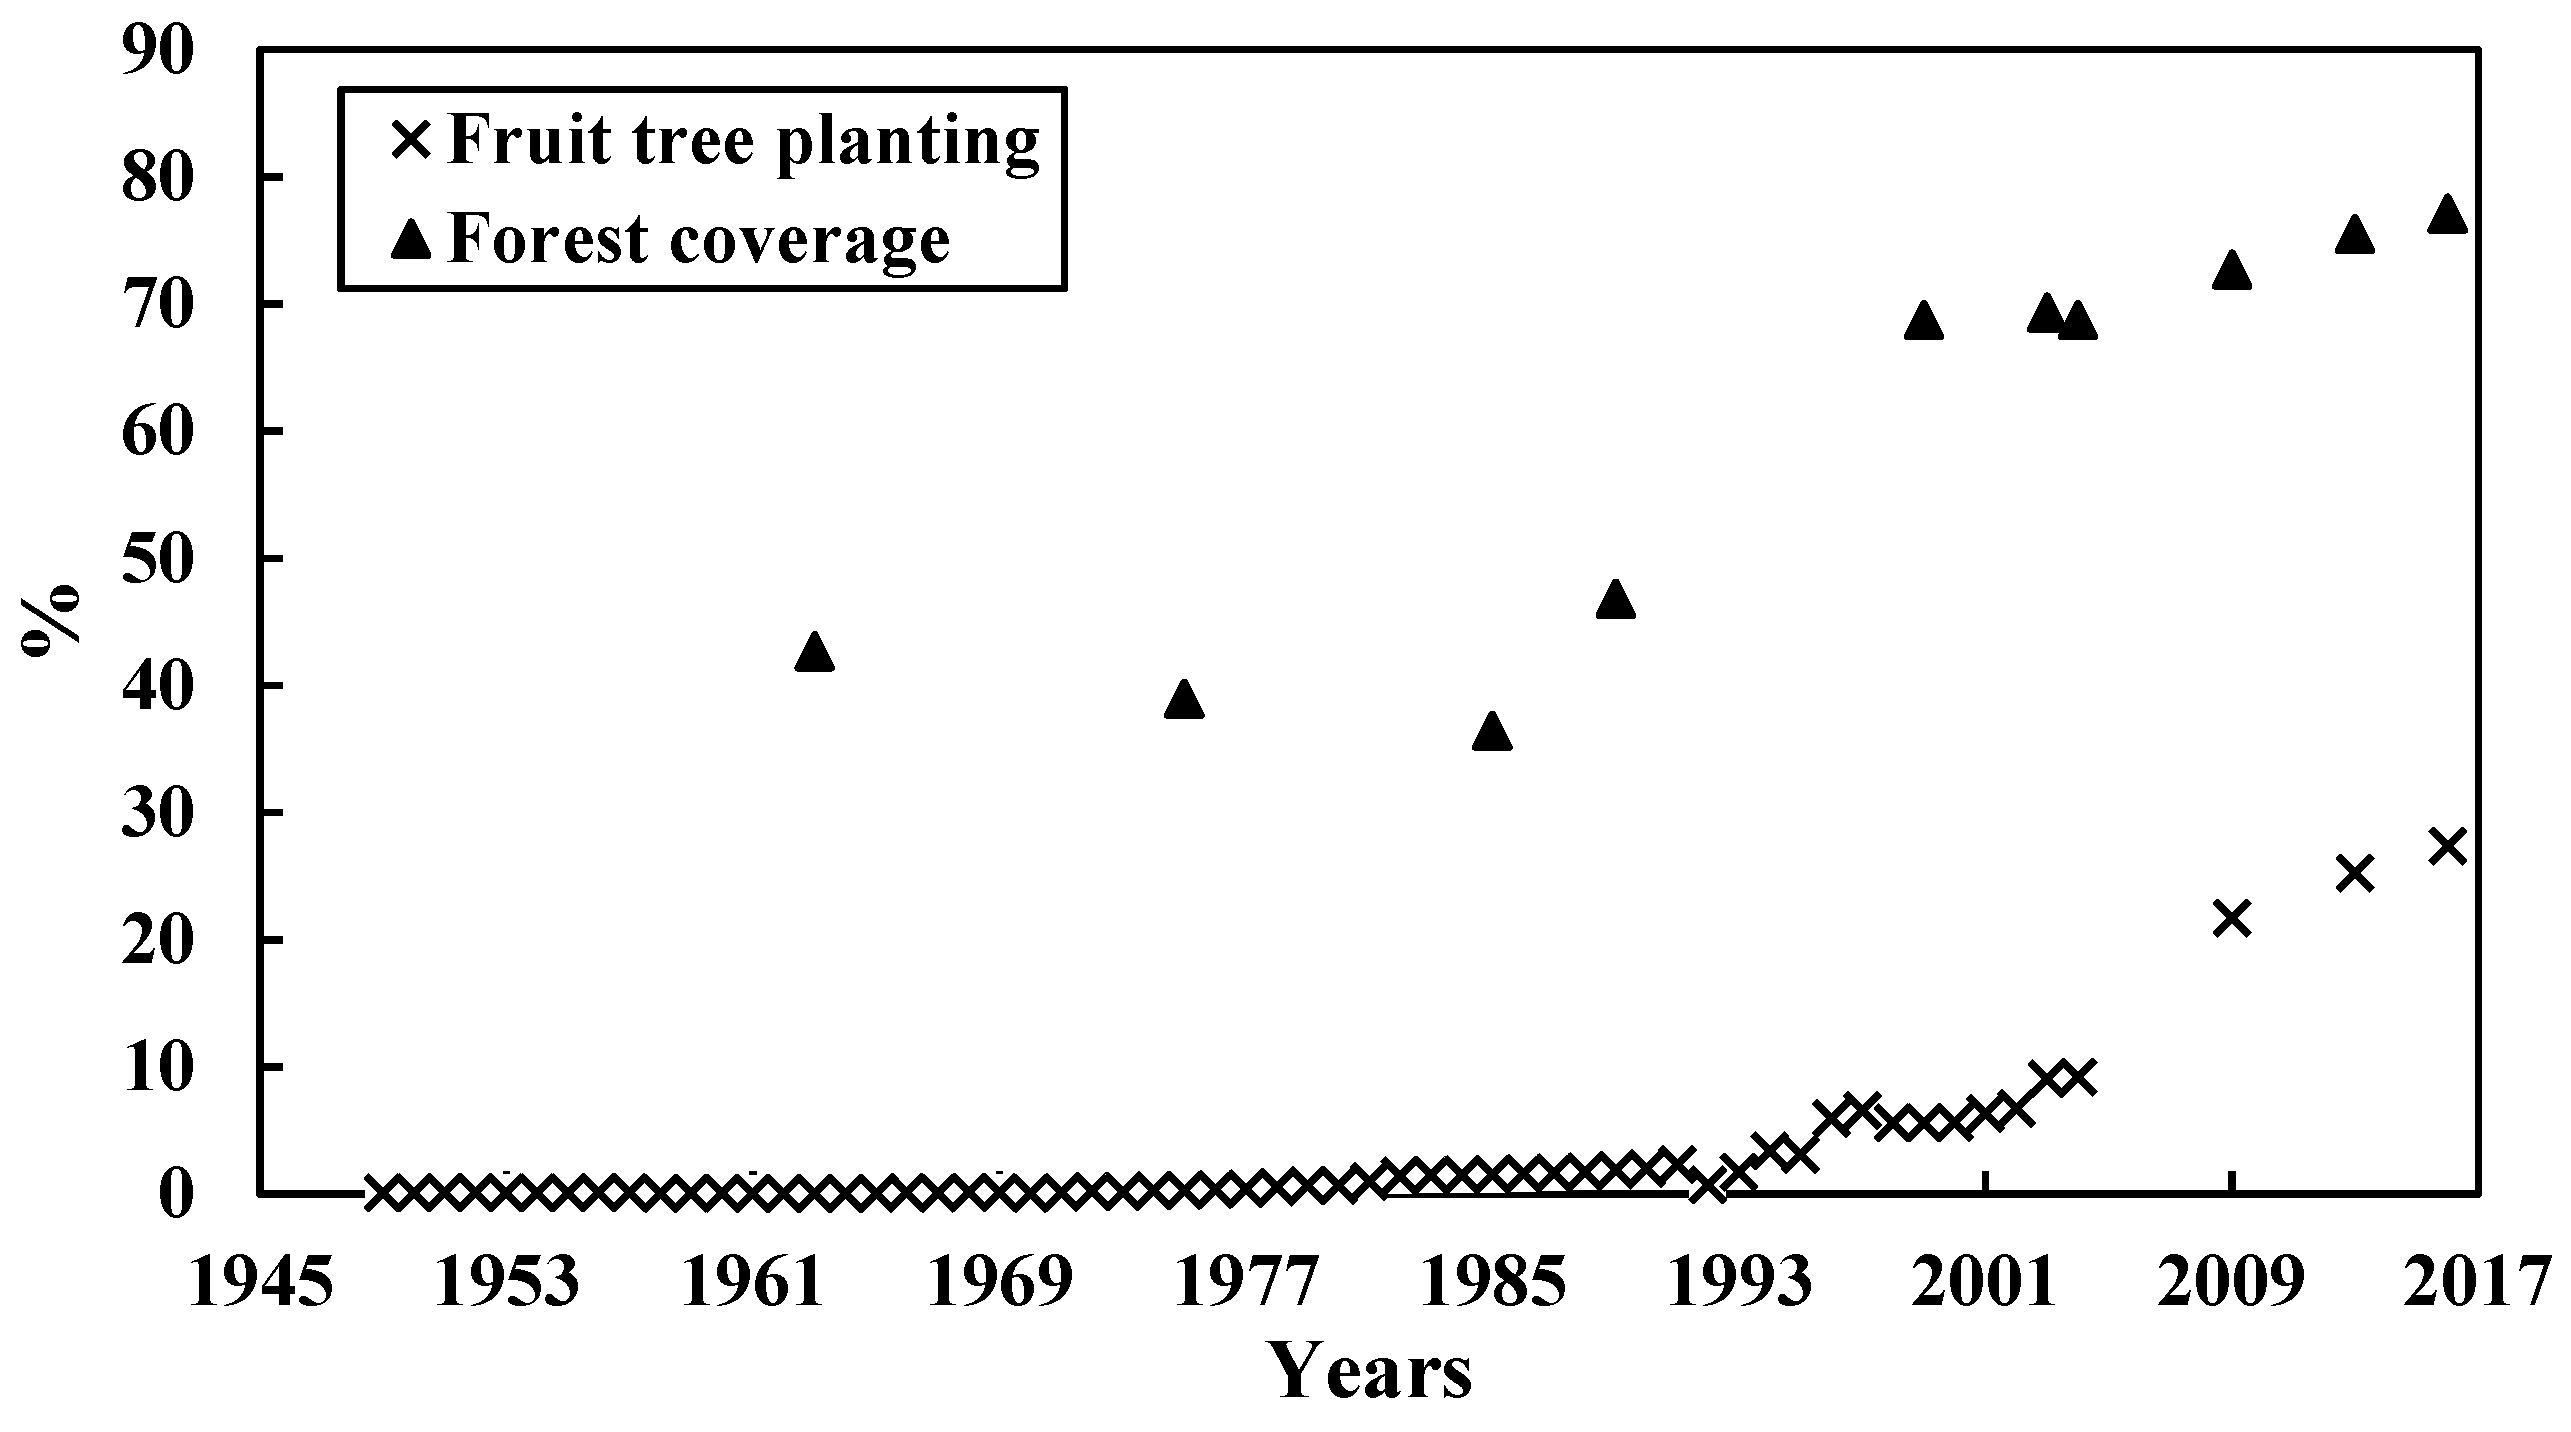
2.3. Defining the Periods of Forest Changes
2.4. Defining High and Low Flow Regimes
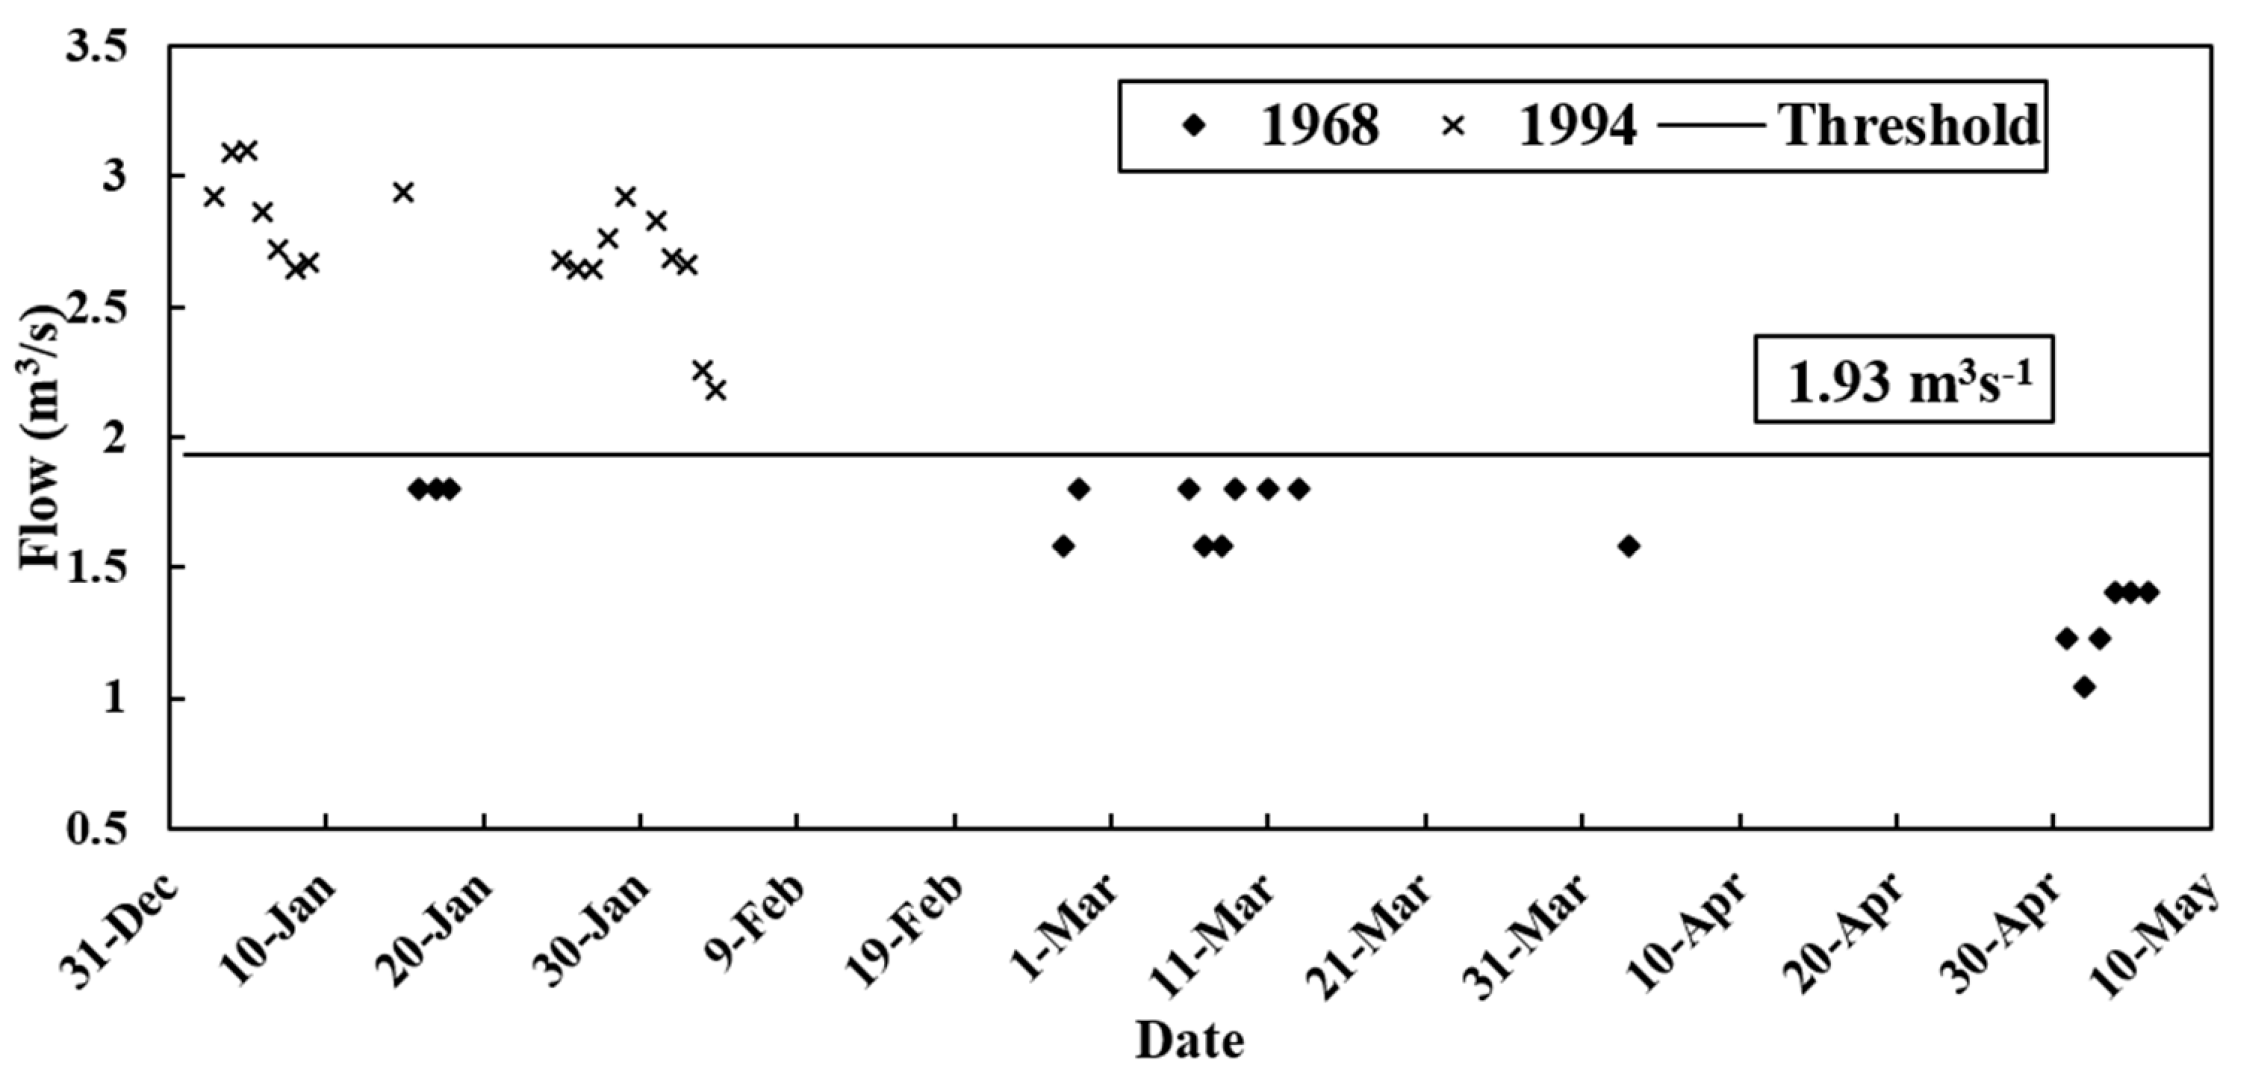
2.5. Elimination the Effect of Climate Factors on High and Low Flows with The Paired-Year Approach
3. Results
3.1. Responses of High Flows to Reforestation and Fruit Tree Planting
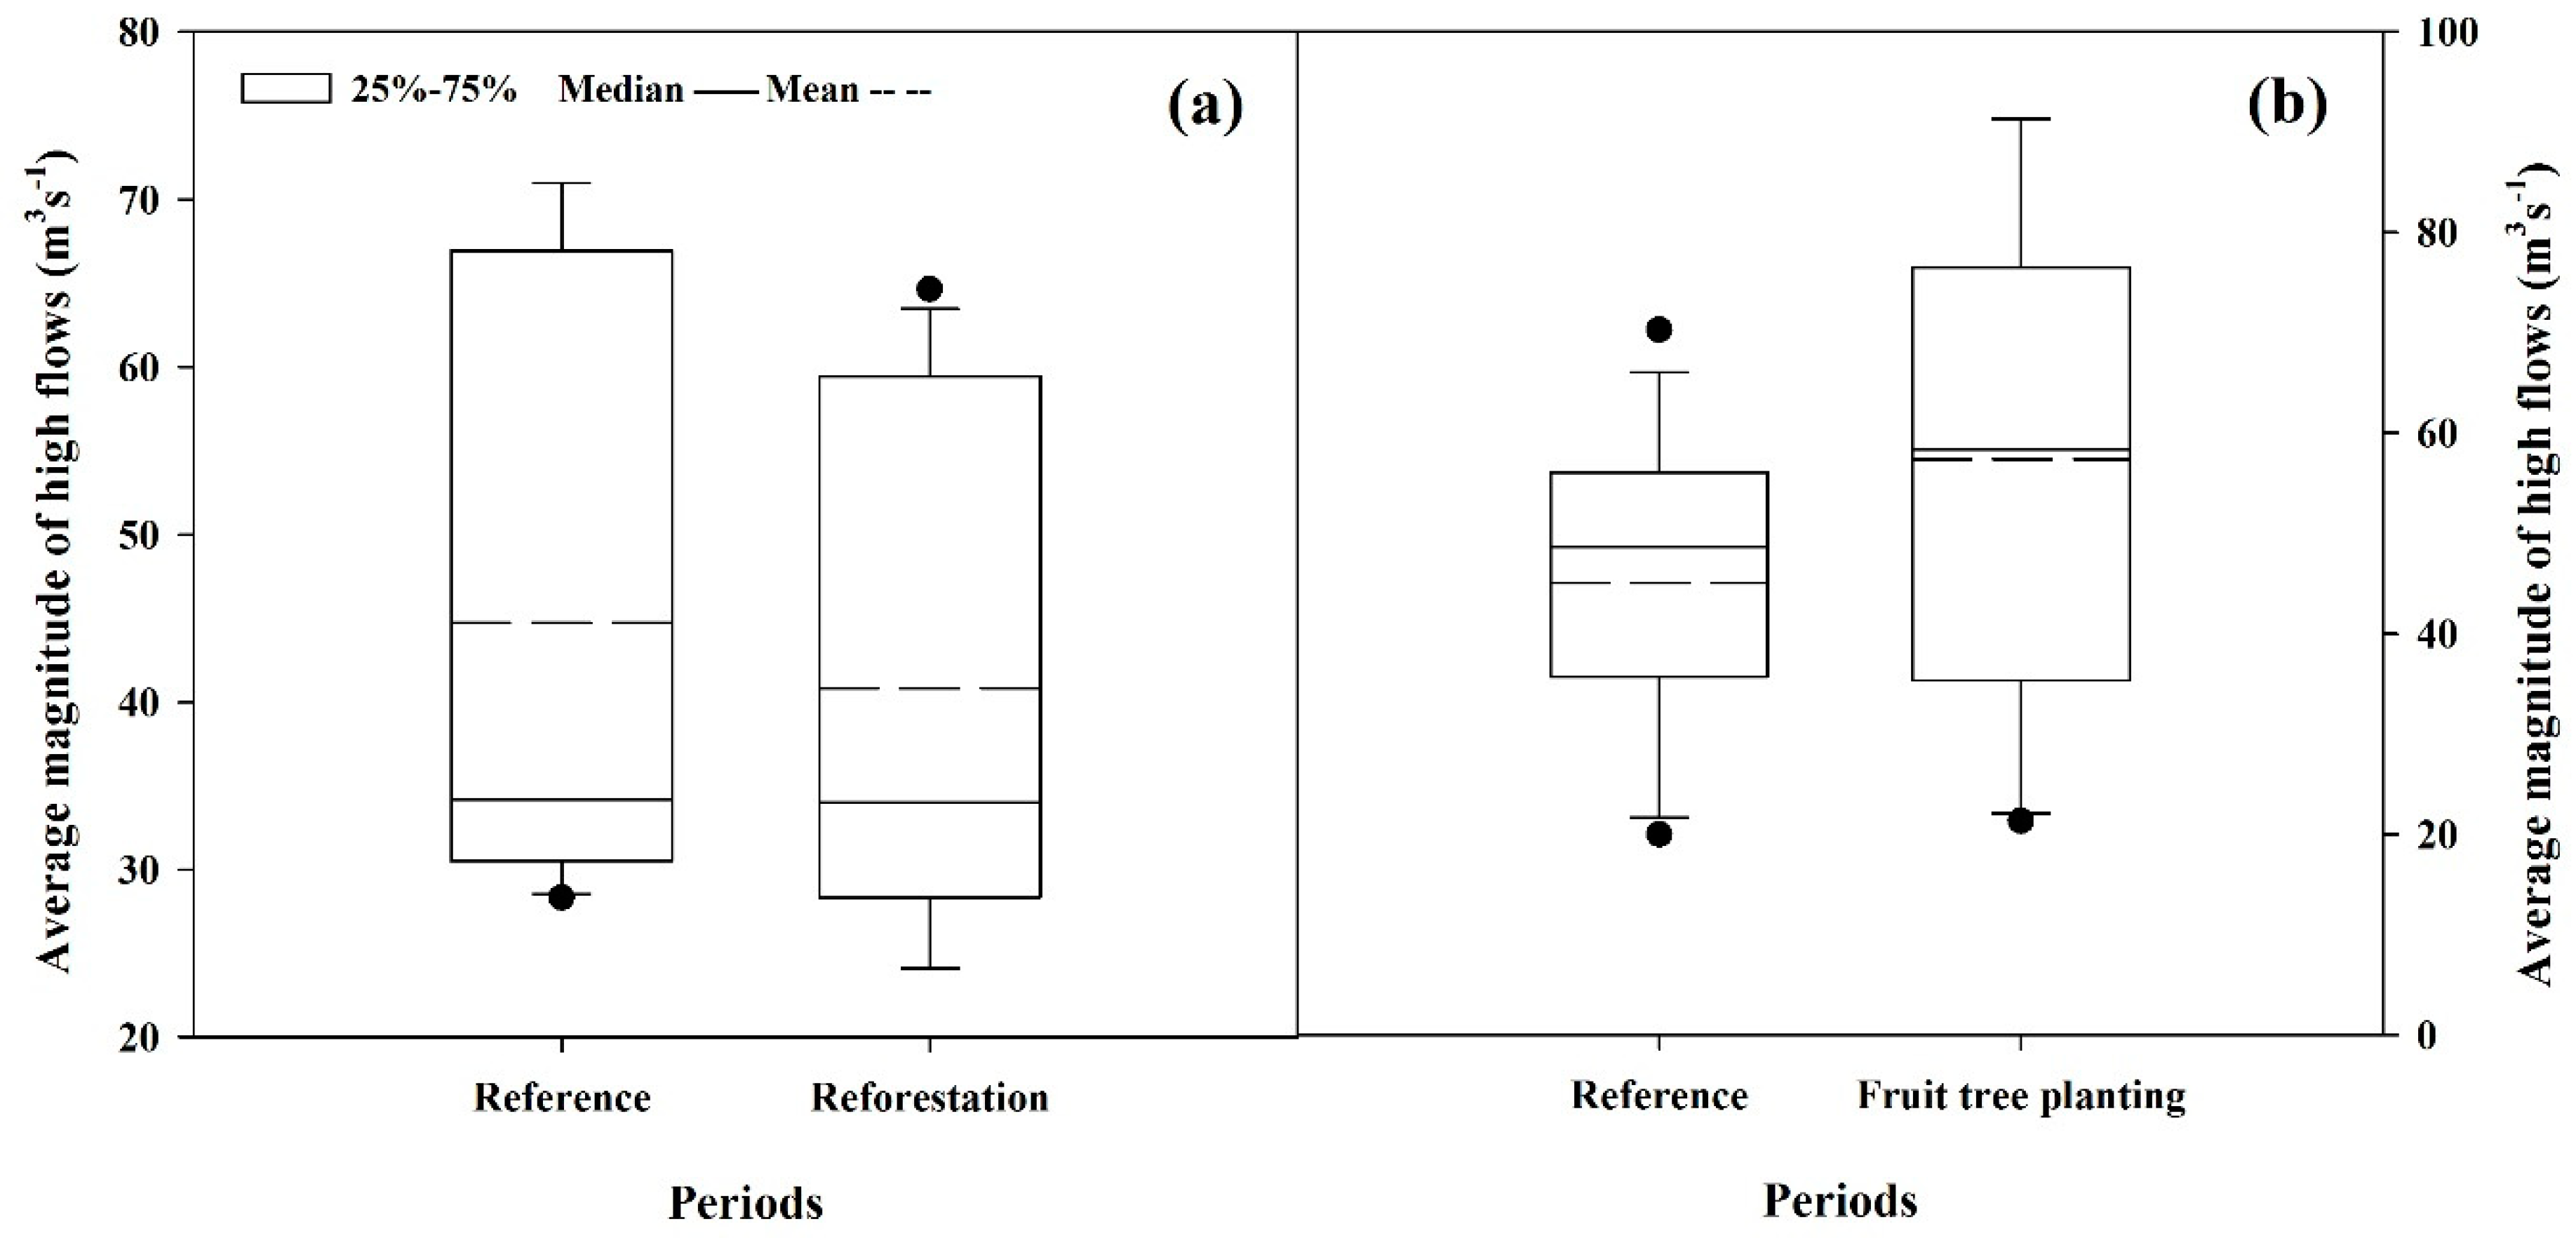
3.1.1. Magnitude
3.1.2. Timing
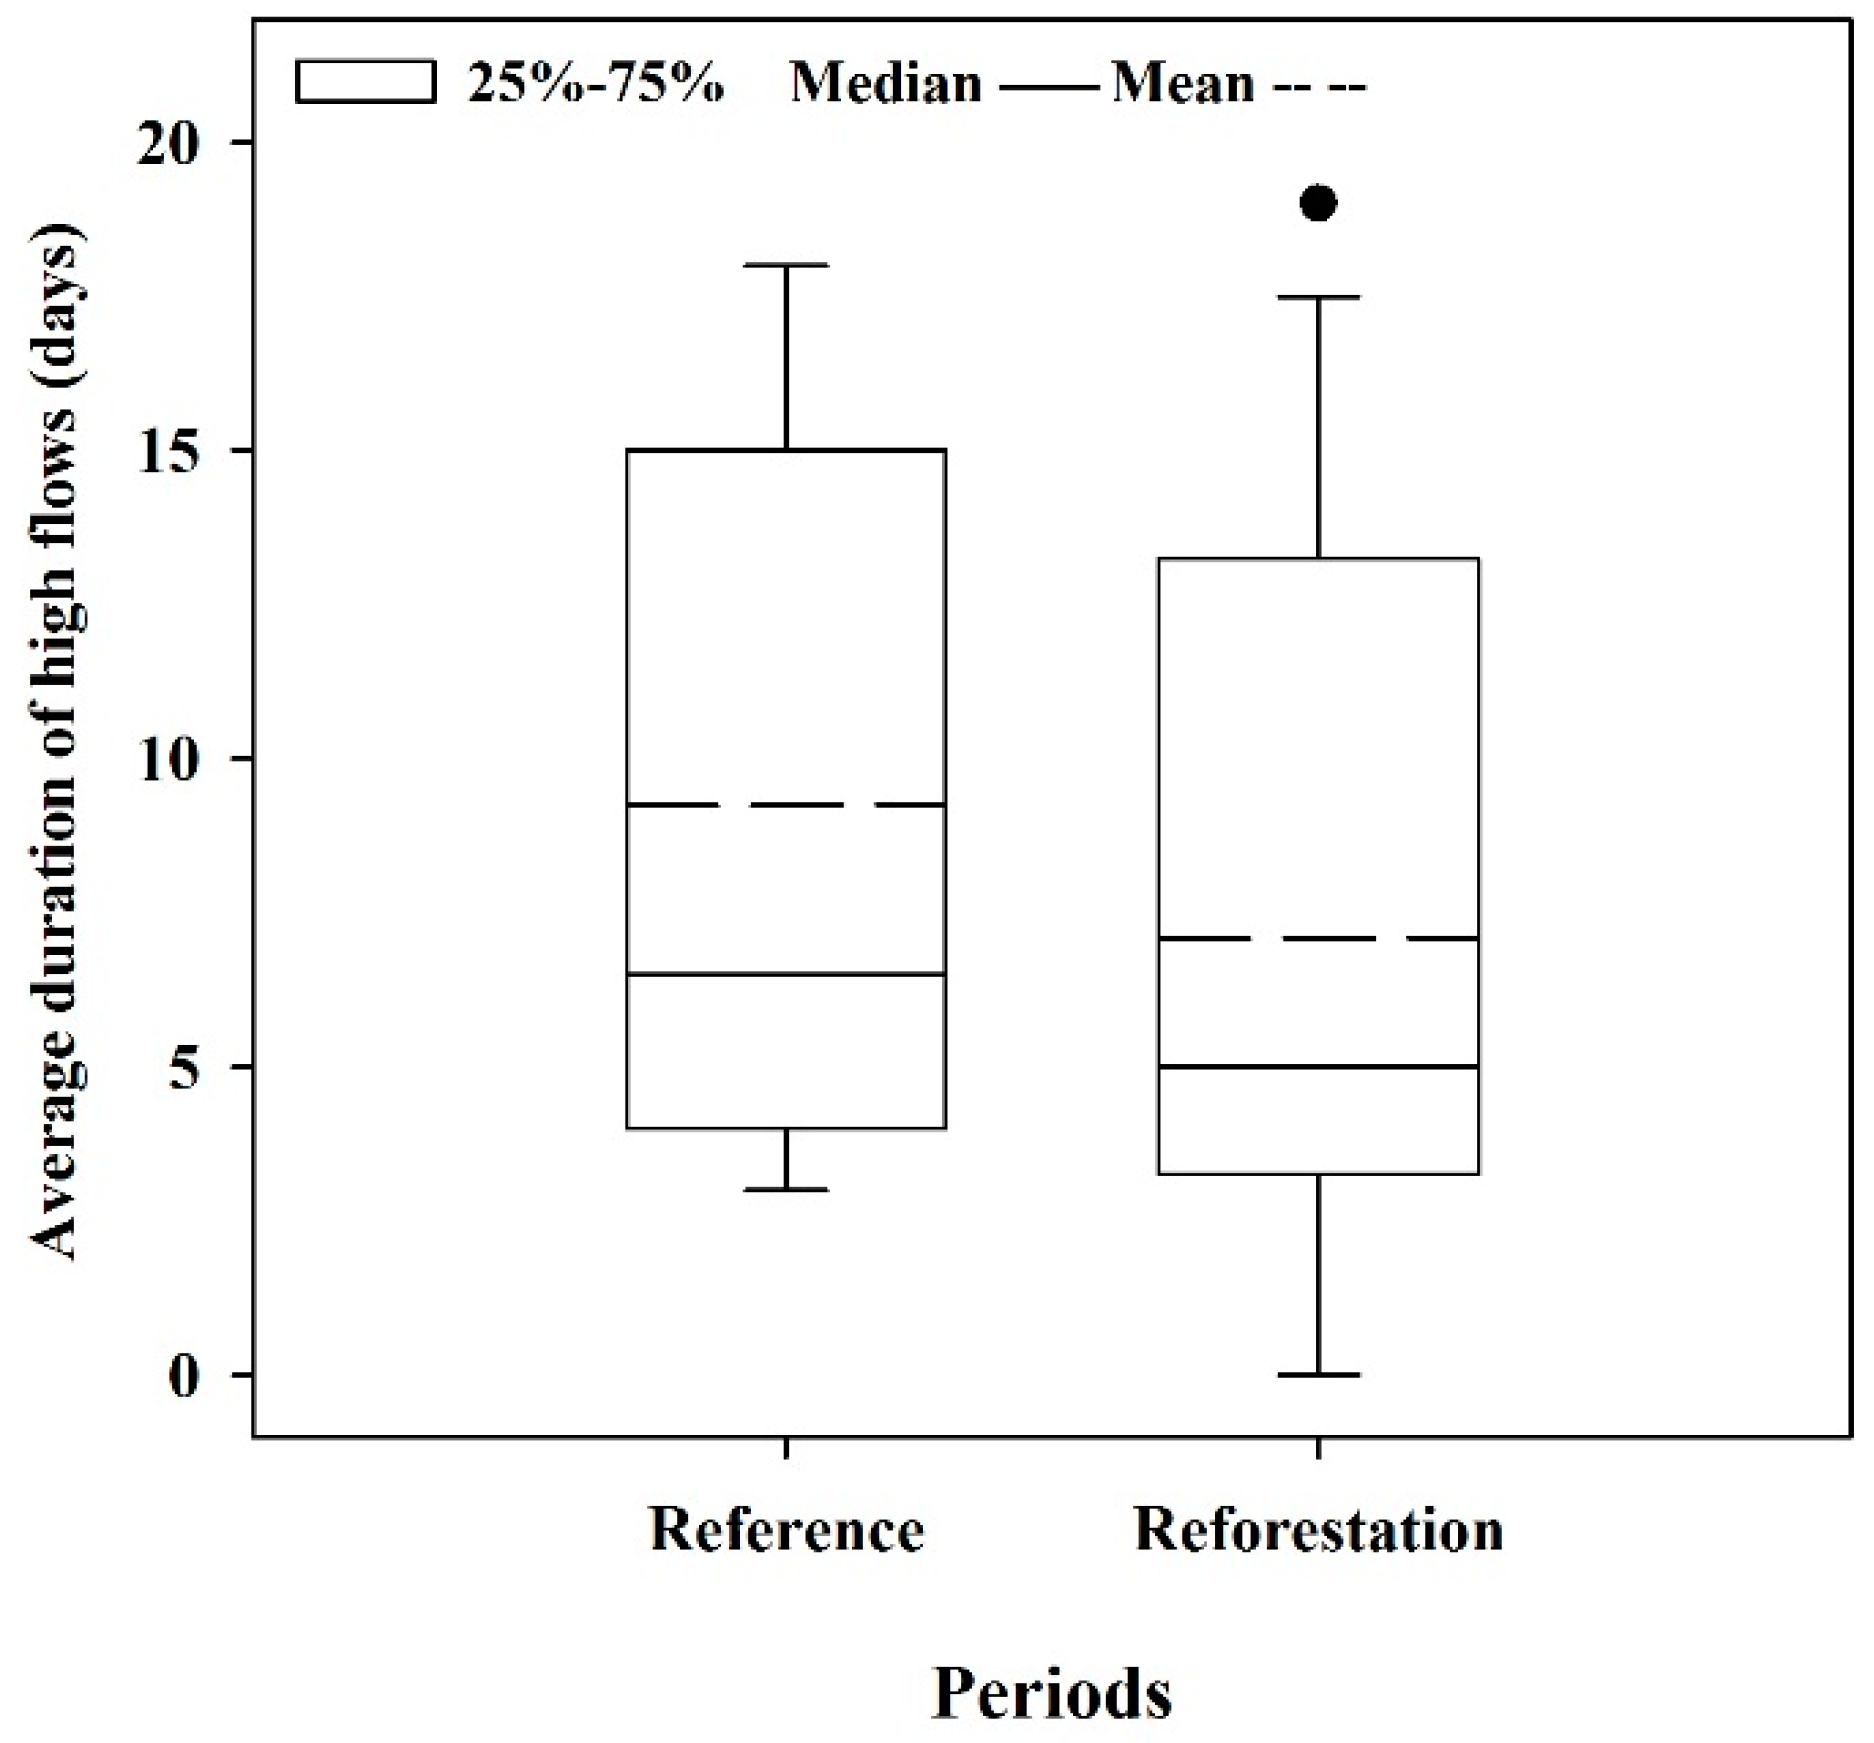
3.1.3. Duration
3.1.4. Frequency
3.1.5. Variability
3.2. Responses of Low Flows to Reforestation and Fruit Tree Planting
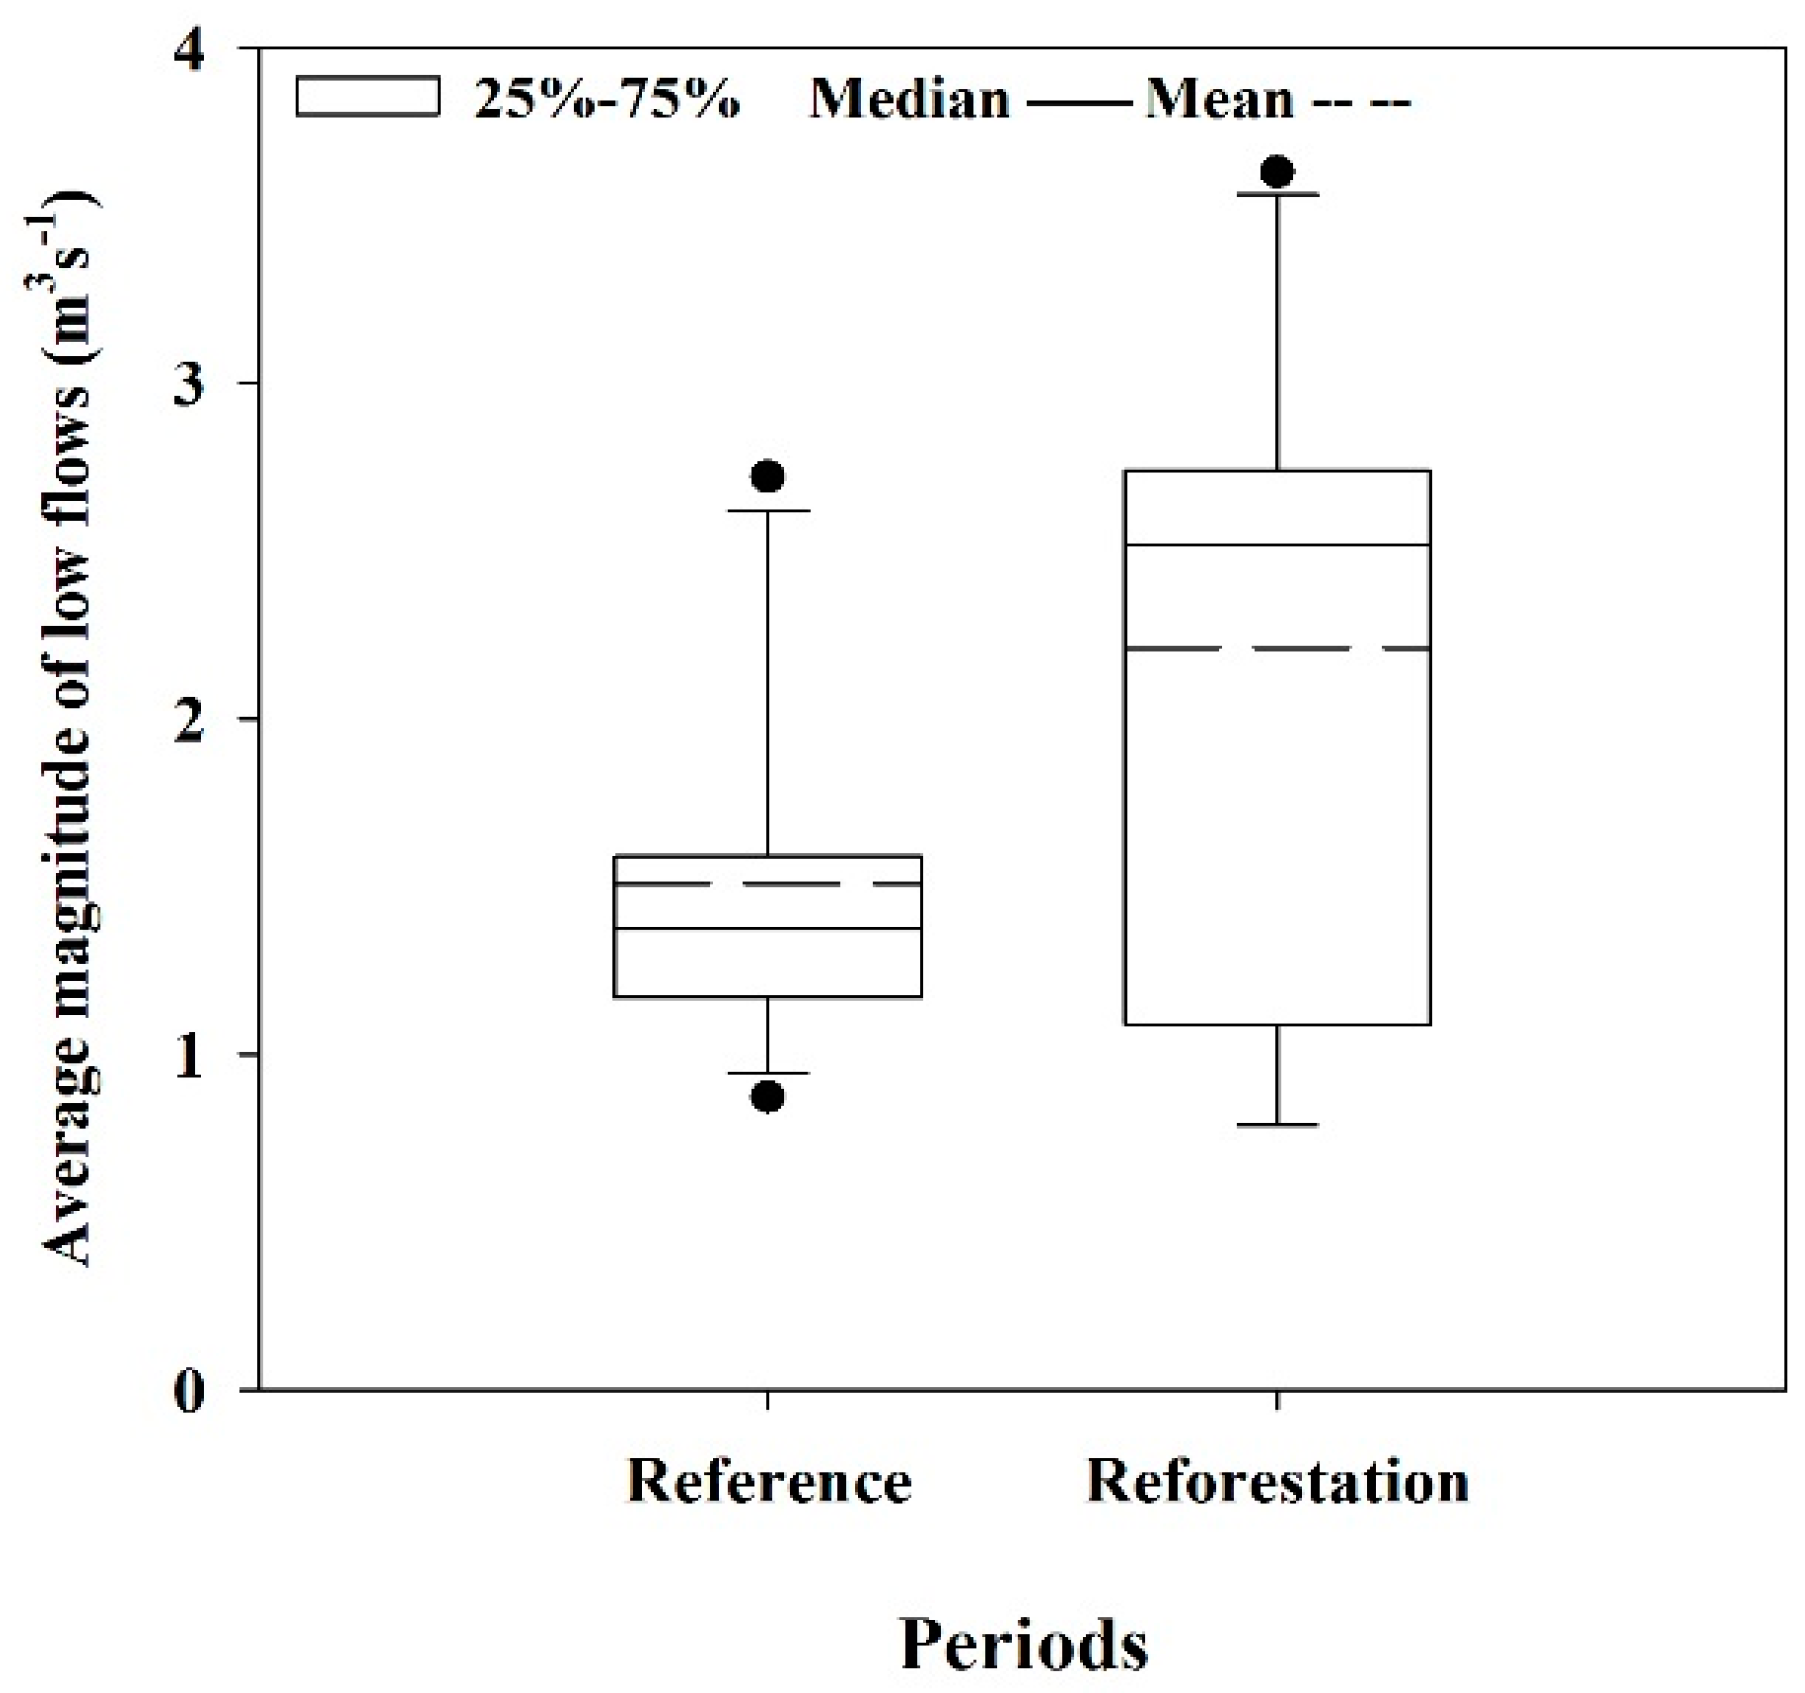
3.2.1. Magnitude
3.2.2. Timing
3.2.3. Duration
3.2.4. Frequency
3.2.5. Variability
4. Discussion
4.1. Effects of Reforestation on High and Low Flows
4.2. Effects of Fruit Tree Planting on High and Low Flows
4.3. Contrasted Differences
4.4. Uncertainty Analysis
5. Conclusions
Author Contributions
Acknowledgments
Conflicts of Interest
Appendix A

| Annual | P | Tmax | Tmin | Tave | Wind Speed | |||||
| M-K | S | M-K | S | M-K | S | M-K | S | M-K | S | |
| High flow | 0.558 ** | 0.767 ** | −0.173 | −0.267 | 0.074 | 0.12 | −0.081 | −0.119 | 0.048 | 0.07 |
| Low flow | 0.516 ** | 0.704 ** | −0.202 * | −0.282 * | 0.103 | 0.148 | −0.105 | −0.148 | 0.04 | 0.027 |
| Wet seasons | Pw | Tmaxw | Tminw | Tavew | Ww | |||||
| M-K | S | M-K | S | M-K | S | M-K | S | M-K | S | |
| High flow | 0.640 ** | 0.831 ** | −0.282 ** | −0.352 ** | −0.040 | −0.059 | −0.193 * | −0.246 | −0.051 | −0.054 |
| Low flow | 0.551 ** | 0.739 ** | −0.230 * | −0.287 * | 0.010 | 0.030 | −0.143 | −0.173 | −0.041 | −0.054 |
| Dry season | Pd | Tmaxd | Tmind | Taved | Wd | |||||
| M-K | S | M-K | S | M-K | S | M-K | S | M-K | S | |
| High flow | 0.009 | 0.017 | 0.052 | 0.081 | −0.021 | −0.030 | −0.016 | −0.008 | 0.011 | 0.017 |
| Low flow | −0.092 | −0.142 | −0.040 | −0.068 | −0.117 | −0.170 | −0.092 | −0.118 | 0.057 | 0.081 |
| Canonical R | Hydrological Variable Set (High and Low Flows) | |
|---|---|---|
| Climate variables sets | Set 1 (P, Tmax,) | 0.774 ** |
| Set 2 (P, Tmaxw, ) | 0.774 ** | |
| Set 3 (P, Tavew) | 0.774 ** | |
| Set 4 (P, Tmax, Tavew) | 0.774 ** | |
| Set 5 (P, Tmaxw, Tavew) | 0.793 ** | |
| Set 6 ((P, Tmax, Tmaxw) | 0.778 ** | |
| Set 7 (P, Tmax, Tmaxw, Tavew) | 0.795 ** | |
| Set 8 (Pw, Tmax) | 0.842 ** | |
| Set 9 (Pw, Tmaxw) | 0.842 ** | |
| Set 10 (Pw, Tavew) | 0.841 ** | |
| Set 11 (Pw, Tmax, Tavew) | 0.846 ** | |
| Set 12 (Pw, Tmaxd, Tavew) | 0.844 ** | |
| Set 13 ((P, Tmax, Tmaxw) | 0.845 ** | |
| Set 14 (Pw, Tmaxw, Tmaxw, Tavew) | 0.847 ** |
| Selected Year | Paired Year | Pw/mm | Qw/mm | Tmax/°C | Tmaxw/°C | Tavew/°C | ||||||
|---|---|---|---|---|---|---|---|---|---|---|---|---|
| Reference period vs. reforestation period | 1968 | 1994 | 1083.1 | 1072.4 | 469.6 | 650.3 | 24.1 | 23.6 | 27.2 | 28.5 | 21.8 | 23.4 |
| 1979 | 1990 | 609.1 | 614.9 | 278.1 | 284.7 | 24.2 | 23.5 | 26.8 | 27.3 | 21.9 | 22.1 | |
| 1964 | 1986 | 668.3 | 650.8 | 387.8 | 335.4 | 23.7 | 24.0 | 27.7 | 28.2 | 23.1 | 23.1 | |
| 1979 | 1987 | 609.1 | 635.3 | 278.1 | 250.7 | 24.2 | 24.1 | 26.8 | 27.3 | 21.9 | 22.1 | |
| 1968 | 1998 | 1083.1 | 1105.1 | 469.6 | 611.8 | 24.1 | 24.6 | 27.2 | 29.3 | 21.8 | 23.9 | |
| 1974 | 2000 | 722.2 | 721.6 | 230.7 | 351.7 | 23.6 | 23.3 | 28.5 | 28.0 | 23.0 | 22.8 | |
| 1965 | 1993 | 865.6 | 790.4 | 349.2 | 344.1 | 23.6 | 23.6 | 26.4 | 26.9 | 21.4 | 22.1 | |
| 1966 | 1996 | 874.3 | 852.8 | 512.5 | 416.8 | 24.3 | 23.6 | 27.0 | 26.8 | 21.8 | 21.7 | |
| 1982 | 1994 | 978.3 | 1072.4 | 669.0 | 650.3 | 23.3 | 23.6 | 26.8 | 28.5 | 21.6 | 23.4 | |
| 1981 | 1995 | 857.9 | 849.0 | 653.3 | 431.4 | 23.3 | 23.5 | 27.2 | 27.2 | 22.1 | 22.3 | |
| 1972 | 1993 | 819.9 | 790.4 | 283.8 | 344.1 | 23.3 | 23.6 | 26.9 | 26.9 | 21.9 | 22.1 | |
| 1978 | 1987 | 689.4 | 635.3 | 347.9 | 250.7 | 24.2 | 24.1 | 27.1 | 27.3 | 21.9 | 22.1 | |
| Reference period vs. fruit tree planting period | 1975 | 2001 | 1090.4 | 1071.2 | 690.4 | 745.3 | 23.1 | 24.0 | 26.6 | 27.2 | 21.8 | 22.3 |
| 1963 | 2007 | 539.6 | 550.6 | 122.4 | 273.7 | 24.9 | 24.8 | 29.0 | 28.5 | 23.3 | 22.2 | |
| 1980 | 2012 | 1038.3 | 1029.0 | 662.8 | 591.2 | 23.2 | 27.5 | 22.2 | ||||
| 1980 | 2002 | 1038.3 | 1012.8 | 662.8 | 668.6 | 23.2 | 24.4 | 27.5 | 28.8 | 22.2 | 23.2 | |
| 1964 | 2003 | 668.3 | 643.0 | 387.8 | 371.6 | 23.7 | 25.3 | 27.7 | 28.4 | 23.1 | 23.0 | |
| 1966 | 2006 | 874.3 | 894.6 | 512.5 | 584.4 | 24.3 | 24.2 | 27.0 | 27.7 | 21.8 | 22.2 | |
| 1982 | 2005 | 978.3 | 984.3 | 669.0 | 651.0 | 23.3 | 23.7 | 26.8 | 29.2 | 21.6 | 23.9 | |
| 1976 | 2015 | 852.1 | 816.0 | 543.7 | 348.5 | 22.9 | 26.3 | 21.6 | ||||
| 1969 | 2002 | 1025.1 | 1012.8 | 359.1 | 668.6 | 23.3 | 24.4 | 28.2 | 28.8 | 22.8 | 23.2 | |
| 1973 | 2005 | 991.1 | 984.3 | 760.3 | 651.0 | 23.5 | 23.7 | 26.9 | 29.2 | 22.4 | 23.9 | |
| 1969 | 2012 | 1025.1 | 1029.0 | 359.1 | 591.2 | 23.3 | 28.2 | 22.8 | ||||
| 1985 | 2009 | 485.6 | 461.3 | 245.8 | 134.3 | 23.1 | 25.0 | 28.3 | 29.1 | 22.9 | 23.3 | |
| Period | Selected Rainfall Events | Paired Rainfall Events | Peak Rainfall | Antecedent Rainfall (3-Day Average)/mm | Time Interval/Day | |||
|---|---|---|---|---|---|---|---|---|
| Reference period vs. reforestation period | 1976 20 Apr–26 Apr | 1986 24 Mar–29 Mar | 26.4 | 26.3 | 0 | 0.9 | 0 | 1 |
| 1964 16 May–22 May | 1987 8 Sep–14 Sep | 33.9 | 33.4 | 0.8 | 1.3 | 0 | 0 | |
| 1964 10 Jan–15 Jan | 1990 19 Feb–25 Feb | 45 | 45.1 | 0.2 | 1.8 | 1 | 1 | |
| 1967 18 May–23 May | 1991 18 Mar–23 Mar | 52.5 | 51.6 | 0.1 | 0.4 | 0 | 1 | |
| 1962 14 Apr–20 Apr | 1992 27 May–2 Jun | 34.7 | 35 | 0.2 | 1.6 | 0 | 2 | |
| 1976 10 Oct–16 Oct | 1993 11 May–17 May | 32.6 | 32.9 | 0.2 | 0 | 1 | 0 | |
| 1976 12 May–18 May | 1994 7 May–13 May | 29.1 | 29 | 0.8 | 0 | 1 | 1 | |
| 1961 17 Nov–23 Nov | 1996 16 Apr–22 Apr | 41 | 40.7 | 0.1 | 0 | 0 | 0 | |
| 1972 30 Oct–5 Nov | 1996 19 Jul–25 Jul | 25.6 | 25.7 | 0.3 | 0.4 | 0 | 0 | |
| 1974 28 Oct–3 Nov | 1996 19 Jul–25 Jul | 25.6 | 25.7 | 0.3 | 0.4 | 0 | 0 | |
| 1968 6 Jun–12 Jun | 1997 28 Apr–4 May | 70.8 | 73.7 | 2.5 | 2.2 | 0 | 1 | |
| 1964 16 May–22 May | 1998 29 Oct–4 Nov | 33.9 | 33.5 | 0.8 | 0.1 | 0 | 1 | |
| 1965 2 Aug–7 Aug | 1997 11 Oct–17 Oct | 41.2 | 41.7 | 0 | 1.2 | 1 | 1 | |
| 1976 27 Sep–3 Oct | 1987 22 Sep–28 Sep | 39.6 | 38.7 | 0.5 | 0.2 | 0 | 1 | |
| 1984 11 Nov–17 Nov | 1990 30 Oct–5 Nov | 44.9 | 44.7 | 1.7 | 0 | 1 | 0 | |
| Reference period vs. fruit tree planting period | 1983 20 Aug–26 Aug | 2002 11 May–16 May | 25.7 | 26.1 | 1.3 | 1 | 2 | 1 |
| Reference period vs. fruit tree planting period | 1976 20 Apr–26 Apr | 2014 1 May–7 May | 26.4 | 26.5 | 0 | 0 | 0 | 1 |
| 1964 16 May–22 May | 2010 11 Feb−17 Feb | 33.9 | 33.4 | 0.8 | 1.2 | 0 | 1 | |
| 1964 11 Oct–17 Oct | 2016 12 May−18 May | 44.4 | 44 | 0.2 | 0 | 0 | 0 | |
| 1966 1 Apr–7 Apr | 2004 9 Apr−14 Apr | 39.7 | 39.3 | 2.0 | 0 | 0 | 0 | |
| 1967 18 May–23 May | 2016 7 Sep−13 Sep | 52.5 | 52 | 0.1 | 0 | 0 | 1 | |
| 1968 6 Jun–12 Jun | 2001 28 Aug−3 Sep | 70.8 | 68.7 | 2.5 | 2.8 | 0 | 0 | |
| 1978 25 Aug–31 Aug | 2005 20 Apr−26 Apr | 30.1 | 30.1 | 0 | 0 | 1 | 0 | |
| 1962 14 Apr–20 Apr | 2006 28 Apr−4 May | 34.7 | 34.6 | 0.2 | 0.7 | 0 | 1 | |
| 1976 10 Oct–16 Oct | 2007 1 Aug−7 Aug | 32.6 | 32.2 | 0.2 | 1.5 | 1 | 1 | |
| 1977 24 Feb–1 Mar | 2006 19 May−25 May | 40.2 | 40.7 | 0 | 0 | 0 | 0 | |
| 1975 3 Jul– 10 Jul | 2005 20 Apr−26 Apr | 30.3 | 30.1 | 0.2 | 0 | 1 | 0 | |
| 1972 26 Apr–2 May | 2002 27 May−2 Jun | 26.6 | 26.6 | 0.7 | 0 | 1 | 1 | |
| 1961 17 Nov–23 Nov | 2006 19 May−25 May | 41 | 40.7 | 0.1 | 0 | 0 | 0 | |
| 1965 2 Aug–7 Aug | 2016 14 Mar−19 Mar | 41.2 | 42 | 0 | 0 | 2 | 1 | |

References
- Wei, X.; Liu, W.; Zhou, P. Quantifying the Relative Contributions of Forest Change and Climatic Variability to Hydrology in Large Watersheds: A Critical Review of Research Methods. Water 2013, 5, 728–746. [Google Scholar] [CrossRef] [Green Version]
- Stednick, J.D. Monitoring the effects of timber harvest on annual water yield. J. Hydrol. 1996, 176, 79–95. [Google Scholar] [CrossRef]
- Farley, K.A.; Jobbágy, E.G.; Jackson, R.B. Effects of afforestation on water yield: A global synthesis with implications for policy. Glob. Chang. Biol. 2005, 11, 1565–1576. [Google Scholar] [CrossRef]
- Andréassian, V. Waters and forests: From historical controversy to scientific debate. J. Hydrol. 2004, 291, 1–27. [Google Scholar] [CrossRef]
- Bruijnzeel, L.A. Hydrological functions of tropical forests: Not seeing the soil for the trees? Agric. Ecosyst. Environ. 2004, 104, 185–228. [Google Scholar] [CrossRef]
- Li, Q.; Wei, X.; Zhang, M.; Liu, W.; Fan, H.; Zhou, G.; Giles-Hansen, K.; Liu, S.; Wang, Y. Forest cover change and water yield in large forested watersheds: A global synthetic assessment. Ecohydrology 2017, 10, e1838. [Google Scholar] [CrossRef]
- Zhang, M.; Liu, N.; Harper, R.; Li, Q.; Liu, K.; Wei, X.; Ning, D.; Hou, Y.; Liu, S. A global review on hydrological responses to forest change across multiple spatial scales: Importance of scale, climate, forest type and hydrological regime. J. Hydrol. 2017, 546, 44–59. [Google Scholar] [CrossRef]
- Wei, X.; Li, Q.; Zhang, M.; Giles-Hansen, K.; Liu, W.; Fan, H.; Wang, Y.; Zhou, G.; Piao, S.; Liu, S. Vegetation cover—Another dominant factor in determining global water resources in forested regions. Glob. Chang. Biol. 2018, 24, 786–795. [Google Scholar] [CrossRef] [PubMed]
- Li, Q.; Wei, X.; Zhang, M.; Liu, W.; Giles-Hansen, K.; Wang, Y. The cumulative effects of forest disturbance and climate variability on streamflow components in a large forest-dominated watershed. J. Hydrol. 2018, 557, 448–459. [Google Scholar] [CrossRef]
- Zhang, M.; Wei, X. Alteration of flow regimes caused by large-scale forest disturbance: A case study from a large watershed in the interior of British Columbia, Canada. Ecohydrology 2014, 7, 544–556. [Google Scholar] [CrossRef]
- Poff, L.R.; Allan, J.D.; Bain, M.B.; Karr, J.R.; Prestegaard, K.L.; Richter, B.D.; Sparks, R.E.; Stromberg, J.C. The Natural Flow Regime. Bioscience 1997, 47, 769–784. [Google Scholar] [CrossRef] [Green Version]
- Duan, L.; Man, X.; Yu, Z.X.; Liu, Y.; Zhu, B. The effects of forest disturbance on flow regimes of a small forested watershed in northern Daxing’anling, China. Acta Ecol. Sin. 2017, 37, 1421–1430. [Google Scholar]
- Li, Q.; Wei, X.; Yang, X.; Giles-Hansen, K.; Zhang, M.; Liu, W. Topography significantly influencing low flows in snow-dominated watersheds. Hydrol. Earth Syst. Sci. 2018, 22, 1947–1956. [Google Scholar] [CrossRef] [Green Version]
- Schneider, C.; Laizé, C.L.R.; Acreman, M.C.; Flörke, M. How will climate change modify river flow regimes in Europe? Hydrol. Earth Syst. Sci. 2012, 9, 9193–9238. [Google Scholar] [CrossRef]
- Wang, G.X.; Qian, J.; Cheng, G.D. Current situation and prospect of the ecological hydrology. Adv. Earth Sci. 2001, 16, 314–323. [Google Scholar]
- Bunn, S.E.; Arthington, A.H. Basic principles and ecological consequences of altered flow regimes for aquatic biodiversity. Environ. Manag. 2002, 30, 492–507. [Google Scholar] [CrossRef]
- Poff, N.L.; Zimmerman, J.K.H. Ecological responses to altered flow regimes: A literature review to inform the science and management of environmental flows. Freshw. Biol. 2010, 55, 194–205. [Google Scholar] [CrossRef]
- Wharton, C.H.; Lambour, V.W.; Newsom, J. The Fauna of Bottomland Hardwoods in Southeastern United States. Dev. Agric. Manag. For. Ecol. 1981, 87–160. [Google Scholar]
- Guariguata, M.R.; Locatelli, B.; Haupt, F. Adapting Tropical Production Forests to Global Climate Change: Risk Perceptions and Actions. Int. For. Rev. 2012, 14, 27–38. [Google Scholar] [CrossRef]
- Liu, W.; Wei, X.; Fan, H.; Guo, X.; Liu, Y.; Zhang, M.; Li, Q. Response of flow regimes to deforestation and reforestation in a rain-dominated large watershed of subtropical China. Hydrol. Process. 2015, 29, 5003–5015. [Google Scholar] [CrossRef]
- Greenberg, L.; Svendsen, P.; Harby, A. Availability of microhabitats and their use by brown trout (Salmo trutta) and grayling (Thymallus thymallus) in the River Vojman. Regul. Rivers Reserv. Manag. 1996, 12, 287–303. [Google Scholar] [CrossRef]
- Reeves, G.H.; Benda, L.E.; Burnett, K.M.; Bisson, P.A.; Sedell, J.R. A disturbance-based ecosystem approach to maintaining and restoring freshwater habitats of evolutionarily significant units of anadromous salmonids in the Pacific Northwest. Am. Fish. Soc. Symp. Ser. 1996, 17, 334–349. [Google Scholar]
- Liu, W.; Wei, X.; Li, Q.; Fan, H.; Duan, H.; Wu, J.; Krasty, G.H.; Zhang, H. Hydrological recovery in two large forested watersheds of Southeastern China: Importance of watershed property in determining hydrological responses to reforestation. Hydrol. Earth Syst. Sci. 2016, 20, 4747–4756. [Google Scholar] [CrossRef]
- Zhang, M.; Wei, X.; Li, Q. A quantitative assessment on the response of flow regimes to cumulative forest disturbances in large snow-dominated watersheds in the interior of British Columbia, Canada. Ecohydrology 2016, 9, 843–859. [Google Scholar] [CrossRef]
- Mcmahon, T.A.; Srikanthan, R. Log Pearson III distribution—is it applicable to flood frequency analysis of Australian streams? J. Hydrol. 1981, 52, 139–147. [Google Scholar] [CrossRef]
- Sharma, M.; Agarwal, R. Maximum likelihood method for parameter estimation in non-linear models with below detection data. Environ. Ecol. Stat. 2003, 10, 445–454. [Google Scholar] [CrossRef]
- Eastwood, A.; Brooker, R.; Irvine, R.; Artz, R.; Norton, L.; Bullock, J.; Ross, L.; Fielding, D.; Ramsay, S.; Roberts, J. Does nature conservation enhance ecosystem services delivery? Ecosyst. Serv. 2016, 17, 152–162. [Google Scholar] [CrossRef] [Green Version]
- Nadal-Romero, E.; Cammeraat, E.; Serrano-Muela, M.P.; Lana-Renault, N.; Regüés, D. Hydrological response of an afforested catchment in a Mediterranean humid mountain area: A comparative study with a natural forest. Hydrol. Process. 2016, 30, 2717–2733. [Google Scholar] [CrossRef]
- Llorens, P.; Poch, R.; Latron, J.; Gallart, F. Rainfall interception by a Pinus sylvestris forest patch overgrown in a Mediterranean moutainous abandoned area I. Monitoring design and results down to the event scale. J. Hydrol. 1997, 199, 331–345. [Google Scholar] [CrossRef]
- Gebrehiwot, S.G.; Taye, A.; Bishop, K. Forest cover and stream flow in a headwater of the Blue Nile: Complementing observational data analysis with community perception. AMBIO 2010, 39, 284–294. [Google Scholar] [CrossRef] [PubMed]
- Dung, B.X.; Gomi, T.; Miyata, S.; Sidle, R. Peak flow responses and recession flow characteristics after thinning of Japanese cypress forest in a headwater catchment. Hydrol. Res. Lett. 2012, 6, 35–40. [Google Scholar] [CrossRef] [Green Version]
- Shen, W.; Peng, S.; Zhou, G.; Lin, Y.; Li, Z. Ecohydrological functions of litter in man-made Acacia Mangium and Pinus elliotii plantations. Acta Ecol. Sin. 2001, 21, 846–850. [Google Scholar]
- Robinson, M.; Dupeyrat, A. Effects of commercial timber harvesting on streamflow regimes in the Plynlimon catchments, mid-Wales. Hydrol. Process. 2010, 19, 1213–1226. [Google Scholar] [CrossRef]
- Price, K.; Jackson, C.R.; Parker, A.J.; Reitan, T.; Dowd, G.; Cyterski, M. Effects of watershed land use and geomorphology on stream low flows during severe drought conditions in the southern Blue Ridge Mountains, Georgia and North Carolina, United States. Water Resour. Res. 2011, 47, 1198–1204. [Google Scholar] [CrossRef]
- Ahn, K.Y.; Merwade, V. The effect of land cover change on duration and severity of high and low flows. Hydrol. Process. 2017, 31, 133–149. [Google Scholar] [CrossRef]
- Buttle, J.M. Streamflow response to headwater reforestation in the Ganaraska River basin, southern Ontario, Canada. Hydrol. Process. 2011, 25, 3030–3041. [Google Scholar] [CrossRef]
- Blöschl, G.; Ardoin-Bardin, S.; Bonell, M.; Dorninger, M.; Goodrich, D. At what scales do climate variability and land cover change impact on flooding and low flows? Hydrol. Process. 2007, 21, 1241–1247. [Google Scholar] [CrossRef] [Green Version]
- Zhou, G.; Wei, X.; Chen, X.; Zhou, P.; Liu, X.; Xiao, Y.; Sun, G.; Scott, D.F.; Zhou, S.; Han, L.; et al. Global pattern for the effect of climate and land cover on water yield. Nat. Commun. 2015, 6, 5918. [Google Scholar] [CrossRef] [PubMed] [Green Version]
- Mcvicar, T.R.; Li, L.T.; Niel, T.G.V.; Zhang, L.; Li, R.; Yang, Q.; Zhang, X.; Mu, X.; Wen, Z.; Liu, W.; et al. Developing a decision support tool for China’s re-vegetation program: Simulating regional impacts of afforestation on average annual streamflow in the Loess Plateau. For. Ecol. Manag. 2007, 251, 65–81. [Google Scholar] [CrossRef]
- Vertessy, R.; Zhang, L.; Dawes, W.R. Plantations, river flows and river salinity. Aust. For. 2003, 66, 55–61. [Google Scholar] [CrossRef]
- Waterloo, M.J.; Schellekens, J.; Bruijnzeel, L.A.; Rawaqa, T.T. Changes in catchment runoff after harvesting and burning of a Pinus caribaea plantation in Viti Levu, Fiji. For. Ecol. Manag. 2007, 251, 31–44. [Google Scholar] [CrossRef]
- Huang, Q.; He, B.H.; Qin, W.; Zuo, C.; Yao, Y.; He, X.; Li, T. The Infiltration Characteristics of Disturbed Soil under Natural Rainfall Conditions. J. Irrig. Drain. Eng. 2015, 34, 91–95. [Google Scholar]
- Pathak, P.; Wani, S.P.; Sudi, R.; Budama, N. Inter-row tillage for improved soil and water conservation and crop yields on crusted Alfisols. Agric. Sci. 2017, 04, 36–45. [Google Scholar] [CrossRef]
- Sileshi, R.; Pitt, R.; Clark, S.; Christan, C. Laboratory and Field Studies of Soil Characteristics of Proposed Stormwater Bioinfiltration Sites. Proc. Water Environ. Fed. 2012, 5, 241–250. [Google Scholar] [CrossRef]
- Huang, H.X.; Xie, X.L.; Wang, K.R. Surface runoff and nutrient loss from red-soil slope-lands under different land use types. Ecol. Environ. Sci. 2008, 17, 1645–1649. [Google Scholar]
- Walker, J.; Reddell, P. Retrogressive Succession and Restoration on Old Landscapes. In Linking Restoration and Ecological Succession; Springer: New York, NY, USA, 2007; pp. 69–89. [Google Scholar]
- Zhang, M.; Wei, X. The cumulative effects of forest disturbance on streamflow in a large watershed in the central interior of British Columbia, Canada. Hydrol. Earth Syst. Sci. 2012, 9, 2855–2895. [Google Scholar] [CrossRef]
- Lacombe, G.; Ribolzi, O.; De Rouw, A.; Pierret, A. Contradictory hydrological impacts of afforestation in the humid tropics evidenced by long-term field monitoring and simulation modelling. Hydrol. Earth Syst. Sci. 2016, 20, 2691–2704. [Google Scholar] [CrossRef] [Green Version]
- Lu, X.Z.; Kang, L.L.; Zuo, Z.G.; Sun, J.; Ni, Y.X.; Lu, W.X. Effects of different vegetation types on slope runoff process under rainstorm condition. Guangdong Agric. Sci. 2016, 1, 79–83. [Google Scholar]


| Flow Regime Components | ||||||
|---|---|---|---|---|---|---|
| Period | Magnitude | Timing | Duration | Frequency | Variability | |
| Reference period vs. reforestation period | High flows | ↓ * | - | ↓ * | - | - |
| Low flows | ↑ * | - | ↓ ** | - | - | |
| Reference period vs. fruit tree planting period | High flows | ↑ * | - | - | - | - |
| Low flows | - | - | - | - | - | |
© 2019 by the authors. Licensee MDPI, Basel, Switzerland. This article is an open access article distributed under the terms and conditions of the Creative Commons Attribution (CC BY) license (http://creativecommons.org/licenses/by/4.0/).
Share and Cite
Xu, Z.; Liu, W.; Wei, X.; Fan, H.; Ge, Y.; Chen, G.; Xu, J. Contrasting Differences in Responses of Streamflow Regimes between Reforestation and Fruit Tree Planting in a Subtropical Watershed of China. Forests 2019, 10, 212. https://doi.org/10.3390/f10030212
Xu Z, Liu W, Wei X, Fan H, Ge Y, Chen G, Xu J. Contrasting Differences in Responses of Streamflow Regimes between Reforestation and Fruit Tree Planting in a Subtropical Watershed of China. Forests. 2019; 10(3):212. https://doi.org/10.3390/f10030212
Chicago/Turabian StyleXu, Zhipeng, Wenfei Liu, Xiaohua Wei, Houbao Fan, Yizao Ge, Guanpeng Chen, and Jin Xu. 2019. "Contrasting Differences in Responses of Streamflow Regimes between Reforestation and Fruit Tree Planting in a Subtropical Watershed of China" Forests 10, no. 3: 212. https://doi.org/10.3390/f10030212