Article

Soil Physicochemical Properties and the Rhizosphere Soil Fungal Community in a Mulberry (Morus alba L.)/Alfalfa (Medicago sativa L.) Intercropping System

1
School of Life Sciences, Northeast Forestry University, Harbin 150040, China
2
Institute of Crops, Heilongjiang Academy of Land Reclamation and Agricultural Sciences, Jiamusi 154007, China
*
Author to whom correspondence should be addressed.
Forests 2019, 10(2), 167; https://doi.org/10.3390/f10020167
Submission received: 24 January 2019 / Revised: 10 February 2019 / Accepted: 13 February 2019 / Published: 16 February 2019
(This article belongs to the Special Issue Rhizosphere Dynamics under Global Change)

Abstract

:
A better understanding of soil fungal communities is very useful in revealing the effects of an agroforestry system and would also help us to understand the fungi-mediated effects of agricultural practices on the processes of soil nutrient cycling and crop productivity. Compared to conventional monoculture farming, agroforestry systems have obvious advantages in improving land use efficiency and maintaining soil physicochemical properties, reducing losses of water, soil material, organic matter, and nutrients, as well as ensuring the stability of yields. In this study, we attempted to investigate the impact of a mulberry/alfalfa intercropping system on the soil physicochemical properties and the rhizosphere fungal characteristics (such as the diversity and structure of the fungal community), and to analyze possible correlations among the planting pattern, the soil physicochemical factors, and the fungal community structure. In the intercropping and monoculture systems, we determined the soil physicochemical properties using chemical analysis and the fungal community structure with MiSeq sequencing of the fungal ITS1 region. The results showed that intercropping significantly improved the soil physicochemical properties of alfalfa (total nitrogen, alkaline hydrolysable nitrogen, available potassium, and total carbon contents). Sequencing results showed that the dominant taxonomic groups were Ascomycota, Basidiomycota, and Mucoromycota. Intercropping increased the fungal richness of mulberry and alfalfa rhizosphere soils and improved the fungal diversity of mulberry. The diversity and structure of the fungal community were predominantly influenced by both the planting pattern and soil environmental factors (total nitrogen, total phosphate, and total carbon). Variance partitioning analysis showed that the planting pattern explained 25.9% of the variation of the fungal community structure, and soil environmental factors explained 63.1% of the variation. Planting patterns and soil physicochemical properties conjointly resulted in changes of the soil fungal community structure in proportion.

1. Introduction

Soil microorganisms are a vital component of soil ecosystems and play an important role in terrestrial ecosystem processes, especially the regulation of carbon and nutrient cycles. Soil microorganisms depend on carbon resources supplied by plant litter and root exudates and they can be influenced by changes in plant-derived organic matter [1,2]. There are differences in plant litter chemistry and root exudates among different vegetation types, and their effects on below-ground ecosystem processes vary [3,4]. Therefore, changes in land use can affect the structural and functional characteristics of the soil microbial community [5,6].
Agroforestry is defined as “an approach to land use” that incorporates trees into farming systems and allows woody perennials to be managed on the same unit of land as agricultural crops, livestock, or both [7,8,9]. Compared to conventional monoculture farming, agroforestry systems have obvious advantages in improving land use efficiency [10] and maintaining soil physicochemical properties, reducing losses of water, soil material, organic matter and nutrients, and ensuring stability of yields [11,12]. Moreover, an agroforestry system has relatively high diversity and stability of soil microbial communities, especially the diversity and abundance of beneficial microbial populations, such as arbuscular mycorrhizal (AM) fungi that can enhance the productivity of crop plants by increasing the availability and supply of limiting nutrients [13,14,15,16]. Agroforestry practices have been widely applied in Chinese agriculture [17]. Recently, researchers showed a strong interest in these types of cropping systems due to their capacity to produce higher yields and to counteract resource degradation [18]. However, previous studies on the effects of intercropping on soil microorganisms mainly concentrated on bacteria, with only limited studies on fungi [5,6,13].
Fungi are widely distributed species in the soil system; they have a high ability to degrade complex substrates of plant origin, representing up to 90% of net primary productivity in most terrestrial ecosystems. In addition, the usually mutualistic symbioses known as mycorrhizae between many fungi and plant roots have huge impacts in both ecological and economic terms [19,20]. Fungi are spatially ubiquitous and are more susceptible than bacteria to disturbance, such as land use change [21]. Intercropping mulberry (Morus alba L.) with alfalfa (Medicago sativa L.) is an important planting type for increasing forage yield in the semiarid and salt-alkali soil regions in the Songnen Plain of northern China. The use of a mulberry/N-fixing crop intercropping system has been demonstrated to improve crop yields and to modify salt-alkali soil, as the N-fixing crop provides natural N fertilizer for tree growth and the trees improve the soil total nitrogen and carbon status [22]. Therefore, a better understanding of soil fungal communities is very useful to reveal the effects of an intercropping system and would also help us to understand the fungi-mediated effects of agricultural practices on the processes of soil nutrient cycling and crop productivity. In this study, we attempted to investigate the impact of a mulberry/alfalfa intercropping system on the soil physicochemical properties and rhizosphere fungal characteristics (such as the diversity and structure of the fungal community) and to analyze possible correlations among the planting pattern, the soil physicochemical factors, and the fungal community structure.

2. Results

2.1. Physicochemical Properties of the Rhizosphere Soil of the Mulberry and Alfalfa Intercropping System

Intercropping significantly affected the contents of total N, available K, and total C of the crop rhizosphere soils (Table 1). The total N and available K significantly decreased in the rhizosphere soil of intercropped mulberry (p < 0.05). However, the total N, available K, and total carbon significantly increased in the rhizosphere soil of intercropped alfalfa (p < 0.05).

2.2. Fungal Shannon-Wiener Curve

A total of 315,837 ITS sequences were obtained from the eight soil samples by MiSeq analysis of the ITS1 region of fungi. As the read numbers per sample were uneven (ranging from 20,418 to 37,373), all samples were reduced to the same size using MOTHUR software (version 1.39.5, http://github.com/mothur/, Detroit, MI, USA) based on the smallest read number (20,418).
Operational Taxonomic Units (OTUs) were identified at a similarity level of 97%; almost all curves reached the saturated state, indicating that the survey effort was sufficiently large to capture the complete diversity of these communities, as the curves leveled off with increasing sample sizes (Figure S1).

2.3. Fungal Community Richness and Diversity

Among all samples, a total of 5844 OTUs were obtained, ranging from 2848 in the intercropping soils to 2996 in the monoculture soils (Table 2). The coverage of all samples was estimated to reach 99%. The mean community richness (the Chao1 estimator) was higher in the alfalfa rhizosphere soil than in the mulberry rhizosphere soil. The community diversity estimators, including the Shannon index and Simpson index, suggested that the values in the intercropped mulberry soils exceeded those in the corresponding monoculture soils; however, the community diversity indices of monoculture and intercropped alfalfa soils were similar.
Beta diversity analysis showed dissimilarity values among the different treatments based on the biological distances. The results indicated that the degree of fungal community dissimilarity between mulberry and alfalfa was different. Intercropping changed the fungal communities of mulberry and alfalfa. The Bray-Curtis distances were 0.4889 (between MM and IM) and 0.4944 (between MA and IA). In addition, the Bray-Curtis distance between mulberry and alfalfa decreased from 0.5689 (between MM and MA) to 0.4222 (between IM and IA) (Figure S2).

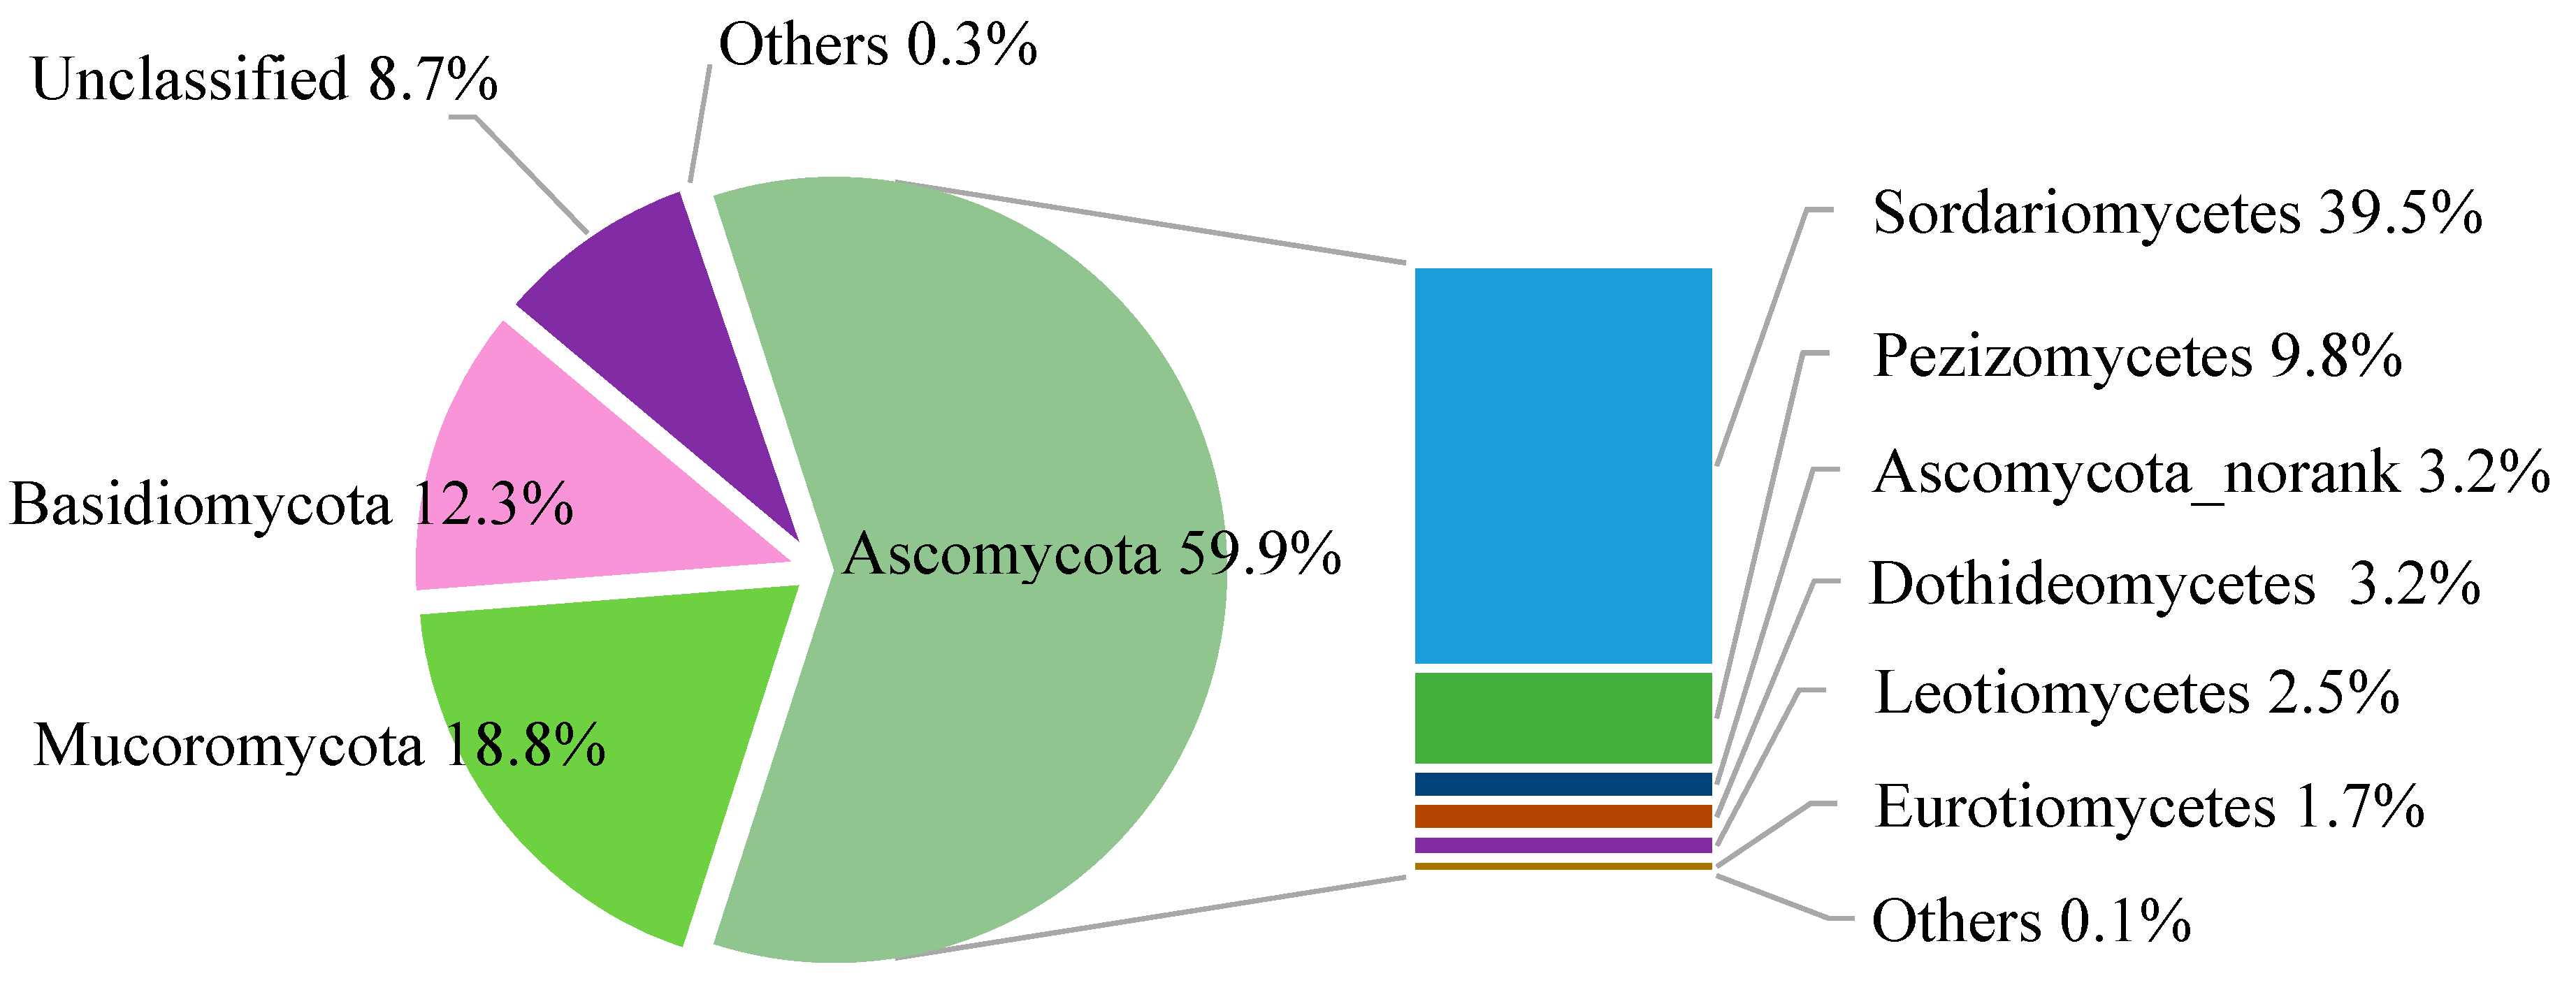
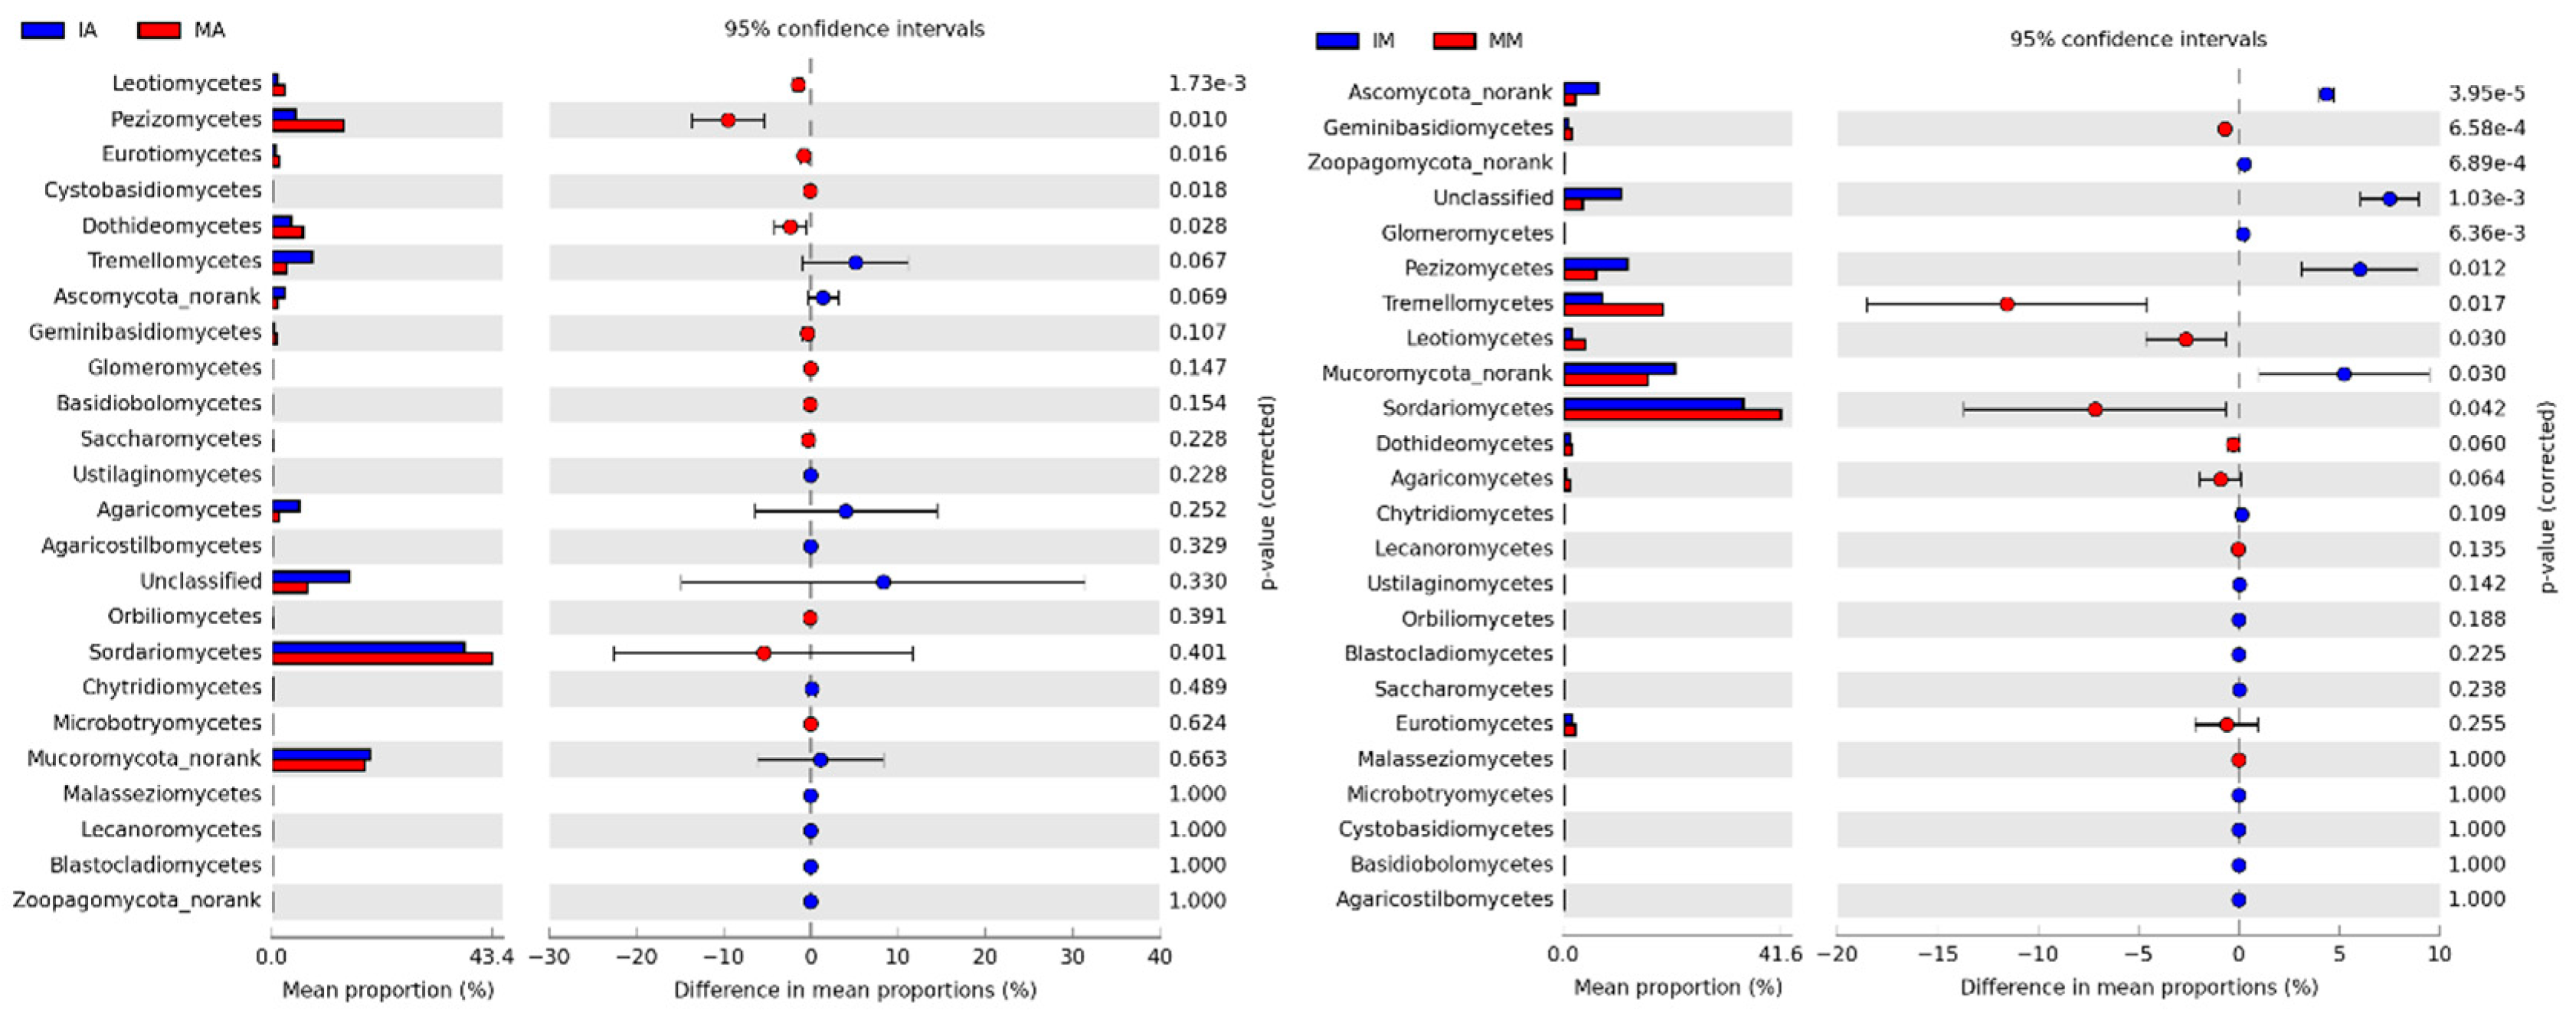
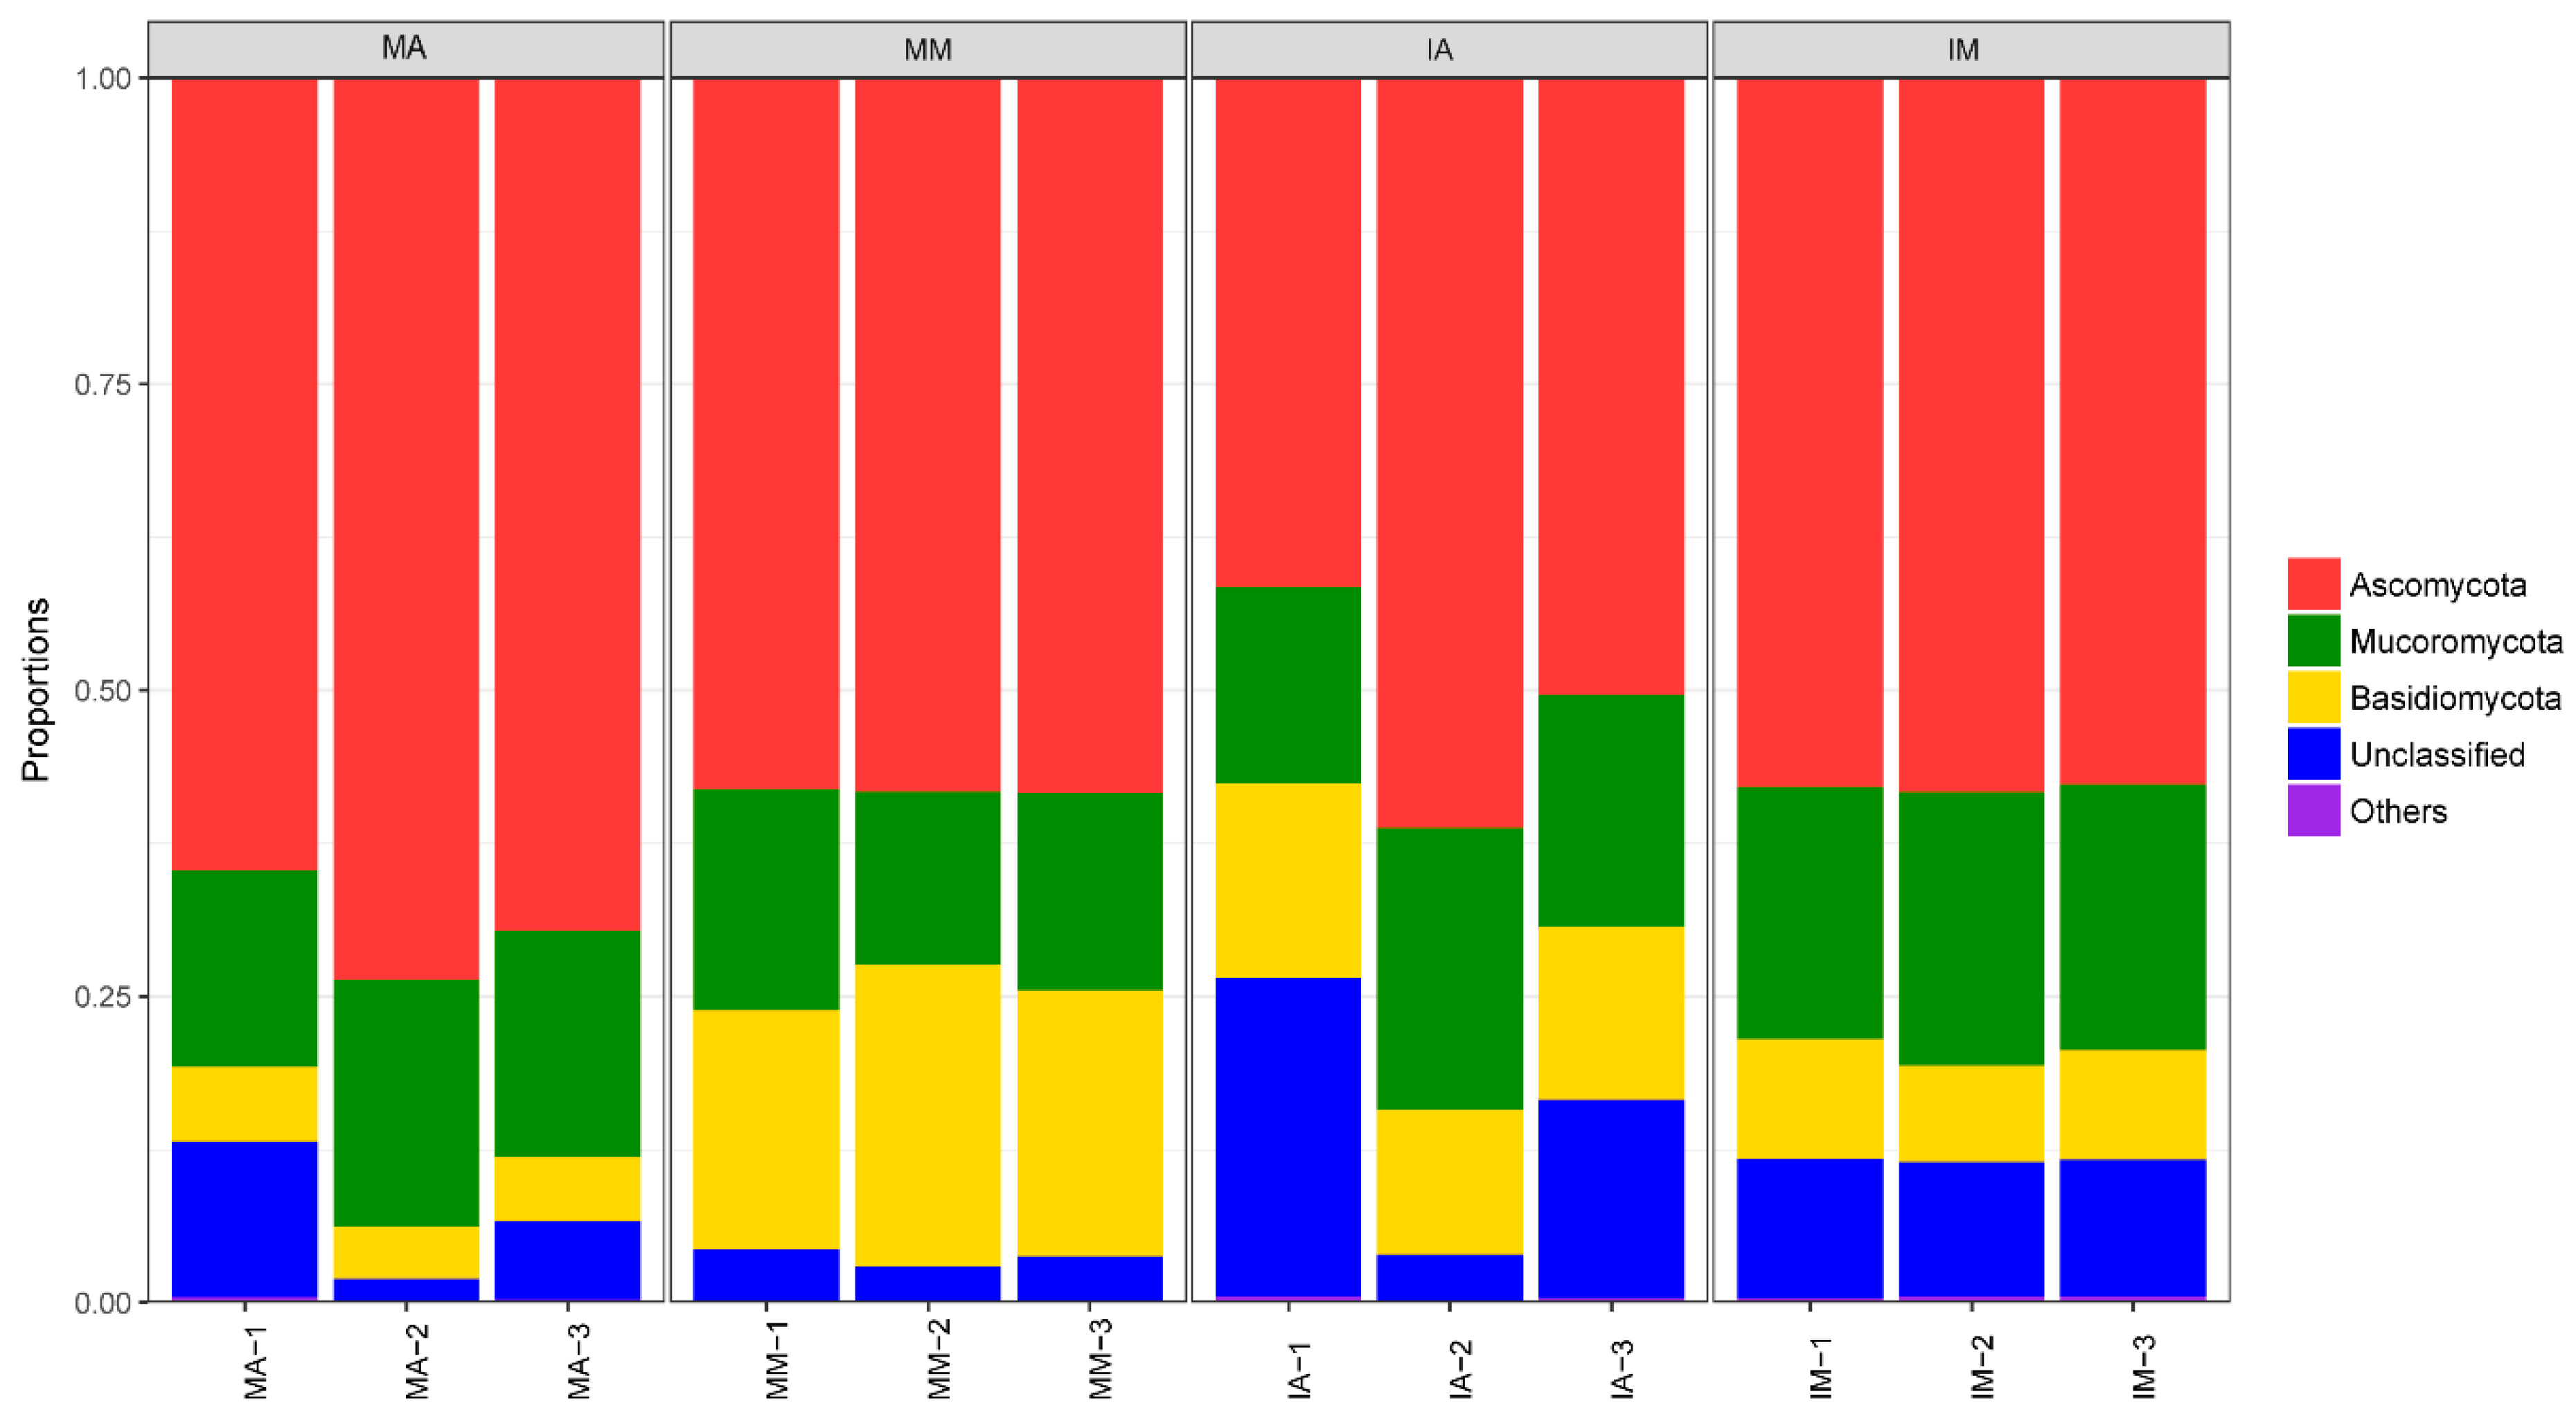
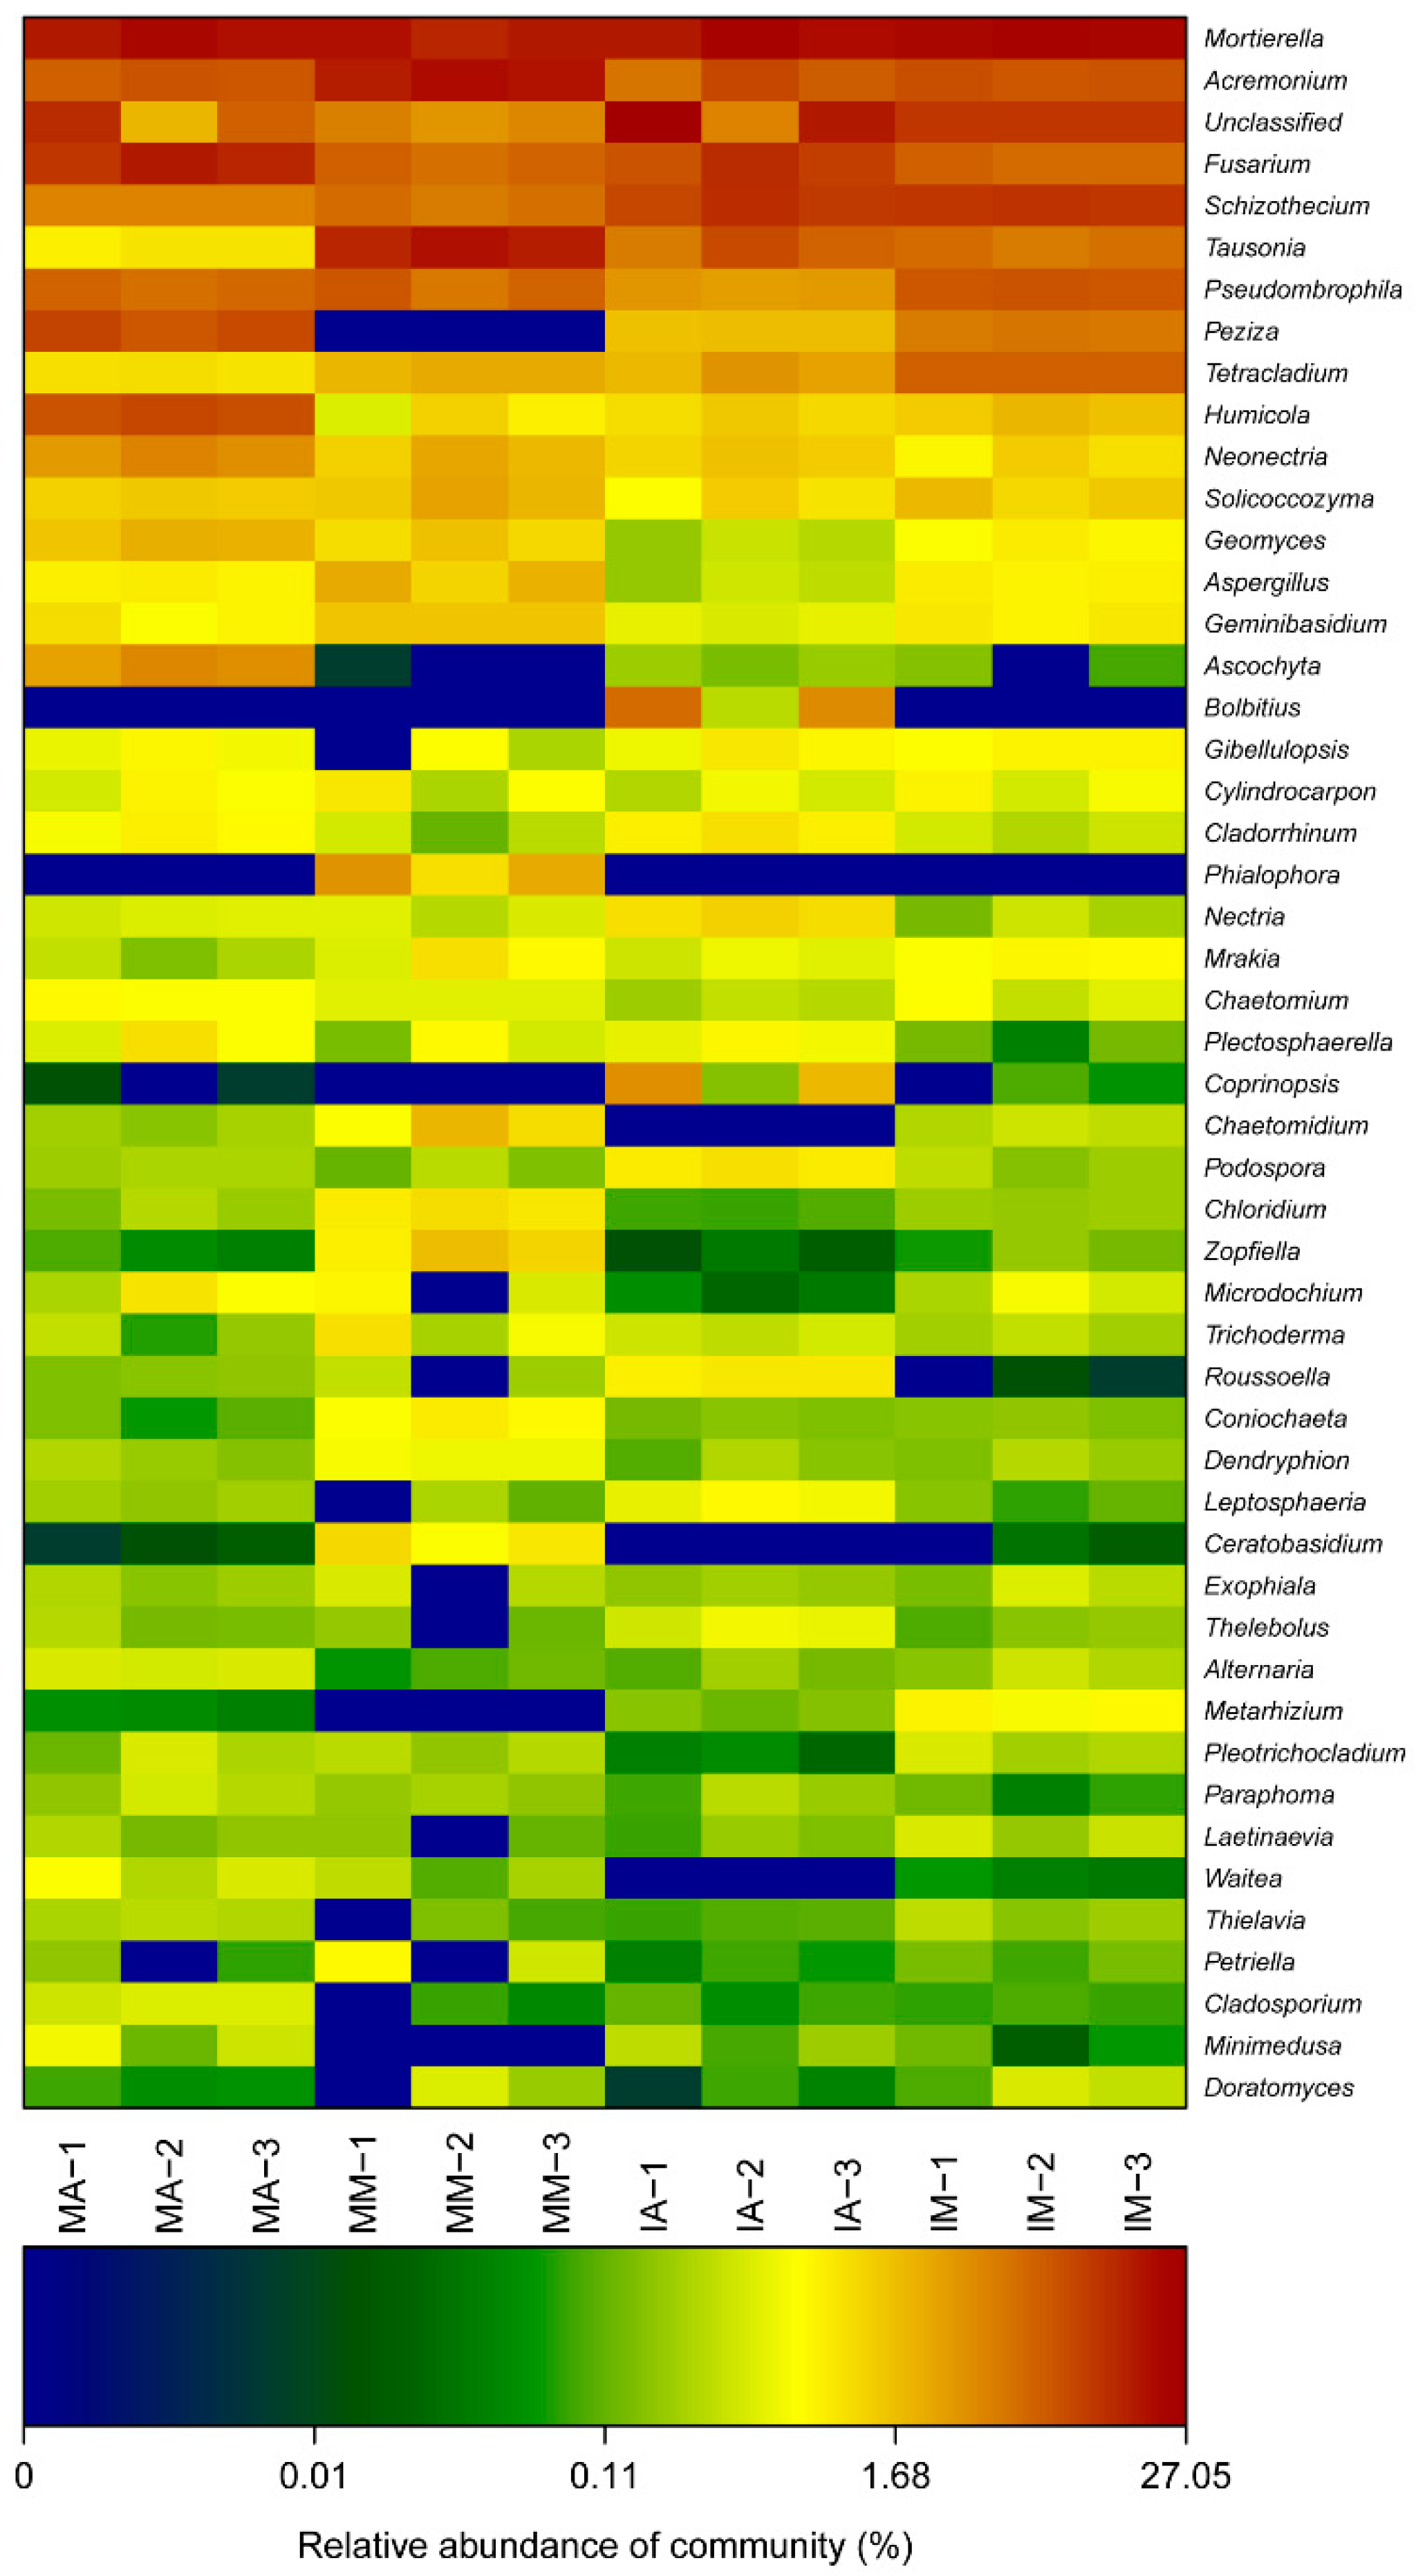
2.4. Taxonomic Structure of Fungal Communities among Different Treatments

All valid sequences from the soil sample libraries were classified from phylum to species based on the Unite Blast database. The results showed differences in fungal community abundance at different phylogenetic levels (Tables S1–S3).
At the phylum level, a total of seven phyla were identified in all the soil samples. The four dominant phyla were Ascomycota (59.92%), Mucoromycota (18.81%), Basidiomycota (12.32%), and unclassified fungi (8.67%); they accounted for 99.82% of the total relative abundance (Figure 1, left). Other sequences belonged to Blastocladiomycota, Chytridiomycota, and Zoopagomycota, which were always found in very low proportions (<2%). The primary fungi (Ascomycota) mainly consisted of Sordariomycetes, Pezizomycetes, Dothideomycetes, Leotiomycetes, and Eurotiomycetes (Figure 1, right).
Comparative analysis of monoculture and intercropped treatments revealed a distinct distribution of the fungal phyla (Figure 2). In the dominant phyla, the relative abundances of Mucoromycota, Basidiomycota, and Zoopagomycota were significantly different among the different planting patterns (Figure S3). For mulberry rhizosphere soil, the relative abundances of Mucoromycota and Zoopagomycota presented as being significantly higher in the intercropped treatments (p < 0.05), whereas Basidiomycota showed higher relative abundance in the monoculture treatments than in the intercropped treatments (p < 0.05).
For the alfalfa rhizosphere soil, Basidiomycota showed higher relative abundance only in the intercropped treatments than in the monoculture treatments (p < 0.05), whereas the differences of other fungal phyla were not significant among the different treatments (p > 0.05).
At the class level, the structure of the fungal community also differed between treatments (Figure 3 and Table S2). For the mulberry rhizosphere soil, Ascomycota_norank (Ascomycota), Zoopagomycota_norank (Zoopagomycota), Unclassified fungi, Glomeromycetes (Glomeromycota), Pezizomycetes (Ascomycota), and Mucoromycota (Mucoromycota) showed higher relative abundances in the intercropped treatments than in the monoculture treatments (p < 0.05), whereas Geminibasidiomycetes (Basidiomycota), Tremellomycetes (Basidiomycota), Leotiomycetes (Ascomycota), and Sordariomycetes (Ascomycota) showed higher relative abundances in the monoculture treatments than in the intercropped treatments (p < 0.05). In the alfalfa rhizosphere soil, Leotiomycetes (Ascomycota), Pezizomycetes (Ascomycota), Eurotiomycetes (Ascomycota), Cystobasidiomycetes (Basidiomycota), and Dothideomycetes (Ascomycota) presented marked advantages in the monoculture treatments (p < 0.05). In the intercropping system, the differences among the other classes were not significant (p > 0.05).

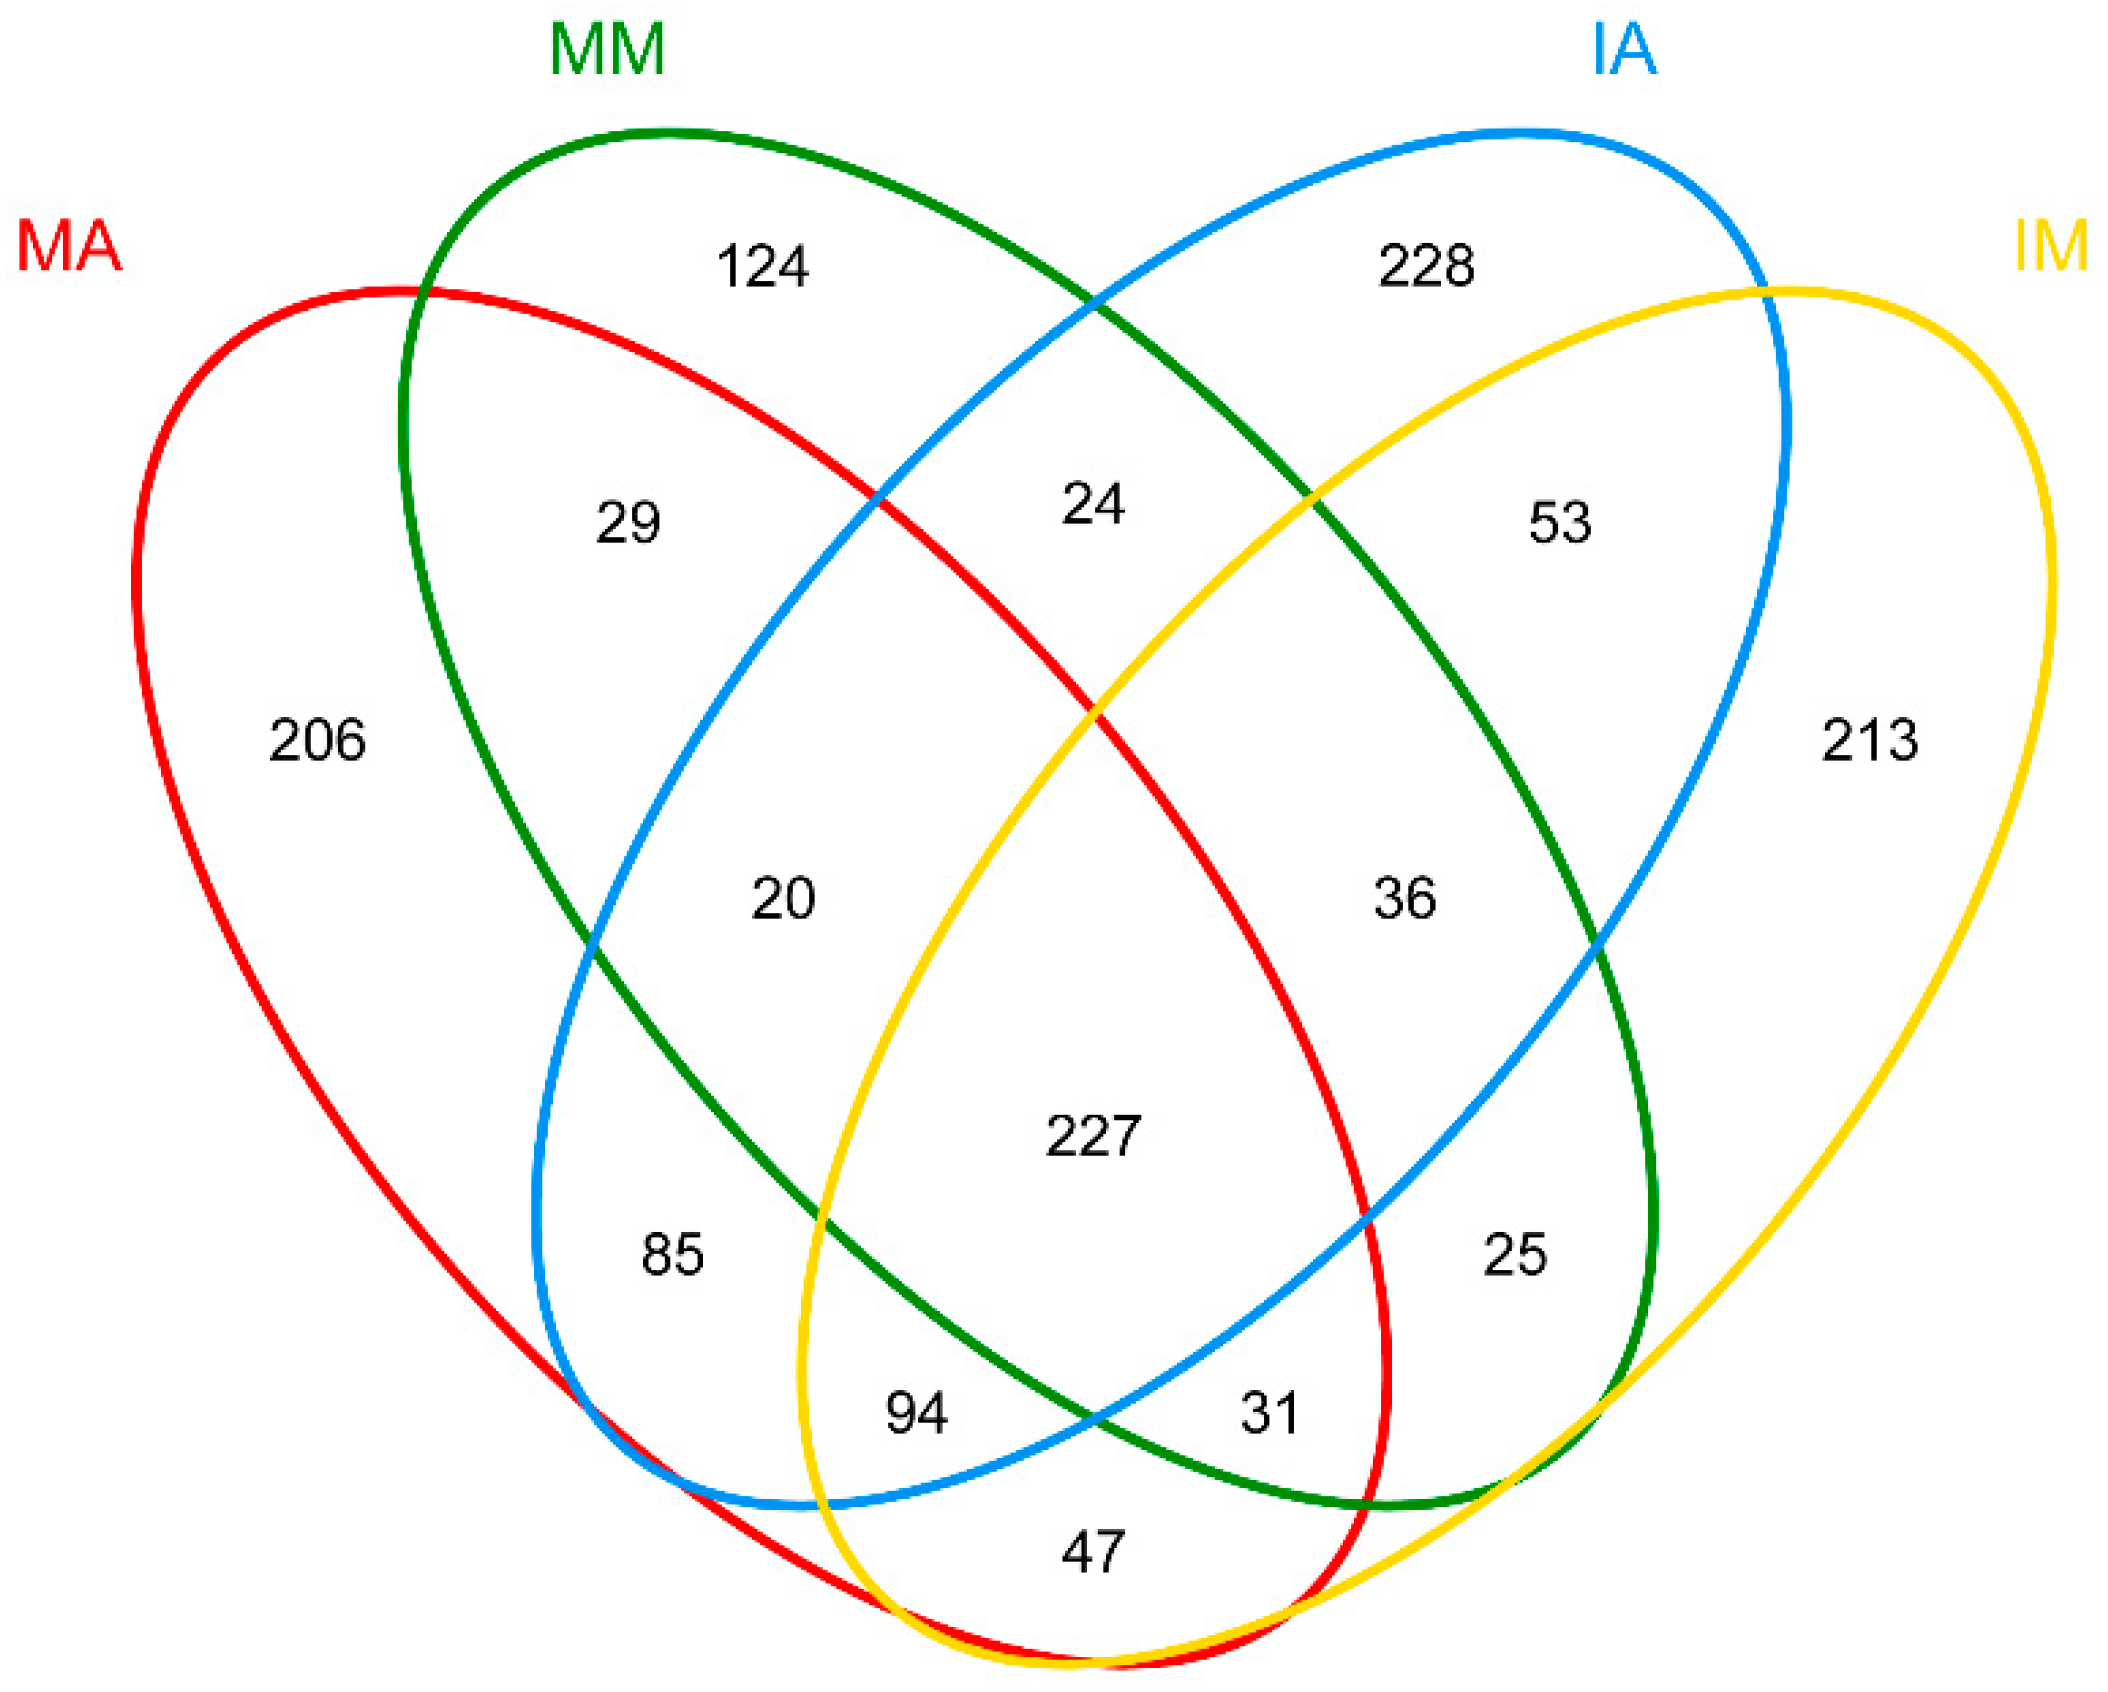
2.5. Shared Fungal OTUs

The number and differences in OTUs from the soil samples are shown in a Venn diagram (Figure 4). A total of 227 OTUs were common among all soil samples. Moreover, the differences in OTUs demonstrated that each plant rhizosphere had its own fungal population. The number of sequences for each OTU was used to determine the dissimilarity between samples (Figure S4). The IM groups were distinguished from MM, and IA was also distinguished from the MA group, suggesting the clear distinction of the microbial community structure between monoculture and intercropped groups. This conclusion was also supported by the dissimilarity matrix with the Bray-Curtis distance (Figure S2).
Hierarchically clustered heatmap analysis, based on the microbial community profiles at the genus level, was used to identify the different structures of these twelve fungal communities (Figure 5). A comparison of the relative abundances at the genus level revealed significant differences in the composition of fungal communities between monoculture and intercropped systems. Mortierella, Schizothecium, Fusarium, Acremonium, Tausonia, and Pseudombrophila were the most abundant genera across all soil samples, representing 20.43%, 11.06%, 8.08%, 7.30%, 5.80%, and 5.16% of all classified sequences in intercropped soils and 17.09%, 4.46%, 9.73%, 12.26%, 8.56%, and 5.86%, respectively, in monoculture soils. The results indicated that these genera might be indigenous. Relative abundances of the dominant genera varied significantly between monoculture and intercropped soils. Mortierella (21.77%), Schizothecium (11.25%), Pseudombrophila (7.45%), Tetracladium (6.52%), Fusarium (5.94%), Peziza (4.66%), and Humicola (1.70%) showed higher relative abundances in the mulberry intercropped soil than in the corresponding monoculture soil, whereas Acremonium (17.53%), Tausonia (16.17%), Phialophora (2.18%), Solicoccozyma (2.09%), Neonectria (1.88%) and Aspergillus (1.83%) showed the opposite trend. Mortierella (19.59%), Schizothecium (10.86%), Tausonia (6.52%), Bolbitius (2.89), Tetracladium (2.56%), Humicola (1.32%), and Nectria (1.19%) were present in higher proportions in the alfalfa intercropped soil than in the corresponding monoculture soil.

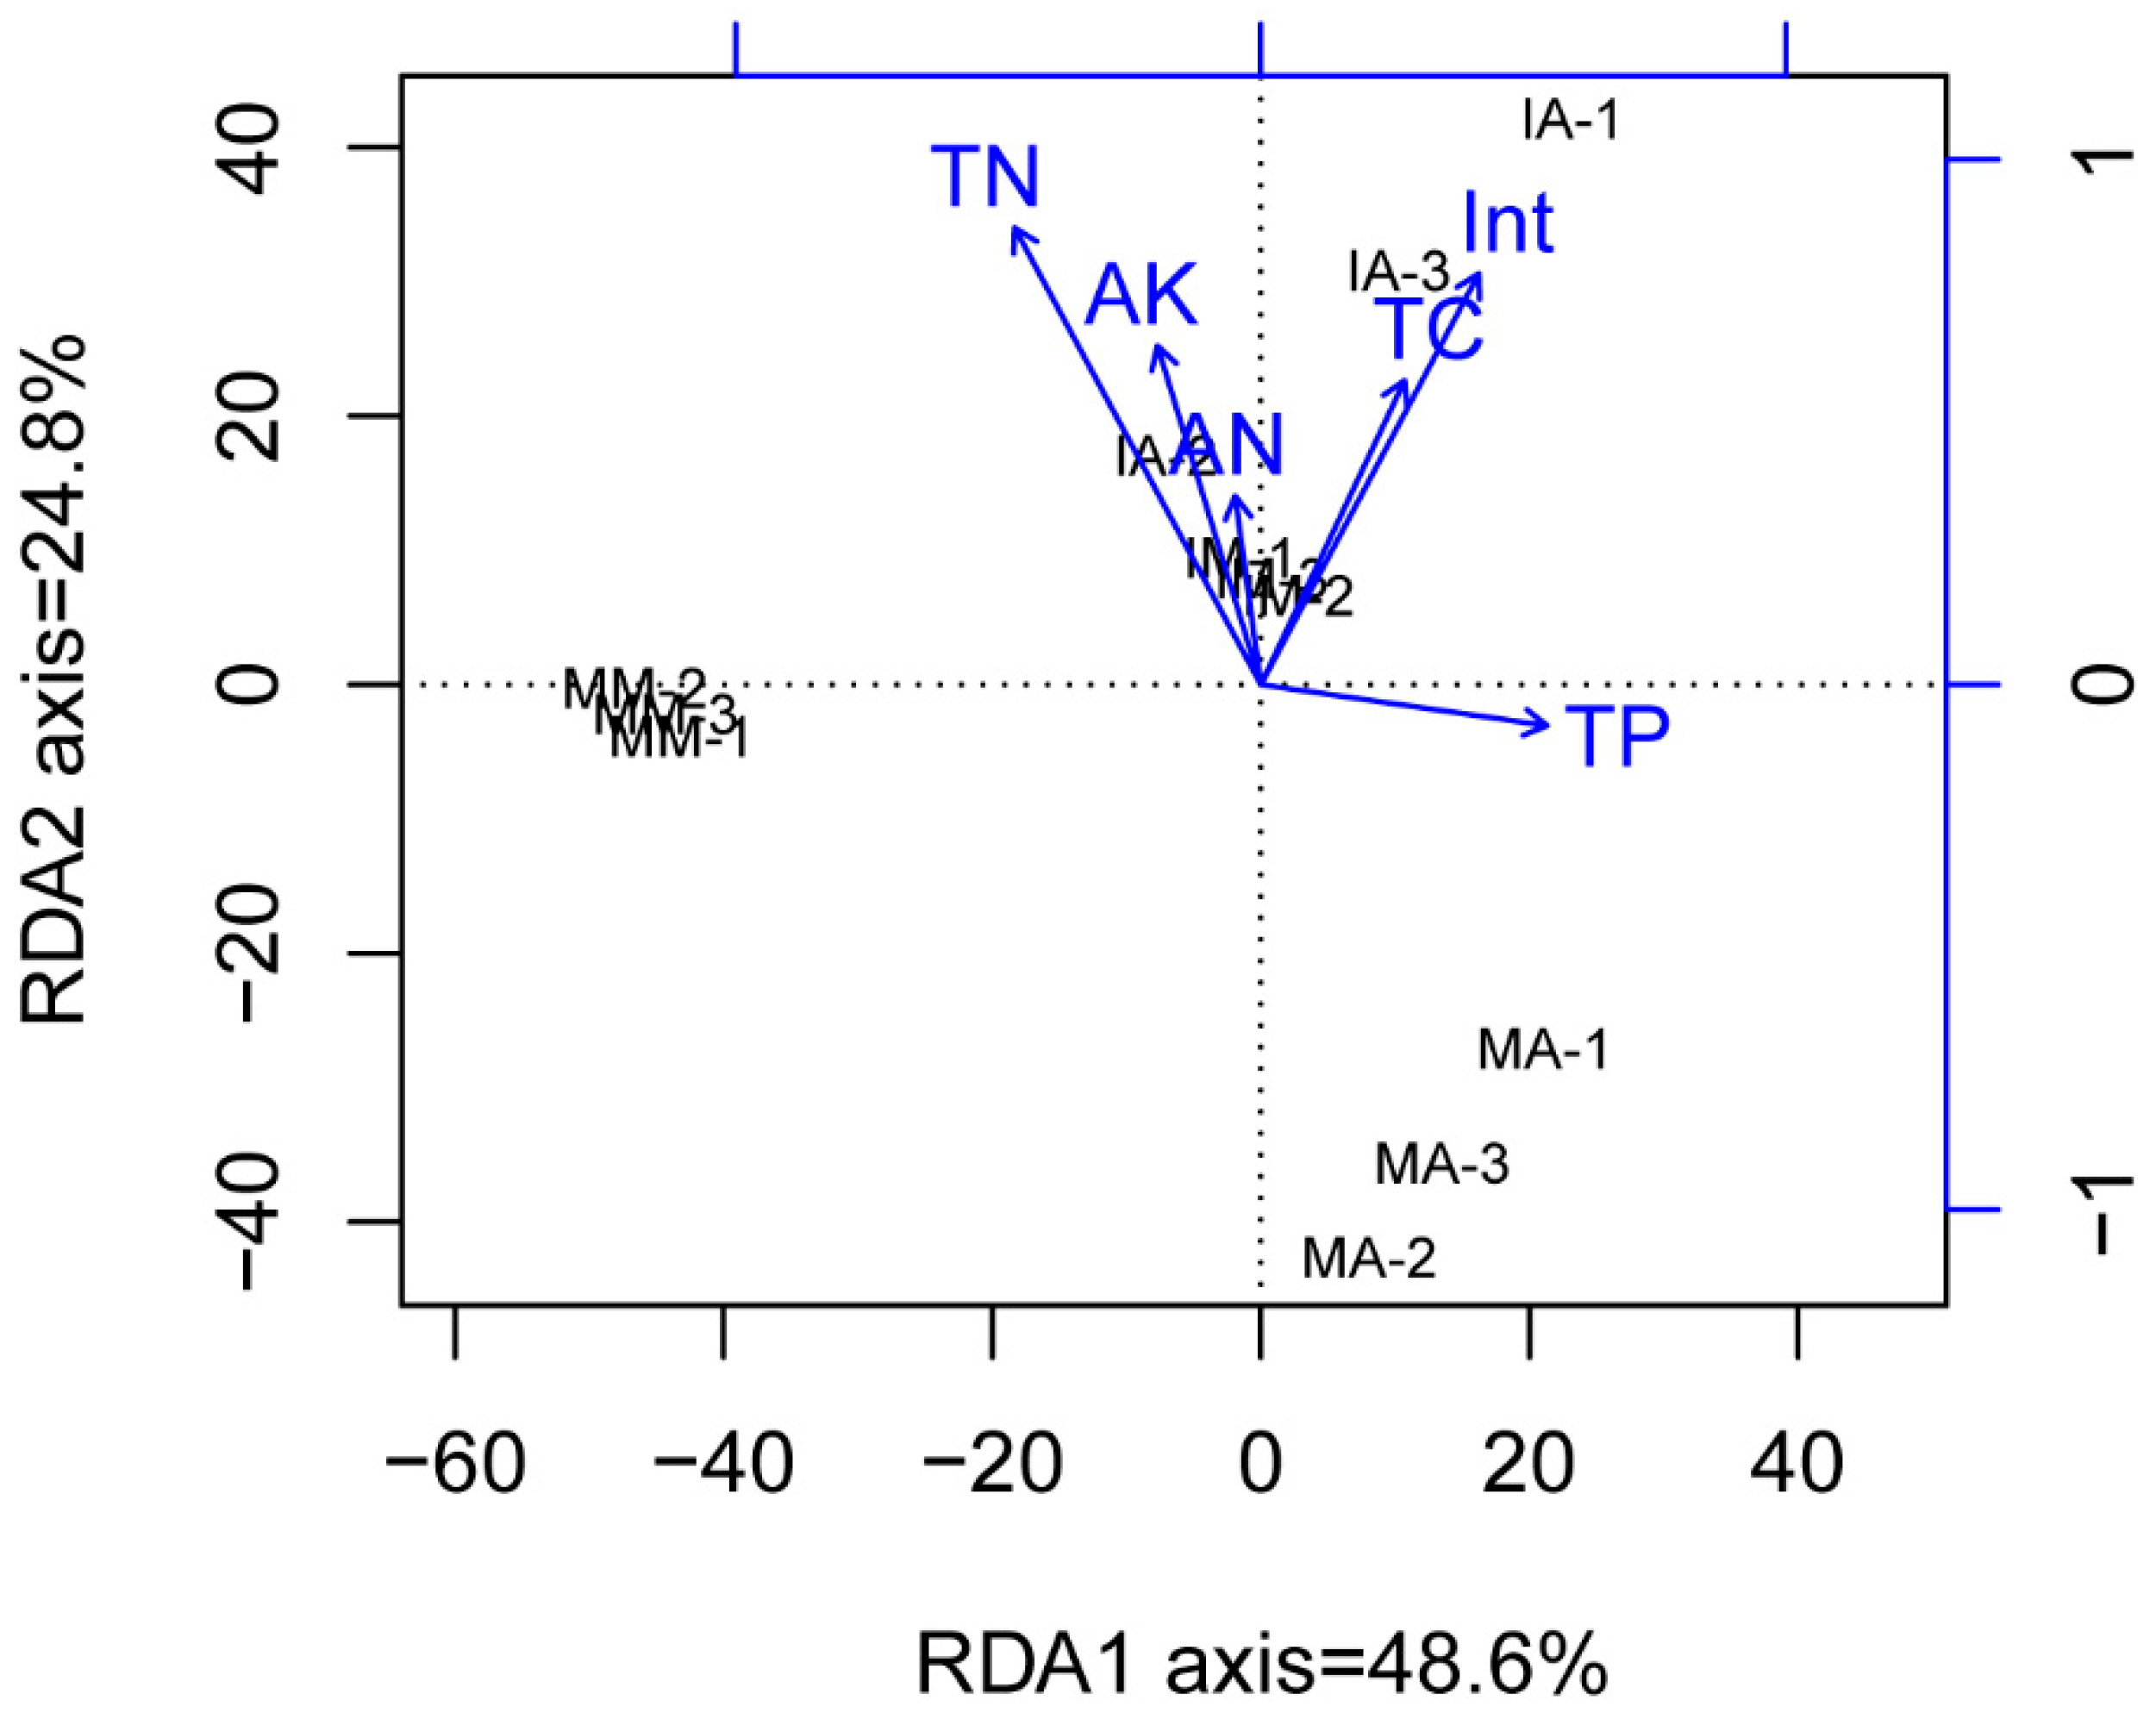
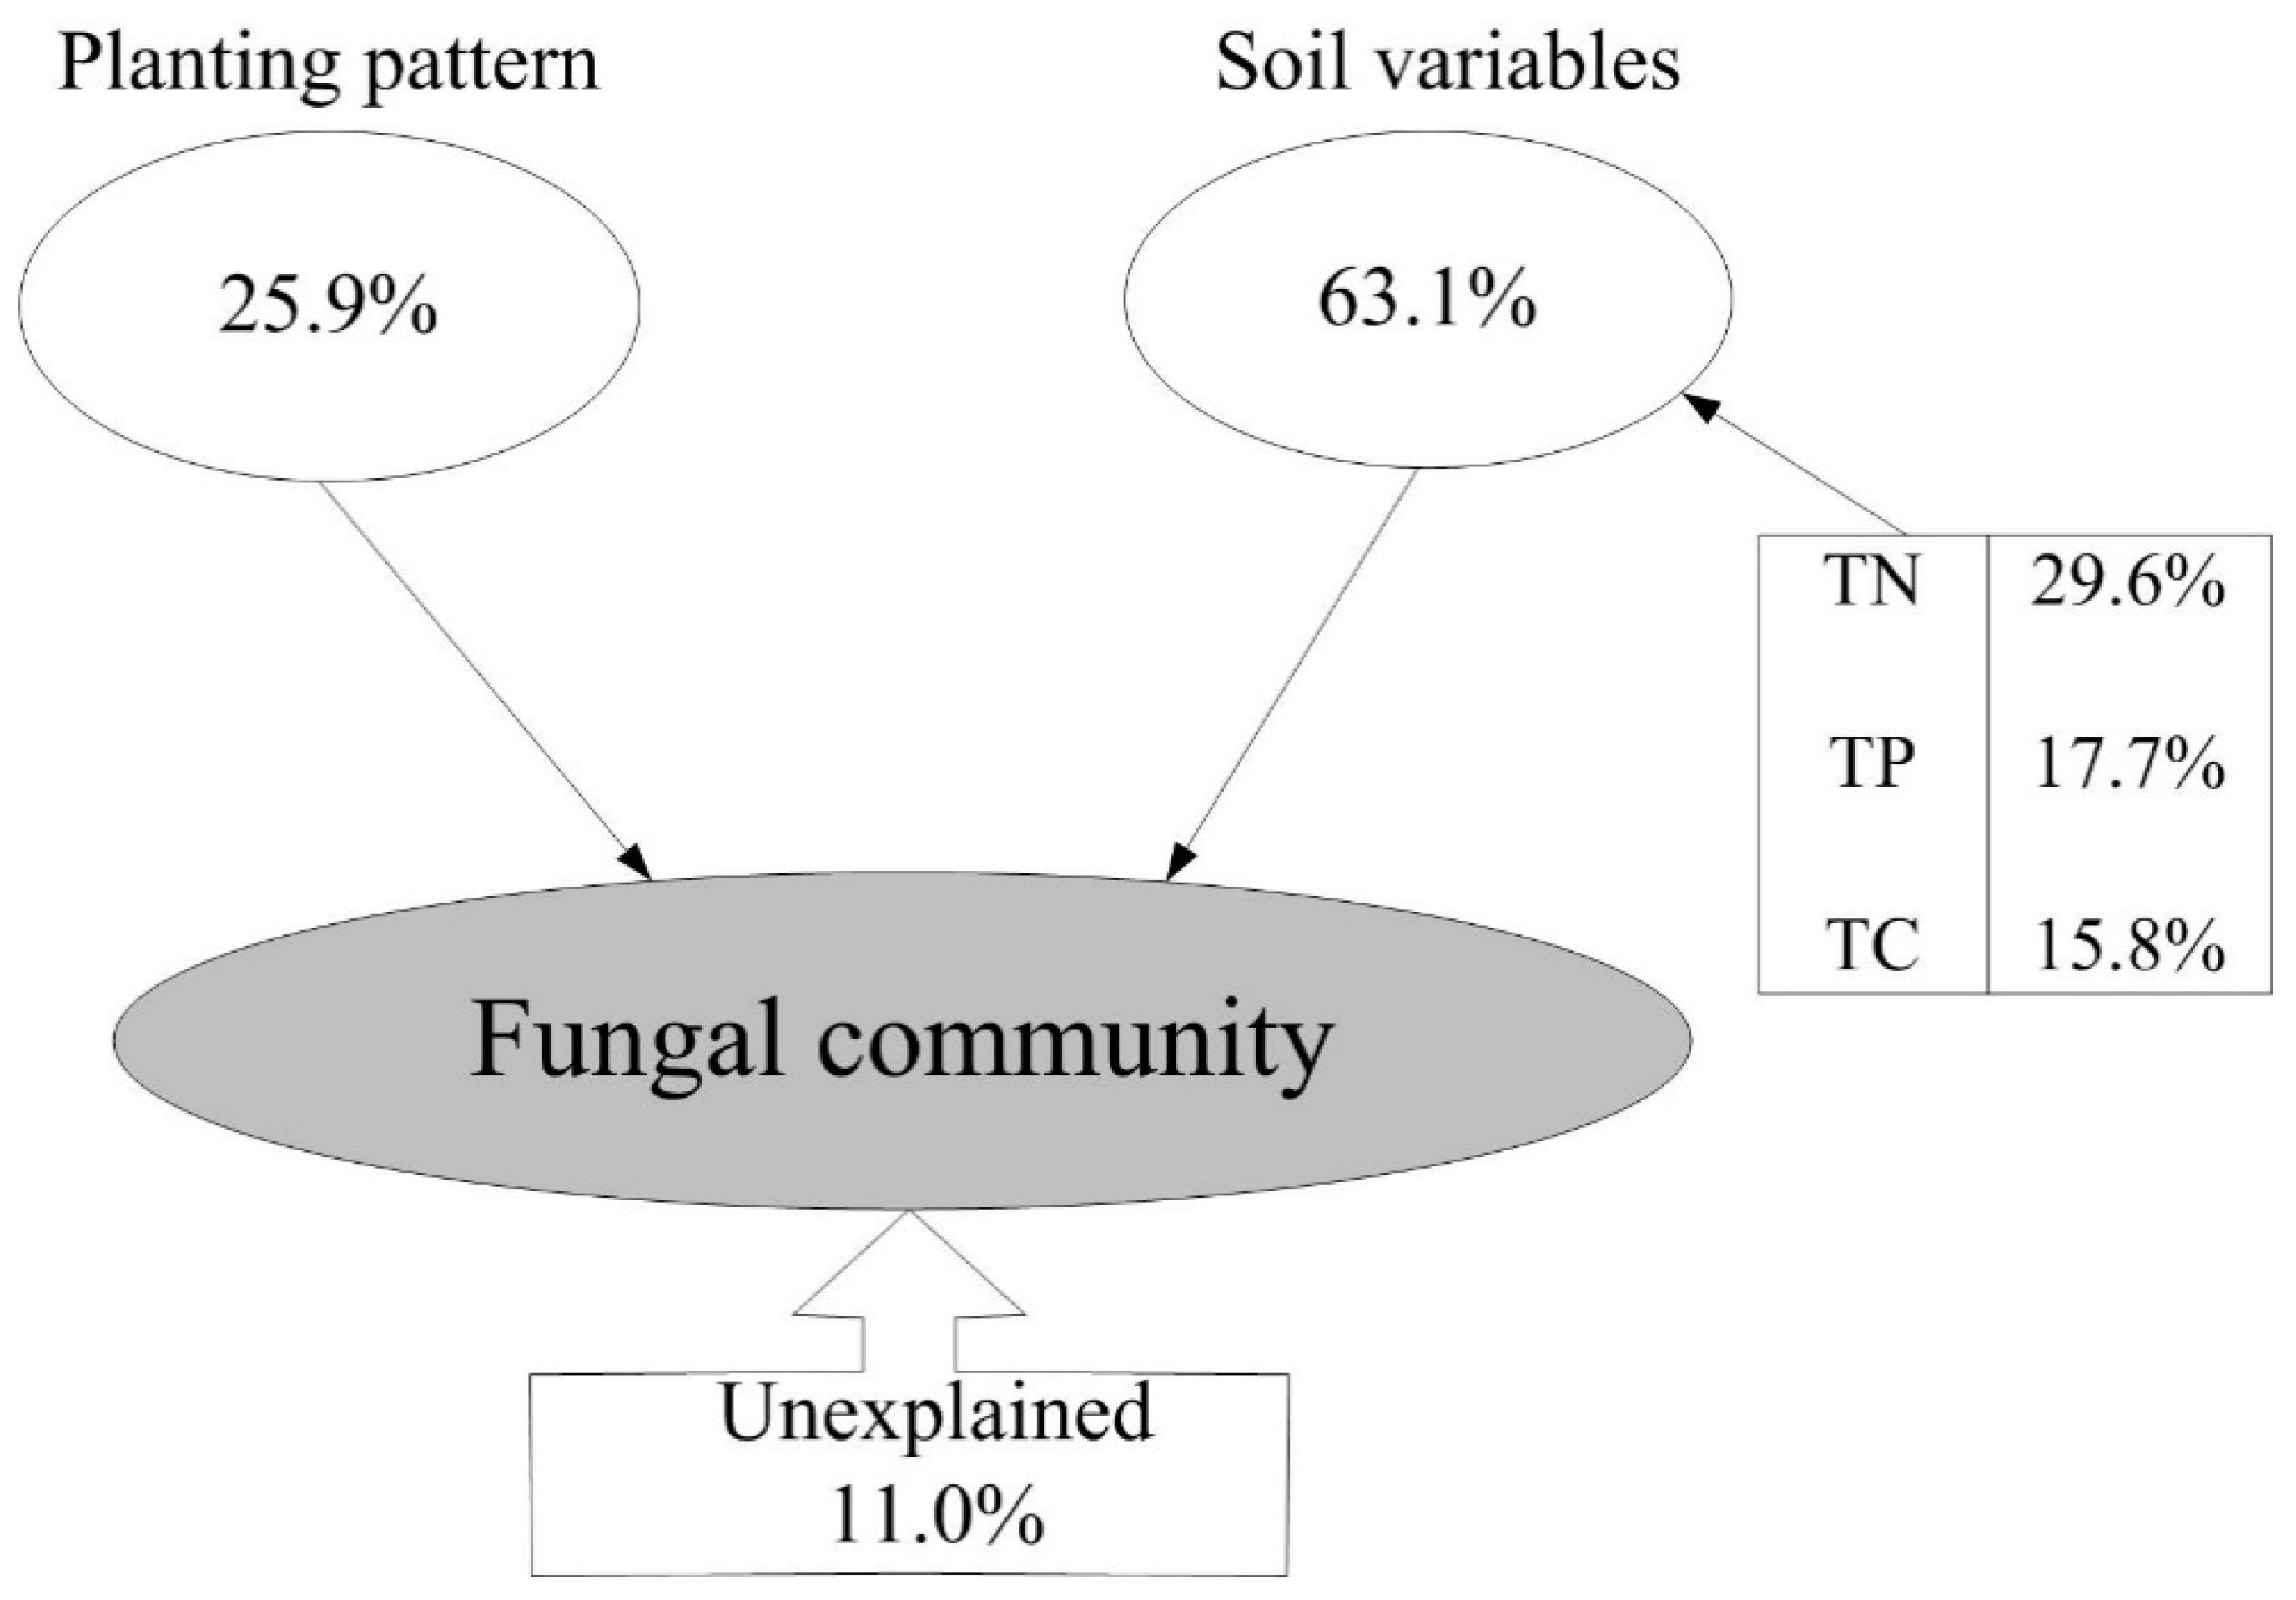
2.6. Relationship of the Soil Physicochemical Properties, Fungal Phyla, and Fungal Communities

Soil TN, TP, and AK were closely correlated with the relative abundances of seven fungal phyla (Table 3). The relative abundances of Blastocladiomycota (r = −0.660, p = 0.019), Mucoromycota (r = −0.656, p = 0.021) and Zoopagomycota (r = −0.925, p < 0.001) were significantly negatively correlated with soil TN. The relative abundance of Mucoromycota (r = 0.599, p = 0.040) had a marked correlation with TP. The relative abundances of Ascomycota (r = −0.726, p = 0.008), Basidiomycota (r = −0.588, p = 0.044) and Zoopagomycota (r = 0.660, p = 0.019) exhibited a highly significant correlation with AK. Additionally, the soil AN and TC had no significant correlation with the abundances of all the fungal phyla. To investigate the relationships between soil fungal community structure and soil physicochemical properties, the OTUs from all soil samples were analyzed using redundancy analysis (RDA) (Figure 6). Overall, the two RDA axes explained 73.3% of the variation of structure among the different communities.
A subset of soil environmental parameters of TN, TP, and TC was selected by the BioEnv procedure (Figure 7). The combination of the selected soil physicochemical properties and planting pattern showed a maximum (r = 0.528) correlation with the fungal community structure in all the different combinations. These parameters explained 89.0% of the variation of the fungal community structure, leaving 11.0% of variation unexplained. The planting pattern explained 25.9% of the fungal community structure variation. Among the selected soil parameters, TN, TP, and TC explained 29.6%, 17.7%, and 15.8%, respectively, of the fungal community structure variation.

3. Discussion

3.1. Soil Physicochemical Properties

Soil microorganisms are the principal drivers of soil nutrient cycling processes [23]. Mycorrhizal fungi serve as conduits from the soil to plant roots, transferring water [24,25] and inorganic and organic nutrients to the host plant using a network of extra radical hyphae [26]. In alfalfa rhizosphere soils, the intercropped treatment significantly increased TN, TC, and AK. Tracing the 15N isotope transfer, previous study suggested that arbuscular mycorrhizal fungi (AMF) could improve the efficiency of the biological N fixation of legume plants [27]. However, we found no significant difference in the richness of AMFs (Mucoromycota) in the intercropped alfalfa soil. The richness of Basidiomycota and Ascomycota showed opposite trends in the intercropped treatments. Some reports have shown that EM and ericoid mycorrhizas (Ascomycota and Basidiomycota) are able to use organic N sources [28]. The decreasing richness of Ascomycota could be a reason for the increasing TN content in the intercropped alfalfa soil. Another factor may be the nutrients released by agroforestry trees to meet crop demands [29]. The amounts of TN and AK in intercropped mulberry soil were significantly lower than those in the monoculture mulberry soil. Many plant species form symbiotic relationships with mycorrhizal fungi to augment nutrient uptake from soil [30,31,32]. In addition, soil physicochemical properties could also be affected by aboveground vegetation types, which cause a change in litter composition (both above- and below-ground) and/or microbial community structure. Therefore, the significant decrease in the contents of TN and AK might be attributed to sufficient utilization of soil nutrients by intercropped mulberry with the help of the increased richness of Mucoromycota and Zoopagomycota. The changes in yield can partly reflect the nutrient uptake of plants. Based on our results, intercropping significantly increased the yields of mulberry and alfalfa (Table S4). These results indicated that intercropping increased the yields of mulberry and alfalfa through different methods. Intercropping increased mycorrhizal formation, which in turn improved N and K acquisition in mulberry soil; however, the nutrients released by intercropped mulberry appeared to meet the demands of alfalfa growth.

3.2. Fungal Community Diversity and Structure in the Intercropping System

We assessed fungal community diversity and structure between monoculture and intercropped soils. The richness index Chao 1 revealed a richer fungal community in intercropped mulberry soils. In addition, the Shannon index and Simpson index of the soil fungal community in the intercropped mulberry system were higher than in the monoculture mulberry system (Table 2). Beta diversity analysis also showed that the dissimilarity of fungal communities between mulberry and alfalfa rhizosphere soils decreased as a result of intercropping (Figure S2). These observations are supported by the following studies. Agroforestry systems may support a more abundant and diverse AM fungal community compared to conventional monoculture [7,14]. Tree-based intercropping system presented a more heterogeneous vegetation cover and rooting pattern, which increased the diversity of soil microbial communities [15]. Therefore, effects of plant species and intercropping on the richness and diversity of the soil fungal community were observed. Intercropping improved the fungal community richness and diversity of mulberry.
In this study, the dominant taxonomic groups were Ascomycota, Mucoromycota and Basidiomycota (Figure 1, left). They have been depicted as major fungal phyla [33,34,35]. The Ascomycota group mainly included Sordariomycetes, Pezizomycetes, Dothideomycetes, Leotiomycetes, and Eurotiomycetes (Figure 1, right). The benefit of tree-based intercropping systems is a comprehensive result of the positive and negative interactions between the tree and crop components [36]. The fungal community structures in intercropped treatments differed in mulberry and alfalfa rhizosphere soils (Figure 2).
The relative abundance of Glomeromycetes was significantly higher in the intercropped mulberry soil than in the monoculture mulberry soil (Figure 3A and Table S2). AM fungi with the majority of plants, is one of the most ubiquitous terrestrial symbioses [37,38]. AM fungi are able to penetrate the cells of the host plant with their fungal structures (arbuscules, vesicles, hyphae). Our results indicate that the mulberry/alfalfa intercropping system had a positive effect on the relative abundance of AM fungi (Mucoromycota) in the intercropped mulberry soil. Some studies have found that tree and legume plant intercropping systems improved the richness of soil microorganisms [14,15,27]. The positive effect seems to result from increased plant diversity; intercropping supports a higher number of possible host–fungal pairings, and there is increased density of plant roots available for colonization [39]. However, the mulberry/alfalfa intercropping system had the opposite influence on AM fungi in the intercropped alfalfa soil. The relative abundance of Glomeromycetes was higher in the monoculture alfalfa soil than in the intercropped alfalfa soil (Figure 3B and Table S2). Leal [40] reported a similar result and found that agroforestry sites had considerably lower AM fungal abundance than samples collected from pastures and cropped land.
Ascomycota, Basidiomycota, and Mucoromycota are known as major phyla in the Kingdom Fungi. The phylum Ascomycota is the largest phylum. The saprotrophic capabilities of Ascomycetes range from the breakdown of simple sugars to degradation of the lignocellulose complex [41]. The phylum Basidiomycota is the second largest phylum, known as white-rot fungi, which have the ability to restrict mainly the decomposition of lignin (a heterologous aromatic polymer) [42]. Mucoromycota comprise Glomeromycotina, Mortierellomycotina and Mucoromycotina. Mucoromycota is a more derived clade of Zygomycetes and mainly consists of mycorrhizal fungi, root endophytes, and decomposers of plant material, which are important for soils [43]. With respect to mulberry, the relative abundances of Mucoromycota and Chytridiomycota were significantly higher in the intercropped soil than in the monoculture soil, whereas the relative abundance of Ascomycota and Basidiomycota showed the opposite pattern. The relative abundance of Basidiomycota was significantly higher, whereas the relative abundances of Ascomycota and Zoopagomycota were lower in the intercropped soil of alfalfa than in the monoculture soil of alfalfa (Figure 2 and Table S1). Soil fungi utilize carbon sources provided by plant litter and root exudates; hence, changes in plant-derived organic matter can affect soil fungal communities [1,2]. The results indicate that both the planting pattern and plant species changed the structure of the dominant fungal phyla.

3.3. Correlation between Soil Physicochemical Properties and the Dominant Fungal Phyla

Not only has soil fungi an essential impact on biogeochemical cycling [44,45], but changes in soil nutrient status affect the fungal community structure closely [46]. To investigate the relationships between the soil fungal community structure of different samples and the measured soil physicochemical properties, the fungal phyla and OTU data were analyzed using Pearson’s correlation and RDA, respectively (Table 3 and Figure 6). TN had a significant negative correlation with the relative abundance of Mucoromycota (r = −0.656, p = 0.000), which is in accordance with previous studies reporting that AMF could improve the efficiency of utilization of nitrogen and total plant yield [27]. AK had a negative correlation with the relative abundance of Ascomycota and a positive correlation with the relative abundance of Basidiomycota, in accordance with previous studies that found that Tuber melanosporum (Ascomycota, Pezizomycetes) showed a marked reduction in K+ concentration [47]. However, Rhizopogon sp. and S. granulatus (Basidiomycota, Agaricomycetes) could be considered important accumulators between soil and trees for K+ sequestration due to the strong mineral degradation capacities of these two ectomycorrhizal fungi [48,49]. Moreover, voltage-dependent K+-selective channels were found exclusively in Basidiomycota fungi, whereas they were absent in sequenced Ascomycota fungi [50]. Zoopagomycota fungi had a negative correlation with AK-like Ascomycota fungi and a negative correlation with TN. TN, AK, and TP had some positive and/or negative correlations with the fungal phyla, suggesting that these environmental variables affected the dominant fungal phyla.

3.4. Effects of Soil Properties and Planting Pattern on the Fungal Community Structure

RDA results indicate the distinctions in the fungal community structure between the mulberry and alfalfa groups. Intercropped samples (IM and IA) were clustered together and were well separated from monoculture samples (MM and MA), whereas there was a distinction between monoculture and intercropped samples, and monoculture mulberry samples were separated from monoculture alfalfa samples. The results suggested that plant species affected the fungal communities in the soil used to support those plants, while the planting pattern had a greater effect on the fungal community structure. The influences of soil physicochemical properties in the RDA bioplot are indicated by arrows, of which the lengths are proportional to their importance [51]. TN and TP had the longest arrows, indicating that they were the most important in affecting the fungal community, followed by the planting pattern, and then TC, AK, and AN.
Variance partitioning analysis (VPA) quantifies the effects of two or more groups of environmental variables representing some distinct, ecologically interpretable phenomena [52]. VPA clearly demonstrated that the planting pattern and soil physicochemical properties impacted the soil fungal community structure (Figure 7). The basic factors of soil characteristics (63.1%) were more significant than the operational factor of the planting pattern in determining the distribution of the soil fungal communities, in addition to the planting pattern (25.9%) which was also crucial.

4. Materials and Methods

4.1. Site Description and Soil Sampling

In 2011, an experimental field was established by the Institute of Crops, Heilongjiang Academy of Land Reclamation and Agricultural Sciences in Jiamusi City, Heilongjiang Province (46°46′ N, 130°27′ E), P.R. China. The treatments were (1) monoculture mulberry (MM), (2) intercropped mulberry (IM), (3) monoculture alfalfa (MA), and (4) intercropped alfalfa (IA). The soil is a meadow soil with the following characteristics: organic nitrogen 0.58 g·kg−1, available phosphorus 128.2 mg·kg−1, available potassium 106 mg·kg−1, and pH 6.8. The field site had been previously used for monoculture alfalfa. The samples for the study described here were collected in 2013, i.e., the third year after establishment. The same soil preparations, row spacing, fertilization, and harvesting procedures were used for three years. Three plots (replications) of 5 m × 7.26 m were set up for each treatment and were randomly distributed in the field. All treatments received farmyard manure at an application dose of 30,000 kg·ha−1 and ammonium phosphate of 150 kg·ha−1. The manure was applied by a common fertilization machine (Plot seed TC from WINTERSTEIGER, AG, Ried im Innkreis, Austria). The field management was carried out according to routine management practices [53].
The cultivars used were Morus alba ‘Qinglong’ and Medicago sativa ‘Zhaodong’. Mulberry saplings with a height of 30 cm were cultivated in mid-April (0.67 m inter-plant distance and 11 plants per row), and alfalfa seeds were sown in early April 2012 (the seeding amount was 22.5 kg·ha−1). In the intercropping system, two rows of mulberry trees and two rows of alfalfa (0.66 m inter-row distance) were intercropped, with a total of 12 rows in each plot. The inter-row spacing for monoculture was the same as that for intercropping.
The mulberry and alfalfa rhizosphere soils were randomly sampled using a five-point sampling method in each plot of the monoculture systems, and from the central rows in each plot of the intercropping systems, by uplifting intact roots on 16 August 2013 (by which time alfalfa had generally reached the early flowering stage). After shaking off the loosely adhered soil, the soil tightly adhering to the root surface was brushed off and collected as the rhizosphere soil samples [54]. The rhizosphere soils obtained from 5 plants in each plot were mixed and transported immediately to the laboratory. Each of the soil samples was sieved (<2 mm) and then divided into two aliquots in sealed bags: one aliquot was stored at −80 °C (for DNA extraction) and the other aliquot was stored at 4 °C (for determination of soil physicochemical properties).
Total nitrogen (TN) was determined using a Kjeldahl apparatus (BUCHI Ltd., Flawil, Switzerland) after digestion with concentrated H2SO4. Total carbon was examined using a Total Organic Carbon analyzer (TOC, Vario TOC cube, Elementar, Langenselbold, Germany). Total phosphorus (TP), alkaline hydrolysable nitrogen (AHN), and available potassium (AK) were measured as reported previously [55,56].

4.2. Soil DNA Extraction, PCR Amplification and MiSeq Sequencing

Sample DNA was extracted using a PowerSoil DNA Isolation Kit (MoBio Laboratories, West Carlsbad, CA, USA) according to the manufacturer’s protocol. The extracted DNA sample was quantified with 1% agarose gel electrophoresis. The internal transcribed spacer (ITS) region is known as a universal DNA barcode marker for fungi, with the most clearly defined barcode gap between inter- and intraspecific variation [57]. We selected the ITS1 region for PCR amplification and sequence using the sense primer ITSF1: CTTGGTCATTTAGAGGAAGTAA and the antisense primer ITS2-2043R: GCTGCGTTCTTCATCGATGC, with a unique barcode sequence at the 5′-end of each primer [58]. Polymerase chain reaction (29 cycles) was performed in a volume of 20 μL with 1 μL of soil DNA as the template. The PCR products from the same samples were pooled together and quantified by electrophoresis in 2% agarose gels and then recycled and purified with an AxyPrep DNA Purification Kit (AXYGEN Corporation, Union City, CA, USA), after which they were quantified by electrophoresis in 2% agarose gels and quantified with PicoGreen-Invitrogen by QuantiFluorTM-ST (Promega Corporation, Madison, WI, USA). A MiSeq library was constructed, followed by high-throughput sequencing.

4.3. Data Analysis

4.3.1. Sequence Optimization and Data Statistics/Processing the Sequencing Data

MiSeq sequencing was used to obtain the paired-end (PE) reads. According to the overlap relationship of PE reads, pairs of reads were merged to form a complete sequence. Then, the quality of reads and the effects of merging were quality controlled and filtered, and finally, valid sequences were obtained based on the barcodes of both ends of the sequences and different samples owned different primer sequences, the direction of which was revised [59,60].

4.3.2. OTU Cluster

Sequencing results of samples were defined as operational taxonomic units by bioinformation statistical analysis with a phylotype threshold of ≥97% sequence similarity. Bioinformation statistical analyses were performed by UPARSE software package using the UPARSE-OTU and UPARSE-OTU algorithms. The used software located in the Usearch platform (UPARSE, version 7.1, Edgar, R.C., http://drive5.com/uparse/, San Francisco, CA, USA) [60].
In an attempt to obtain species taxonomic information of each OTU, we picked a representative sequence for each OTU and used the RDP classifier to annotate taxonomic information for each representative sequence. RDP Classifier algorithm (version 2.2, http://sourceforge.net/projects/rdp-classifier/) [61].

4.3.3. Shannon-Wiener Curves, Alpha Diversity, and Beta Diversity

The trimmed sequences were randomly sampled, and Shannon-Wiener curves were established based on the extracted sequences and the relevant Shannon index (microbial diversity index).
Based on OTU (≥97% similarity) data, alpha diversity was used to reflect richness, and the diversity of the microbial community was assessed by calculating the richness estimator (The Chao1 estimator indicates community richness), the diversity indices (the Shannon index and Simpson index indicate community diversity, including richness and evenness) and the coverage, which shows the sequencing depth.
Beta diversity is based on the biological distance of different samples according to species. The types of biological distances include the Bray-Curtis distance, Euclidean distance, Abund-Jaccard distance etc. We used the Bray-Curtis distance.

4.3.4. Statistical and Bioinformatics Analysis

Significant differences between treatments were assessed by ANOVA using Duncan’s multiple range test. Data were subjected to two-way ANOVA using intercropping and crop type as sources of variable. All analyses were performed using SigmaPlot 11.0 (Systat Software Inc., San Jose, CA, USA), SPSS 19.0 (IBM Corp., Armonk, NY, USA) and Vegan Package in R 3.2.3 (Jari Oksanen. vegan: Community Ecology Package. https://CRAN.R-project.org/package=vegan).

5. Conclusions

In conclusion, intercropping improved the richness and diversity of the fungal communities in mulberry and modified the structure of the fungal community by changing the relative abundances of the dominant phyla and habitat. The increased relative abundances of beneficial fungi assisted in improving the sufficient utilization of soil nutrients to satisfy the growth demands of mulberry and alfalfa. Planting patterns and soil physicochemical properties conjointly resulted in the changes in the soil fungal community structure in proportion of 25.9% and 63.1%, respectively.

Supplementary Materials

The following are available online at https://www.mdpi.com/1999-4907/10/2/167/s1, Figure S1: Shannon-Wiener curves of the different treatments at a similarity level of 97%. All curves almost reached the saturated state, indicating the survey effort was large enough to capture the complete diversity of these communities as the curves leveled off with the increasing sample sizes. The description of abbreviation names is shown in Table 1. MM-1, MM-2 and MM-3 represent three repeats of MM, IM-1, IM-2 and IM-3 represent three repeats of IM, MA-1, MA-2 and MA-3 represent three repeats of MA, IA-1, IA-2 and IA-3 represent three repeats of IA. The same abbreviations appear below, Figure S2: The Dis-heatmap plot of fungal community structure in soils from different treatments. The plots based on the Bray-Curtis distance were calculated from relative OTU abundances. MM, IM, MA and IA represent monocultured mulberry, intercropped mulberry, monocultured alfalfa, intercropped alfalfa, respectively. MM-1, MM-2 and MM-3 represent three repeats of MM, IM-1, IM-2 and IM-3 represent three repeats of IM, MA-1, MA-2 and MA-3 represent three repeats of MA, and IA-1, IA-2 and IA-3 represent three repeats of IA. The same abbreviations appear below, Figure S3: STAMP analysis plots showing the differences fungal phyla in monoculture and intercropping mulberry soil (up) and that in monoculture and intercropping alfalfa soil (down). Welch’s t-test was applied to test for differences in fungal classed due to planting pattern. The p-values are also shown. Zoopagomycota and Mucoromycota presented marked advantages in intercropped mulberry (p < 0.05). Basidiomycota showed significantly higher relative abundances in intercropping alfalfa (p < 0.05), Figure S4: Cluster tree plot of fungal community structure in soils from different treatments. The plot showed dissimilarity based on Bray-Curtis distance among different soil samples. Notes: MM, IM, MA, IA represent monoculture mulberry, intercropped mulberry, monoculture alfalfa, and intercropped alfalfa, respectively. MM-1, MM-2 and MM-3 represent three repeats of MM, IM-1, IM-2 and IM-3 represent three repeats of IM, MA-1, MA-2 and MA-3 represent three repeats of MA, IA-1, IA-2 and IA-3 represent three repeats of IA, Table S1: Relative abundances of fungal phylum in the studied soils. Note: Values represent percentages of all sequences assigned to the fungi for soils. The description of sample name is shown in Table 1, Table S2: Relative abundances of fungal class in the studied soils. Note: Values represent percentages of all sequences assigned to the fungi for soils. The description of sample name is shown in Table 1, Table S3: Relative abundances of fungal genus in the studied soils. Note: Values represent percentages of all sequences assigned to the fungi for soils. The description of sample name is shown in Table 1, Table S4: The yields of mulberry and alfalfa in different treatments.

Author Contributions

Methodology, G.S.; Validation, M.Z., N.W. and Y.H.; Investigation, M.Z., J.Z. and D.C.; Resources, J.Z., D.C. and J.G.; Data Curation, M.Z.; Writing—Original Draft Preparation, M.Z.; Writing—Review and Editing—Z.M., Y.H. and G.S.; Supervision, G.S. and D.W.; Project Administration, G.S.

Funding

This research was funded by the National Natural Science Foundation of China, grant number 31500508, and the Natural Science Foundation of Heilongjiang Province, grant number ZD201105 and the Applicant and Developmental Project for Agriculture of Heilongjiang Province, grant number GZ13B004.

Acknowledgments

This work was supported by the National Natural Science Foundation of China (No. 31500508), the Natural Science Foundation of Heilongjiang Province (ZD201105) and the Applicant and Developmental Project for Agriculture of Heilongjiang Province (GZ13B004).

Conflicts of Interest

The authors have no conflicts of interests to declare.

Abbreviations

AMF: Arbuscular Mycorrhizal Fungi; Dis-heatmap, Distance heatmap; ITS1, Internal Transcribed Spacer 1; OTU, Operational Taxonomic Units; RDA, Redundancy Analysis; STAMP, Statistical Analysis of Metagenomic Profiles; VPA, Variance Partitioning Analysis.

References

  1. Meier, C.L.; Bowman, W.D. Links between plant litter chemistry, species diversity, and below-ground ecosystem function. Proc. Natl. Acad. Sci. USA 2008, 105, 19780–19785. [Google Scholar] [CrossRef] [Green Version]
  2. Wardle, D.A.; Bardgett, R.D.; Klironomos, J.N.; Setälä, H.; van der Putten, W.H.; Wall, D.H. Ecological linkages between aboveground and belowground biota. Science 2004, 304, 1629–1633. [Google Scholar] [CrossRef] [PubMed]
  3. Bais, H.P.; Park, S.-W.; Weir, T.L.; Callaway, R.M.; Vivanco, J.M. How plants communicate using the underground information superhighway. Trends Plant Sci. 2004, 9, 26–32. [Google Scholar] [CrossRef] [PubMed]
  4. Birouste, M.; Kazakou, E.; Blanchard, A.; Roumet, C. Plant traits and decomposition: Are the relationships for roots comparable to those for leaves? Ann. Bot. 2011, 109, 463–472. [Google Scholar] [CrossRef] [PubMed]
  5. Guo-Chun, D.; Piceno, Y.M.; Holger, H.; Nicole, W.; Dohrmann, A.B.; Angel, C.; Andersen, G.L.; Thelma, C.; Tebbe, C.C.; Kornelia, S. Changes of soil bacterial diversity as a consequence of agricultural land use in a semi-arid ecosystem. PLoS ONE 2013, 8, e59497. [Google Scholar]
  6. Bissett, A.; Richardson, A.E.; Baker, G.; Thrall, P.H. Long-term land use effects on soil microbial community structure and function. Appl. Soil Ecol. 2011, 51, 66–78. [Google Scholar] [CrossRef]
  7. Bainard, L.D.; Koch, A.M.; Gordon, A.M.; Newmaster, S.G.; Thevathasan, N.V.; Klironomos, J.N. Influence of trees on the spatial structure of arbuscular mycorrhizal communities in a temperate tree-based intercropping system. Agric. Ecosyst. Environ. 2011, 144, 13–20. [Google Scholar] [CrossRef]
  8. Nair, P.R. An Introduction to Agroforestry; Kluwer Academic Publishers: Dordrecht, The Netherlands, 1993. [Google Scholar]
  9. Thevathasan, N.; Gordon, A.; Simpson, J.; Reynolds, P.; Price, G.; Zhang, P. Biophysical and ecological interactions in a temperate tree-based intercropping system. J. Crop Improv. 2004, 12, 339–363. [Google Scholar] [CrossRef]
  10. Kimura, E.; Fransen, S.C.; Collins, H.P.; Stanton, B.J.; Himes, A.; Smith, J.; Guy, S.O.; Johnston, W.J. Effect of intercropping hybrid poplar and switchgrass on biomass yield, forage quality, and land use efficiency for bioenergy production. Biomass Bioenerg. 2018, 111, 31–38. [Google Scholar] [CrossRef]
  11. Trenbath, B.R. Multispecies cropping systems in India: Predictions of their productivity, stability, resilience and ecological sustainability. Agrofor. Syst. 1999, 45, 81–107. [Google Scholar] [CrossRef]
  12. Hauggaard-Nielsen, H.; Ambus, P.; Jensen, E.S. The comparison of nitrogen use and leaching in sole cropped versus intercropped pea and barley. Nutr. Cycl. Agroecosyst. 2003, 65, 289–300. [Google Scholar] [CrossRef]
  13. Bainard, L.; Koch, A.; Gordon, A.; Klironomos, J. Growth response of crops to soil microbial communities from conventional monocropping and tree-based intercropping systems. Plant Soil 2013, 363, 345–356. [Google Scholar] [CrossRef]
  14. Chifflot, V.; Rivest, D.; Olivier, A.; Cogliastro, A.; Khasa, D. Molecular analysis of arbuscular mycorrhizal community structure and spores distribution in tree-based intercropping and forest systems. Agric. Ecosyst. Environ. 2009, 131, 32–39. [Google Scholar] [CrossRef]
  15. Lacombe, S.; Bradley, R.L.; Hamel, C.; Beaulieu, C. Do tree-based intercropping systems increase the diversity and stability of soil microbial communities? Agric. Ecosyst. Environ. 2009, 131, 25–31. [Google Scholar] [CrossRef]
  16. Zhang, M.M.; Wang, N.; Hu, Y.B.; Sun, G.Y. Changes in soil physicochemical properties and soil bacterial community in mulberry (Morus alba L.)/alfalfa (Medicago sativa L.) intercropping system. Microbiol. Open 2018, 7, e00555. [Google Scholar] [CrossRef] [PubMed]
  17. Hong, Y.; Heerink, N.; Jin, S.; Berentsen, P.; Zhang, L.; van der Werf, W. Intercropping and agroforestry in China–Current state and trends. Agric. Ecosyst. Environ. 2017, 244, 52–61. [Google Scholar] [CrossRef]
  18. Gou, F.; Yin, W.; Hong, Y.; van der Werf, W.; Chai, Q.; Heerink, N.; van Ittersum, M.K. On yield gaps and yield gains in intercropping: Opportunities for increasing grain production in northwest China. Agric. Syst. 2017, 151, 96–105. [Google Scholar] [CrossRef]
  19. Paul, E.A. Soil Microbiology, Ecology and Biochemistry; Academic Press: London, UK, 2014. [Google Scholar]
  20. Tedersoo, L.; Bahram, M.; Põlme, S.; Kõljalg, U.; Yorou, N.S.; Wijesundera, R.; Ruiz, L.V.; Vasco-Palacios, A.M.; Thu, P.Q.; Suija, A.; et al. Global diversity and geography of soil fungi. Science 2014, 346, 1256688. [Google Scholar] [CrossRef]
  21. Kuramae, E.E.; Yergeau, E.; Wong, L.C.; Pijl, A.S.; van Veen, J.A.; Kowalchuk, G.A. Soil characteristics more strongly influence soil bacterial communities than land-use type. FEMS Microbial. Ecol. 2012, 79, 12–24. [Google Scholar] [CrossRef]
  22. Kaur, B.; Gupta, S.; Singh, G. Soil carbon, microbial activity and nitrogen availability in agroforestry systems on moderately alkaline soils in northern India. Appl. Soil Ecol. 2000, 15, 283–294. [Google Scholar] [CrossRef]
  23. Prescott, C.E.; Grayston, S.J. Tree species influence on microbial communities in litter and soil: Current knowledge and research needs. For. Ecol. Manag. 2013, 309, 19–27. [Google Scholar] [CrossRef]
  24. Augé, R.M. Water relations, drought and vesicular-arbuscular mycorrhizal symbiosis. Mycorrhiza 2001, 11, 3–42. [Google Scholar] [CrossRef]
  25. Duddridge, J.; Malibari, A.; Read, D. Structure and function of mycorrhizal rhizomorphs with special reference to their role in water transport. Nature 1980, 287, 834–836. [Google Scholar] [CrossRef]
  26. Johri, A.K.; Oelmüller, R.; Dua, M.; Yadav, V.; Kumar, M.; Tuteja, N.; Varma, A.; Bonfante, P.; Persson, B.L.; Stroud, R.M. Fungal association and utilization of phosphate by plants: Success, limitations, and future prospects. Front. Microbial. 2015, 6, 984. [Google Scholar] [CrossRef] [PubMed]
  27. Li, Y.; Ran, W.; Zhang, R.; Sun, S.; Xu, G. Facilitated legume nodulation, phosphate uptake and nitrogen transfer by arbuscular inoculation in an upland rice and mung bean intercropping system. Plant Soil 2009, 315, 285–296. [Google Scholar] [CrossRef]
  28. Rains, K.C.; Bledsoe, C.S. Rapid uptake of 15N-ammonium and glycine-13C, 15N by arbuscular and ericoid mycorrhizal plants native to a Northern California coastal pygmy forest. Soil Biol. Biochem. 2007, 39, 1078–1086. [Google Scholar] [CrossRef]
  29. Palm, C.A. Contribution of agroforestry trees to nutrient requirements of intercropped plants. Agrofor. Syst. 1995, 30, 105–124. [Google Scholar] [CrossRef]
  30. Garcia, K.; Zimmermann, S.D. The role of mycorrhizal associations in plant potassium nutrition. Front. Plant Sci. 2014, 5, 337. [Google Scholar] [CrossRef]
  31. Rachid, C.T.; Balieiro, F.C.; Fonseca, E.S.; Peixoto, R.S.; Chaer, G.M.; Tiedje, J.M.; Rosado, A.S. Intercropped silviculture systems, a key to achieving soil fungal community management in Eucalyptus plantations. PLoS ONE 2015, 10, e0118515. [Google Scholar] [CrossRef]
  32. Treseder, K.K.; Allen, E.B.; Egerton-Warburton, L.M.; Hart, M.M.; Klironomos, J.N.; Maherali, H.; Tedersoo, L. Arbuscular mycorrhizal fungi as mediators of ecosystem responses to nitrogen deposition: A trait-based predictive framework. J. Ecol. 2018, 106, 480–489. [Google Scholar] [CrossRef] [Green Version]
  33. Anderson, I.C.; Campbell, C.D.; Prosser, J.I. Potential bias of fungal 18S rDNA and internal transcribed spacer polymerase chain reaction primers for estimating fungal biodiversity in soil. Environ. Microbiol. 2003, 5, 36–47. [Google Scholar] [CrossRef] [PubMed]
  34. Lim, Y.W.; Kim, B.K.; Kim, C.; Jung, H.S.; Kim, B.-S.; Lee, J.-H.; Chun, J. Assessment of soil fungal communities using pyrosequencing. J. Microbiol. 2010, 48, 284–289. [Google Scholar] [CrossRef] [PubMed]
  35. Ranjard, L.; Poly, F.; Lata, J.-C.; Mougel, C.; Thioulouse, J.; Nazaret, S. Characterization of bacterial and fungal soil communities by automated ribosomal intergenic spacer analysis fingerprints: Biological and methodological variability. Appl. Environ. Microbial. 2001, 67, 4479–4487. [Google Scholar] [CrossRef]
  36. Jose, S.; Gillespie, A.; Pallardy, S. Interspecific interactions in temperate agroforestry. In New Vistas in Agroforestry; Springer: Berlin, Germany, 2004; pp. 237–255. [Google Scholar]
  37. Harley, J.L.; Smith, S.E. Mycorrhizal symbiosis. Q. Rev. Biol. 2008, 3, 273–281. [Google Scholar]
  38. Sepp, S.K.; Jairus, T.; Vasar, M.; Zobel, M.; Öpik, M. Effects of land use on arbuscular mycorrhizal fungal communities in Estonia. Mycorrhiza 2018, 28, 1–10. [Google Scholar] [CrossRef] [PubMed]
  39. Burrows, R.L.; Pfleger, F.L. Arbuscular mycorrhizal fungi respond to increasing plant diversity. Can. J. Bot. 2002, 80, 120–130. [Google Scholar] [CrossRef]
  40. Leal, P.L.; Stürmer, S.L.; Siqueira, J.O. Occurrence and diversity of arbuscular mycorrhizal fungi in trap cultures from soils under different land use systems in the Amazon, Brazil. Braz. J. Microbiol. 2009, 40, 111–121. [Google Scholar] [CrossRef] [Green Version]
  41. Wal, A.; Geydan, T.D.; Kuyper, T.W.; Boer, W. A thready affair: Linking fungal diversity and community dynamics to terrestrial decomposition processes. FEMS Microbiol. Rev. 2013, 37, 477–494. [Google Scholar]
  42. Floudas, D.; Binder, M.; Riley, R.; Barry, K.; Blanchette, R.A.; Henrissat, B.; Martínez, A.T.; Otillar, R.; Spatafora, J.W.; Yadav, J.S.; et al. The Paleozoic origin of enzymatic lignin decomposition reconstructed from 31 fungal genomes. Science 2012, 336, 1715–1719. [Google Scholar] [CrossRef]
  43. Spatafora, J.W.; Chang, Y.; Benny, G.L.; Lazarus, K.; Smith, M.E.; Berbee, M.L.; Bonito, G.; Corradi, N.; Grigoriev, I.; Gryganskyi, A.; et al. A phylum-level phylogenetic classification of zygomycete fungi based on genome-scale data. Mycologia 2016, 108, 1028–1046. [Google Scholar] [CrossRef] [Green Version]
  44. Buee, M.; Reich, M.; Murat, C.; Morin, E.; Nilsson, R.H.; Uroz, S.; Martin, F. 454 Pyrosequencing analyses of forest soils reveal an unexpectedly high fungal diversity. New Phytol. 2009, 184, 449–456. [Google Scholar] [CrossRef] [PubMed] [Green Version]
  45. Russo, S.E.; Legge, R.; Weber, K.A.; Brodie, E.L.; Goldfarb, K.C.; Benson, A.K.; Tan, S. Bacterial community structure of contrasting soils underlying Bornean rain forests: Inferences from microarray and next-generation sequencing methods. Soil Biol. Biochem. 2012, 55, 48–59. [Google Scholar] [CrossRef]
  46. Lauber, C.L.; Strickland, M.S.; Bradford, M.A.; Fierer, N. The influence of soil properties on the structure of bacterial and fungal communities across land-use types. Soil Biol. Biochem. 2008, 40, 2407–2415. [Google Scholar] [CrossRef]
  47. Núñez, J.A.D.; Serrano, J.S.; Barreal, J.A.R.; de Omeñaca González, J.A.S. The influence of mycorrhization with Tuber melanosporum in the afforestation of a Mediterranean site with Quercus ilex and Quercus faginea. For. Ecol. Manag. 2006, 231, 226–233. [Google Scholar] [CrossRef]
  48. Wallander, H.; Mahmood, S.; Hagerberg, D.; Johansson, L.; Pallon, J. Elemental composition of ectomycorrhizal mycelia identified by PCR–RFLP analysis and grown in contact with apatite or wood ash in forest soil. FEMS Microbial. Ecol. 2003, 44, 57–65. [Google Scholar] [CrossRef]
  49. Wallander, H.K.; Pallon, J. Temporal changes in the elemental composition of Rhizopogon rhizomorphs during colonization of patches with fresh organic matter or acid-washed sand. Mycologia 2005, 97, 295–303. [Google Scholar] [CrossRef] [PubMed]
  50. Lambilliotte, R.; Cooke, R.; Samson, D.; Fizames, C.; Gaymard, F.; Plassard, C.; Tatry, M.V.; Berger, C.; Laudié, M.; Legeai, F. Large-scale identification of genes in the fungus Hebeloma cylindrosporum paves the way to molecular analyses of ectomycorrhizal symbiosis. New Phytol. 2004, 164, 505–513. [Google Scholar] [CrossRef] [Green Version]
  51. Liu, J.; Guo, W.Q.; Shi, D.C. Seed germination, seedling survival, and physiological response of sunflowers under saline and alkaline conditions. Photosynthetica 2010, 48, 278–286. [Google Scholar] [CrossRef]
  52. Borcard, D.; Legendre, P.; Drapeau, P. Partialling out the spatial component of ecological variation. Ecology 1992, 73, 1045–1055. [Google Scholar] [CrossRef]
  53. H., H.C. Study on the efficient planting pattern of mulberry and grain intercropping. Mod. Agric. Sci. Technol. 2011, 21, 68–69. [Google Scholar]
  54. Nazih, N.; Finlay-Moore, O.; Hartel, P.G.; Fuhrmann, J.J. Whole soil fatty acid methyl ester (FAME) profiles of early soybean rhizosphere as affected by temperature and matric water potential. Soil Biol. Biochem. 2001, 33, 693–696. [Google Scholar] [CrossRef]
  55. Schinner, F.; Öhlinger, R.; Kandeler, D.E.; Margesin, R. Methods in Soil Biology; Springer: Berlin, Germany, 1995. [Google Scholar]
  56. Lu, R.K. Analytical Methods of Soil and Agricultural Chemistry; China Agricultural Science and Technology Press: Beijing, China, 2000. (In Chinese) [Google Scholar]
  57. Schoch, C.L.; Seifert, K.A.; Huhndorf, S.; Robert, V.; Spouge, J.L.; Levesque, C.A.; Chen, W.; Consortium, F.B. Nuclear ribosomal internal transcribed spacer (ITS) region as a universal DNA barcode marker for Fungi. Proc. Natl. Acad. Sci. USA 2012, 109, 6241–6246. [Google Scholar] [CrossRef] [PubMed] [Green Version]
  58. Kõljalg, U.; Nilsson, R.H.; Abarenkov, K.; Tedersoo, L.; Taylor, A.F.; Bahram, M.; Bates, S.T.; Bruns, T.D.; Bengtsson-Palme, J.; Callaghan, T.M.; et al. Towards a unified paradigm for sequence-based identification of fungi. Mol. Ecol. 2013, 22, 5271–5277. [Google Scholar] [CrossRef] [PubMed] [Green Version]
  59. Caporaso, J.G.; Kuczynski, J.; Stombaugh, J.; Bittinger, K.; Bushman, F.D.; Costello, E.K.; Fierer, N.; Pena, A.G.; Goodrich, J.K.; Gordon, J.I.; et al. QIIME allows analysis of high-throughput community sequencing data. Nat. Methods 2010, 7, 335. [Google Scholar] [CrossRef] [PubMed]
  60. Edgar, R.C. UPARSE: Highly accurate OTU sequences from microbial amplicon reads. Nat. Methods 2013, 10, 996. [Google Scholar] [CrossRef] [PubMed]
  61. Wang, Q.; Garrity, G.M.; Tiedje, J.M.; Cole, J.R. Naive Bayesian Classifier for Rapid Assignment of rRNA Sequences into the New Bacterial Taxonomy. Appl. Environ. Microbiol. 2007, 73, 5261–5267. [Google Scholar] [CrossRef] [Green Version]
Figure 1. The bar of the pie plot showing the relative abundance of soil fungal phyla (left) and Ascomycota classes (right) with different treatments. The four dominant phyla were Ascomycota (59.9%), Mucoromycota (18.8%), Basidiomycota (12.3%), and Unclassified (8.7%), respectively. The primary fungi (Ascomycota) mainly consisted of Sordariomycetes, Pezizomycetes, Dothideomycetes, Leotiomycetes, and Eurotiomycetes.
Forests 10 00167 g001
Figure 2. Influence of plant types and planting pattern on the fungal community structure at phyla level in the rhizosphere soil. The dominant phyla were Ascomycota, Mucoromycota, and Basidiomycota in all soil samples. Comparative analysis of monoculture and intercropped treatments revealed a distinct distribution of the fungal phyla. Notes: MM, IM, MA, IA represent monoculture mulberry, intercropped mulberry, monoculture alfalfa, and intercropped alfalfa, respectively. MM-1, MM-2, and MM-3 represent three repeats of MM, IM-1, IM-2, and IM-3 represent three repeats of IM, MA-1, MA-2, and MA-3 represent three repeats of MA, IA-1, IA-2, and IA-3 represent three repeats of IA.
Forests 10 00167 g002
Figure 3. Statistical Analysis of Metagenomic Profiles (STAMP) analysis plots showing the differences in fungal classes in monoculture and intercropping mulberry soil (left) to those in monoculture and intercropping alfalfa soil (right). Welch’s t-test was applied to test for differences in fungal classes due to planting pattern. The p-values are also shown. Glomeromycetes, Pezizomycetes, and Mucoromycota showed higher relative abundances in intercropped mulberry (p < 0.05). Leotiomycetes, Pezizomycetes, Eurotiomycetes, Cystobasidiomycetes, and Dothideomycetes presented higher relative abundances in the monoculture alfalfa (p < 0.05).
Forests 10 00167 g003
Figure 4. Venn diagram showing the shared and unique observed fungal OTUs at 97% similarity among treatments. The unique OTUs demonstrated that a different treatment had its own fungal population. Notes: MM, IM, MA, IA represent monoculture mulberry, intercropped mulberry, monoculture alfalfa, and intercropped alfalfa, respectively.
Forests 10 00167 g004
Figure 5. Hierarchical heatmap analysis of 100 predominant fungal communities in different treatments. The OTUs were ordered by genus. Sample communities were clustered based on the complete linkage method. The color intensity of scale indicates the relative abundance of each OTU read. Relative abundance was defined as the number of sequences affiliated with the OTU divided by the total number of sequences per sample. Notes: MM, IM, MA, IA represent monoculture mulberry, intercropped mulberry, monoculture alfalfa, and intercropped alfalfa, respectively. MM-1, MM-2 and MM-3 represent three repeats of MM, IM-1, IM-2, and IM-3 represent three repeats of IM, MA-1, MA-2, and MA-3 represent three repeats of MA, IA-1, IA-2, and IA-3 represent three repeats of IA.
Forests 10 00167 g005
Figure 6. Redundancy analysis (RDA) plot of soil variables, intercropping and soil fungal community in soils from different treatments. The RDA plot was calculated from the relative OTU abundances and soil properties. Arrows of the RDA plot indicate the direction and magnitude of measurable variables associated with fungal community structures. Each word represents a sample. TN had the longest arrow indicating it was the most important in all the shown factors affecting the fungal community. RDA component 1 and 2 explained 48.6% and 24.8% of the total variations of the fungal community structure, respectively. Just based on RDA1, twelve samples were divided into three groups, IM and IA were clustered together, MM and MA were in the different groups. TN, TP, and TC represent total nitrogen, total phosphate and total carbon respectively. Notes: MM, IM, MA, IA represent monoculture mulberry, intercropped mulberry, monoculture alfalfa, and intercropped alfalfa, respectively. MM-1, MM-2, and MM-3 represent three repeats of MM, IM-1, IM-2, and IM-3 represent three repeats of IM, MA-1, MA-2, and MA-3 represent three repeats of MA, IA-1, IA-2, and IA-3 represent three repeats of IA.
Forests 10 00167 g006
Figure 7. Variance partitioning analysis (VPA) showing the effects of planting pattern and soil variables on the phylogenetic structure of fungal communities based on MiSeq sequencing were calculated from relative OTU abundances and soil chemical properties. The planting pattern explained 25.9% of the variation of the fungal community structure, and soil environmental factors explained 63.1% of the variation. The TN, TP, and TC explained 29.6%, 17.7%, and 15.8% of the variation, respectively.
Forests 10 00167 g007
Table 1. Physicochemical parameters of different treatments.
SampleTN
g/kg
AHN
mg/kg
TP
g/kg
AK
mg/kg
TC
g/kg
MM0.91 ± 0.00 c148.88 ± 6.96 ab0.41 ± 0.06 a5.02 ± 0.7 c2.23 ± 0.00 a
IM0.54 ± 0.00 b123.07 ± 10.88 a0.46 ± 0.02 a3.35 ± 0.00 b2.22 ± 0.00 a
MA0.79 ± 0.04 a111.37 ± 3.37 a0.42 ± 0.00 a2.99 ± 0.07 a2.16 ± 0.00 a
IA0.93 ± 0.06 c227.34 ± 87.84 b0.46 ± 0.01 a6.26 ± 0.21 d2.52 ± 0.00 b
Results of two-way ANOVA
Int29.15 **2.737.29144.90 *11.49 **
Crv94.29 **3.230.029710.75 **9.00 **
Values are means ± standard deviation (n = 3). Different lowercase letters indicate significant differences among different samples according to Duncan’s multiple range test (p < 0.05). Note: MM, IM, MA, IA represent monoculture mulberry, intercropped mulberry, monoculture alfalfa, and intercropped alfalfa, respectively. TN, AHN, TP, AK, and TC represent total nitrogen, alkaline hydrolysable nitrogen, total phosphate, available potassium, and total carbon, respectively. Int and Crv represent the intercropping treatment and crop variety, respectively. * p < 0.05, ** p < 0.01.
Table 2. Fungal richness and diversity of different planting patterns.
SampleCluster Distance (0.03)
OTUsChao 1CoverageShannonSimpson
MM-13214161.004.080.040
MM-23824731.004.100.048
MM-34808730.994.200.041
IM-16057880.994.340.037
IM-25036001.004.340.033
IM-370510060.994.510.028
MA-14865441.004.380.028
MA-25226950.994.420.026
MA-36578980.994.500.025
IA-13214161.004.080.040
IA-23824731.004.100.048
IA-34808730.994.200.041
Total5844--------
Note: The description of abbreviation names is shown in Table 1. MM-1, MM-2, and MM-3 represent three repeats of MM; IM-1, IM-2, and IM-3 represent three repeats of IM; MA-1, MA-2, and MA-3 represent three repeats of MA; and IA-1, IA-2, and IA-3 represent three repeats of IA. The same abbreviations appear below.
Table 3. Pearson’s correlation (r) and significance (p) values between the relative abundances of the eight most abundant fungal phyla and the soil physicochemical properties.
Taxonomic GroupTNAHNTPAKTC
rprprprprp
Ascomycota−0.2950.353−0.1500.643−0.3910.208−0.7260.008−0.5500.064
Basidiomycota0.5800.0480.1700.598−0.3180.3140.6690.0170.1590.622
Blastocladiomycota−0.6600.019−0.2220.4890.4340.158−0.3360.286−0.1940.545
Chytridiomycota0.0820.800−0.1650.6070.5580.0590.2050.5230.4620.131
Mucoromycota−0.6560.0210.3670.2400.5990.040−0.2240.4840.0050.988
Unclassified0.0670.836−0.1290.6900.5070.0930.3060.3330.4900.106
Zoopagomycota−0.9250.000−0.3070.3310.4010.197−0.5880.044−0.3970.201
Note: TN, AHN, TP, AK, and TC represent total nitrogen, alkaline hydrolysable nitrogen, total phosphate, available potassium, and total carbon, respectively. Values in bold indicate significant correlations (p < 0.05).

