Estimating Fine Root Production from Ingrowth Cores and Decomposed Roots in a Bornean Tropical Rainforest
by
 ,
,
Ayumi Katayama
1,* ,
,
Lip Khoon Kho
2,
Naoki Makita
3,
Tomonori Kume
1,4,
Kazuho Matsumoto
5 and
Mizue Ohashi
6 1
Kyushu University Forest, Kyushu University, Fukuoka 8112415, Japan
2
Tropical Peat Research Institute, Biological Research Division, Malaysian Palm Oil Board, Selangor 43000, Malaysia
3
Faculty of Science, Shinshu University, Matsumoto 3908621, Japan
4
School of Forestry and Resource Conservation, National Taiwan University, Taipei 10617, Taiwan
5
Faculty of Agriculture, University of the Ryukyus, Okinawa 9030129, Japan
6
School of Human Science and Environment, University of Hyogo, Himeji 6700092, Japan
*
Author to whom correspondence should be addressed.
Forests 2019, 10(1), 36; https://doi.org/10.3390/f10010036
Submission received: 9 November 2018
/
Revised: 26 December 2018
/
Accepted: 29 December 2018
/
Published: 7 January 2019
(This article belongs to the Special Issue Rhizosphere Dynamics under Global Change)
Abstract
:Research highlights: Estimates of fine root production using ingrowth cores are strongly influenced by decomposed roots in the cores during the incubation period and should be accounted for when calculating fine root production (FRP). Background and Objectives: The ingrowth core method is often used to estimate fine root production; however, decomposed roots are often overlooked in estimates of FRP. Uncertainty remains on how long ingrowth cores should be installed and how FRP should be calculated in tropical forests. Here, we aimed to estimate FRP by taking decomposed fine roots into consideration. Specifically, we compared FRP estimates at different sampling intervals and using different calculation methods in a tropical rainforest in Borneo. Materials and Methods: Ingrowth cores were installed with root litter bags and collected after 3, 6, 12 and 24 months. FRP was estimated based on (1) the difference in biomass at different sampling times (differential method) and (2) sampled biomass at just one sampling time (simple method). Results: Using the differential method, FRP was estimated at 447.4 ± 67.4 g m−2 year−1 after 12 months, with decomposed fine roots accounting for 25% of FRP. Using the simple method, FRP was slightly higher than that in the differential method after 12 months (516.3 ± 45.0 g m−2 year−1). FRP estimates for both calculation methods using data obtained in the first half of the year were much higher than those using data after 12-months of installation, because of the rapid increase in fine root biomass and necromass after installation. Conclusions: Therefore, FRP estimates vary with the timing of sampling, calculation method and presence of decomposed roots. Overall, the ratio of net primary production (NPP) of fine roots to total NPP in this study was higher than that previously reported in the Neotropics, indicating high belowground carbon allocation in this forest.
1. Introduction
Tropical rainforests have high gross primary production (GPP) and huge biomass [1,2]; therefore, they play an important role on carbon cycling at a global scale. Higher annual temperatures in tropical area leads to higher GPP; yet, higher net primary production (NPP) is not always observed [1]. Annul fine root production (FRP, g m−2 year−1) contributes considerably to carbon cycling, representing 10–60% total net primary production in tropical forests [2]. For instance, Finer et al. [3] showed that the FRP in tropical forests is significantly higher than that in boreal forests. However, the authors found no clear relationship between FRP and mean annual temperature in forest ecosystems. Thus, FRP might not always be as high as expected in the tropics, with other factors, such as nutrient availability and forest structure impacting FRP. Alternatively, there might be an issue with the method used to estimate FRP. Many studies in tropical regions estimate FRP using the ingrowth core methods [4,5]; however, this method underestimates FRP [6,7,8]. Therefore, we need to examine accuracy of this method in tropical forests.
The ingrowth core method might underestimate FRP because of the way decomposed fine roots are treated in the cores during incubation period. Part of the fine roots that grow inside the cores die and decompose during the incubation period. Yet, most studies do not properly integrate these decomposed fine roots into FRP estimates. Recently, a new approach for estimating FRP using the ingrowth core method was proposed by Osawa and Aizawa [9]. The authors suggest that fine root decomposition between times i and j may be obtained by assuming that the fine roots die continuously, with constant instantaneous mortality and disappear at an instantaneous decomposition, with a constant decomposition rate. The authors evaluated the decomposition rate of fine roots using litter-bag experiments in a temperate coniferous forest. They found that fine root production was 14% lower when excluding decomposed fine roots than the new method. Li et al. [10] also estimated FRP using the Osawa method and found that decomposed fine roots contributed to 33.3% of total FRP in a secondary Mongolian oak forest. Neglecting decomposed fine roots causes considerable underestimates of FRP in tropical rainforests, where high temperature and humidity cause high decomposition rates of root [11]. Thus, here, we set out to examine how decomposed fine roots contribute to FRP estimates in tropical forests.
FRP is also underestimated because of the slow growth rate of root-free soil in ingrowth cores [7,12]. For example, fine root biomass inside the cores was half that of the outside biomass after 3 years of installation in a boreal forest [7]. Thus, ingrowth cores should be set in the soil so that sufficient fine roots grow inside the cores. Furthermore, ingrowth cores should be sampled after more than 1 year of installation [7,12]. Yet, the sampling period of some previous studies in tropical forests was much shorter, in the range of several months [4,5,13]. Jourdan et al. [13] observed comparable root biomass inside the cores with that outside after 3 months of installation in a tropical plantation; thus, several months might be enough for fine roots to grow inside the cores in tropical rainforests. However, no studies have examined how long ingrowth cores should be installed. Thus, it is necessary to compare FRP estimates at different sampling intervals.
FRP is often estimated as the difference in total fine root biomass inside the core 1 year after installation from that 2 years after installation in boreal and temperate forests, to eliminate the disturbance effect of installation [6,7]. This method was called “the differential method” in the present study. Osawa and Aizawa [5] also estimated FRP using the differential method. A different calculation method, termed “the simple method” in the present study, is often used in tropical rainforests [4,5]. Specifically, sampled total fine root biomass inside the cores at one sampling time is regarded as the total production during a sampling period. However, knowledge remains limited about how these different methods affect FRP estimates. Thus, it is necessary to compare FRP estimates using different calculation methods in tropical rainforests.
The tropical rainforests of Borneo exhibit little seasonality in temperature and rainfall [14] and have a large biomass with a high stand density of large trees [15]. Although the characteristics of carbon cycling in these forests have been reported recently [5,16], few studies have investigated belowground carbon cycling of these habitats compared to the Neotropics [17]. Previous studies found that large quantities of carbon were allocated belowground in a tropical rainforest of Borneo [18,19], suggesting high FRP. To estimate FRP with greater accuracy, it is necessary to consider the contribution of decomposed fine roots and identify appropriate sampling intervals and calculation methods. Thus, here, we aimed to estimate FRP in a tropical forest of Borneo, taking decomposed fine roots into account based on the Osawa method. We also compared FRP estimated at different sampling times using the differential and simple methods.
2. Materials and Methods
2.1. Study Site
The study was carried out in Lambir Hills National Park, Sarawak, Malaysia (4°12′ N, 114°02′ E) on the island of Borneo, which is situated about 20 km southwest of Miri, Sarawak. Lowland mixed-dipterocarp forest, containing Dryobalanops aromatica Gaertn. f. and Shorea beccariana Burck, covers 85% of this 6949-ha park, which is a typical mature lowland tropical rainforest type in Southeast Asia [20,21]. Fordia splendidissima (Bl.) Buijsen, Croton oblongus Burm.f. and Macaranga brevipetiolata Airy Shaw are dominant understory trees in the national park [22]. The soils are red-yellow podzolic soils (Malaysian classification) or ultisols (United States Department of Agriculture Soil Taxonomy), with high sand content (62–72%), low pH (4.0–4.3) and high porosity (54–68%) [23,24]. Total nitrogen and carbon content are highly variable in space and are relatively high in the A horizon (0–5 cm) (17–115 g kg−1 for nitrogen and 1.7–4.2 g kg−1 for carbon) but decline in deeper horizons (0.1–11.0 g kg−1 for nitrogen and 0.1–0.6 g kg−1 for carbon) [23]. At this site, the mean annual temperature was 25.8 °C and rainfall was distributed throughout the year, with mean annual rainfall of 2600 mm between 2000 and 2009 [25]. Three plots with areas of 20 m × 20 m each were established near the crane plot, where the experiments on carbon cycling were conducted [16,18,25]. Each plot was 50–100 m apart from the other two plots.
2.2. Measurements
A cylindrical tube of 10 cm in diameter and 30 cm in length was used as the ingrowth core. The cylindrical tube was made of plastic mesh, with mesh openings of approximately 15 mm2, which allowed roots, soil animals and microorganisms to enter. This cylinder was filled with soil from the study site but all roots including dead root and decomposing organic matter were removed by washing the soil with tap water, similar to the method used by Osawa et al. [9]. In February 2013 (T0), 24 ingrowth cores were buried in each plot (72 cores in total). Six cores were collected in each plot at four time points: June 2013 (T1), September 2013 (T2), March 2014 (T3) and March 2015 (T4). These time points corresponded to sample intervals of ~3, 6, 12 and 24 months.
On each sampling date, six ingrowth cores from each plot were collected by cutting off the surrounding roots and washing them with tap water. The cores were stored at 4 °C until processing. The sampled cores were sieved through a 0.5 mm-mesh to collect all root samples, including broken segments. These samples were washed clean of attached soil particles. All roots on the sieve were collected and separated into woody roots and understory roots based on color and texture. Then, fine roots (<2.0 mm in diameter) were divided into live and dead roots based on color and resilience. Live roots have an intact stele and cortex with white color and are slightly elastic. Dead roots often have fragmented bark and are soft and brittle. Living fine root biomass and fine root necromass outside the cores were also sampled at three locations in each plot using core samplers with diameters of 10 cm and to a depth of 30 cm in March 2013, following the same method used for ingrowth cores. Sampled root were dried at 50 °C for 48 h.
Root litter bag experiments were conducted to determine the decomposition rate of roots. Fine roots were sampled in each study plot and dried at 50–60 °C over 2 days. Dried fine roots totaling 5 g in weight were placed in mesh bags and added to the ingrowth cores. Root litter bags of 5 × 5 cm size were made from a casting net of synthetic fabric with 6 mm mesh size. In total, 12 root litter bags for each plot were set in February 2013 and three root litter bags for each plot were collected at each sampling time point. Fine root litter was gently washed by water, dried and weighed.
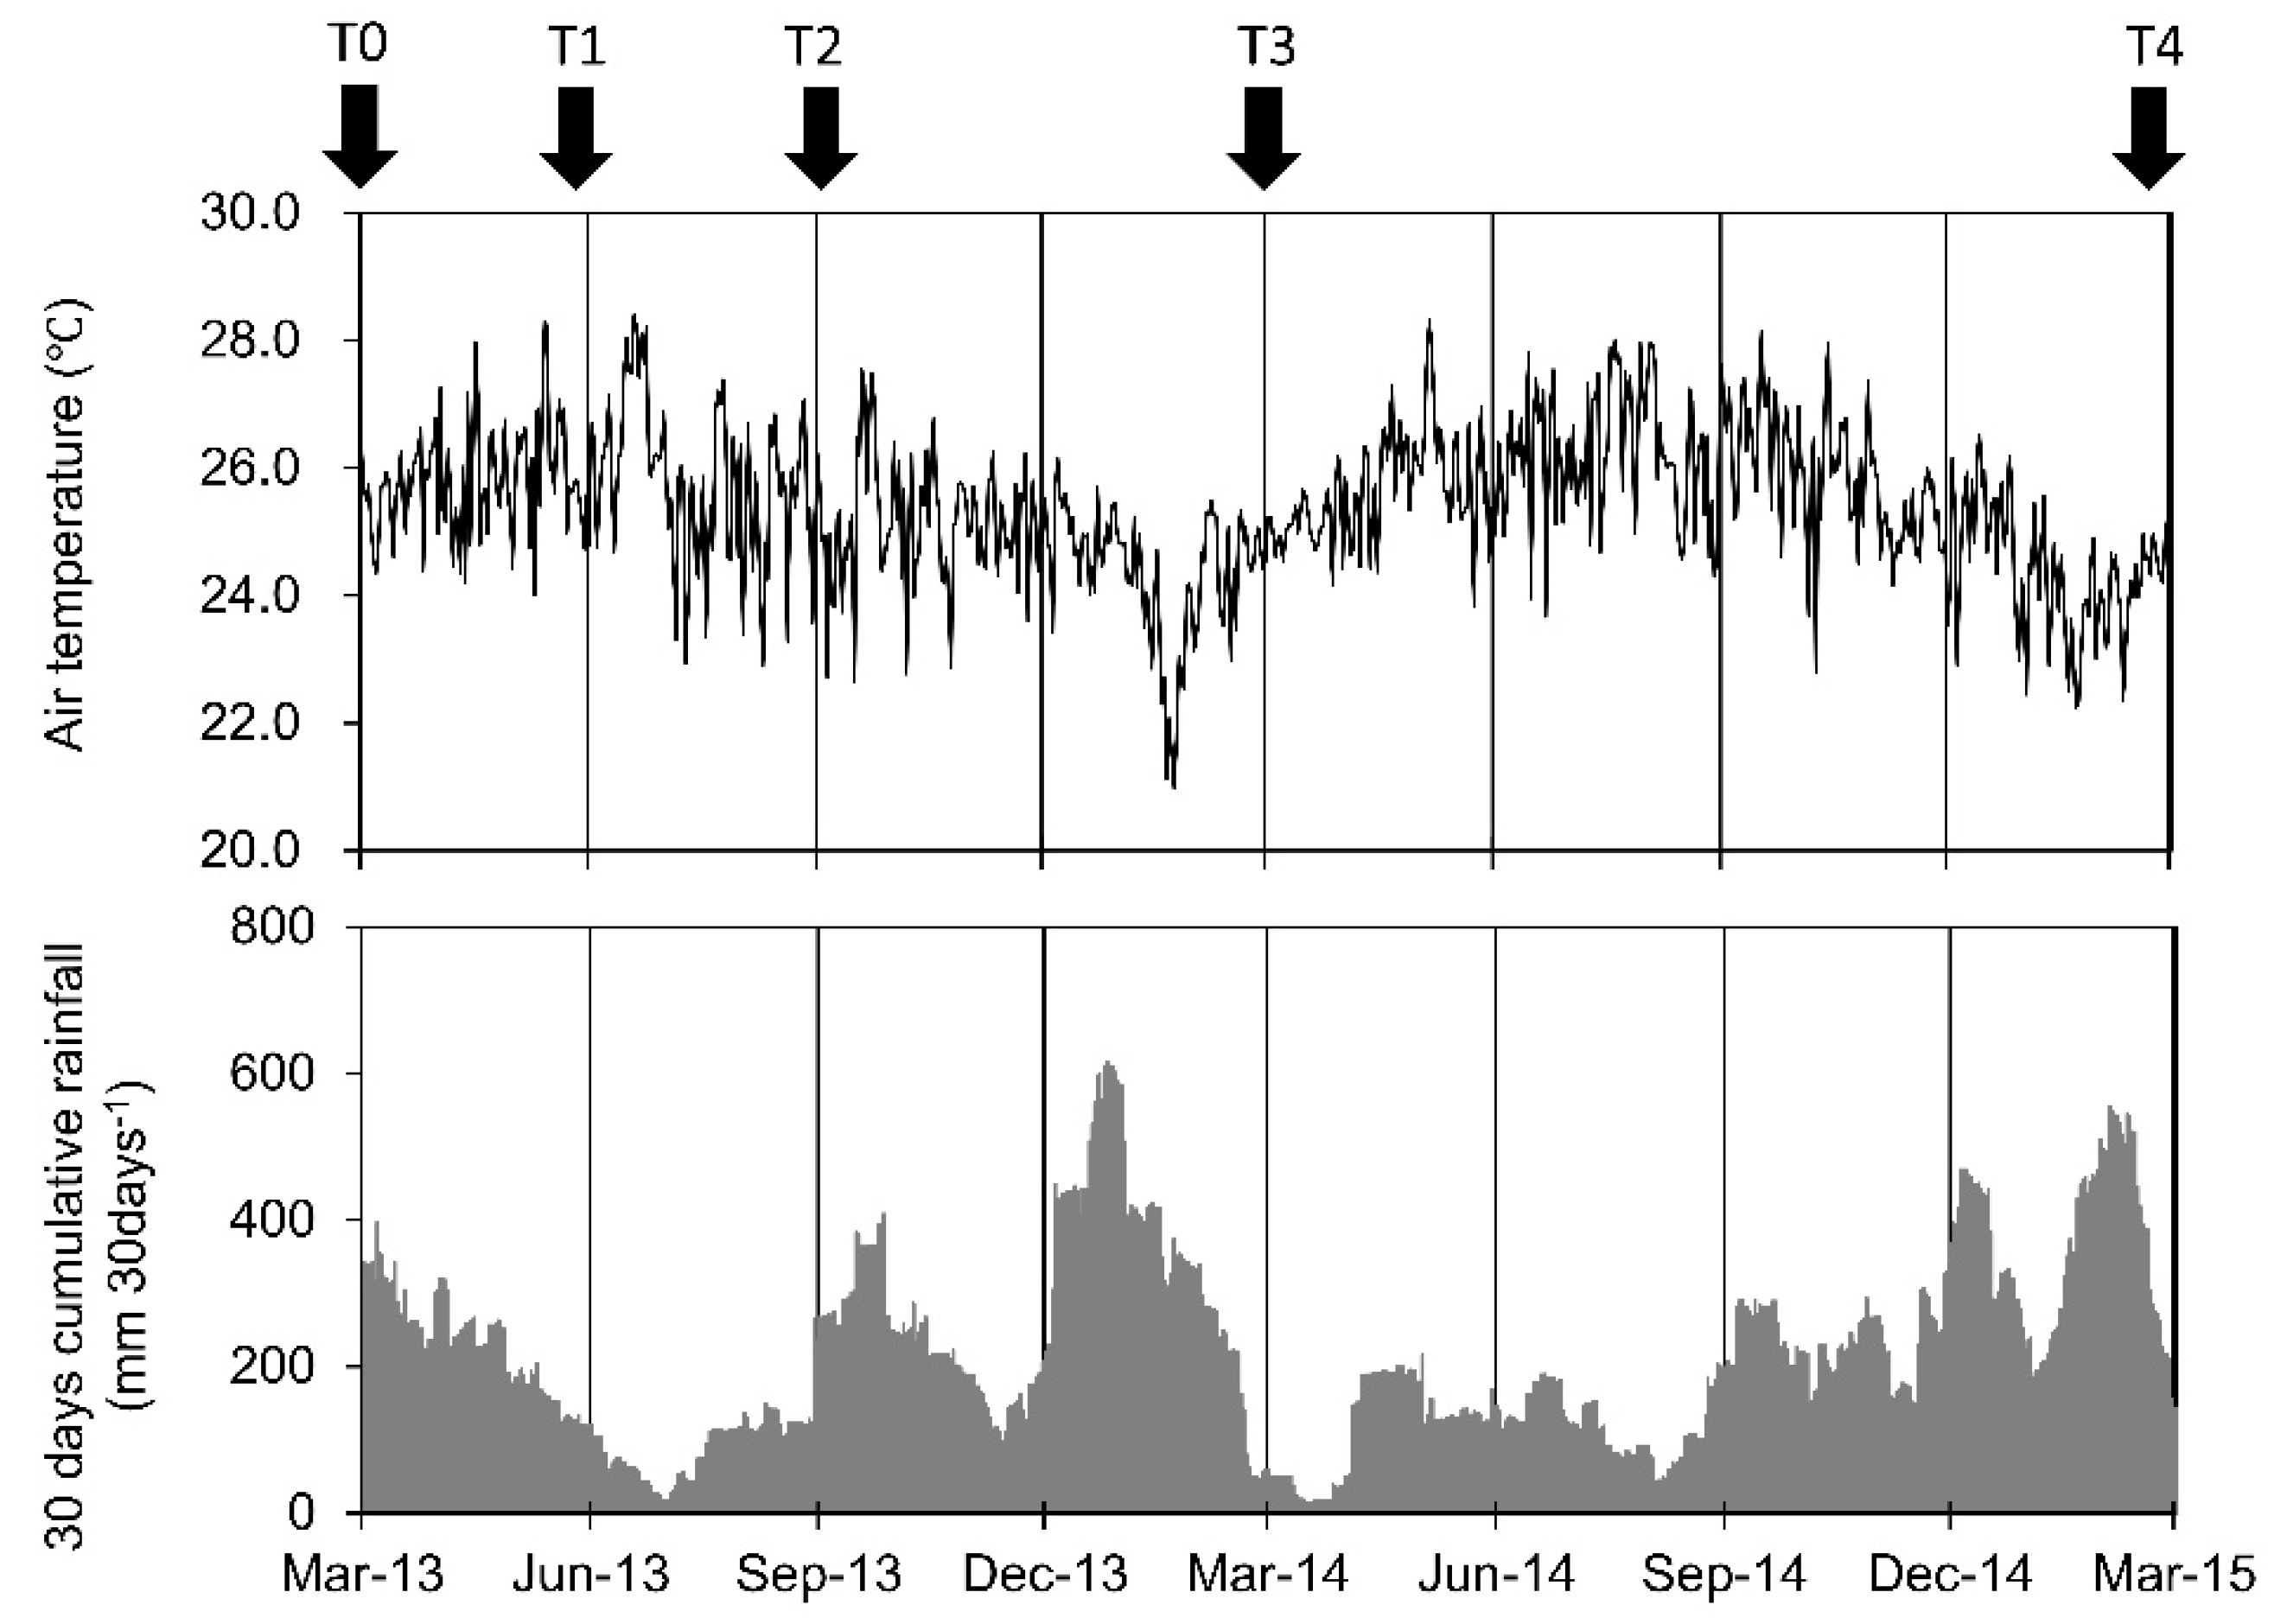
Air temperature was monitored on the crane at 75 m above the ground using a thermohygrograph (HMP35A, Vaisala, Helsinki, Finland) and the data were logged using a programmable data logger (CR10X, Campbell Scientific, Logan, UT, USA). Rainfall was monitored using a tipping bucket rain gauge (RS102, Ogasawara Keiki, Tokyo, Japan) with a data logger (HOBO event, Onset Computer, Bourne, MA, USA) at the top of the crane (Figure 1).
2.3. Methods of calculating FRP
FRP was calculated by two methods: differential method and simple method, with decomposed fine roots being accounted for based on Osawa et al. [9]. FRPij between sampling time i and j was the sum of differences in live fine root biomass at (ΔBij, g m−2), the difference in fine root necromass (ΔNij, g m−2) and decomposed dead fine roots (dij, g m−2). The following equations were used:
where Bi and Bj are live fine root biomass at sampling time i and j and Ni and Nj are fine root necromass at sampling time i and j. dij was estimated as:
where, γij is the decomposition ratio of fine root necromass between times i and j and Ni (g m−2) is fine root necromass at time i. γij was estimated based on the litter bags experiments as:
where NiC and NjC are the fine root necromass in litter bags at time i and j. Equation (2) was generated by Osawa and Aizawa [9], based on the assumption of constant mortality and decomposition rate between times i and j. When the values of fine root production were negative, they were assigned as zero, because negative values are not possible in ecology [9]. FRP, ΔB, ΔN and d were calculated to annual values using the g m−2 year−1 unit to allow comparison among sampling intervals.
FRPij = ΔBij + ΔNij + dij
ΔBij = Bj − Bi
ΔNij = Nj − Ni
dij = −ΔNij − (ΔNij/γij + Ni) × ln(1 − γij)
γij = 1 − NjC/NiC
In the differential method, FRP was derived from the difference in the amount of root that was sampled at two different sampling times, similar to Osawa and Aizawa [9]. In the differential method, all combinations of i and j using T1, T2, T3 and T4 were calculated at different sampling intervals. For example, the sampling interval combining T1 and T2 was 3 months, while that between T1 and T3 was 9 months. There were six combinations in total (T1–T2, T1–T3, T1–T4, T2–T3, T2–T4 and T3–T4). FRP between T3 and T4 with a sampling interval of 12 months was used as a reference to compare all sampling intervals because one-year interval was often used in previous studies [7,13,26] and the period between core installation and root sampling should be extended to allow for maximum root colonization [27].
In the simple method, the quantity of roots that grew into the mesh bags was regarded as total production for the incubation period. Thus, i was always set as T0, with just four time combinations (T0–T1, T0–T2, T0–T3 and T0–T4).
2.4. NPPfr Estimates
Net primary production of fine roots (NPPfr, MgC ha−1 year−1) was calculated from the FRP data to compare it against previous studies in tropical forests [5,28,29,30,31,32]. These comprehensive studies were conducted in tropical rainforests and used the same method to estimate NPPfr. In their studies, NPPfr was estimated at a depth of 0–100 cm, fine roots were defined as roots with a diameter of less than 5 mm and weight was carbon basis. For the comparison, NPPfr in the present study was calculated from FRP by dividing it with 0.732 to include roots with a diameter of <5 mm [3] and by adding 39% to reflect a depth of 0–100 cm [5,27,28,29,30,31]. This value was then multiplied by 0.5 to present the values based on carbon weight (0.5, [33]). Of note, NPPfr in the present study included just biomass production and did not include root exudation, production of volatile organic compounds or carbon allocation to symbionts. In addition to NPPfr, NPP of aboveground coarse wood (NPPacw), NPP of litterfall (NPPlitterfall) and the sum of NPPfr, NPPacw and NPPlitterfall (NPPtotal) were compared.
2.5. Statistical Analyses
We conducted two statistical analyses. First, a linear mixed model was used to compare fine root biomass and necromass inside the cores for the various incubation periods. Here, fine root biomass and fine root necromass were set as objective variables and sampling time (T1, T2, T3, T4) was set as the explaining variable, while sampling plot (P1, P2, P3) was defined as a random effect. Second, a linear mixed model was also used to compare each component of FRP (ΔBfr, ΔN and d) and FRP among sampling intervals. Here, each component of FRP (ΔBfr, ΔN and d) and FRP was set as objective variables, while sampling intervals were set as explanatory factors and sampling plot (P1, P2, P3) was defined as a random effect. The analyses were conducted for both the differential and simple methods. Tukey post-hoc tests were used to compare means when statistically significant differences were found in both analyses. Statistical analyses were conducted with R ver. 3.1.3. using lme (nlme-package) and glht (multcomp-package).
3. Results
3.1. FRP Taking Decomposed Roots into Account
Between T3 and T4 (12-month sampling interval), the FRP using the differential method was 447.4 ± 67.4 g m−2 year−1. ΔBfr, ΔN and d accounted for 51.1, 23.9 and 25% of total FRP. Between T3 and T4, NPPfr using the differential method was estimated at 4.25 ± 0.64 MgC ha−1 year−1 (Table 1). The ratio of NPPfr to NPPtotal was 0.39, which was higher than the average among previous studies (0.31 ± 0.08). If d was excluded from FRP and NPPfr estimates, these parameters were estimated as 335.7 ± 45.6 g m−2 year−1 and 3.19 ± 0.43 MgC ha−1 year−1, respectively The ratio of NPPfr to NPPtotal decreased to 0.32. This ratio was almost comparable to the average.
3.2. Biomass Outside and Inside the Cores
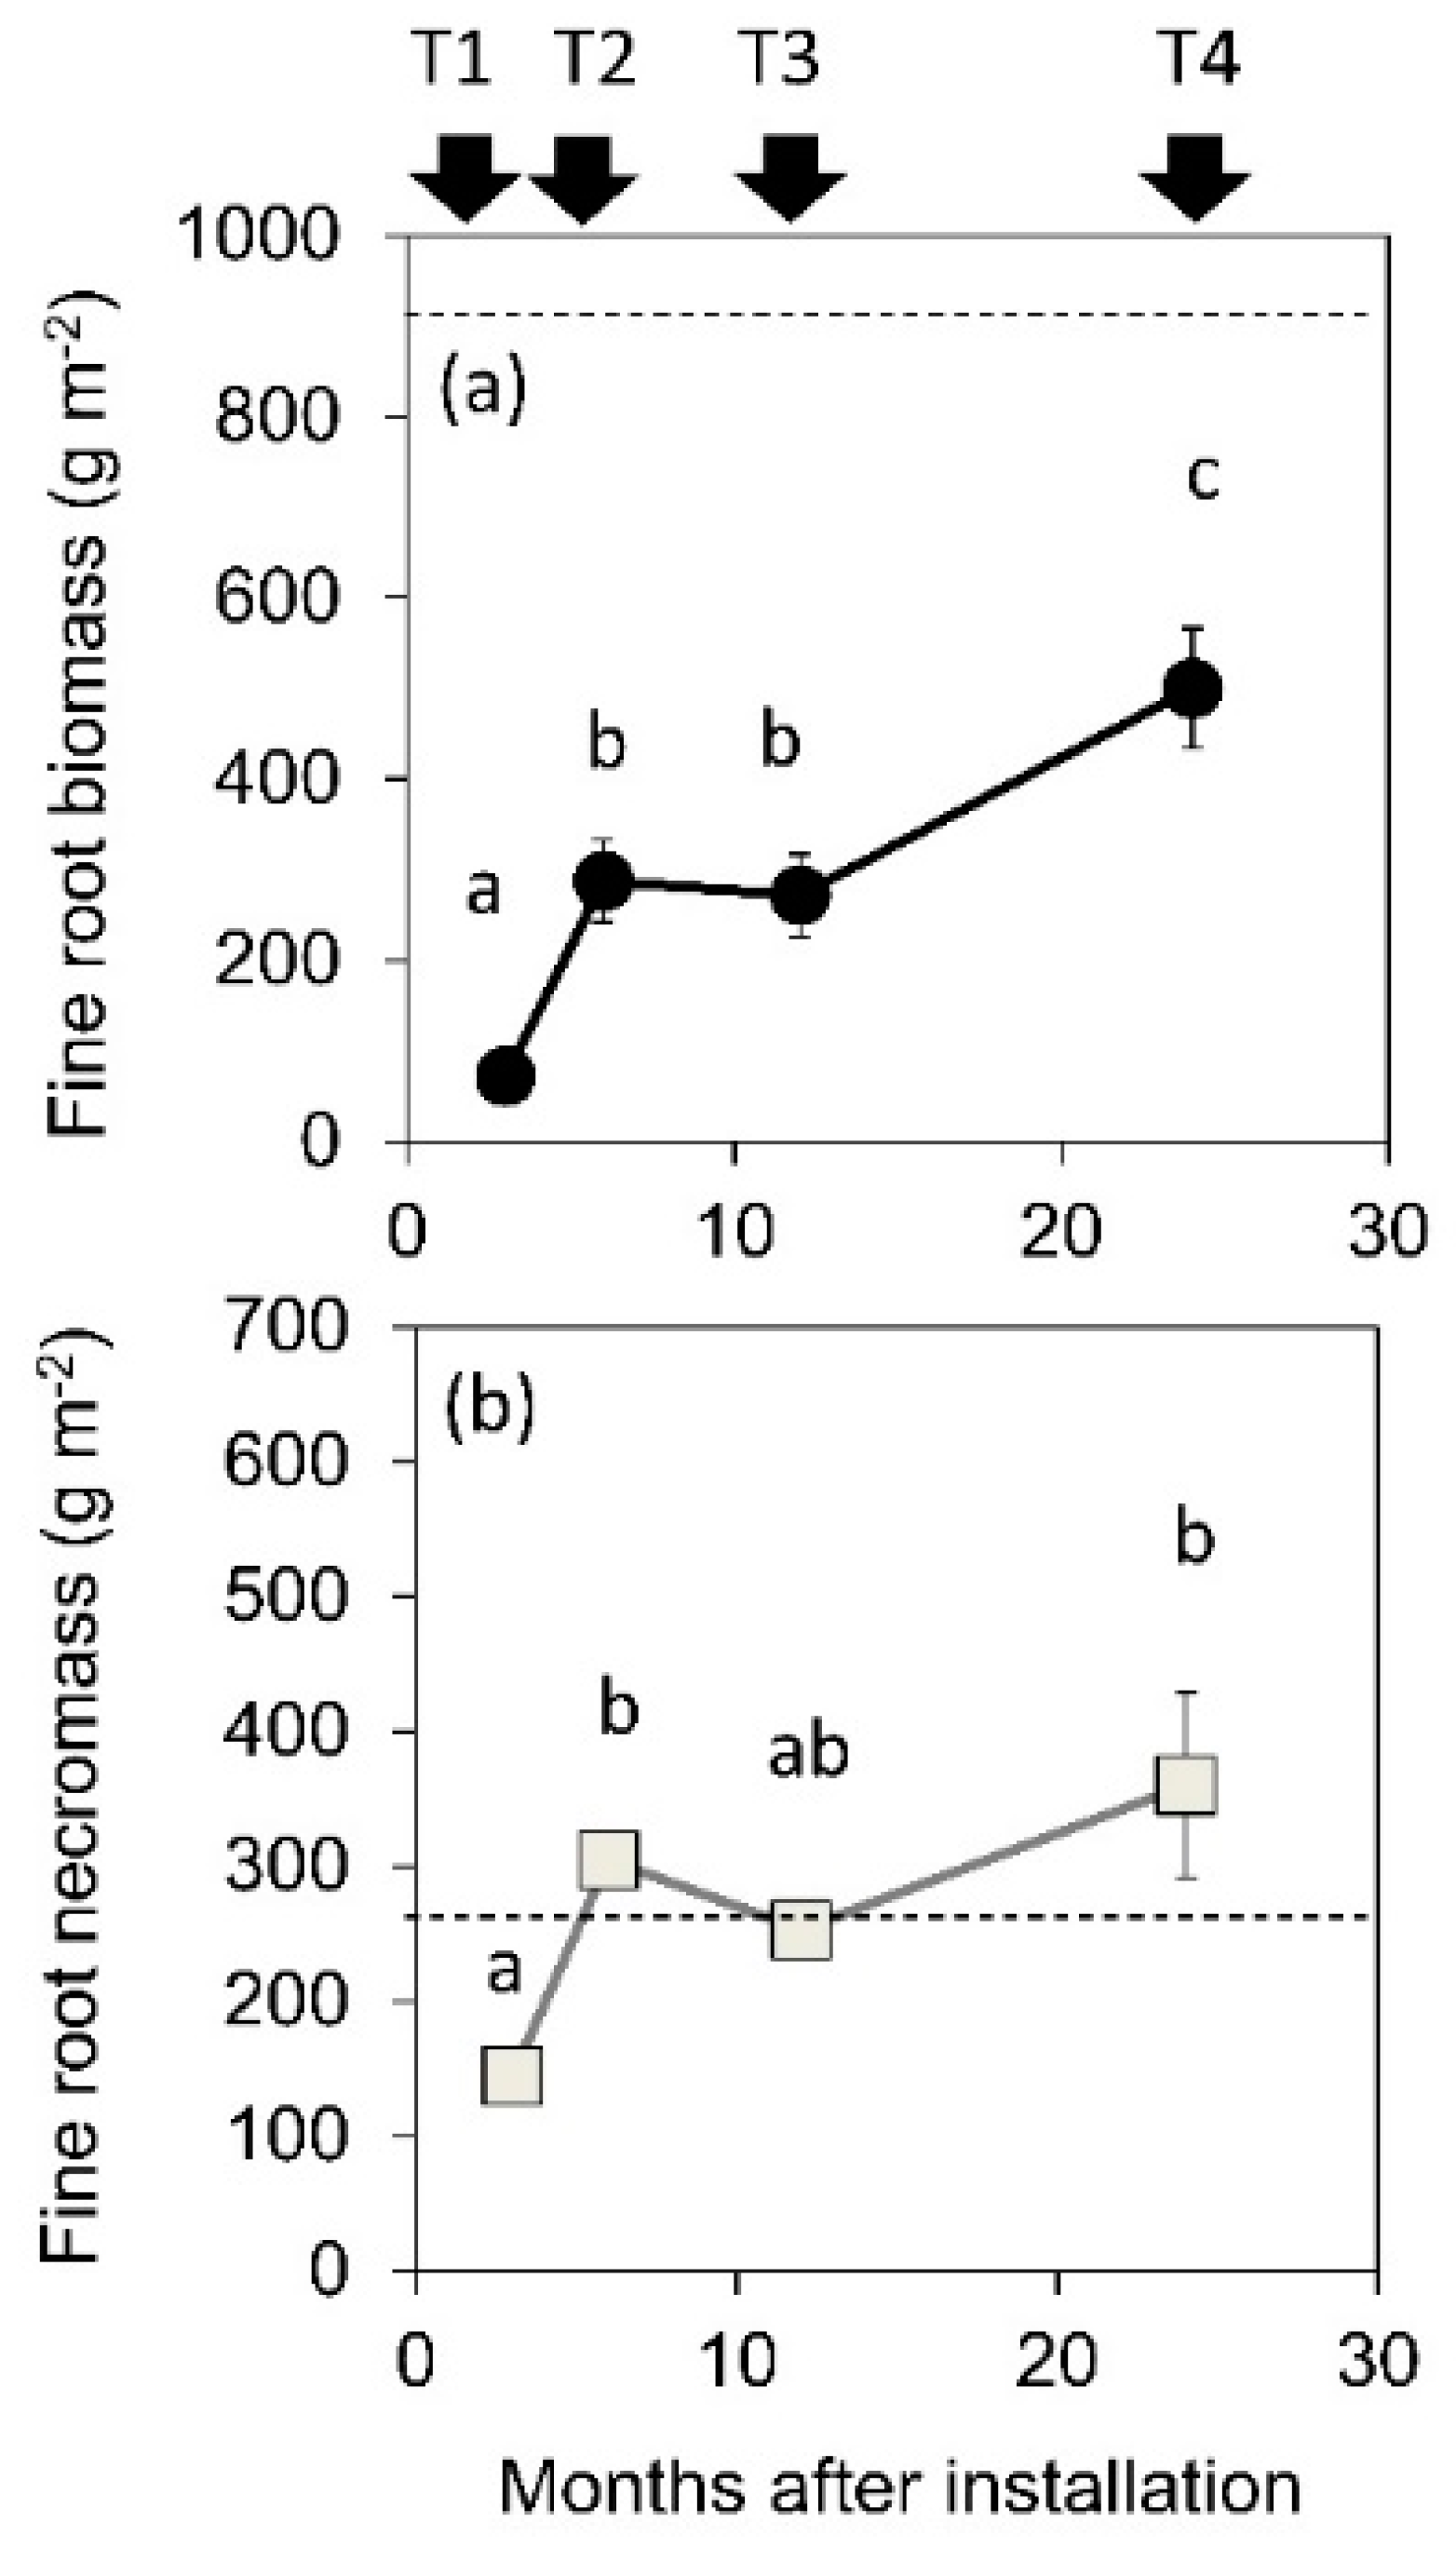
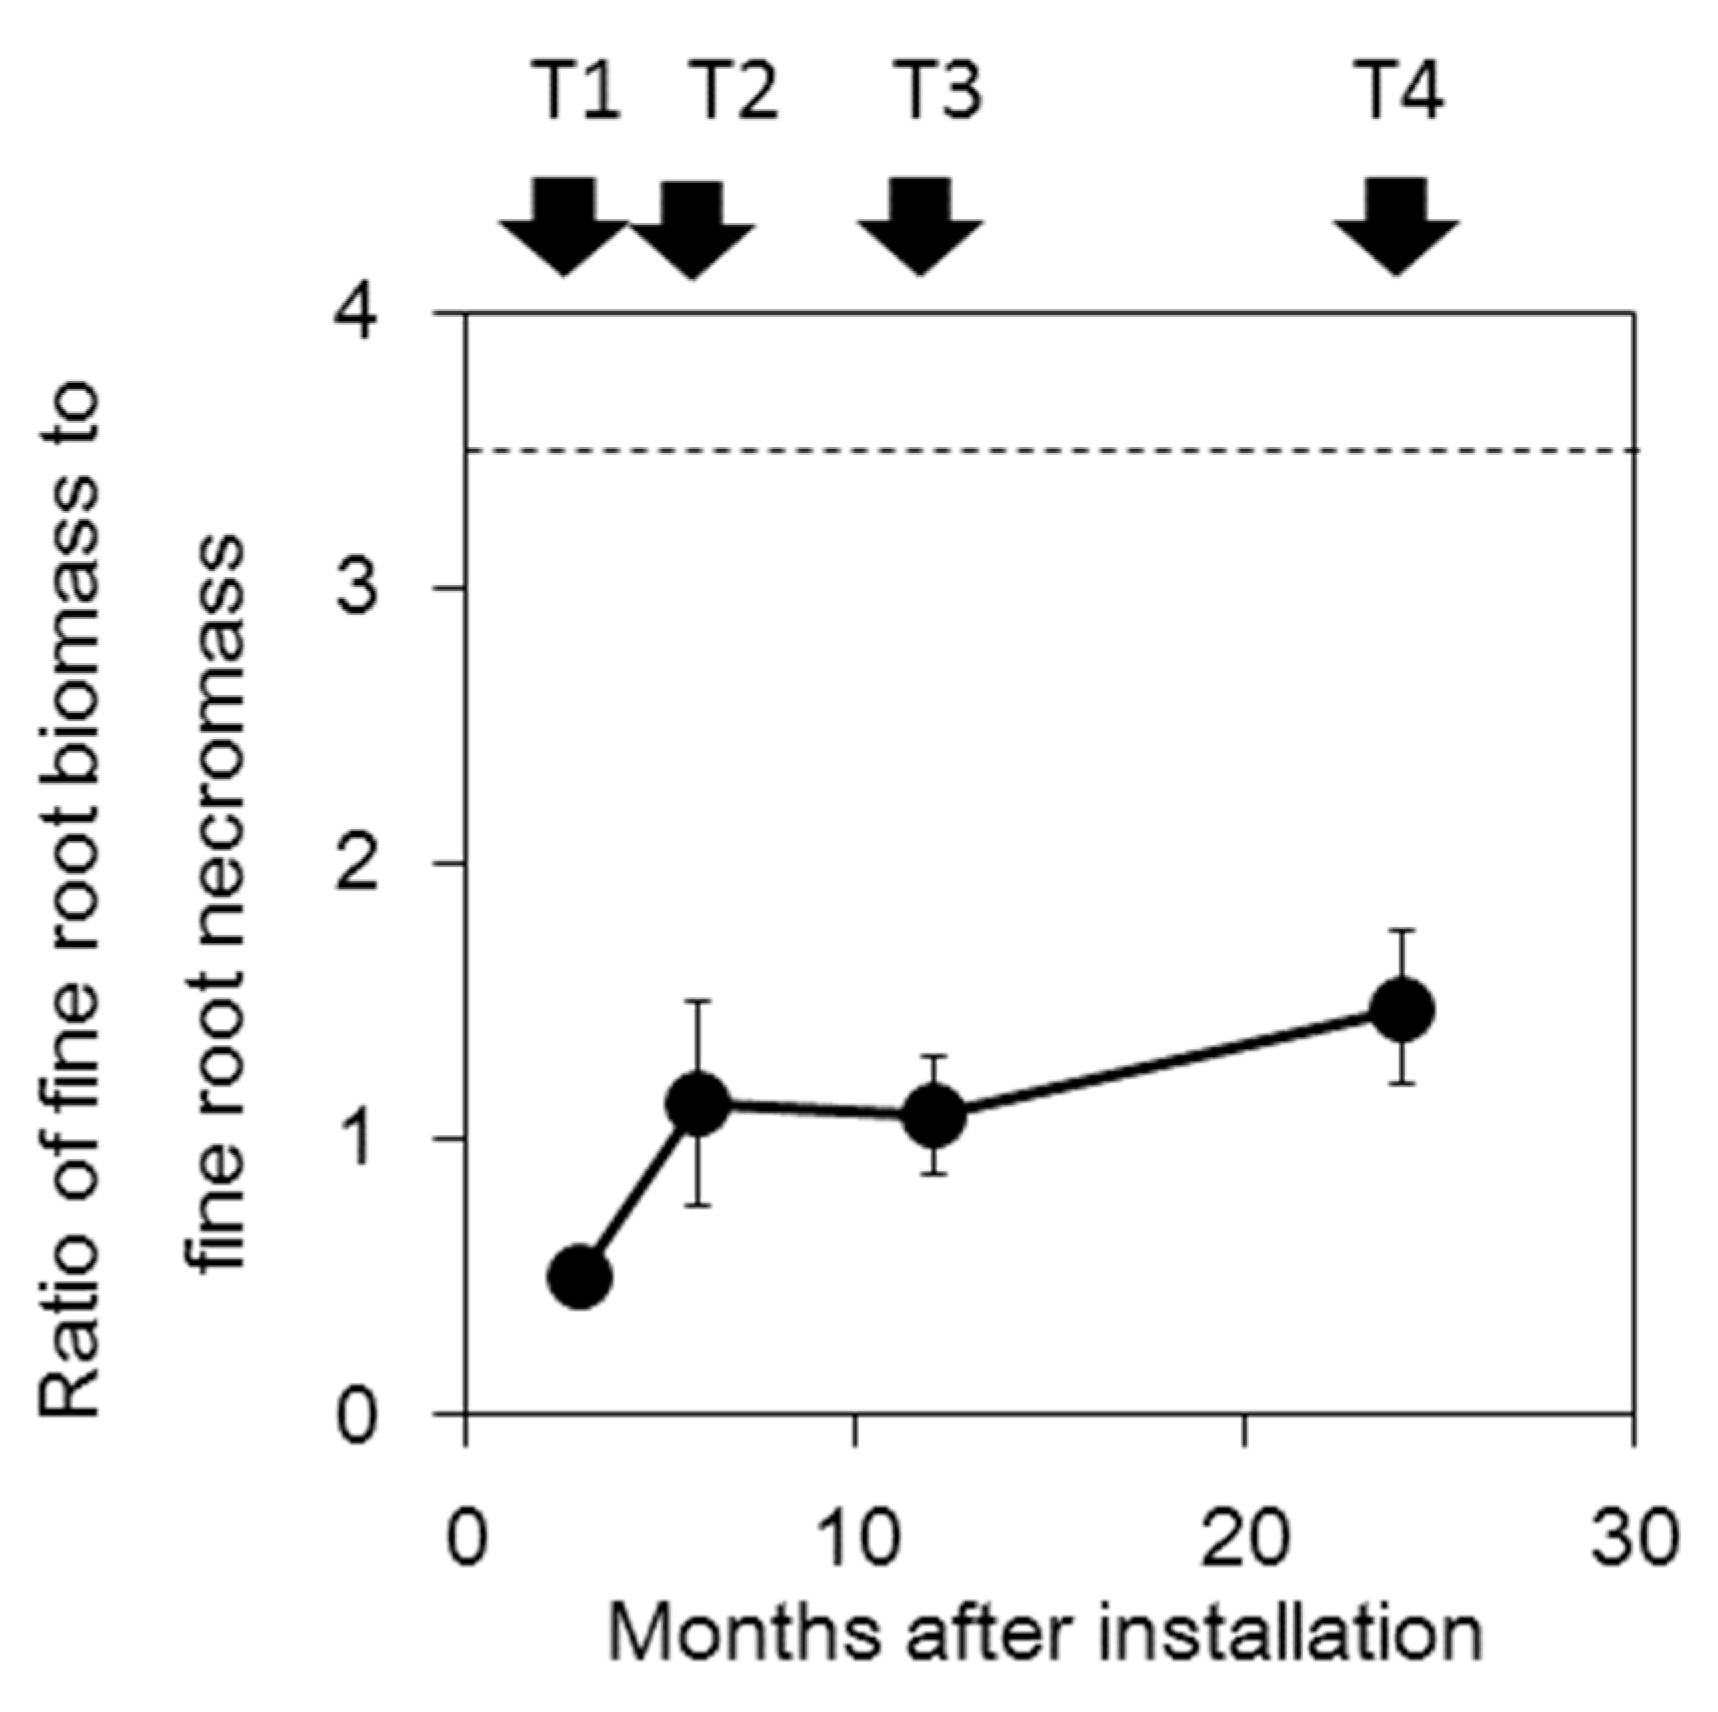
Fine root biomass and fine root necromass outside the cores (mean ± S.E.) were 968.7 ± 32.91 and 288.8 ± 40.0 g m−2, respectively. Fine root biomass inside the cores considerably increased between T1 and T2 (3-month interval) but did not significantly increase between T2 and T3 and it again increased between T3 and T4 (Figure 2a). Fine root necromass also increased between T1 and T2 but biomass did not significantly change between T2 and T4. At T4, fine root biomass (499.9 ± 66.4 g m−2) was almost half that of biomass outside cores, whereas fine root necromass (360.0 ± 52.74 g m−2) was slightly higher than that outside cores. The ratio of fine root biomass to fine root necromass inside the cores increased with sampling time (Figure 3) but the ratio at T4 (1.47 ± 0.28) was lower than that outside (3.47 ± 0.42).
3.3. FRP Estimates Based on Different Sampling Intervals and Calculation Methods
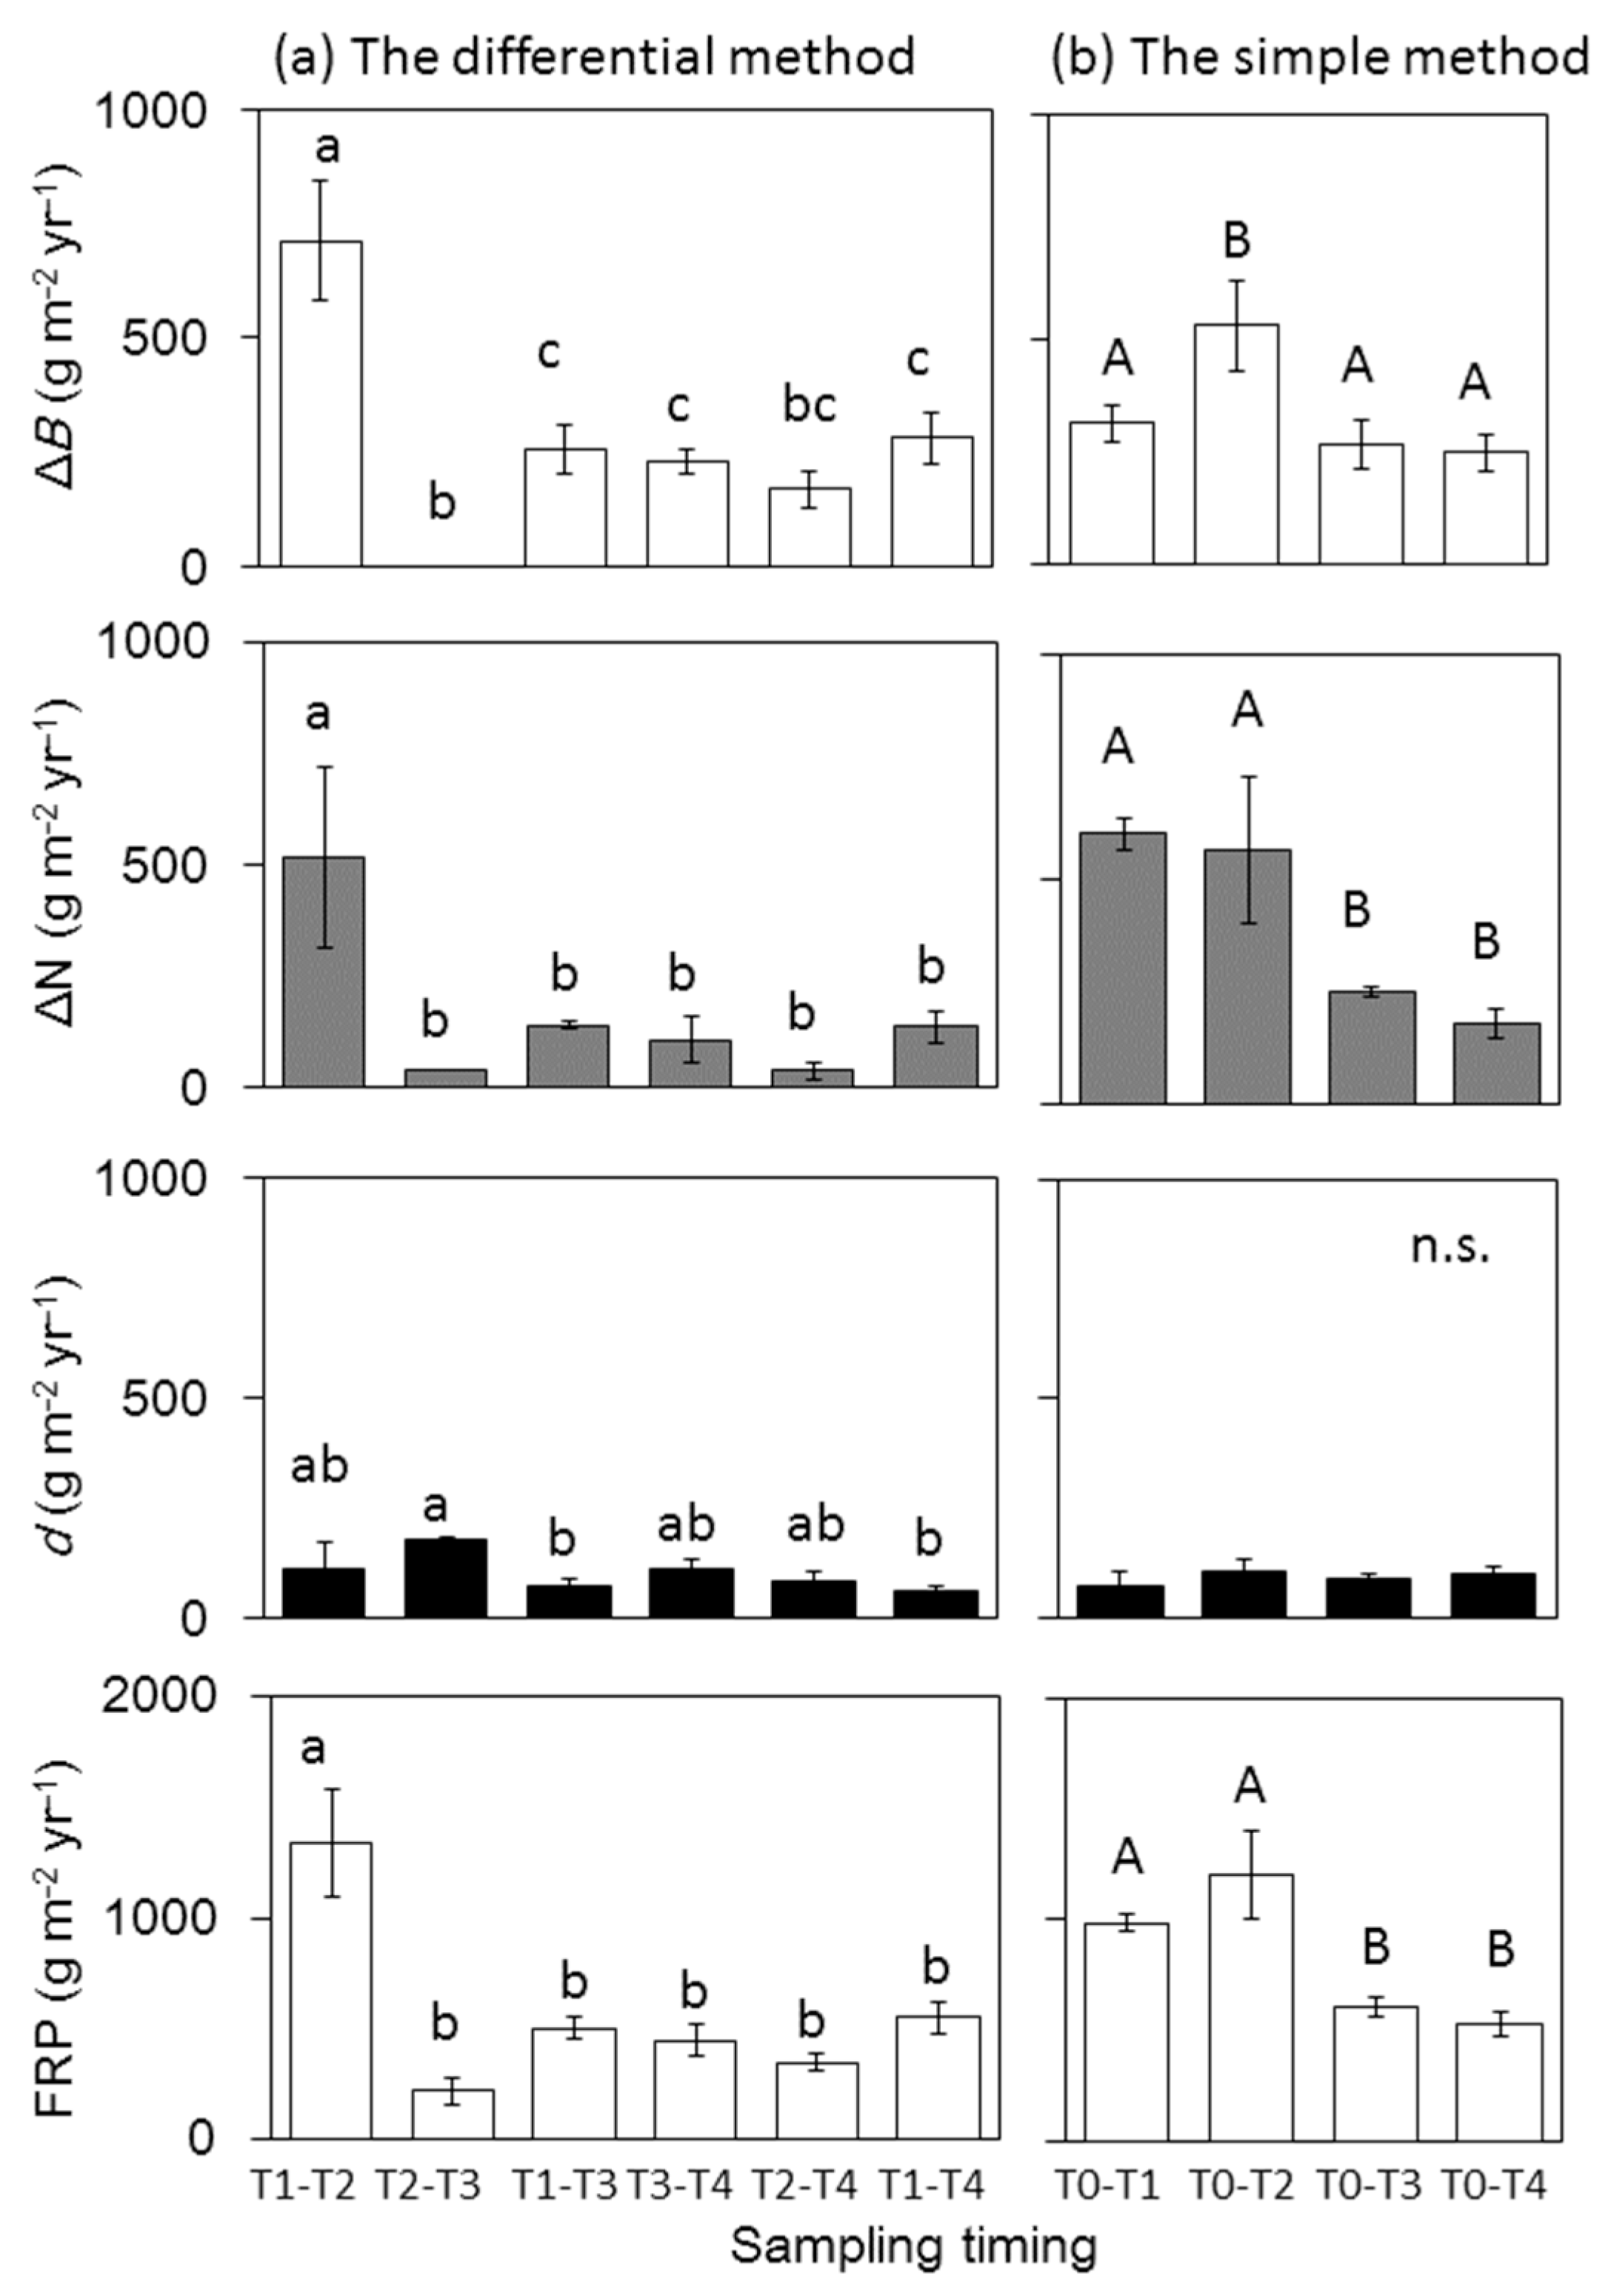
FRP estimates significantly varied with sampling timing and between the two methods (Figure 4). FRP between T1 and T2 (1338.2 ± 243.3 g m−2 year−1) was significantly higher than that at all other sampling periods. FRP between T2 and T3, T2 and T4, T1 and T3 and T1 and T4 (218.1 ± 61.9, 349.1 ± 39.4, 502.7 ± 52.8, 551.4 ± 71.8 g m−2 year−1, respectively) was comparable to that between T3 and T4. In the simple method, FRP at T0−T1 (3-months) and T0−T2 (6-months) (915.2 ± 71.1, 1095.0 ± 178.2 g m−2 year−1, respectively) was significantly higher than that at T0−T3 and T0−T4 (516.3 ± 45.0, 426.4 ± 47.9 g m−2 year−1, respectively).
ΔBfr and ΔN in both methods also differed considerably with sampling timing (Figure 4). ΔBfr between T1 and T2 was significantly higher, while ΔBfr between T2 and T3 was lower, than the values obtained for other periods. ΔBfr at T0–T2 was significantly higher than that during other sampling period in the simple method. ΔN between T1 and T2 for the differential method was significantly higher than that during other periods. Similarly, ΔN at T0−T1 and T0−T2 for the simple method was significantly higher than that during the other periods.
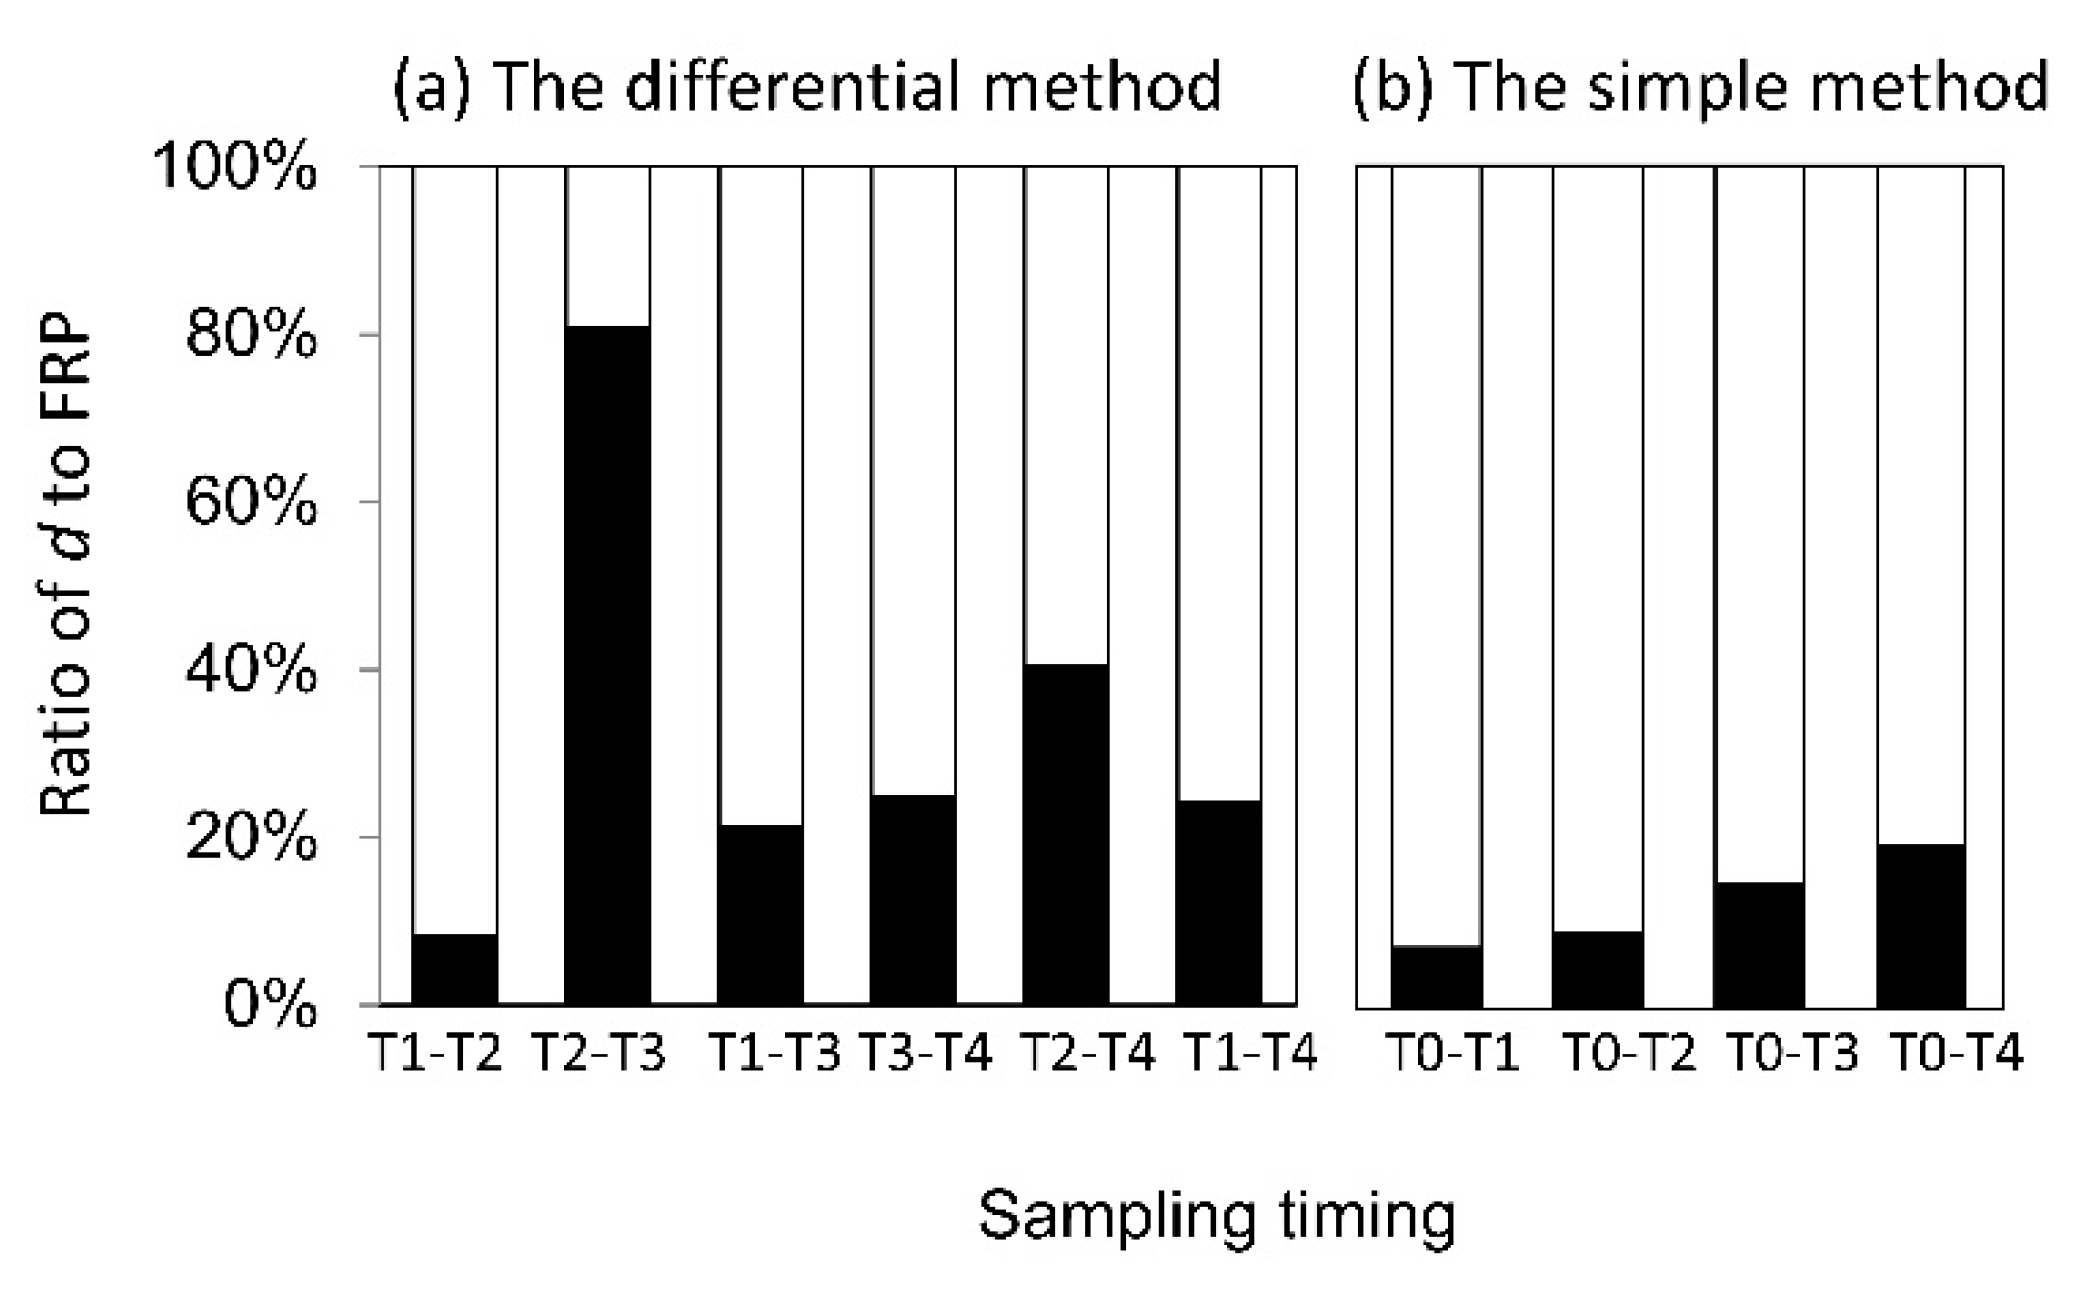
d did not differ among the sampling times in either method (Figure 4). However, the contribution of d to FRP was considerably different among the sampling times in the differential methods (Figure 5). The ratio ranged from 8.2% at T1–T2 to 80.8% at T2−T3, with the average of 33.4% for the differential method. The contribution of d to FRP in the simple method increased with increasing sampling interval. The ratio was only 7.2 and 9.0% at T0–T1 and T0–T2, respectively but increased to 14.7 and 19.4% at T0–T3 and T0–T4, respectively.
4. Discussion
4.1. Characteristics of d and FRP in the Study Forest
This study showed that the contribution of d was 25% between T3 and T4 in the differential method (Figure 5). The ratio was comparable to that in a growing secondary oak forest (27.1%, [10]) but higher than that in a temperate coniferous forest (14%, [9]) and a secondary oak forest (8.0−12.8%, [34]). Thus, the contribution of decomposed fine roots was not consistently higher than that of other forests, including tropical rainforests, located at higher latitudes where lower decomposition ratios were reported [11,35,36]. d was calculated from fine root necromass and the decomposition ratio (γij, Equations (2) and (3)). The γij between T3 and T4 in the present study (0.30 ± 0.07) was lower than that in a secondary Mongolian oak (0.93 ± 0.22, [10]). In comparison, necromass in the ingrowth cores at the sampling interval of T3 was more than twice that of the cores 9 months after installation in Li et al. [10]. The lower decomposition ratio but higher necromass, in the present study was partly attributed to the similar contribution of decomposed fine roots. The γij between T3 and T4 in the present study was comparable to the global mean for broadleaf (0.35, n = 40, [9]), including boreal, temperate and tropical forests. The decomposition rate generally increases with mean annual temperature or latitude [11,35,36], suggesting a relatively low decomposition ratio in the present study. Thus, the contribution of decomposed fine roots in the present study might be lower than that in other tropical rainforests.
NPPfr and the ratio of NPPfr to NPPtotal in the present study were relatively higher than values reported in the Neotropics (Table 1). These results correspond to a previous study reporting higher belowground carbon allocation in this forest type. Belowground carbon was used for high rhizosphere production and/or respiration, probably because of poor nutrient availability [19]. However, the ratio of NPPfr to total belowground carbon flux (19.63 MgC ha−1 year−1, [19]) was just 0.22 in our study forest. The averaged ratio of NPPfr to TBCF among forest ecosystems ranged between 0.42 and 0.53 [37]. Thus, large quantities of carbon might be used for rhizosphere respiration, root exudation, production of volatile organic compounds and carbon allocation to symbionts, none of which were measured in the study forest. In addition, previous studies (see Table 1) used different ingrowth core methods to the present study. For instance, ingrowth cores were collected every 3 months and root-free soil was re-installed inside the cores and placed to the same holes [5,28,29,30,31,32]. The effect of repeated disturbance caused by use of the same hole has not been quantified, along with the effect on d. To compare FRP across various forests, it is necessary to use consistent methods, even when using ingrowth cores.
4.2. Impact of Decomposed Fine Roots on FRP Estimates
The contribution of d differed between the two methods of calculation. The ratio of d to FRP was 25% between T3 and T4 in the differential method, whereas the ratio for T0–T3 and T0–T4 was 14.7% and 19.4% in the simple method (Figure 5). Therefore, both methods underestimate FRP when excluding information on decomposed fine roots. The ratio of d to FRP varied with sampling intervals (Figure 5), even though d did not change across different time intervals in either method (Figure 4). The variation in the ratio was attributed to variation in FRP. For example, the ratio between T2 and T3 in the differential method was extremely high when FRP was very low. Thus, the contribution of d might increase when FRP is low.
4.3. Impact of Sampling Interval on FRP Estimates
The timing of sampling considerably affected FRP in the both methods (Figure 4). Estimates of FRP based on T1 and T2 obtained in the first half year were higher than those from other sampling periods for either method (Figure 4). This variation was caused by a rapid increase in fine root biomass and fine root necromass between T1 and T2 (Figure 2a). Hishi and Takeda [38] reported a rapid increase in fine root biomass inside the ingrowth cores during the first year after installation but not during the second year of installation, in a Cryptomeria japonica forest in Japan. The authors examined the anatomical characteristics of the fine roots and found that the ratio of short-lived fine roots was higher in the first year and lower in the second year. A rapid increase in fine root biomass was also observed in a Eucalyptus plantation in Brazil [13]. The authors found that the specific root length sampled from the ingrowth cores after 2 months of installation (60.3 m g−1) was about three times higher than that in undisturbed soils (21.7 m g−1). Consequently, the authors suggested that a substantial proportion of fine roots found in ingrowth cores had a longevity of less than three months. Therefore, the characteristics of fine root biomass that grows in a short period after installation differ to those outside the cores. In comparison, previous studies of temperate and boreal forests have reported low fine root production using ingrowth cores over a short time period [7,26]. For example, fine root production in the first three months was much lower than that incubated for 12 months in an oak woodland in California [39]. The authors suggested that disturbance effects, such as low newly colonizing root systems, cause the slower growth documented during short-term measurements. Steele et al. [6] found that FRP estimated following 2 years of ingrowth cores was still lower than that estimated by minirhizotrons because of the slow rates of root recolonization in the root-free cores for aspen, jack pine and black spruce forests. Although it is not known why different responses were observed in previous studies, fine root growth characteristics might be different between inside and outside the cores during the first year after installation.
We observed lower fine root biomass and higher fine root necromass at T4 compared to that recorded outside the cores (Figure 2b). Consequently, the ratio of fine root biomass to fine root necromass at T4 (1.47 ± 0.28) did not reach the ratio recorded outside the cores (3.47 ± 0.42, Figure 3). The ratio in the boreal forest was 6.16 during the first year of ingrowth cores and 1.05 during the second year of ingrowth cores, which was comparable to that recorded outside (0.94, [7]). No noticeable differences in fine root necromass were recorded inside the ingrowth cores after 1, 2 and 3 months of installation in Eucalyptus plantations in Brazil [13]. Compared to these studies, the ratio of live fine roots to necromass in the ingrowth cores of the current study was very low. A rapid increase in short-lived fine roots appeared to occur during the first half of the year, after which many roots might have died over a short period. The high fine root necromass production during the first half of the year produced a lower ratio of fine root biomass to fine root necromass than that recorded by previous studies. Even though the response of roots to the installation of the cores differed across studies, the FRP estimate following 6-months of core installation might not be representative.
There was little seasonality in temperature and rainfall in the study forest [25]; therefore, there was no clear seasonal variation in litterfall, flowering and stem growth [40,41]. Although these results imply no seasonality in root growth, Kho et al. [5] reported that fine root production increased during relatively wet periods and decreased during relatively dry periods in a tropical rainforest in Borneo. Previous studies in Amazonian forests also reported that root growth increased with soil water content [4]. In the present study, fine root biomass in the cores rapidly increased between T1 and T2 during the drier period (Figure 1). The timing of root growth during the present study differed to that documented in previous studies; therefore, the rapid increase in fine root biomass and fine root necromass between T1 and T2 might be driven by the disturbance effect, rather than the effect of root growth phenology.
4.4. Impact of the Calculation Methods on FRP Estimates
When using the simple method, FRP estimates were higher at T0–T1 and T0–T2 compared to the other sampling times (i.e., T0–T3 and T0–T4, Figure 4). Higher FRP was attributed to a rapid increase in root biomass during the first half of the year. In the simple method, root biomass inside the cores was regarded as production and the impact of disturbance was not eliminated. Estimates of FRP using the simple method with a sampling interval of more than 1 year might decrease the impact of disturbance, leading the FRP estimate being comparable with that obtained by the differential method (Figure 4). Therefore, using the simple method with an incubation period of more than 1 year might be reasonable but d should be considered because it contributes to FRP (14.7% for T0–T3 and 19.4% for T0–T4).
4.5. Uncertainties
The level of replication of ingrowth cores and root litter bags was small in the present study. For example, the number of ingrowth cores at a given sampling time in the present study (six cores for three plots) was smaller than that in previous studies (i.e., 12 cores per plot, [13]). In the present study, when using data on fine root biomass in the cores, the minimum number of sample cores required to estimate the mean with a 20% error of the mean biomass based on the 95% Student’s t-value [42] was 30 (range: 23 to 38) for each sampling interval. Consequently, the present study did not meet the required minimum sampling number, that is, fewer cores were used (12 in total). As a result, the FRP estimates in the present study might have errors. In addition, the FRP differs between clay and sandy loam in Lambir Hills National Park [43]. The study site in the present study was located on a ridge area where sandy loam has been detected. Therefore, it is necessary to examine FRP with more replications across various soil environmental conditions to obtain representative FRP estimates of this forest.
5. Conclusions
This study confirmed that decomposed roots contribute to FRP estimates when using the ingrowth core method. Overlooking root decomposition during incubation in ingrowth cores may underestimate FRP up to 25%. FRP estimates differed with sampling interval and calculation methods. FRP estimates using data obtained during the first half of the year after installation was not stable because of the disturbance effect, with a rapid increase in fine root biomass and necromass being documented. Consequently, it might be difficult to examine seasonal variation in FRP using ingrowth core methods because of the disturbance effect. Therefore, the scanner or minirhizotron method might be a better approach for examining seasonality in fine root growth. Thus, by combining the scanner method and ingrowth method over a 12 month sampling interval might be the most objective way of examining fine root dynamics.
Author Contributions
Conceptualization, A.K. and M.O.; Methodology, A.K. and N.M.; Investigation, A.K., L.K.K., N.M., K.M., T.K. and M.O.; Data Curation, A.K.; Writing—Original Draft Preparation, A.K.; Writing—Review & Editing, N.M., T.K. and M.O.; Project Administration, M.O.; Funding Acquisition, A.K. and M.O.
Funding
This study was supported by Grants-in-Aid for Scientific Research from the JSPS KAKENHI (grant numbers JP25304027, JP16H02762 and 15K07467).
Acknowledgments
We are grateful to the staff at the Forest Department and Forest Research Center, Sarawak, Malaysia and Ichioka (Kyoto University) for giving us the opportunity to conduct this study in Lambir Hills National Park. We thank Takuo Hishi (Kyushu University) for helpful comments.
Conflicts of Interest
The authors declare no conflict of interest.
References
- Luyssaert, S.; Inglima, I.; Jung, M.; Richardson, A.D.; Reichstein, M.; Papale, D.; Piao, S.L.; Schulze, E.D.; Wingate, L.; Matteucci, G.; et al. CO2 balance of boreal, temperate, and tropical forests derived from a global database. Glob. Change Biol. 2007, 13, 2509–2537. [Google Scholar] [CrossRef]
- Malhi, Y. The productivity, metabolism and carbon cycle of tropical forest vegetation. J. Ecol. 2012, 100, 65–75. [Google Scholar] [CrossRef]
- Finér, L.; Ohashi, M.; Noguchi, K.; Hirano, Y. Fine root production and turnover in forest ecosystems in relation to stand and environmental characteristics. For. Ecol. Manag. 2011, 262, 2008–2023. [Google Scholar] [CrossRef]
- Metcalfe, D.B.; Meir, P.; Aragão, L.E.O.C.; Da Costa, A.C.L.; Braga, A.P.; Gonçalves, P.H.L.; De Athaydes Silva, J., Jr.; de Almeida, S.S.; Dawson, L.A.; Malhi, Y.; et al. The effects of water availability on root growth and morphology in an Amazon rainforest. Plant Soil. 2008, 311, 189–199. [Google Scholar] [CrossRef]
- Kho, L.K.; Malhi, Y.; Tan, S.K.S. Annual budget and seasonal variation of aboveground and belowground net primary productivity in a lowland dipterocarp forest in Borneo. J. Geophys. Res. Biogeosci. 2013, 118, 1282–1296. [Google Scholar] [CrossRef] [Green Version]
- Steele, S.J.; Gower, S.T.; Vogel, J.G.; Norman, J.M. Root mass, net primary production and turnover in aspen, jack pine and black spruce forests in Saskatchewan and Manitoba, Canada. Tree Physiol. 1997, 17, 577–587. [Google Scholar] [CrossRef] [PubMed]
- Ostonen, I.; Lõhmus, K.; Pajuste, K. Fine root biomass, production and its proportion of NPP in a fertile middle-aged Norway spruce forest: Comparison of soil core and ingrowth core methods. For. Ecol. Manag. 2005, 212, 264–277. [Google Scholar] [CrossRef]
- Hendricks, J.J.; Hendrick, R.L.; Wilson, C.A.; Mitchell, R.J.; Pecot, S.D.; Guo, D. Assessing the patterns and controls of fine root dynamics: An empirical test and methodological review. J. Ecol. 2006, 94, 40–57. [Google Scholar] [CrossRef]
- Osawa, A.; Aizawa, R. A new method to estimating fine root production, mortality, and decomposition using litterbag experiments and soil core. Plant Soil. 2012, 355, 167–181. [Google Scholar] [CrossRef]
- Li, X.; Zhu, J.; Lange, H.; Han, S. A modified ingrowth core method for measuring fine root production, mortality and decomposition in forests. Tree Physiol. 2013, 33, 18–25. [Google Scholar] [CrossRef]
- Parton, W.; Silver, W.L.; Burke, I.C.; Grassens, L.; Harmon, M.E.; Currie, W.S. Global-scale similarities in nitrogen release patterns during long-term decomposition. Science 2007, 315, 361–364. [Google Scholar] [CrossRef] [PubMed]
- Vogt, K.A.; Vogt, D.J.; Bloomfield, J. Analysis of some direct and indirect methods for estimating root biomass and production of forests at an ecosystem level. Plant Soil. 1998, 200, 71–89. [Google Scholar] [CrossRef]
- Jourdan, C.; Silva, E.V.; Gonçalves, J.L.M.; Ranger, J.; Moreira, R.M.; Laclau, J.-P. Fine root production and turnover in Brazilian Eucalyptus plantations under contrasting nitrogen fertilization regimes. For. Ecol. Manag. 2008, 256, 396–404. [Google Scholar] [CrossRef]
- Kumagai, T.; Saitoh, T.M.; Sato, Y.; Takahashi, H.; Manfroi, O.J.; Morooka, T.; Kuraji, K.; Suzuki, M.; Yasunari, T.; Komatsu, H. Annual water balance and seasonality of evapotranspiration in a Bornean tropical rainforest. Agric. For. Meteorol. 2005, 128, 81–92. [Google Scholar] [CrossRef]
- Paoli, G.D.; Curran, L.M.; Slik, L.W.F. Soil nutrients affect spatial patterns of aboveground biomass and emergent tree density in southwestern Borneo. Oecologia 2008, 155, 287–299. [Google Scholar] [CrossRef] [PubMed]
- Katayama, A.; Kume, T.; Ohashi, M.; Matsumoto, K.; Nakagawa, M.; Saito, T.; Kumagai, T.; Otsuki, K. Characteristics of wood CO2 efflux in a Bornean tropical rainforest. Agric. For. Meteorol. 2016, 220, 190–199. [Google Scholar] [CrossRef]
- Malhi, Y.; Doughty, C.; Galbraith, D. The allocation of ecosystem net primary productivity in tropical forests. Philos. Trans. Roy. Soc. B 2011, 366, 3225–3245. [Google Scholar] [CrossRef] [Green Version]
- Katayama, A.; Kume, T.; Komatsu, H.; Ohashi, M.; Nakagawa, M.; Yamashita, M.; Otsuki, K.; Suzuki, M.; Kumagai, T. Effect of forest structure on the spatial variation in soil respiration in a Bornean tropical rain forest. Agric. For. Meteorol. 2009, 149, 1666–1673. [Google Scholar] [CrossRef]
- Katayama, A.; Kume, T.; Komatsu, H.; Saitoh, T.; Ohashi, M.; Nakagawa, M.; Suzuki, M.; Otsuki, K.; Kumagai, T. Carbon allocation in a Bornean tropical rainforest without dry seasons. J. Plant Res. 2013, 126, 505–515. [Google Scholar] [CrossRef]
- Ashton, P.S.; Hall, P. Comparisons of structure among mixed dipterocarp forests of north-western Borneo. J. Ecol. 1992, 80, 459–481. [Google Scholar] [CrossRef]
- King, D.A.; Davies, S.J.; Tan, S.; Nur Supardi, M.N. Trees approach gravitational limits to height in tall lowland forests of Malaysia. Funct. Ecol. 2009, 23, 284–291. [Google Scholar] [CrossRef] [Green Version]
- Lee, H.S.; Davies, S.J.; LaFrankie, J.V.; Tan, S.; Yamakura, T.; Itoh, A.; Ohkubo, T.; Ashton, O. Floristic and structural diversity of mixed dipterocarp forests in Lambir Hills National Park, Sarawak, Malaysia. J. Trop. For. Sci. 2002, 14, 379–400. [Google Scholar]
- Ishizuka, S.; Tanaka, S.; Sakurai, K.; Hirai, H.; Hirotani, K.; Ogino, K.; Lee, H.S.; Kedawang, J.J. Characterization and distribution of soils at Lambir Hills National Park in Sarawak, Malaysia, with special reference to soil hardness and soil texture. Tropics 1998, 8, 31–44, (In Japanese with English summary). [Google Scholar] [CrossRef]
- Sakurai, K. Soils and agriculture in Borneo. Tropics 1999, 9, 27–40, (In Japanese with English summary). [Google Scholar] [CrossRef]
- Kume, T.; Tanaka, N.; Kuraji, K.; Komatsu, H.; Yoshifuji, N.; Saitoh, T.M.; Suzuki, M.; Kumagai, T. Ten-year evapotranspiration estimates in a Bornean tropical rainforest. Agric. For. Meteorol. 2011, 151, 1183–1192. [Google Scholar] [CrossRef]
- Makkonen, K.; Helmisaari, H.S. Assessing fine-root biomass and production in a Scots pine stand-comparison of soil core and root ingrowth core methods. Plant Soil. 1999, 210, 43–50. [Google Scholar] [CrossRef]
- Addo-Danso, S.D.; Prescott, C.E.; Smith, A.R. Methods for estimating root biomass and production in forest and woodland ecosystem carbon studies: A review. For. Ecol. Manag. 2016, 359, 332–351. [Google Scholar] [CrossRef]
- Da Costa, A.C.L.; Metcalfe, D.B.; Doughty, C.E.; de Oliveira, A.A.R.; Neto, G.F.C.; da Costa, M.C.; de Athaydes Silva Junior, J.; Aragão, L.E.O.C.; Almeida, S.; Galbraith, D.R.; et al. Ecosystem respiration and net primary productivity after 8–10 years of experimental through-fall reduction in an eastern Amazon forest. Plant Ecol. Div. 2013, 7, 7–24. [Google Scholar] [CrossRef]
- Doughty, C.E.; Metcalfe, D.B.; da Costa, M.C.; de Oliveira, A.A.R.; Neto, G.F.C.; Silva, J.A.; Aragão, L.E.O.C.; Almeida, S.A.; Quesada, C.A.; Girardin, C.A.J.; et al. The production, allocation and cycling of carbon in a forest on fertile terra preta soil in eastern Amazonia compared with a forest on adjacent infertile soil. Plant Ecol. Div. 2013, 7, 41–53. [Google Scholar] [CrossRef]
- Doughty, C.E.; Malhi, Y.; Araujo-Murakami, A.; Metcalfe, D.B.; Silva-Espejo, J.E.; Arroyo, L.; Heredia, J.P.; Pardo-Toledo, E.; Mendizabal, L.M.; RojasLandivar, V.D.; et al. Allocation trade-offs dominate the response of tropical forest growth to seasonal and interannual drought. Ecology 2014, 95, 2192–2201. [Google Scholar] [CrossRef] [PubMed]
- Malhi, Y.; Amezquita, F.F.; Doughty, C.E.; Silva-Espejo, J.E.; Girardin, C.A.J.; Metcalfe, D.B.; Aragao, L.E.O.C.; Huaraca-Quispe, L.P.; Alzamora-Taype, I.; Eguiluz-Mora, L.; et al. The productivity, metabolism and carbon cycle of two lowland tropical forest plots in south-western Amazonia, Peru. Plant. Ecol. Div. 2014, 7, 85–105. [Google Scholar] [CrossRef]
- Malhi, Y.; Doughty, C.E.; Goldsmith, G.R.; Metcalfe, D.B.; Girardin, C.A.; Marthews, T.R.; del Aguila-Pasquel, J.; Aragão, L.E.; Araujo-Murakami, A.; Brando, P.; et al. The linkages between photosynthesis, productivity, growth and biomass in lowland Amazonian forests. Glob. Change Biol. 2015, 21, 2283–2295. [Google Scholar] [CrossRef] [PubMed]
- Malhi, Y.; Aragão, L.E.O.C.; Metcalfe, D.B.; Paiva, R.; Quesada, C.A.; Almeida, S.; Anderson, L.; Brando, P.; Chambers, J.Q.; Costa, A.C.L.; et al. Comprehensive assessment of carbon productivity, allocation and storage in three Amazonian forests. Glob. Change Biol. 2009, 15, 1255–1274. [Google Scholar] [CrossRef]
- Van Do, T.; Sato, T.; Kozan, O. A new approach for estimating fine root production in forests: A combination of ingrowth core and scanner. Trees 2015, 30, 545–554. [Google Scholar] [CrossRef]
- Silver, W.L.; Miya, R.K. Global patterns in root decomposition: Comparisons of climate and litter quality effects. Oecologia 2001, 129, 407–419. [Google Scholar] [CrossRef] [PubMed]
- Zhang, X.; Wang, W. The decomposition of fine and coarse roots: Their global patterns and controlling factors. Sci. Rep. 2015, 5, 9440. [Google Scholar] [CrossRef]
- Litton, C.M.; Giardina, C.P. Below-ground carbon flux and partitioning: Global patterns and response to temperature. Funct. Ecol. 2008, 22, 941–954. [Google Scholar] [CrossRef]
- Hishi, T.; Takeda, H. Life cycles of individual roots in fine root system of Chamaecyparis obtusa Sieb. et Zucc. J. For. Res. 2005, 10, 181–187. [Google Scholar] [CrossRef]
- Cheng, X.; Bledsoe, C.S. Contrasting seasonal patterns of fine root production for blue oaks (Quercus douglasii) and annual grasses in California oak woodland. Plant Soil. 2002, 240, 263–274. [Google Scholar] [CrossRef]
- Ichie, T.; Hiromi, T.; Yoneda, R.; Kamiya, K.; Kohira, M.; Ninomiya, I.; Ogino, K. Short-term drought causes synchronous leaf shedding and flushing in a lowland mixed dipterocarp forest; Sarawak; Malaysia. J. Trop. Ecol. 2004, 20, 697–700. [Google Scholar] [CrossRef]
- Sakai, S.; Harrison, R.D.; Momose, K.; Kuraji, K.; Nagamasu, H.; Yasunari, T.; Chong, L.; Nakashizuka, T. Irregular droughts trigger mass flowering in aseasonal tropical forests in Asia. Am. J. Bot. 2006, 93, 1134–1139. [Google Scholar] [CrossRef] [PubMed]
- Ohashi, M.; Kumagai, T.; Kume, T.; Gyokusen, K.; Saitoh, T.M.; Suzuki, M. Characteristics of soil CO2 efflux variability in a seasonal tropical rainforest in Borneo Island. Biogeochemistry 2008, 90, 275–289. [Google Scholar] [CrossRef]
- Kochsiek, A.; Tan, S.; Russo, S.E. Fine root dynamics in relation to nutrients in oligotrophic Bornean rain forest soils. Plant Ecol. 2013, 214, 869–882. [Google Scholar] [CrossRef]
Figure 1.
Air temperature and 30-day cumulative rainfall with the timing of core sampling during the study period.
Figure 1.
Air temperature and 30-day cumulative rainfall with the timing of core sampling during the study period.

Figure 2.
Temporal variation in (a) fine root biomass and (b) fine root necromass inside the cores between sampling time T1 and T4. Different letters indicate significant differences among the sampling times (p < 0.05). Standard errors are indicated (n = 3). Dashed lines indicate fine and dead root biomass outside the cores (968.7 ± 32.9, 288.8 ± 40.0 g m−2, respectively).

Figure 3.
Ratio of fine root biomass to fine root necromass inside the cores at T1 to T4. Standard errors are indicated (n = 3). Dashed line indicates the ratio of fine to dead root biomass outside the cores (3.47 ± 0.42).
Figure 3.
Ratio of fine root biomass to fine root necromass inside the cores at T1 to T4. Standard errors are indicated (n = 3). Dashed line indicates the ratio of fine to dead root biomass outside the cores (3.47 ± 0.42).

Figure 4.
Fine root biomass (ΔB), fine root necromass (ΔN), decomposed dead fine roots (d) and fine root production (FRP) over various sampling times using (a) the differential method and (b) the simple method. Different letters indicate significant differences among sampling times (p < 0.05). Note that, as ΔB between T2 and T3 were negative, they were assigned as zero, because negative values are not possible in ecology [9].

Figure 5.
Ratio of decomposed dead fine roots (d) to fine root production (FRP) estimated by (a) the differential method and (b) the simple method for various sampling times.
Figure 5.
Ratio of decomposed dead fine roots (d) to fine root production (FRP) estimated by (a) the differential method and (b) the simple method for various sampling times.


Table 1.
Each component of NPP (mean ± standard error, MgC ha−1 year−1) and the fraction of NPPfr to NPPtotal.
Table 1.
Each component of NPP (mean ± standard error, MgC ha−1 year−1) and the fraction of NPPfr to NPPtotal.
| NPPfr | NPPacw | NPPlitterfall | NPPtotal | NPPfr/NPPtotal | Reference | |
|---|---|---|---|---|---|---|
| Malaysia, Lambir | 4.25 ± 0.84 | 3.74 ± 0.29 | 3.02 ± 0.36 | 11.01 ± 0.96 | 0.39 | This study, [19] |
| Malaysia, Lambir | 1.96–1.96 | 2.87–4.17 | 5.99–7.89 | 10.82 | 0.18 | [5] |
| Brazil, Caxiuana | 3.89 ± 0.80 | 2.55 ± 0.06 | 2.94 ± 0.04 | 9.38 ± 0.80 | 0.41 | [28] |
| Brazil, Cax06 | 3.68 ± 0.52 | 3.02 ± 0.30 | 5.03 ± 0.07 | 11.73 ± 0.60 | 0.31 | [29] |
| Bolivia, KEN01 | 4.03 ± 0.47 | 5.27 ± 0.31 | 6.20 ± 1.09 | 15.5 ± 1.23 | 0.26 | [30] |
| KEN02 | 3.04 ± 0.34 | 3.61 ± 0.23 | 4.62 ± 0.90 | 11.27 ± 0.99 | 0.27 | |
| Peru, TAM05 | 4.54 ± 0.71 | 2.41 ± 0.24 | 5.39 ± 0.35 | 12.34 ± 0.83 | 0.37 | [31] |
| TAM06 | 2.11 ± 0.31 | 2.49 ± 0.25 | 4.94 ± 0.40 | 9.54 ± 0.56 | 0.22 | |
| ALP01 | 3.02 ± 0.29 | 2.54 ± 0.25 | 4.70 ± 0.86 | 10.26 ± 0.94 | 0.37 | [32] |
| ALP30 | 3.50 ± 0.38 | 2.76 ± 0.28 | 6.42 ± 0.81 | 12.68 ± 0.94 | 0.34 | |
| Average | 3.40 ± 0.87 | 3.13 ± 0.88 | 4.93 ± 1.20 | 11.45 ± 1.79 | 0.31 ± 0.08 |
© 2019 by the authors. Licensee MDPI, Basel, Switzerland. This article is an open access article distributed under the terms and conditions of the Creative Commons Attribution (CC BY) license (http://creativecommons.org/licenses/by/4.0/).
Share and Cite
MDPI and ACS Style
Katayama, A.; Kho, L.K.; Makita, N.; Kume, T.; Matsumoto, K.; Ohashi, M. Estimating Fine Root Production from Ingrowth Cores and Decomposed Roots in a Bornean Tropical Rainforest. Forests 2019, 10, 36. https://doi.org/10.3390/f10010036
AMA Style
Katayama A, Kho LK, Makita N, Kume T, Matsumoto K, Ohashi M. Estimating Fine Root Production from Ingrowth Cores and Decomposed Roots in a Bornean Tropical Rainforest. Forests. 2019; 10(1):36. https://doi.org/10.3390/f10010036
Chicago/Turabian StyleKatayama, Ayumi, Lip Khoon Kho, Naoki Makita, Tomonori Kume, Kazuho Matsumoto, and Mizue Ohashi. 2019. "Estimating Fine Root Production from Ingrowth Cores and Decomposed Roots in a Bornean Tropical Rainforest" Forests 10, no. 1: 36. https://doi.org/10.3390/f10010036
Note that from the first issue of 2016, this journal uses article numbers instead of page numbers. See further details here.