3.1. Lodgepole pine results
For lodgepole pine ages 9 and 15 were used to explore age-shift changes over the measured period (
Table 1).
Table 1.
Age-shift values calculated for lodgepole pine at stand ages 9 and 15 for volume, diameter, and height.
Table 1.
Age-shift values calculated for lodgepole pine at stand ages 9 and 15 for volume, diameter, and height.
| | Age-shift |
| Treatment | Volume per ha | Diameter | Height |
| Yr 9 | Yr 15 | Yr 9 | Yr 15 | Yr 9 | Yr 15 |
| Bedding Plow | 1.4 | 1.9 | 2.4 | 3.5 | 1.4 | 2.5 |
| Bräcke Mineral Mound | 1.1 | 2.4 | 0.5 | 1.3 | 0.0 | 0.8 |
| Patch Shoulder | 1.0 | 1.9 | 0.5 | 1.4 | 0.1 | 0.6 |
| Breaking Plow | 0.6 | -0.8 | 1.0 | 1.5 | 0.8 | 1.8 |
| Burn | 2.0 | 4.3 | 3.1 | 4.9* | 1.8 | 2.6 |
| Delta Berm Hinge | 1.4 | 2.5 | 1.3 | 2.1 | 0.8 | 1.4 |
| Delta Furrow | 0.1 | -1.5 | -1.2 | -1.2 | -1.0 | -0.9 |
| Wadell Hinge | 1.3 | 2.8 | 1.4 | 2.7 | 0.8 | 1.8 |
| Untreated | - | - | - | - | - | - |
| *Yr 14 | | | | | | |
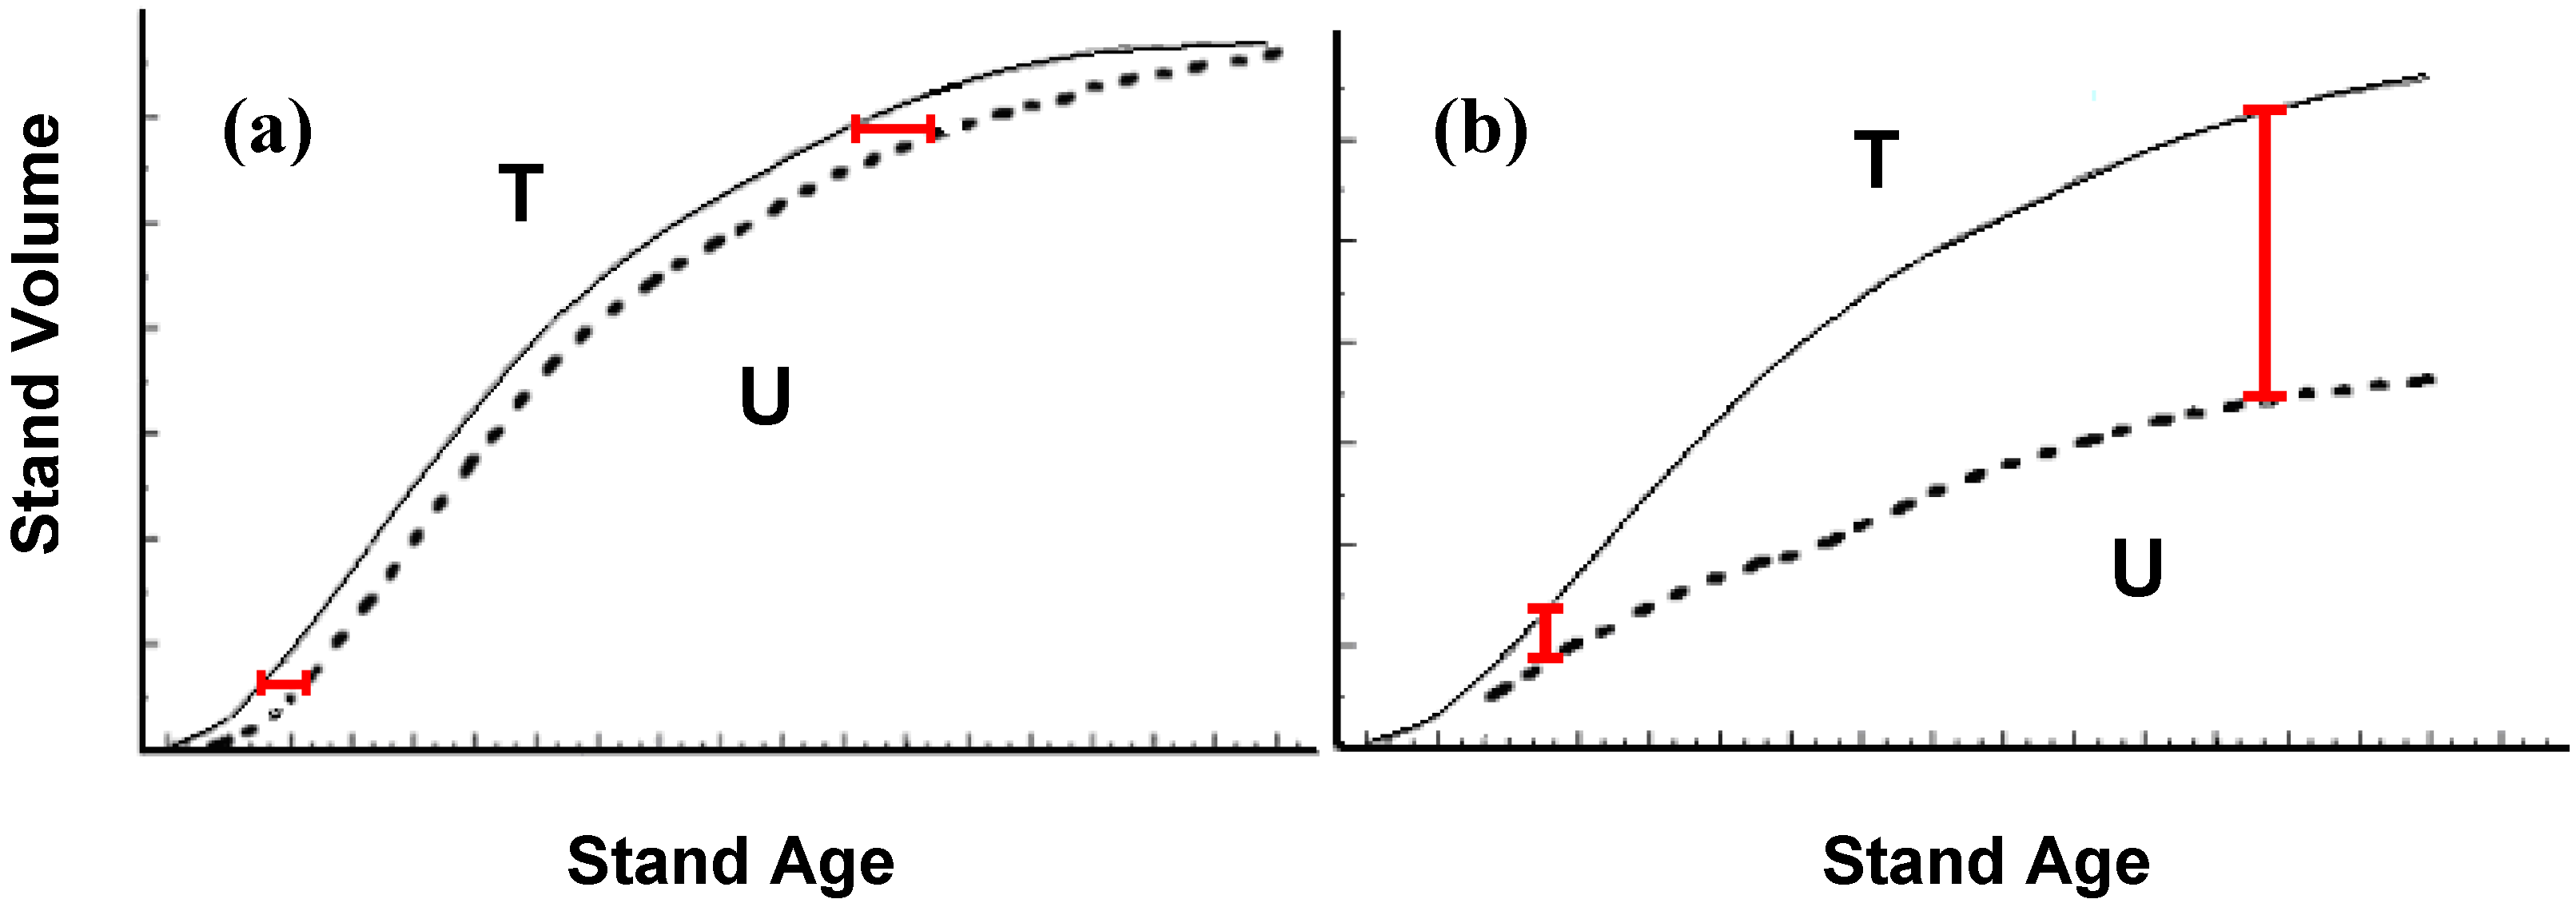
The smallest age-shift value calculated is -1.5 years for the delta furrow treatment at age 15, indicating that volume growth in this case is slower than that of the untreated, while the largest age-shift value calculated is 4.9 years for diameter in the burn treatment at age 15, indicating faster diameter growth compared to the untreated. For every treatment, age-shift values calculated from diameter are larger than those related to height, and values calculated at age 15 are substantially larger than values calculated at age 9. The burn treatment is consistently the best treatment while the delta furrow treatment shows the worst performance compared to the untreated.
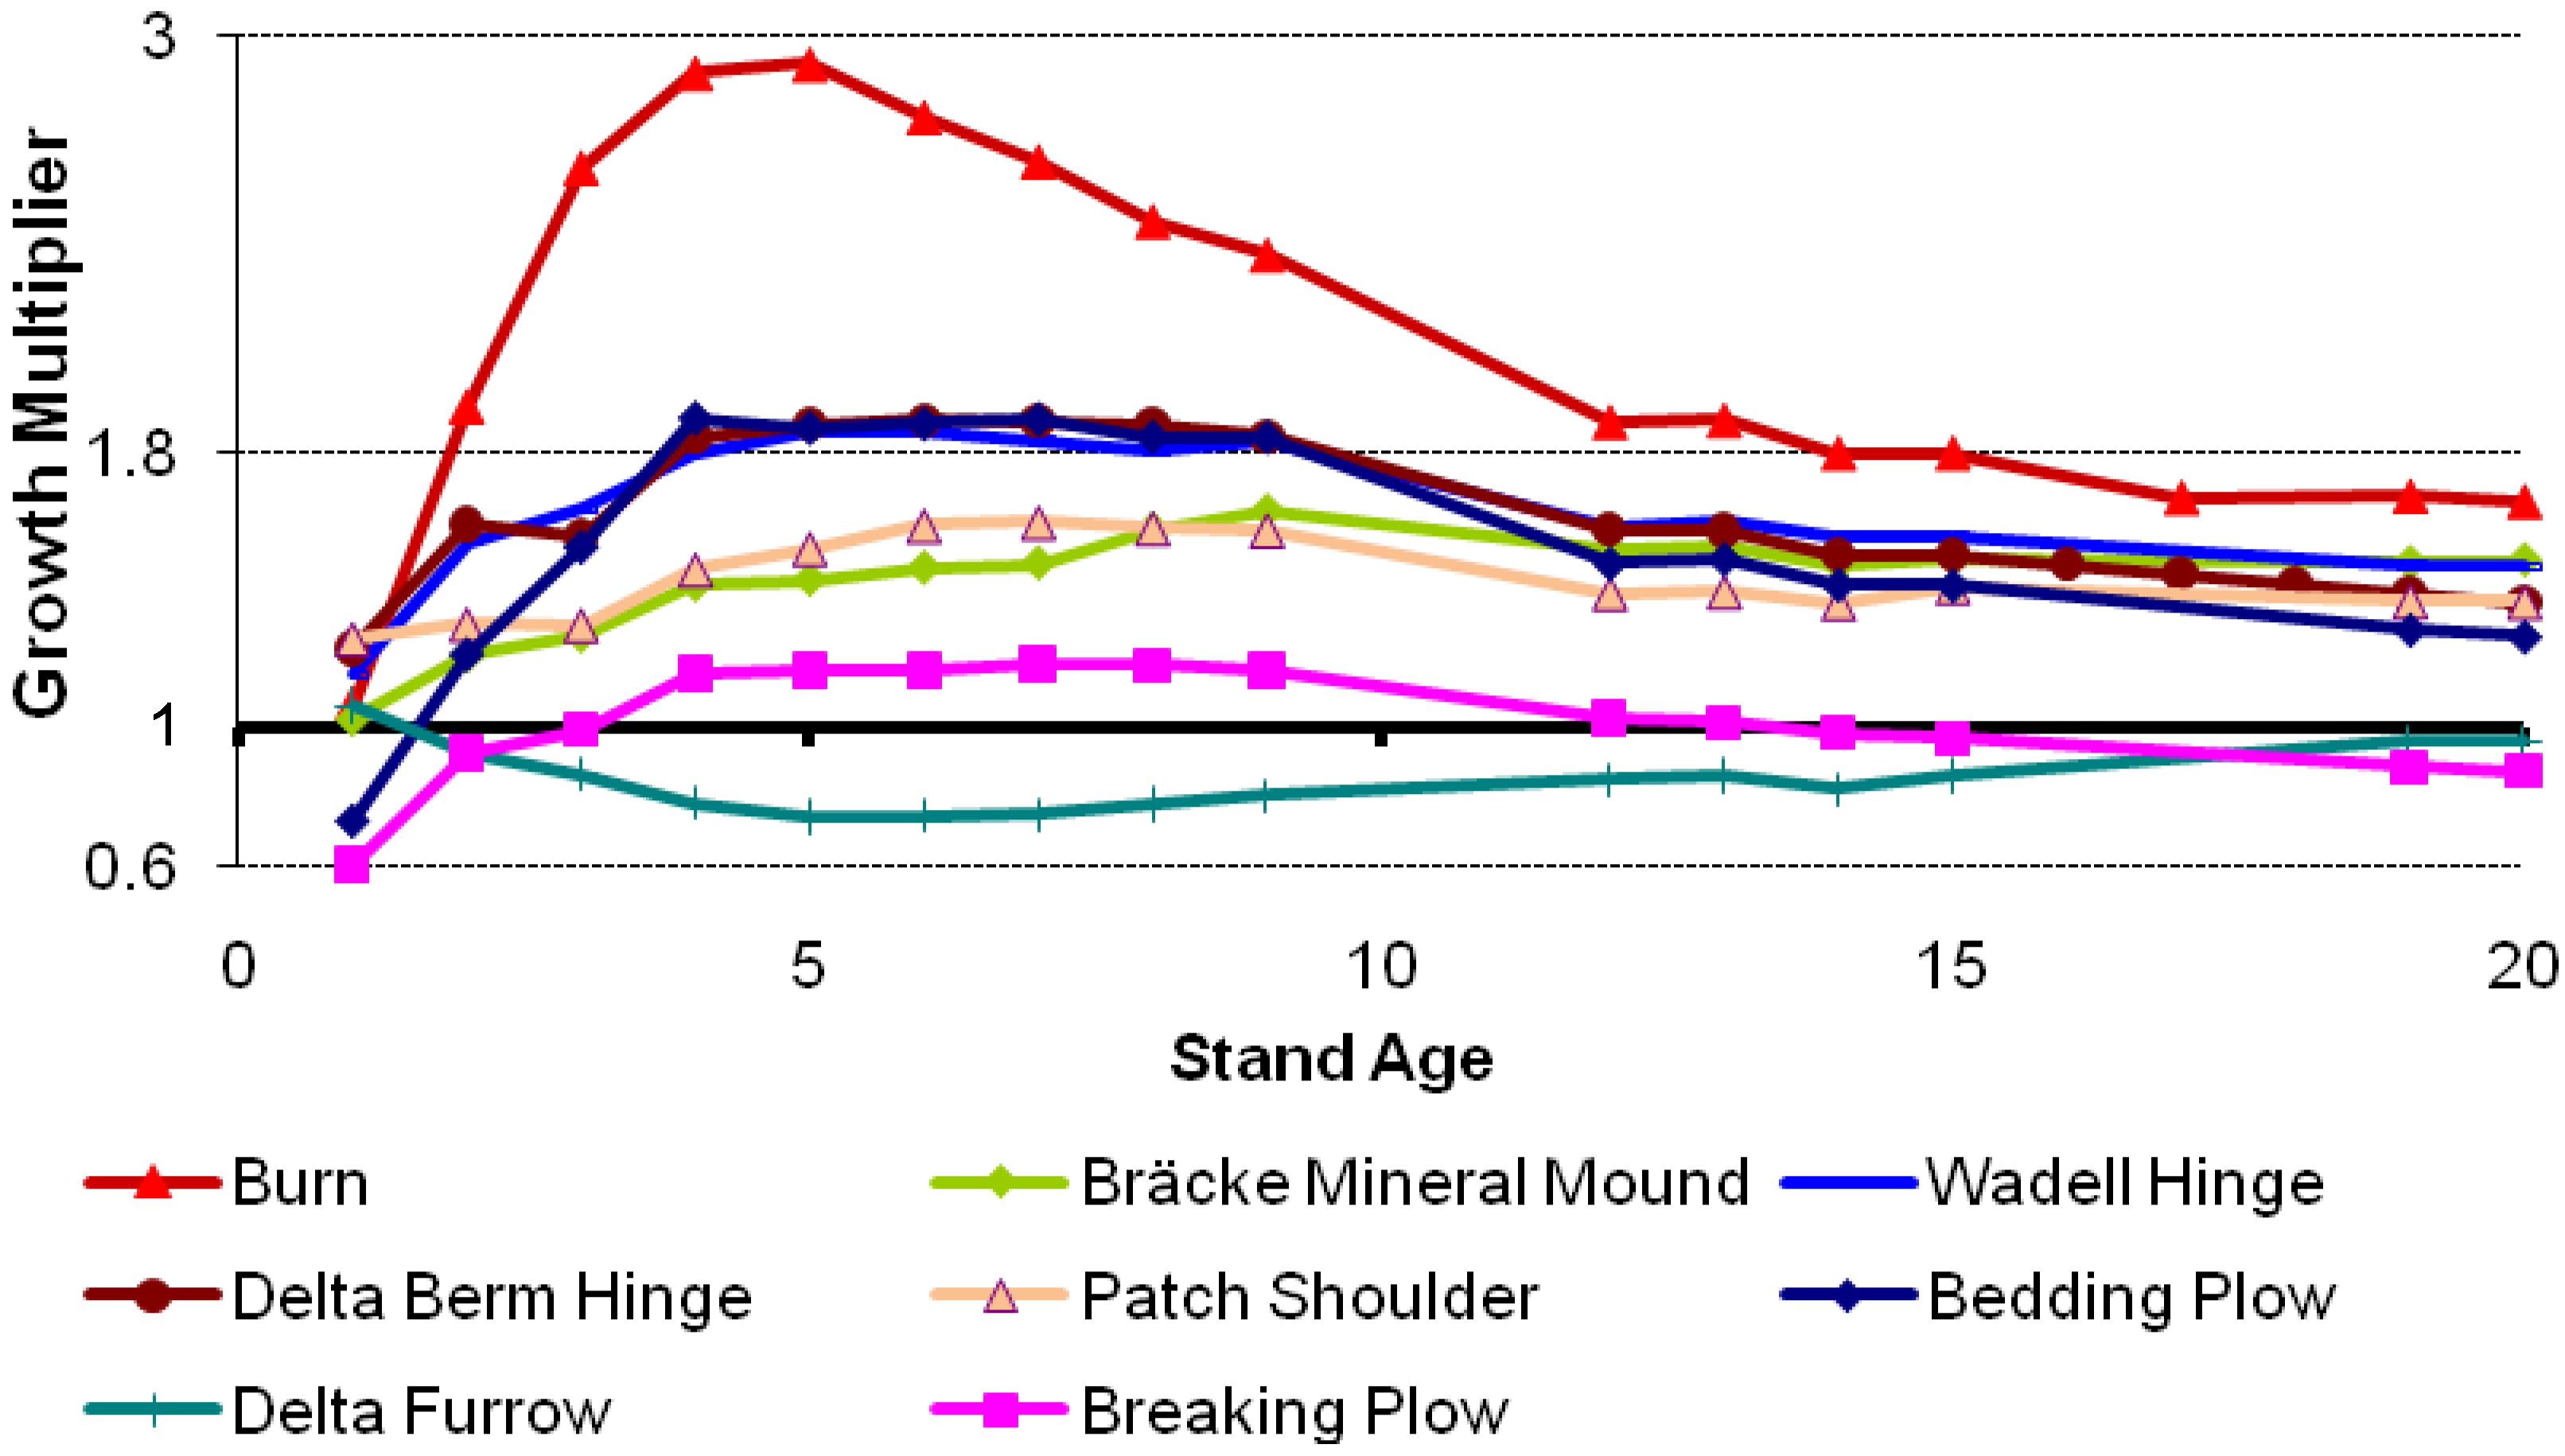
Growth multipliers were compared at stand ages 9, 15, and 20. Volume multipliers range between 0.9x (delta furrow) and 1.7x (burn) at age 20. For every treatment the growth multipliers for diameter are consistently higher than those related to height. Growth multipliers also indicate that the burn treatment is the more productive compared to the untreated, and the delta furrow is the least productive. Every treatment shows an initial shift in growth compared to the untreated, but after age 5, treatments tend to follow growth patterns similar to that of the untreated (
Figure 2).
Figure 2.
Changes in growth multipliers for lodgepole pine stem volume (m3 ha-1) with age for treatments applied at the Bednesti site.
Figure 2.
Changes in growth multipliers for lodgepole pine stem volume (m3 ha-1) with age for treatments applied at the Bednesti site.
Every treatment (except the delta furrow treatment) shows a decreasing growth multiplier factor from year 9 to year 20. Growth multipliers calculated at ages 4-8 for all treatments (except the delta furrow treatment) are higher than values obtained at ages 18-20. For the burn treatment the multiplier is 2.9x at age 5 but declines to 1.7x at age 20.
The site index adjustments show that site index values are fairly constant at the treatment level and the changes from age 9 to 20 range from -0.6 (patch shoulder) to 0.7 m (mineral mound and untreated) (
Table 2).
At year 20 the bedding plow treatment shows the highest site index value compared to the untreated (0.8 m difference); and again the delta furrow is the worst performing treatment compared to the untreated (-0.4 m difference).
The growth estimates for lodgepole pine provided by TASS/TIPSY show small differences at age 90 between treatments and untreated. Volume growth multipliers were calculated from age 27 forward and results show that each treatment converges by age 90 to the untreated.
Table 2.
Site index adjustments calculated for lodgepole pine at stand ages 9, 15 and 20.
Table 2.
Site index adjustments calculated for lodgepole pine at stand ages 9, 15 and 20.
| | Site Index | Difference with Untreated |
| Treatment |
| Yr 9 | Yr 15 | Yr 20 | Yr 9 | Yr 15 | Yr 20 |
| Bedding Plow | 22.4 | 22.2 | 22.2 | 1.6 | 0.8 | 0.8 |
| Bräcke Mineral Mound | 21.1 | 21.8 | 21.8 | 0.4 | 0.5 | 0.4 |
| Patch Shoulder | 22.0 | 21.8 | 21.4 | 1.3 | 0.5 | 0.0 |
| Breaking Plow | 21.6 | 21.9 | 21.8 | 0.9 | 0.6 | 0.4 |
| Burn | 22.0 | 21.9 | 22.1 | 1.3 | 0.5 | 0.7 |
| Delta Berm Hinge | 22.0 | 21.7 | 21.6 | 1.2 | 0.3 | 0.3 |
| Delta Furrow | 21.1 | 20.4 | 21.0 | 0.4 | -1.0 | -0.4 |
| Wadell Hinge | 21.7 | 22.4 | 22.0 | 1.0 | 1.1 | 0.6 |
| Untreated | 20.7 | 21.4 | 21.4 | - | - | - |
Maximum mean annual increment (MAI) occurs on average at stand age 55.6 and corresponds to average merchantable volume of 284 m
-3ha
-1 and top height of 20 m (
Table 3).
The bedding plow and the breaking plow treatment reach maximum MAI earlier than the untreated and the other treatments with resulting age-shifts of 7 and 2 years, respectively. They are represented in both cases by a 1.1 growth multiplier factor. The narrow range of growth multiplier values (i.e., 0.9-1.1) indicates that model estimates of volume for every treatment at culmination are within 10% of that of the untreated.
Table 3.
Results from TASS simulations of lodgepole pine at age of maximum mean annual increment (MAI).
Table 3.
Results from TASS simulations of lodgepole pine at age of maximum mean annual increment (MAI).
| Treatment | Age at Max MAI | Merch.Vol. m3 ha-1 | Age-shift from Untreated | Growth Multiplier | Top Height m |
| Bedding Plow | 48 | 258 | 7 | 1.1 | 18.5 |
| Bräcke Mineral Mound | 59 | 300 | -4 | 1 | 20.7 |
| Patch Shoulder | 62 | 299 | -7 | 1 | 20.9 |
| Breaking Plow | 53 | 284 | 2 | 1.1 | 20 |
| Burn | 55 | 292 | 0 | 1 | 20.5 |
| Delta Berm Hinge | 56 | 279 | -1 | 1 | 20.2 |
| Delta Furrow | 56 | 271 | -1 | 1 | 18.7 |
| Wadell Hinge | 57 | 296 | -2 | 0.9 | 20.6 |
| Untreated | 55 | 275 | - | - | 20.1 |
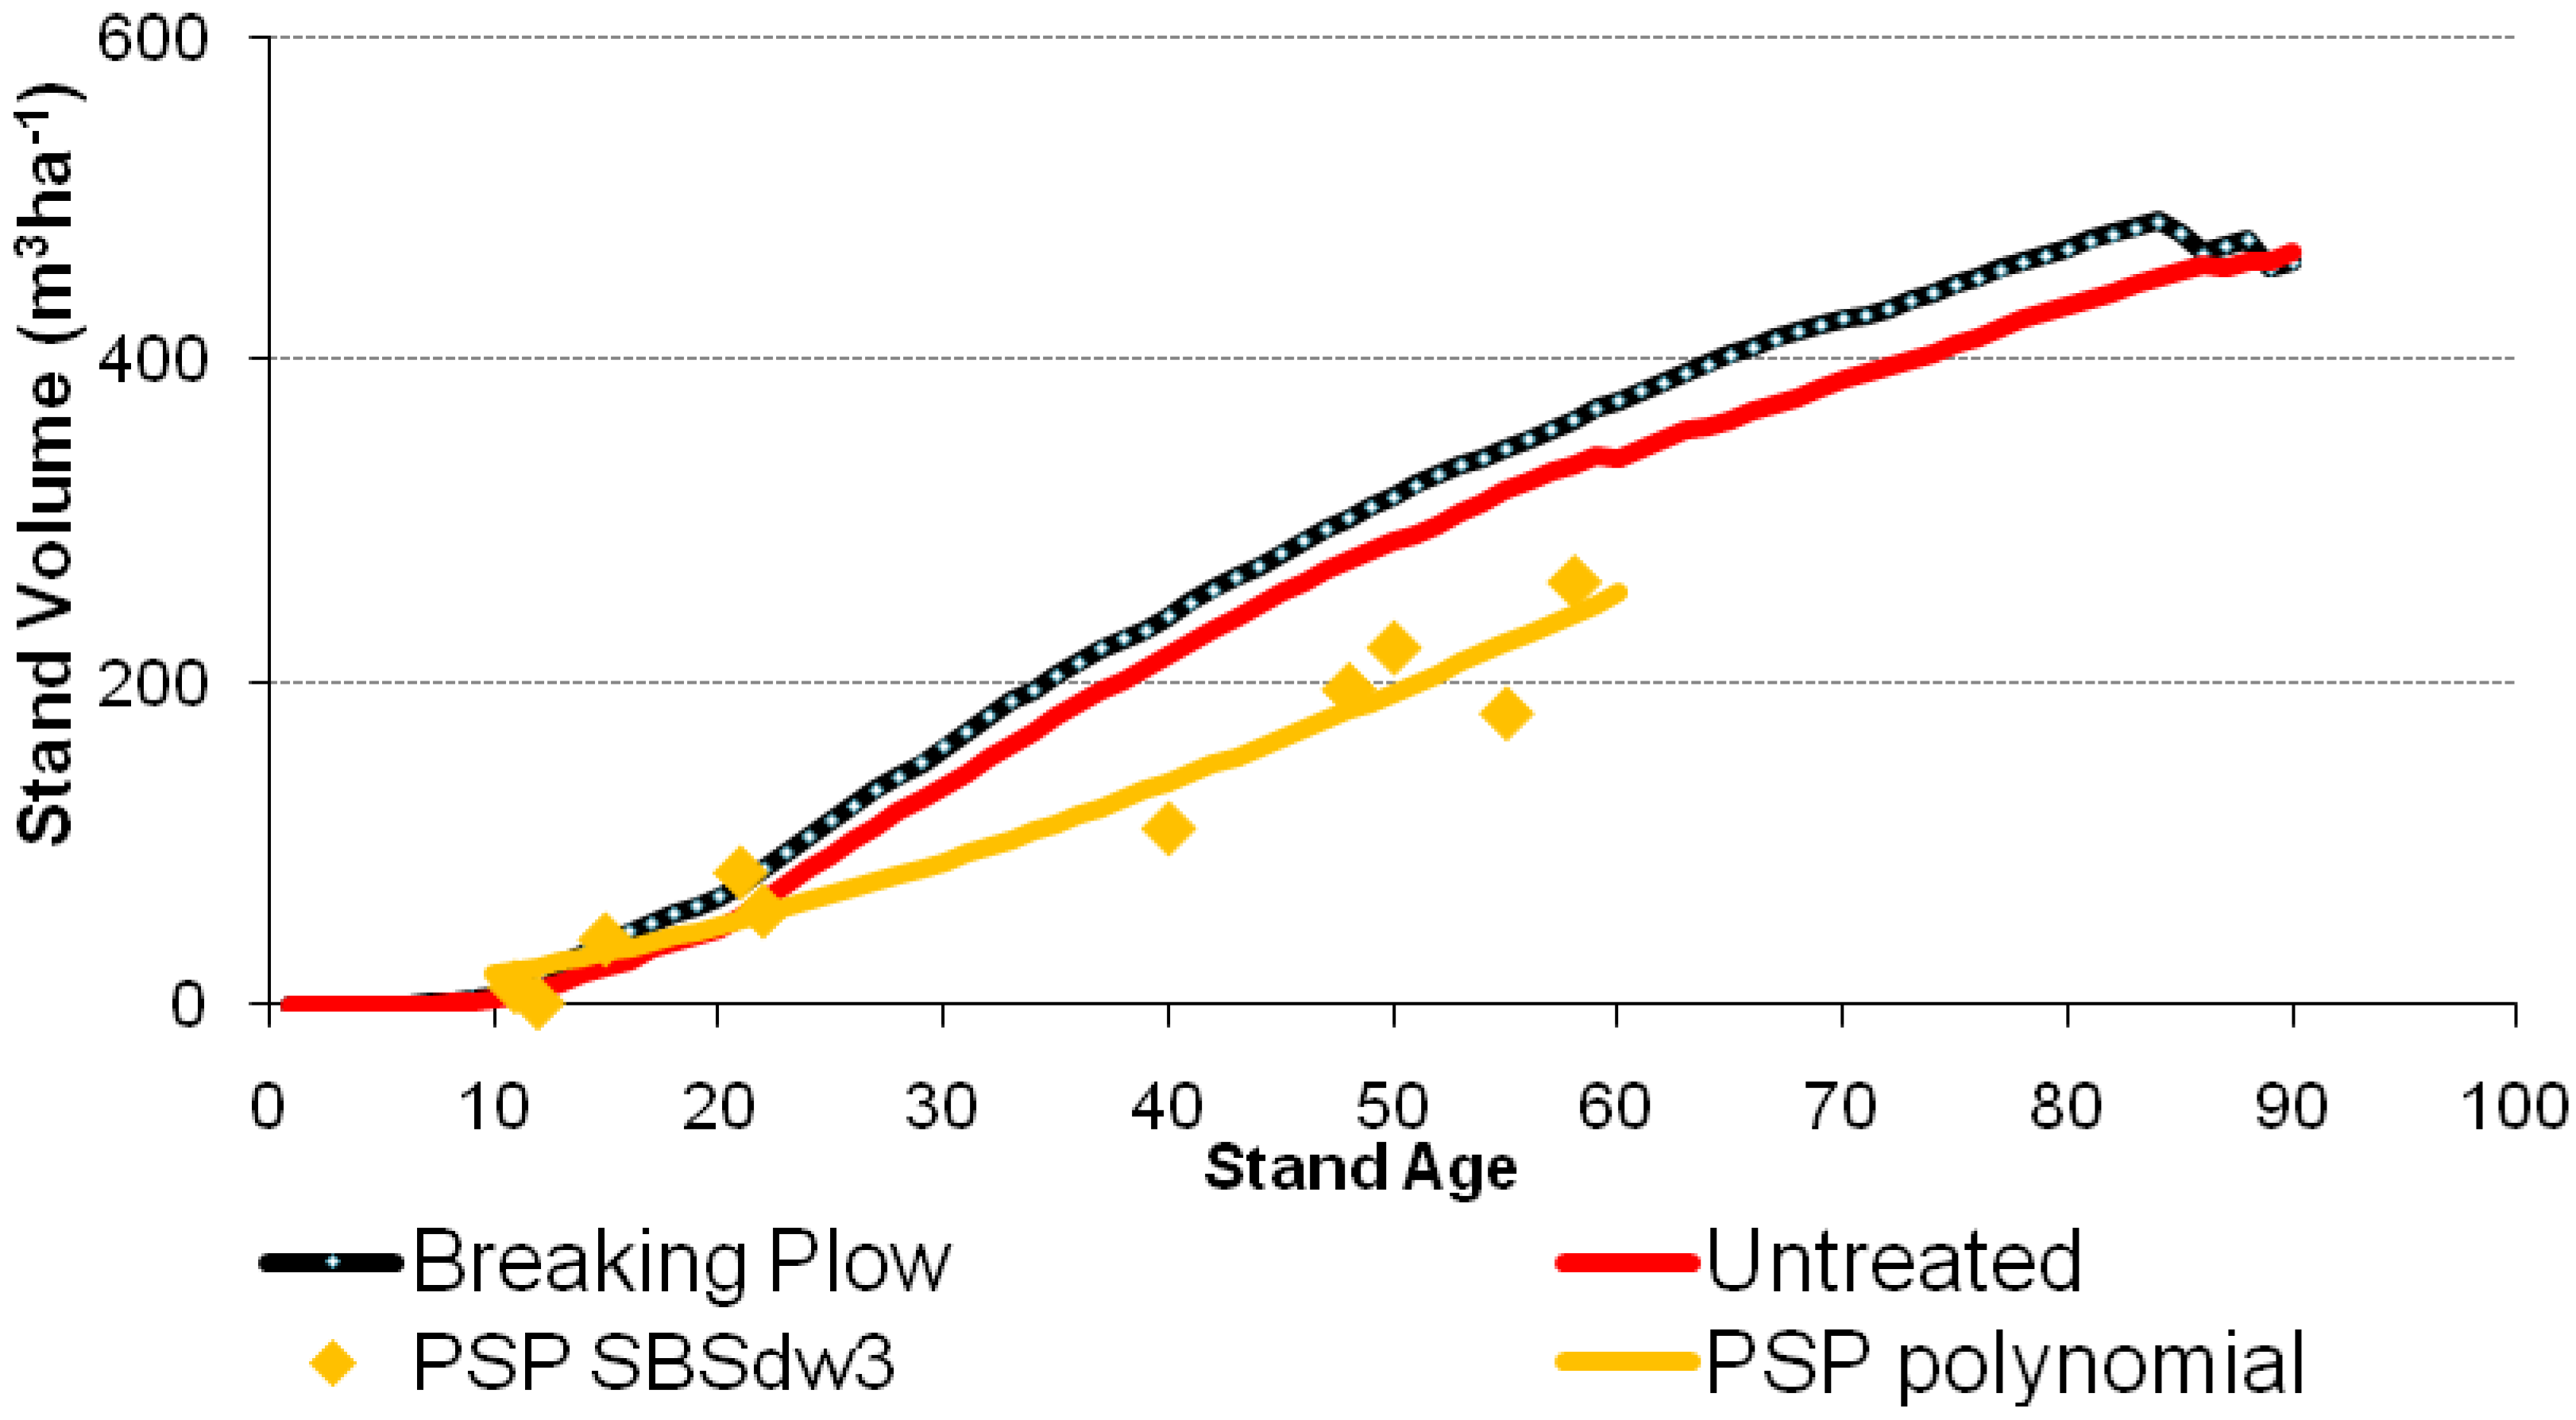
For lodgepole pine, the PSP data indicates that the projections provided by TASS/TIPSY are representative of young naturally regenerated stands (up-to stand age 20), but overestimate the growth of natural stands after age 40 (
Figure 3). According to the projections at stand age 60 every treatment shows a growth multiplier factor of either 1.0 or 1.1 indicating a marginal or small treatment effect (
Table 4).
Lodgepole pine information provided by the recent cut blocks in the same forest district indicates an average merchantable volume of 260 m
3 ha
-1 (age-class: 81-100) and the latest available survey indicates an average crown closure of 62% (
Table 5). For these cut blocks the merchantable volume relative to that projected by TASS (at 100% crown closure) is 62% which is the same value as the averaged crown closure for the selected cut blocks.
Figure 3.
Projected stand volume over stand age for lodgepole pine for the best treatment (breaking plow) and the untreated scenario. The PSP data represents measured volume of natural stands in the same biogeoclimatic subzone and variant (SBSdw3). The polynomial fitting the PSP data is represented by: Y =1.27554*X+0.06359*X2-0.00023*X3 (n=10; Adj.R2=0.96; P<0.0001).
Table 4.
Stand yield data from TASS simulations to age 60 for lodgepole pine together with growth multiplier values.
Table 4.
Stand yield data from TASS simulations to age 60 for lodgepole pine together with growth multiplier values.
| Treatment | Stand Age | Density Trees ha-1 | Total Volume m3 ha-1 | Merch.Vol. m3 ha-1 | Basal Area m3 ha-1 | Top Height m | Growth Multiplier |
| Bedding Plow | 60 | 1185 | 372 | 327 | 47.2 | 21 | 1.1 |
| Bräcke Mineral Mound | 60 | 964 | 344 | 306 | 45.3 | 20.8 | 1 |
| Patch Shoulder | 60 | 1015 | 327 | 288 | 44.4 | 20.6 | 1 |
| Breaking Plow | 60 | 1426 | 375 | 324 | 48.6 | 21.3 | 1.1 |
| Burn | 60 | 1073 | 360 | 319 | 46.1 | 21.5 | 1.1 |
| Delta Berm Hinge | 60 | 1052 | 341 | 301 | 45.7 | 21 | 1 |
| Delta Furrow | 60 | 1060 | 330 | 290 | 44.5 | 19.4 | 1 |
| Wadell Hinge | 60 | 1064 | 353 | 312 | 46.1 | 21.2 | 1 |
| Untreated | 60 | 1133 | 339 | 298 | 45.1 | 21 | - |
Table 5.
Merchantable volumes from recently harvested cut blocks of pure lodgepole pine for the Prince George Forest District (DPG) (Source: Database of Revenue Branch, and RESULTS database of Forest Practices Branch, BC Ministry of Forests and Range).
Table 5.
Merchantable volumes from recently harvested cut blocks of pure lodgepole pine for the Prince George Forest District (DPG) (Source: Database of Revenue Branch, and RESULTS database of Forest Practices Branch, BC Ministry of Forests and Range).
| | | | | | | | | | Latest Survey |
| Latitude, Longitude | BEC Zone | Merch. Volume m3 | Harvested Year | Pine % | Age-Class | Area ha | Merch. Volume m3 ha-1 | Year | Pine % | Crown Closure % | Trees ha-1 | Site Index m |
| 54° 13' 8.4" N, 123° 16' 4.8" W | SBS | 23064 | 2009 | 83 | 81-100 | 99 | 232 | 2001 | 100 | 60 | 1042 | 19 |
| 54° 14' 28.2" N, 123° 30' 11" W | SBS | 19077 | 2009 | 80 | 81-100 | 75 | 254 | 2003 | 100 | 70 | 790 | 19 |
| 54° 13' 17.8" N, 123° 18' 32" W | SBS | 28994 | 2009 | 86 | 81-100 | 105 | 276 | 2001 | 100 | 60 | 1042 | 19 |
| 54° 14' 47.9" N, 123° 29' 4.3" W | SBS | 31917 | 2009 | 93 | 81-100 | 114 | 279 | 2001 | 90 | 60 | 1045 | 18 |
| | Average Values: | 260 | | 62 | | |
3.2. White spruce results
For white spruce stand ages 6 and 11 were selected to compare age-shift values over the measured period (
Table 6). Age-shift values range from 0.3 years for the herbicide treatment at age 6, indicating that height growth in this case is close to that of the untreated, to 10.9 years for the burn treatment at age 11, indicating much faster volume growth compared to that of the untreated. The burn treatment is consistently the best treatment and the delta hinge is by far the worst in comparison to the untreated. For the majority of the treatments age-shift values for diameter are higher than those related to height and values calculated at age 11 are larger than at age 6 except for volume per hectare for the delta hinge treatment.
Table 6.
Age-shift values calculated for white spruce at stand ages 6 and 11 for volume, diameter, and height.
Table 6.
Age-shift values calculated for white spruce at stand ages 6 and 11 for volume, diameter, and height.
| | Age-shift |
| Treatment | Volume per ha | Diameter | Height |
| Yr 6 | Yr 11 | Yr 6 | Yr 11 | Yr 6 | Yr 11 |
| Bedding Plow | 1.9 | 3.7 | 1.5 | 6.4 | 1.6 | 7.0 |
| Breaking Plow | 2.5 | 7.1 | 4.0 | 9.2* | 2.8 | 10.0 |
| Burn | 2.8 | 10.9 | 4.3 | 8.3** | 2.4 | 10.1 |
| Delta Hinge | 1.9 | 1.1 | 0.7 | 1.4 | 0.7 | 2.5 |
| Herbicide | 1.8 | 9.3 | 0.6 | 7.8** | 0.3 | 8.2 |
| Madge | 2.3 | 6.0 | 2.3 | 10.4* | 1.8 | 7.8 |
| Untreated | - | - | - | - | - | - |
| * Year 10 **Year 9 | | | | | | |
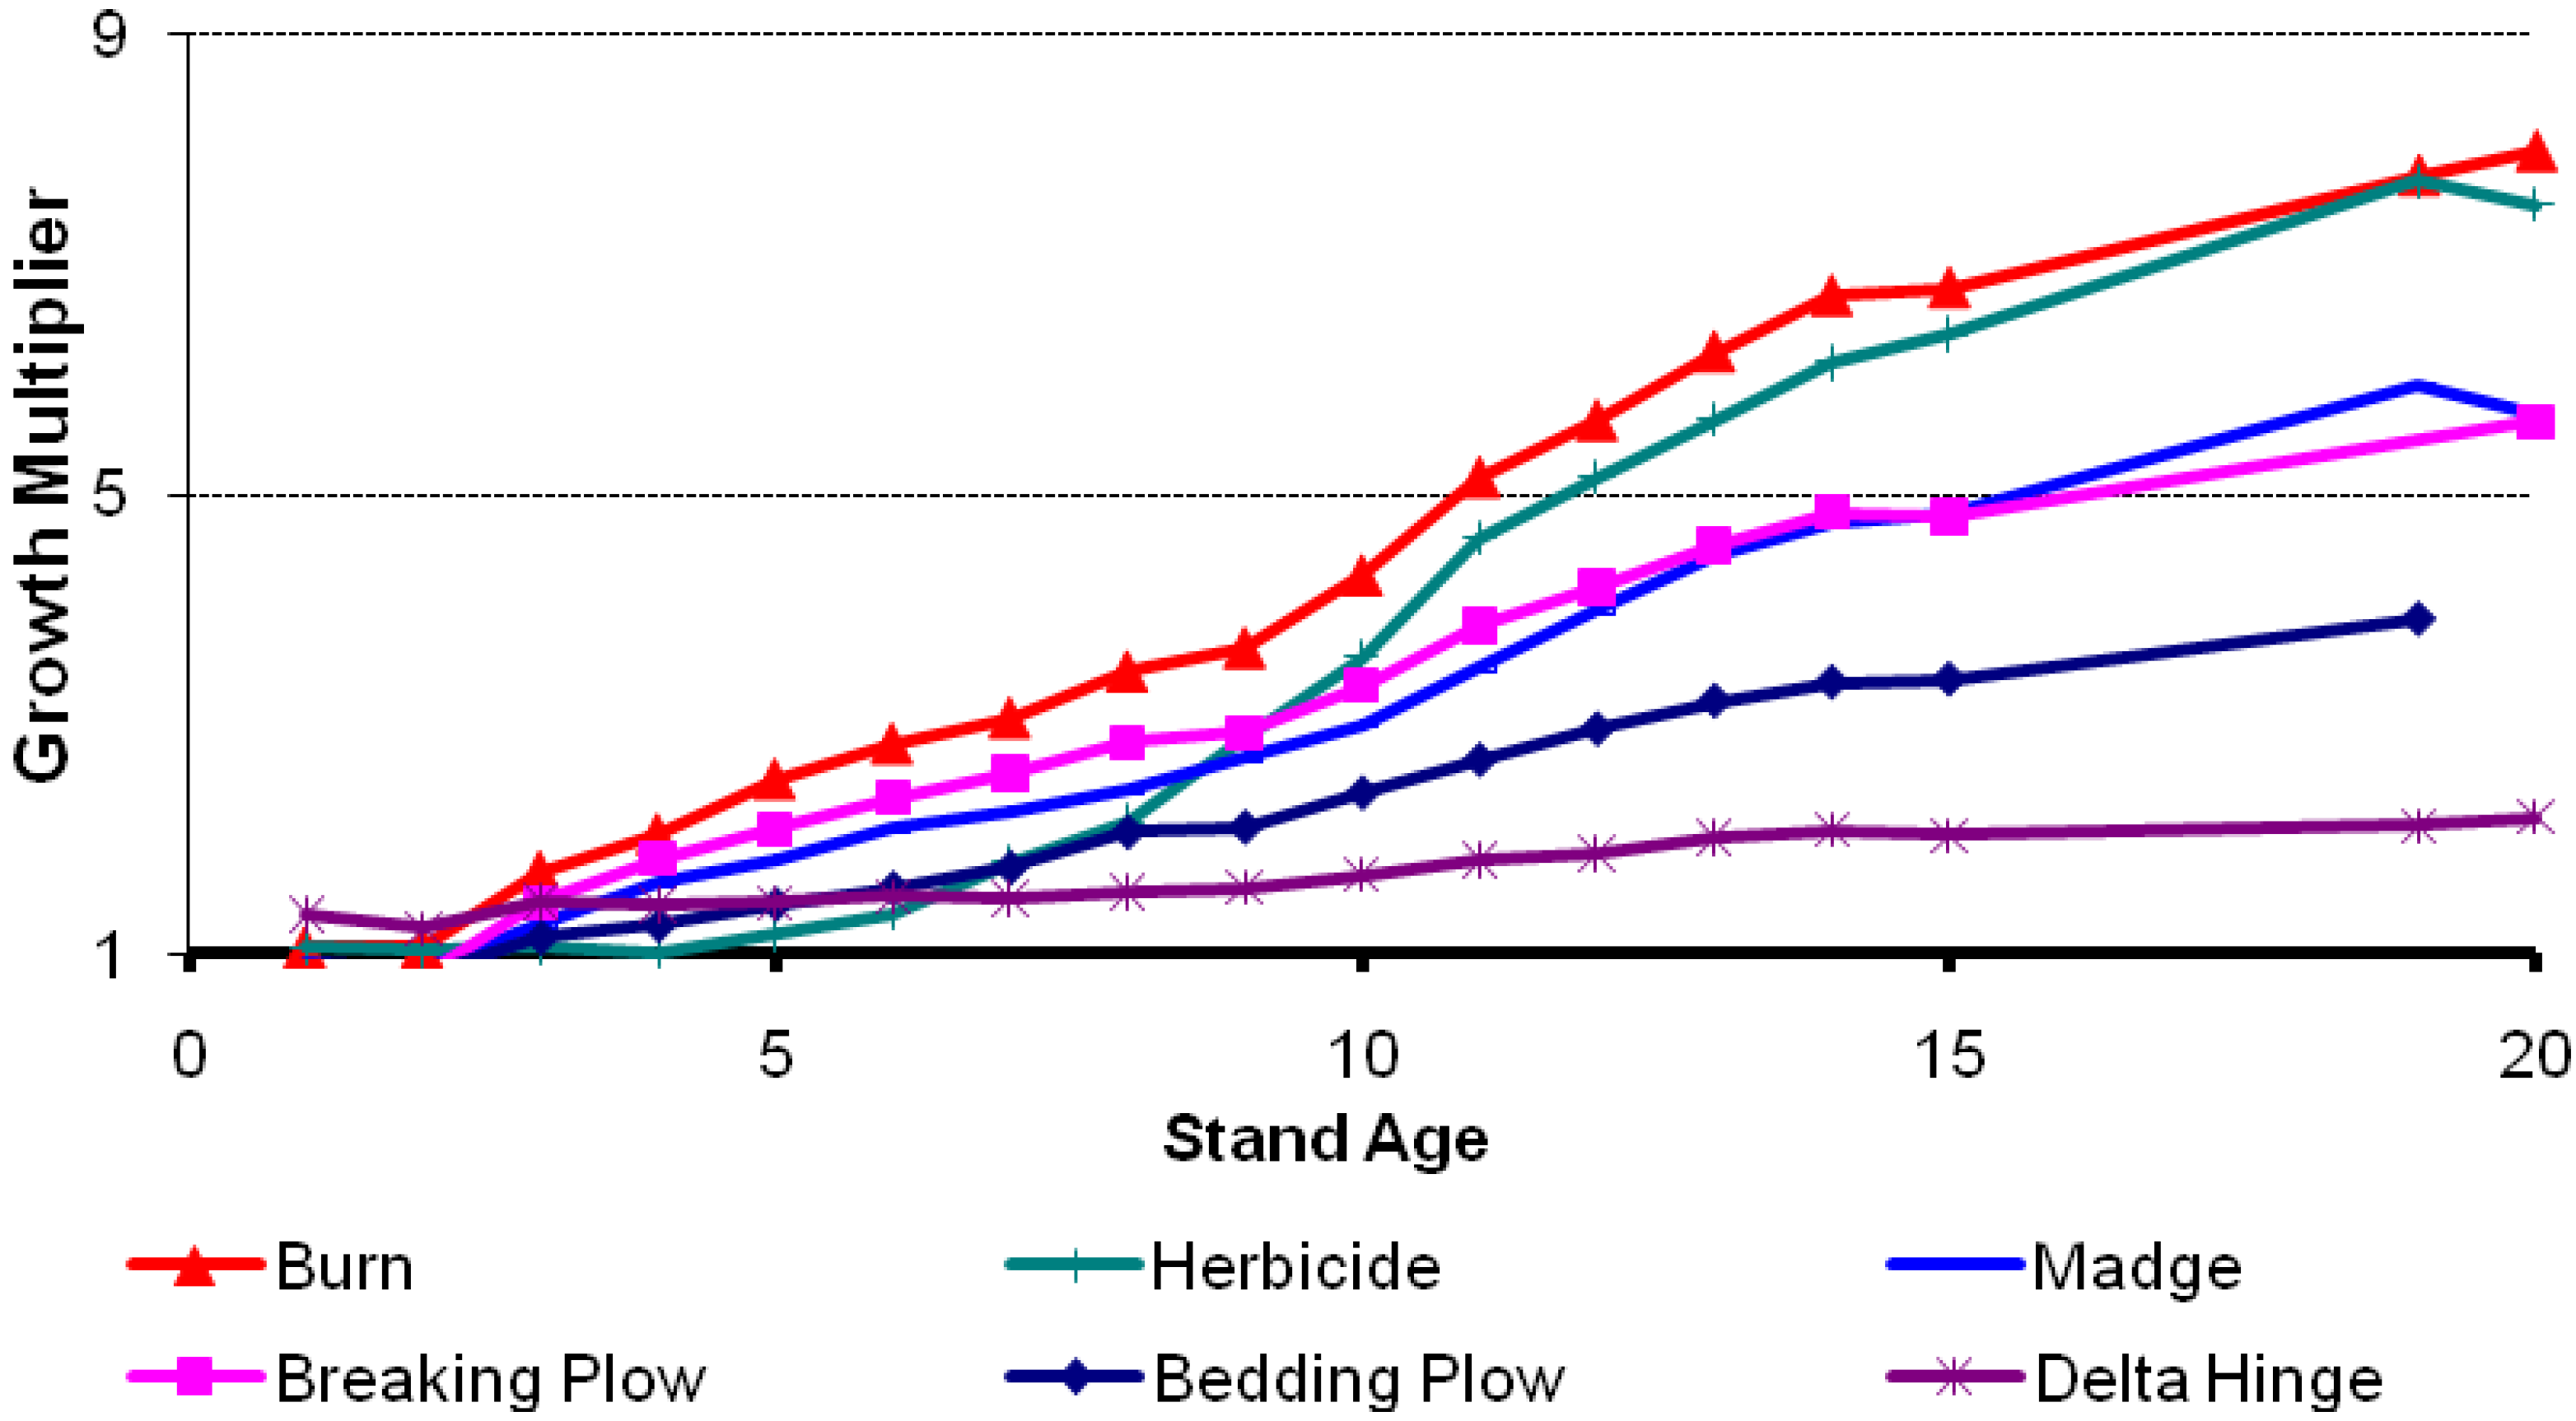
Growth multipliers were compared at ages 6, 11, and 20 and results show that the volume multiplier values range between 2.2x (delta hinge) and 8x (burn) at age 20. For the majority of the treatments, growth multipliers for diameter are higher than those related to height. Growth multipliers increase to age 20 and indicate that the treatment effect steadily enhances spruce growth up to age 20 compared to the untreated (
Figure 4).
The burn is overall the best treatment although the diameter values for the herbicide and the height values for the breaking plow treatment are similar to those for the burn. The delta hinge still represents the worst treatment in relation to the untreated.
The site index adjustments show that site index values decrease from age 11 to age 20 with differences between the two ages ranging from -0.8 (bedding plow) to -2.7 m (herbicide) (
Table 7).
At year 20 the herbicide shows the highest site index value (25.5) which is 6.5 m higher than that of the untreated. The worst treatment is the still the delta hinge with a site index equal to the untreated (19).
For white spruce the growth projections included three scenarios for the untreated plots and volume growth multipliers were calculated from age 27 on. For scenario A and B the growth curve of every treatment (except delta hinge) converges to the untreated scenario by age 85. For scenario C most treatments have a higher volume at age 85 than the untreated (1.3x) although the growth multiplier curve is gradually approaching a value of 1.0x.
Figure 4.
Changes in growth multipliers for white spruce stem volume (m3 ha-1) with age for treatments applied at the Inga Lake site.
Figure 4.
Changes in growth multipliers for white spruce stem volume (m3 ha-1) with age for treatments applied at the Inga Lake site.
Table 7.
Site index adjustments calculated for white spruce at stand ages 11 and 20.
Table 7.
Site index adjustments calculated for white spruce at stand ages 11 and 20.
| | Site Index | Difference with Untreated |
| Treatment |
| Yr 11 | Yr 20 | Yr 11 | Yr 20 |
| Bedding Plow | 25.3 | 24.5* | 4.4 | 5.5 |
| Breaking Plow | 25.3 | 24.1 | 4.4 | 5.1 |
| Burn | 25.6 | 24.7 | 4.7 | 5.7 |
| Delta Hinge | 21.1 | 19.0 | 0.2 | 0.0 |
| Herbicide | 28.2 | 25.5 | 7.3 | 6.5 |
| Madge | 26.5 | 24.7 | 5.6 | 5.7 |
| Untreated | 20.9 | 19.0 | - | - |
| * Yr 19 | | | | |
The maximum mean annual increment (MAI) for white spruce occurs at stand age 68.5 on average and corresponds to an average merchantable volume of 505 m
3ha
-1 and a top height of 27.3 m (
Table 8).
The bedding plow treatment reaches maximum MAI earlier (61) than the other treatments and the three projections for the three untreated scenarios; and the worst treatment is the delta hinge that reaches maximum MAI at age 86. The growth multiplier values indicate that a group of treatments (bedding plow, breaking plow, burn, herbicide, and madge) show similar MAI values while the delta hinge and the untreated (depending on the scenario) have lower MAIs.
Table 8.
Results from TASS simulations of white spruce at age of maximum mean annual increment (MAI) together with age-shift and growth multiplier values by scenarios.
Table 8.
Results from TASS simulations of white spruce at age of maximum mean annual increment (MAI) together with age-shift and growth multiplier values by scenarios.
| Treatment | Age at Max MAI | Merch.Vol. m3 ha-1 | Age-shift from Untreated | Growth Multiplier | Top Height m |
| Scenario | Scenario |
| A | B | C | A | B | C |
| Bedding Plow | 61 | 495 | 4 | 9 | 17 | 1 | 1.1 | 1.5 | 26.5 |
| Breaking Plow | 66 | 514 | -1 | 4 | 12 | 1 | 1.1 | 1.4 | 27.9 |
| Burn | 63 | 513 | 2 | 7 | 15 | 1 | 1.1 | 1.5 | 28 |
| Delta Hinge | 86 | 485 | -21 | -16 | -8 | 0.8 | 0.8 | 1 | 26.5 |
| Herbicide | 63 | 544 | 2 | 7 | 15 | 1.1 | 1.2 | 1.6 | 28.2 |
| Madge | 65 | 524 | 0 | 5 | 13 | 1 | 1.1 | 1.5 | 28.2 |
| Untreated: | | | | | | | | | |
| Scenario A | 65 | 513 | - | - | - | - | - | - | 27.6 |
| Scenario B | 70 | 513 | - | - | - | - | - | - | 27.6 |
| Scenario C | 78 | 445 | - | - | - | - | - | - | 25.2 |
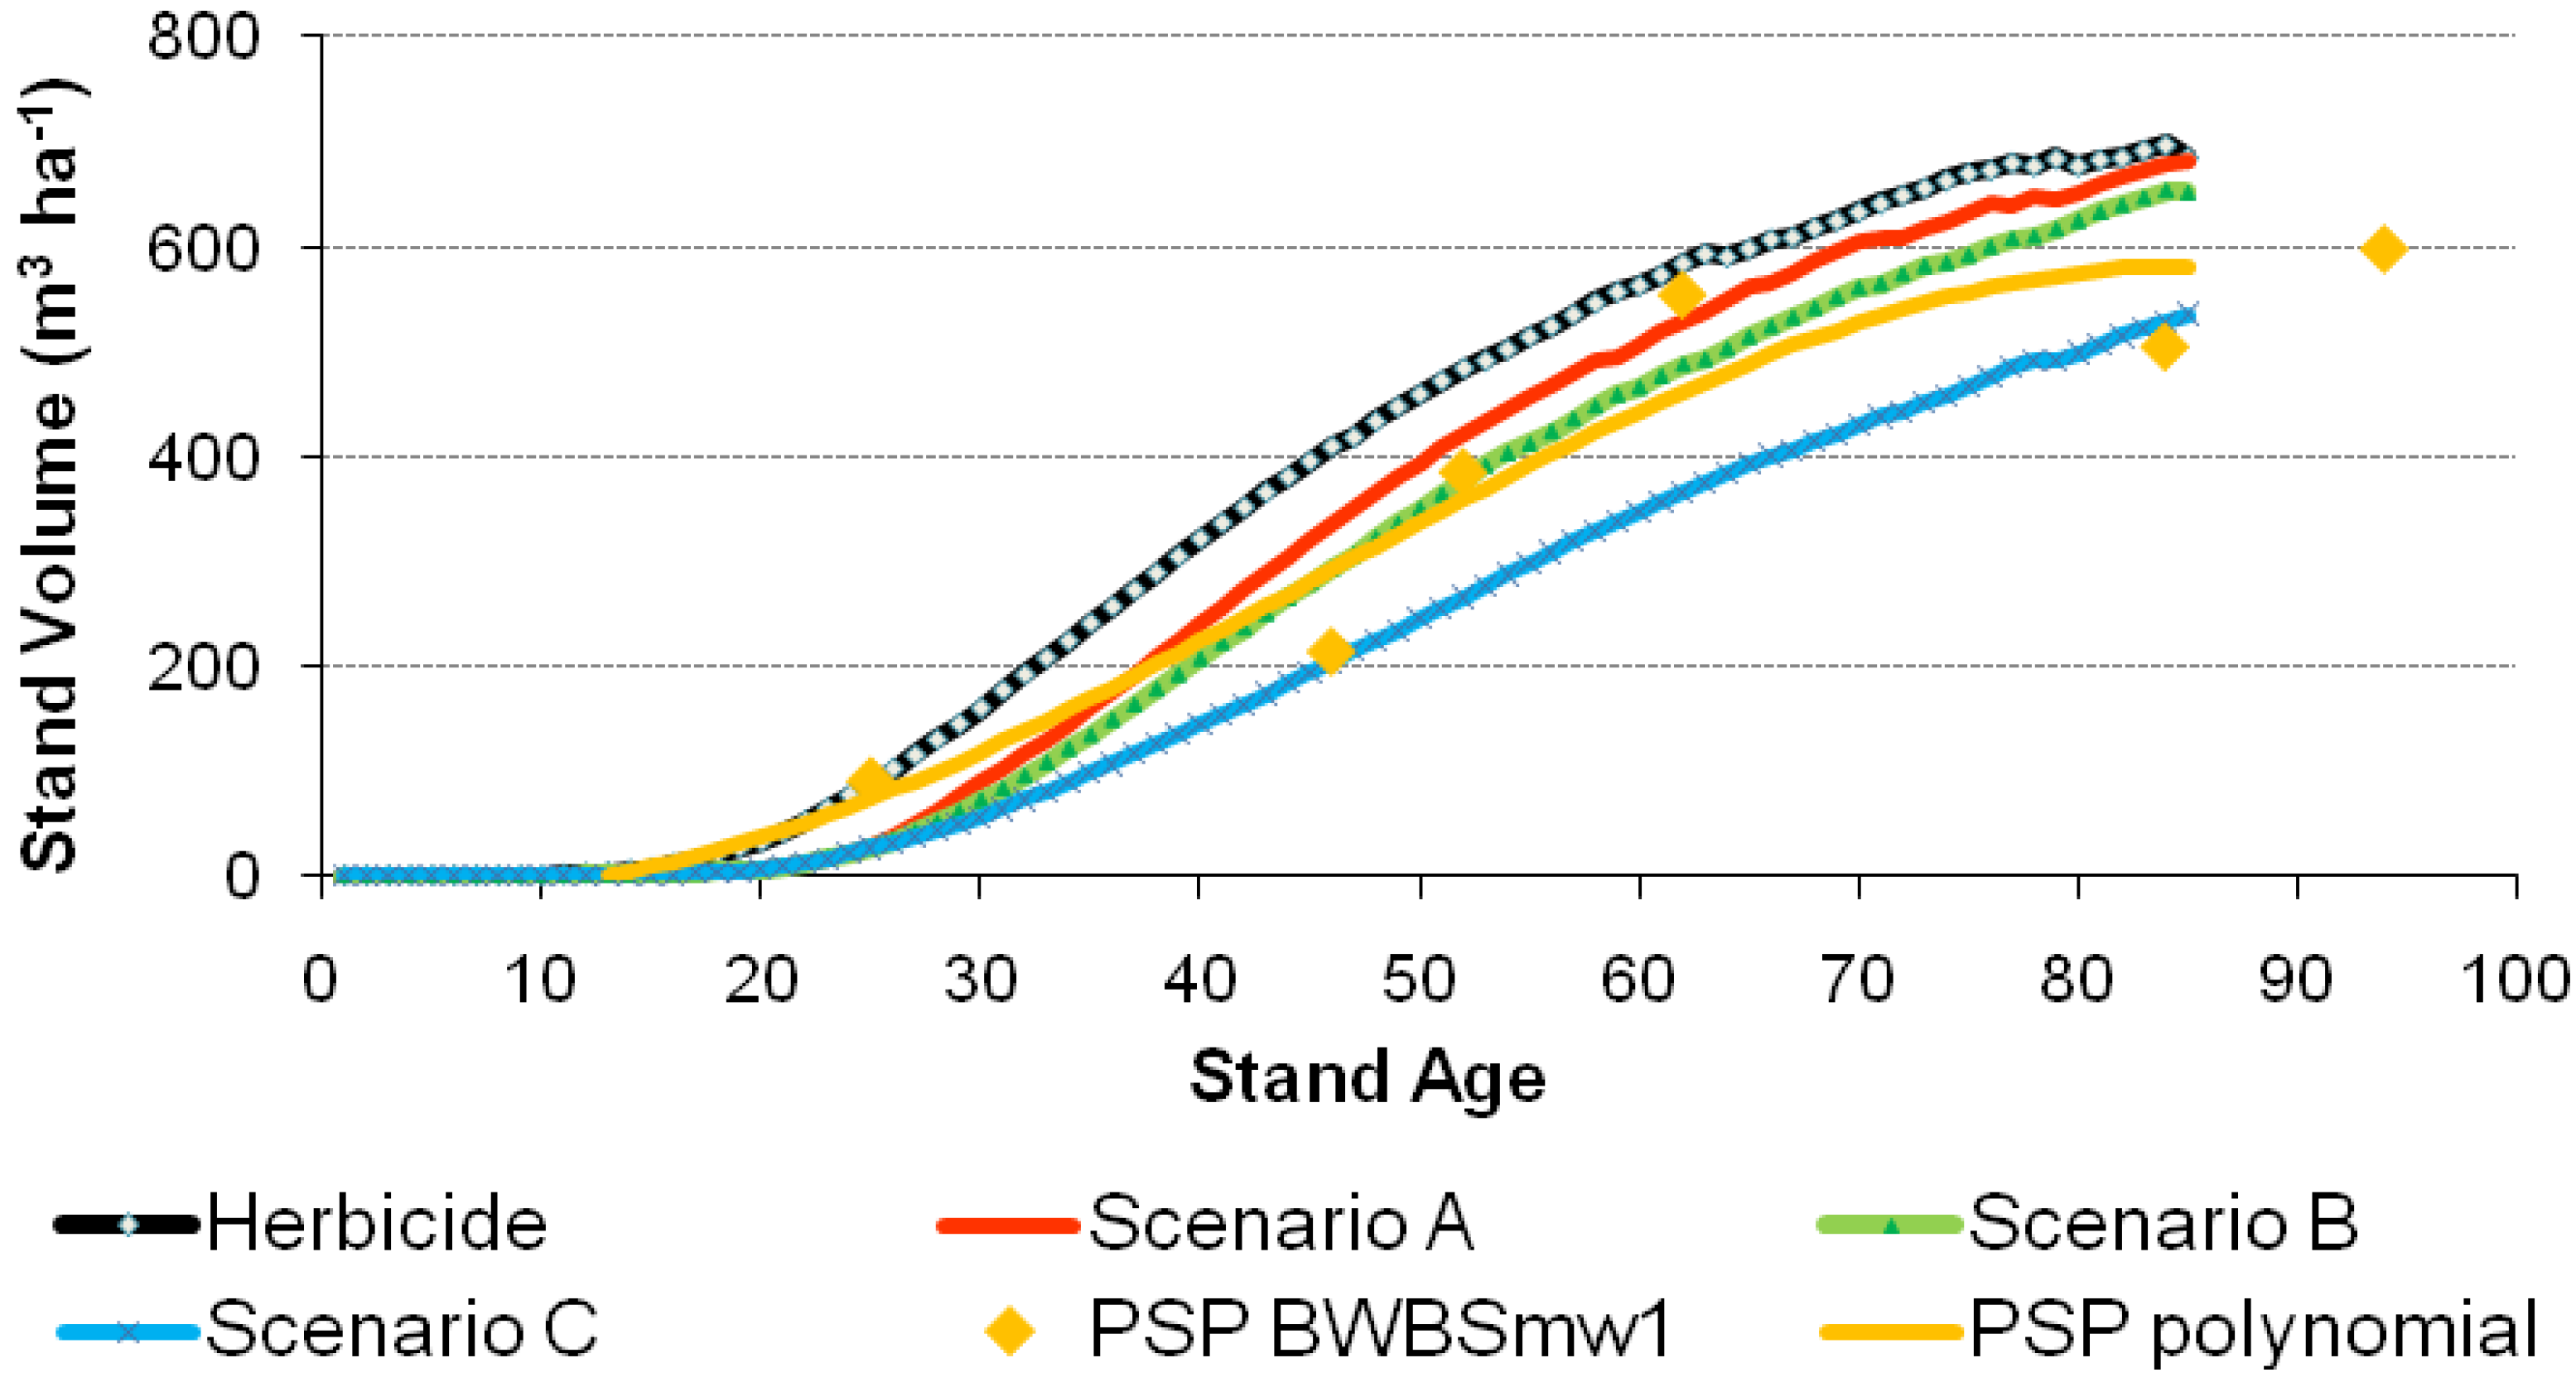
The results for white spruce show that the TASS projections and the PSP data from natural stands follows the projections of scenario A and B of the untreated better than the projected growth in scenario C (
Figure 5). At stand age 80 every treatment except the delta hinge shows a growth multiplier factor of either 1.0 or 1.1 for scenario A and scenario B indicating a marginal or small treatment effect (
Table 9).
For white spruce the information provided by the recent cut blocks in the Peace Forest District indicate an average merchantable volume of 364 m
3 ha
-1 (age class: 121-140) and the latest available survey indicates an average crown closure of 57% (
Table 10). The merchantable volume for these cut blocks is 59% of the values estimated by TASS for scenario B (at 100% crown closure) which is similar to the average crown closure value of these cut blocks.
Figure 5.
Projected stand volume over stand age for white spruce for the best treatment (herbicide) and the untreated scenarios. The PSP data represents measured volume of natural stands in the same biogeoclimatic subzone and variant (BWBSmw1). The polynomial fitting the PSP data is represented by: Y =-3.9276*X+0.33743*X2-0.00248*X3 (n = 6; Adj.R2 = 0.96; P < 0.0048).
Table 9.
Stand yield data from TASS simulations to age 80 for white spruce together with growth multiplier values by scenarios.
Table 9.
Stand yield data from TASS simulations to age 80 for white spruce together with growth multiplier values by scenarios.
| | | | Growth Multiplier |
| Treatment | Stand Age | Density Trees ha-1 | Total Volume m3 ha-1 | Merch.Vol. m3 ha-1 | Basal Area m3 ha-1 | Top Height m | Scenario |
| A | B | C |
| Bedding Plow | 80 | 971 | 669 | 619 | 66.1 | 31.4 | 1 | 1.1 | 1.3 |
| Breaking Plow | 80 | 922 | 627 | 580 | 61.4 | 31.3 | 1 | 1 | 1.3 |
| Burn | 80 | 886 | 661 | 613 | 64.9 | 31.7 | 1 | 1.1 | 1.3 |
| Delta Hinge | 80 | 862 | 484 | 442 | 54.8 | 25.2 | 0.7 | 0.8 | 1 |
| Herbicide | 80 | 951 | 681 | 631 | 66.8 | 31.8 | 1 | 1.1 | 1.4 |
| Madge | 80 | 1003 | 649 | 598 | 63.7 | 31.9 | 1 | 1 | 1.3 |
| Untreated: | | | | | | | | | |
| Scenario A | 80 | 885 | 652 | 606 | 63.4 | 31.6 | - | - | - |
| Scenario B | 80 | 944 | 625 | 577 | 63.2 | 30.2 | - | - | - |
| Scenario C | 80 | 1062 | 485 | 438 | 55.9 | 25 | - | - | - |
Table 10.
Merchantable volumes from recently harvested cut blocks of pure white spruce for the Peace Forest District (DPC) (Source: Database of Revenue Branch, and RESULTS database of Forest Practices Branch, BC Ministry of Forests and Range).
Table 10.
Merchantable volumes from recently harvested cut blocks of pure white spruce for the Peace Forest District (DPC) (Source: Database of Revenue Branch, and RESULTS database of Forest Practices Branch, BC Ministry of Forests and Range).
| | | | | | | | | | Latest Survey |
| Latitude, Longitude | BEC Zone | Merch. Volume m3 | Harvested Year | Spruce % | Age-Class | Area ha | Merch. Volume m3 ha-1 | Year | Spruce % | Crown Closure % | Trees ha-1 | Site Index m |
| 56° 46' 17.4" N, 122° 4' 55.9" W | BWBS | 1792 | 2006 | 87 | 121-140 | 5 | 381 | 2004 | 75 | 55 | 636 | 16 |
| 57° 48' 14" N, 122° 2' 43" W | BWBS | 106800 | 2005 | 82 | 121-140 | 310 | 345 | 1996 | 85 | 65 | 1142 | 10 |
| 55° 39' 26.8" N, 122° 21' 40" W | ESSF | 6247 | 2006 | 76 | 121-140 | 17 | 367 | 1969 | 36 | 50* | 895 | 14 |
| 56° 33' 38.5" N, 121° 22' 0.1" W | BWBS | 46131 | 2007 | 85 | 121-140 | 127 | 364 | 2000 | 80 | 50 | 1200 | 12 |
| | Average Values: | 364 | | 57 | | |
3.3. General Discussion
For lodgepole pine the best treatments at age 60 are the bedding plow, the breaking plow, and the burn that are showing 10% more productivity than the untreated with an average merchantable volume of 323 m
3ha
-1. The other treatments show productivity levels close to that of the untreated plots. Previous studies at the Bednesti site have indicated that the main limiting factors are: low fertility, compact subsoil, and low water-holding capacity with rooting zone as thin as 10 cm [
1]. While mechanical site preparation typically reduces soil bulk density without reducing nutrient availability one study reports that the bedding plow treatment had significantly greater total C than the untreated indicating an overall increased level of organic matter [
26]. The fire treatment resulted in higher productivity for lodgepole pine up-to age 60 as a consequence, among the others, of the ash layer that replaces the forest floor and allows more solar radiation to penetrate the soil [
26,
41,
42]. The Delta disk trenching furrow-planting is the worst treatment. For this treatment trees were planted into the mineral soil at the bottom of the trench where compact subsoil and low fertility have shown to affect pine growth [
1].
The growth projections for lodgepole pine indicate that the treatments have accelerated growth compared to the untreated but the treatment effect largely ceases by stand age 90 (
Figure 3). This outcome is characteristic of treated stands following a Type 1 growth response [
17]. A similar study on
Pinus taeda L. concluded that enhanced growth following site preparation treatments, which improve soil aeration early in the rotation (
i.e., ditching and bedding), decreases over long periods of time [
43].
The data from the selected PSPs shows lower volume growth compared to the growth projected by the TASS model for the untreated. Many factors influence this outcome. For example, TASS projects the growth of a plantation under ideal conditions and tends to overestimate its productivity compared to naturally regenerated pine stands [
24,
44]. Studies in Alberta and British Columbia have concluded that post-harvest lodgepole pine stands grow at a faster rate than mature fire origin stands where stand conditions are different and density is less uniform [
45,
46]. Fire origin stands usually start at higher densities compared to post-harvest pine stands, which may lead to reduced height growth and less vigour [
45,
47]. Information from harvested blocks in the Prince George Forest District corroborates these merchantable volume projections calculated by TASS for the untreated scenario.
For white spruce the best treatments at age 80 are the bedding plow, the burn, and the herbicide which show 10% higher standing volume than the untreated plots (
i.e., scenario B) with an average merchantable volume of 621 m
3ha
-1at age 80. In boreal forests white spruce establishment is often limited by severe vegetation competition and unfavorable soil conditions, therefore treatments that affect these factors have proven to increase growth and survival of spruce (e.g., [
8,
26,
28,
48]). Both mechanical site preparation treatments and the removal of competing vegetation, by applying herbicide or fire, result in a shift in the plant community from tall shrubs (e.g., green alder and willow), as in the untreated, to mainly grasses and forbs [
22,
28,
49]. At the Inga Lake site the treatment effect (e.g., decreased soil density and improved nutrient availability) was still significant 15 years after planting [
8], but a later study at age 20 found that early microsite amelioration caused by the establishment treatments was ceasing and was having less impact on spruce growth than the negative response to competing vegetation [
28].
For white spruce, if the untreated follows either scenario A or B, the projected growth of the treated blocks by stand age 85 will result in productivity levels similar to that of the untreated; thus implying a Type 1 growth response (
Figure 5). If the untreated growth follows scenario C then the best treatments will have 25-30% more volume than the untreated at stand age 85; thus implying a Type 2 growth response. The delta hinge treatment is showing reduced volume growth compared to the other treatments and the untreated as a consequence of hare (
Lepus americanus) damage and high levels of competing vegetation [
49]. Results from scenario B (untreated) match the curve for the PSP data more closely than Scenario A or C (
Figure 5). Also the information provided by the harvested blocks in the Peace Forest District corroborates the merchantable volume projections calculated by TASS.
As shown for lodgepole pine, the productivity of spruce stands is also generally overestimated by TASS thus the proximity between the PSP data and the projected growth of scenario B provides a good indication of the potential growth of the untreated. Moreover, in 15-year-old white spruce stands Feng
et al. [
50] found that the height of the current top height trees was approximately 14% greater than the height of the top trees that would be selected to calculate site index at breast height age 50. These findings also suggest a Type 1 growth response for white spruce [
17].
Results from this study suggest that the age–shift approach is the best method, among the modeling techniques tested, for representing growth differences for a given treatment in relation to the untreated. However, at early stages the age-shift value can be calculated only up to the relative age of the maximum size of the control treatment. This limits its application when the growth of the untreated is significantly slower compared to the treated [
38]. For this reason our data for white spruce growth limited calculating age-shift values up to age 11 for the majority of the treatments. For faster growing lodgepole pine [
51] it was possible to calculate age-shift values up to age 14-15 for every treatment.
Age-shift values can also be calculated for older stands using growth and yield information although it is important to consider that age-shift values will fluctuate depending on stand age. For example, at maximum MAI age-shift values indicate that the bedding plow treatment has the potential to shorten the time to reach maximum MAI by 13% compared to the untreated for both lodgepole pine and white spruce, although this gap declines at culmination age.
The growth multiplier method provided valuable information on growth characteristics of treated and untreated plots and also helped in interpreting the growth and yield projections of the future stands. Unlike the age-shift method it is possible to calculate growth multipliers using every growth measurement available (
Figure 2 and
Figure 4) [
31]. For lodgepole pine the early growth multiplier factors and trends for diameter and height are similar to those calculated for older plantations using the projected growth, which implies that growth multipliers can provide indications on the future development of the stand even at early stages (
i.e., stand age 15-20). Nevertheless, at age 20 the growth multiplier values for volume suggest that treated stands could be up-to 70% more productive than untreated (e.g., burn = 1.7x). This outcome is consistent with the findings that slash-burning reduces brush competition and increases short term availability of nutrients in the soil [
13]. However, while such early increases in growth are widely observed, it is unlikely that these will translate into yield increases of this magnitude.
Early growth multipliers for white spruce indicate an increasing value of the multiplier with age between treated and untreated stands whereas the values from the projected growth suggest a decreasing trend. In this case the early indications of stand development for any of the growth sizes would not be representative of the stand at the end of the rotation period and could potentially mislead managers regarding the long-term effect of the treatments. For example, at stand age 20 the volume growth multiplier factor for the burn was 800% (i.e., 8x) of the untreated area but at stand age 80 the value drops to 10% (i.e., 1.1x). Differences between pine and spruce in observed relationships between growth multiplier and model estimates of yield are related to differences in patterns of early growth of these two species, number of years to maximum MAI, and the duration of the treatment effects.
This outcome indicates that multipliers calculated up to age 20 do not predict volume gains at stand age 85 or older. For white spruce, vegetation management and forest productivity studies indicate that volume gains compared to the untreated stands at age 10 or 12 range from 194% to 591% [
52,
53,
54], at stand age 19 gains are around 188% [
55], and at stand age 30 volume gains decline to 53-96% [
5,
56]. These percentage volume gains are consistent with the range of measured and predicted values for white spruce at the Inga Lake installation. At stand age 15, Simard
et al. [
57] indicate that vegetation management increases total lodgepole pine stand volume by 57% which is consistent with the gains measured for pine at the Bednesti Lake installation. These factors corroborate the finding that early estimates of volume gains are more representative of the final yield for lodgepole pine than are those for white spruce.
Age shift values and growth multipliers for lodgepole pine and white spruce indicate that diameter growth was affected more by treatment than height; which is consistent with the findings from many other studies which show that diameter growth is more sensitive than height growth to competing vegetation or site preparation treatments (e.g., [
8,
58]).
The site index adjustments calculated using the growth intercept method provided the base information to create customized growth curves for stands projected with TASS/TISPY. For lodgepole pine, the site index values calculated did not show significant differences between stand age 9, 15 or 20. Huang
et al. [
46] have also shown that site index estimates stabilize after stand breast height age 5 in juvenile stands planted after harvesting and drag scarification. The site index estimates at age 20 for white spruce were lower by only 0.4% than the values calculated at age 11. Growth intercept models which relate the early average height growth of trees to site index, have been shown to provide reasonable site index estimates for young stands [
35,
36,
46,
59]. Although the growth intercept model has proven to provide significant information on growth and yield of conifers, it still represents an early estimate of the stand productivity. More data, especially for treated stands, is needed in order to validate estimates of the effect of establishment treatments on site productivity.
It is important to mention that this study is based on relatively young stands and that growth models including TASS/TIPSY provide long term growth estimates for the ‘average’ stand using inventory data of similar locations. For these reasons the projected growth estimates evaluated hereby are only valid for this case study and might not be representative of the future characteristics and development of the stand.


