
Elite Multi-Criteria Decision Making—Pareto Front Optimization in Multi-Objective Optimization

1
Conrad Blucher Institute for Surveying and Science, Texas A&M University–Corpus Christi, Corpus Christi, TX 78412, USA
2
Department of Computer Science, Texas A&M University–Corpus Christi, Corpus Christi, TX 78412, USA
*
Author to whom correspondence should be addressed.
Algorithms 2024, 17(5), 206; https://doi.org/10.3390/a17050206
Submission received: 31 March 2024
/
Revised: 8 May 2024
/
Accepted: 10 May 2024
/
Published: 10 May 2024
(This article belongs to the Special Issue Recent Advances in Multi-Objective Algorithms and Optimization 2023–2024)
Abstract
:Optimization is a process of minimizing or maximizing a given objective function under specified constraints. In multi-objective optimization (MOO), multiple conflicting functions are optimized within defined criteria. Numerous MOO techniques have been developed utilizing various meta-heuristic methods such as Evolutionary Algorithms (EAs), Genetic Algorithms (GAs), and other biologically inspired processes. In a cooperative environment, a Pareto front is generated, and an MOO technique is applied to solve for the solution set. On other hand, Multi-Criteria Decision Making (MCDM) is often used to select a single best solution from a set of provided solution candidates. The Multi-Criteria Decision Making–Pareto Front (M-PF) optimizer combines both of these techniques to find a quality set of heuristic solutions. This paper provides an improved version of the M-PF optimizer, which is called the elite Multi-Criteria Decision Making–Pareto Front (eMPF) optimizer. The eMPF method uses an evolutionary algorithm for the meta-heuristic process and then generates a Pareto front and applies MCDM to the Pareto front to rank the solutions in the set. The main objective of the new optimizer is to exploit the Pareto front while also exploring the solution area. The performance of the developed method is tested against M-PF, Non-Dominated Sorting Genetic Algorithm-II (NSGA-II), and Non-Dominated Sorting Genetic Algorithm-III (NSGA-III). The test results demonstrate the performance of the new eMPF optimizer over M-PF, NSGA-II, and NSGA-III. eMPF was not only able to exploit the search domain but also was able to find better heuristic solutions for most of the test functions used.
1. Introduction
Most real-world problems are multi-objective (MO) in nature. In an MO problem, a solution or set of solutions are to be found which are optimal for conflicting objective functions. Pareto optimal solutions represent an optimal trade-off between objectives in most real-world applications. In fact, for conflicting objectives where one Pareto optimal solution is known, in order to find another feasible solution that improves in one objective, one must worsen in one or more other objectives. Resource limiting constraints add to the complexity of finding solutions, and for discrete decision variables, this results in a problem that is classified as NP-Hard, where the time to solve to exact optimality grows exponentially as the problem size increases linearly [1].
The main objective of an optimizer technique is to find a set of solutions which are optimal or near optimal for the conflicting objectives under the given constraints. Algorithms with stochastic components are referred as meta-heuristics [2]. Stochastic optimization techniques are often applied in solving black-box optimization problems [3]. Generally, most real-world problems are classified as black-box optimization problems due to uncertainty in the exact definition of the objective functions, constraints, and other uncertainties.
In multi-objective optimization (MOO), the search space needs to be explored to find the best solutions for the objective functions. Exploration and exploitation of the search area both need to be performed. Various techniques such as Non-Dominated Sorting Genetic Algorithm-II (NSGA-II) [4], Non-Dominated Sorting Genetic Algorithm-III (NSGA-III) [5], Particle Swarm Optimization (PSO) [6], and Ant Colony Optimization (ACO) [7] have previously been developed to solve such difficult problems, and the new presented technique will be evaluated against those. Some real-world applications of MOO include finance [8], politics [9], mechanics [10], and spatial optimization [11].
On the contrary, if a set of feasible solutions is already provided, then Multi-Criteria Decision Making (MCDM) is used to find the best solution from the given set of solutions. In MCDM, a single best solution is generally selected from the provided set of solutions depending upon the significance of the objective. Various methods for the selection of a solution have previously been developed [12].
A decision maker (DM) first applies MOO techniques and obtains a set of Pareto front solutions. Next, the DM applies MCDM techniques on the set of Pareto front solutions to pick one best solution. Various researchers have previously implemented this process in [13,14,15]. An optimizer combining both of these approaches was previously developed, which was called Multi-Criteria Decision Making–Pareto Front (M-PF) optimizer [16]. The main drawback of the M-PF optimizer is its tendency to converge toward one objective to exploit its search area with low probability of exiting from local minimum fitness. Other researchers have tried to combine the MOO and MCDM techniques [17] in which they use predefined objective weights by decision maker (DM). One of the major issues with predefined objective weights is that this results in a bias toward one of the objective functions. In this paper, an improved version of the M-PF optimizer is developed, which is called the elite Multi-Criteria Decision Making–Pareto Front (eMPF) optimizer. The simultaneous objectives of the new optimizer include both exploitation of the search area and also the exploration of a diverse solution set.
The main contribution of this paper is to present a better optimizer than the M-PF optimizer with a lower possibility of being stuck in a local optimal fitness. The other contribution is to reduce the time complexity over the M-PF optimizer. In experiments, the new optimizer has better solution quality over the other evaluated test functions.
The structure of the subsequent sections of this paper is as follows. In Section 2, the relevant literature review of MOO, Pareto front, Multi-Criteria Decision Making, and Evolutionary Algorithms is presented. In Section 3, the new algorithm along with the step-by-step process is explained. In addition, all of the test functions used for this paper are explained. In Section 4, the results of the simulation are demonstrated, and the data are interpreted in Section 5. Finally, in Section 6, the conclusions for this paper are provided.
2. Literature Review
This section provides an overview of Multi-Objective Optimization (MOO), Pareto front (PF), Multi-Criteria Decision Making (MCDM), Evolutionary Algorithm (EA), and Multi-Objective Evolutionary Algorithms (MOEA).
2.1. Multi-Objective Optimization (MOO)
The aim of an MOO is to find a set of optimal solutions for conflicting objectives which may have constraints associated with them. Mathematically, MOO can be represented as [18]
subject to where . Here, are the objective functions, n is the number of objective functions, are the constraints, and m is the number of constraints.
In an MOO, the number of objective functions should be greater than or equal to 2. Each optimal solution is a trade-off between objectives and may not be an optimal solution for any objective function taken individually [19]. This conflicting nature of the objective functions and their corresponding constraints make the problem of finding the optimal set of solutions challenging.
2.2. Pareto Front
A single solution from the given set of solutions is considered Pareto optimal only if there exists no other feasible solution that improves any objective without worsening one or more objectives. The Pareto dominance can be explained using Figure 1.
In Figure 1, all of the points represent the feasible solutions obtained for the objective functions 1 and 2. Considering points A, B, and C and with the desire to minimize both objective functions, the following conclusions can be made:
- Point A dominates point B in objective 1 and C in both the objectives.
- Point B dominates point A in objective 2 and C in both the objectives.
- Point C is dominated by both A and B points in both the objectives.
Here, points A and B are not dominating each other, and there are no other solutions dominating them. Hence, points A and B are in the same Pareto front. Point C is dominated by both solutions, thus pushing it to the next Pareto front.
To list all of the individuals into various Pareto fronts, first, all of the non-dominated solutions are found from the entire solution set X. Next, the leftover solutions are considered to find non-dominated solutions. This process is repeated until all the solutions are assigned a Pareto front number [20].
2.3. Multi-Criteria Decision Making (MCDM)
The aim of Multi-Criteria Decision Making (MCDM) is to obtain a single best solution from a set of candidate solutions depending on the various criteria or the end user requirements. As per [21], MCDM was first developed by Benjamin Franklin while working on the moral algebra concept.
In MCDM, weights are assigned to a criteria depending on the requirements from the end user or problem type. Any of the methods such as Simple Additive Weighting (SAW) [22], Analytic Hierarchy Process (AHP) [23], Technique for Order of Preference by Similarity to Ideal Solution (TOPSIS) [24], and the ranking method [25] are applied on the individuals to find the best solution in the set of candidate solutions.
2.4. Evolutionary Algorithms (EA)
Evolutionary Algorithms (EAs) are a biologically inspired method for solving meta-heuristic MOO problems. They are based on a population-based optimization process. The initial step of EA is generating a total random population . The population is evaluated against the objective functions, and fitness values are calculated. The individuals in the population are checked against each other with methods such as the binary tournament search method [26]. Let q be the individuals which need to be eliminated; these individuals are removed from the total population, leaving individuals. A new q population is added back to the kept population. To fill the q population, random individuals from p are copied and randomized. Similarly, random elements in the total population T are mutated. When the process of evaluation, selection, removal, and mutation is performed, these four steps are called a generation. The stop condition can be reaching a given generation number or reaching fitness values of individuals in the population.
2.5. Multi-Objective Evolutionary Algorithm (MOEA)
In MOEA, the selection process is different from the above in Section 2.4. The Pareto fronts are created for the entire population set. Various optimization techniques listed in Section 1 are applied in the selection process to find the best individuals for the next steps. MOEAs are classified into three categories: dominance-based, indicator-based, and decomposition based [27]. Depending upon the selection process, the optimizer will fit into the any of the above three categories.
3. Methodology
In this section, the developed algorithm is discussed in Section 3.1. The calculation of weights of objective functions using entropy and degrees of diversification is explained in Section 3.1.1. This is followed by the TOPSIS method [28], which is presented as it will be used for the selection of policies from the Pareto front. The performance of the optimizers are evaluated using the Pareto front spread () (discussed in Section 3.2.1), generational distance () (discussed in Section 3.2.2), and the Pareto front spacing (discussed in Section 3.2.3). Moreover, the test functions used for this research are presented in Section 3.3.
3.1. Algorithm
The eMPF optimization technique combines EA with MCDM, as shown in Figure 2. Initially, a random population of is generated and evaluated in the environment. The environment can be user defined as per requirements. With the fitness values evaluated from the simulator, the Pareto fronts of the population are generated as discussed in Section 2.2. This results in p better-performing individuals or policies over q individuals or policies.
Once the Pareto fronts are generated, the number of individuals to remove from the required Pareto front set is determined on q individuals. If the number of individuals is less than or equal to 3, then any of those individuals can be selected. If the number of individuals is more than 3, then the TOPSIS method is applied on all the individuals of the Pareto front except for the extreme solutions, as shown in Algorithm 1. Before using the TOPSIS method, weights for the objectives need to be found. Entropy and degree of diversification are used to find weights for the objectives in this paper. The best outputs of TOPSIS will be given priority over other individuals for survival. Next, priority is given to extreme individuals. Finally, the priority of survival of individuals is given depending on the ranking derived from the TOPSIS method.
| Algorithm 1 eMPF selection process |
|
Once the q policies are removed from the population using mutation q, new individual policies are developed. The process of evaluation is repeated on policies. The methodology for the research is shown in Algorithm 1.
There are two major differences between the eMPF and M-PF optimizers. The first difference is the selection of extreme fitness values in the Pareto front. This gives an advantage to the eMPF optimizer of exploring the entire decision space over the M-PF optimizer, which helps the optimizer explore the search area in between the extreme fitness values. An extreme fitness value is the fitness value of an individual in the entire population with the lowest (in minimization) or highest (in maximization) objective value toward one objective function. The second difference is that in eMPF, the selection of individuals is based on the individuals within the Pareto front. In M-PF, the first Pareto front individuals are used for selection of the best individuals in the required Pareto front, whereas in eMPF, the individuals in the same Pareto front are used for selection of individuals. This transforms the optimizer from an indicator-based optimizer to a dominance-based optimizer. The improvements in the performance of the optimizer are shown in results section (Section 4).
From the aforementioned second variation between the eMPF and M-PF optimizers, the time complexity is reduced for the eMPF optimizer. In M-PF, two loops, one each for the first Pareto front and the other required Pareto front, are needed. With eMPF, only one loop is necessary in the required Pareto front, reducing the overall time complexity with O(n), where n is the number of individuals in the first Pareto front.
3.1.1. Calculating Weights of Each Objective
In the eMPF method, the weight of each objective is calculated in the process as shown below [16]:
- The first step is to normalize the fitness values. The fitness values are normalized using Equation (2),where i is the individual policy, j is the objective number, N is the total number of individual policies, f is the actual fitness value, and F is the normalized fitness value.
- Lastly, the weights () of the objective are calculated using Equation (4),where is the entropy value from the above step, j is the number of objectives, and M is the total number of objectives.
By following the above listed steps, the weight of each objective function is calculated for each generation in an MOEA.
3.1.2. TOPSIS
Once the weights of the objectives are calculated, the next step in the optimizer is to use the TOPSIS method to rank the individual policies except for the extreme individuals as shown in Figure 2. The TOPSIS method is as follows.
- Normalize the actual fitness values using Equation (5).where i is the individual policy, j is the objective number, f is the actual fitness value, and F is the normalized fitness value.
- Next, find the fitness weights by taking the product of the weight of each objective with fitness values using the equation as shown below:where is the weight of each objective, and is the normalized fitness value calculated in Equation (5) for the individual policy i and objective j.
- Depending on the value, the best and worst-performing individuals of each objective are selected and flagged as the best or worst individual policy.
- The Euclidean distances between all of the individuals to both the best and worst individuals are calculated and assigned as , where is assigned as the distance to the best individual and is assigned as the distance to the worst individual.
- The last step is to find the degree of approximation using Equation (7),where is assigned to the distance to the best individual, is assigned to the distance to the worst individual from the above calculations, and i is the individual element.
Individual elements are sorted from low to high based on the degree of approximation , where the first solution is the best one.
3.2. Performance Evaluation
The performance of the optimizers first is determined by visual graphical inspection. Next, the mean and standard deviations of the first Pareto front individual fitness values are used for analyzing the performance of the optimizers. In addition, the Pareto front spread metric () [29], generational distance () [30], and the Pareto front spacing is used to evaluate the performance of the optimizers.
3.2.1. Pareto Front Spread ()
The spread metric is generally represented as .
Here, and are the distances between extreme solutions of the Pareto front, is the distance between consecutive solutions, is the average of all values, and m is the number of solutions in the Pareto front. The higher spread value demonstrates the higher distribution of solutions across the objective space.
3.2.2. Generational Distance ()
To calculate the generational distance, the Euclidean distance between the non-dominated Pareto front and its nearest reference Pareto front value is calculated. The generational distance is calculated using Equation (9).
Here, the generational distance is represented as , n is the objective function number, and is the Euclidean distance between the reference Pareto front value to its nearest non-dominated Pareto front value. In this paper, the reference Pareto front was generated combining the Pareto fronts of 30 statistical runs by each optimizer.
3.2.3. Pareto Front Spacing ()
One of the ways to measure the performance of an optimizer is by using the spacing in the Pareto front [31]. The spacing determines how evenly the individuals are distributed in the Pareto front. All of the individuals are said to be evenly distributed if the spacing value is 0.
To find out the spacing value, the distance between individual elements is calculated. The standard deviation of the distance is spacing value [32].
3.3. Test Functions
To demonstrate the performance of each optimizer, 21 test functions were used for this research, as listed below:
- Binh and Korn Function [33];
- Chankong and Haimes Function [33];
- Fonseca–Fleming Function [34];
- Test Function 4 [35];
- Kursawe Function [36];
- Schaffer Function N1, and N2 [37];
- Poloni’s Two-Objective Function [38];
- Zitzler–Deb–Thiele’s Function N1, N2, N3, N4, and N6 [39];
- Osyczka and Kundu Function [40];
- Constr-Ex Problem;
- VR-UC Test 1, VR-UC Test 2 [41];
- MSGA Test 1 [42];
- Viennet Function [43];
- MHHM1, MHHM2 [44].
The equations for each test function and the constraints corresponding to the test functions along with the search domain are presented in Appendix A.
4. Results
This section presents the results of using the eMPF, M-PF, NSGA-II, and NSGA-III methodologies on the 21 test functions. As mentioned in Section 3.3, the test functions used for the analysis along with the constraints and search domain are presented in Appendix A. The mutation rate of 0.5 was used with the mean value of 0.0, and a Gaussian distribution was used for the randomness in the population. A total of 100 individual policies were used and iterated over 1000 generations. No other stopping condition was applied to any of the test functions. All of the test functions were to be minimized over the generations. As mentioned earlier, the goal of the eMPF method presented in this paper is to exploit the environment while maintaining diverse solutions.
The mean and standard deviation of the fitness values of each test function along with the methodology are shown in Appendix B. In addition, the generational distance (), the Pareto front spread (), and the fitness spacing () are also calculated in Section 3.2. All results are included in Appendix C.
5. Discussion
In this section, the performance of the eMPF optimizer is compared with the other tested optimization techniques. The performance is evaluated with the test functions mentioned in Appendix A. The objective and search space of all of the test functions used are plotted and provided in the linked GitHub repository found at the end of this paper.
Binh and Korn Function: eMPF achieved a low standard deviation, demonstrating its performance in obtaining quality solutions across all test runs. Moreover, it had the lowest average of fitness compared with other optimizers in the first objective function. When the spread () was considered, eMPF had the highest spread value over the other optimization techniques with a larger set of solutions generated over the Pareto front. The eMPF optimizer had better performance than the M-PF optimizer when compared using the generational distance ().
Chancing and Haimes Function: For this test function, the minimum optimal solution obtained for each objective function was the lowest with NSGA-III and M-PF and had a difference of around units higher than NSGA-II. However, eMPF showed a more centered distribution of solutions along with consistently more reliable solutions. When the spread () was considered, eMPF generated a diverse set of solutions, and NSGA-III offered the widest coverage of the Pareto front for this specific function. The generational distance () of eMPF was higher than that of the rest of the optimizers due to the extreme solutions carried forward to the next generations. Figure 3 demonstrates the extreme solutions generated by the eMPF optimizer. Holding on to these extreme solutions will be beneficial when the complexity of the search space increases.
Fonseca–Fleming Function: eMPF demonstrated good performance, closely competing with NSGA-II in finding the optimal solutions while surpassing it in average performance and consistency. With the highest spread value, eMPF outperformed all other methods in terms of diversity, indicating its superior capability to explore and cover a wider range of the Pareto front.
Test Function 4: All the four optimization techniques had similar lowest, average, and standard deviation values. However, eMPF surpassed the other techniques in the spread (), showing its diverse set of solution generation capability.
Kursawe Function: M-PF surpassed all other optimization techniques in spread (), proving its diverse solution set. In addition, M-PF outperformed all other optimization techniques even in obtaining minimum values, average, and standard deviation. However, eMPF had more than better performance in the generational distance () than that of M-PF.
Schaffer Function N1 and N2: eMPF was able to reach better results than other optimization techniques with respect to the minimum values, mean, and standard deviations. It also had higher spread () values than other optimizers. NSGA-II and NSGA-III, while offering competitive performances, were not able to match eMPF’s precision, consistency, and diversity. eMPF outperformed the other optimizers by obtaining accuracy (minimum values), consistency (low mean and standard deviation), and diversity (high spread).
Poloni’s Two Objectives: NSGA-II and eMPF optimization techniques had nearly the same minimum value; however, eMPF had a better mean and standard deviation. NSGA-III and M-PF optimizer had a better spread () value than eMPF.
Zitzler–Deb–Thiele’s from N1, N2, N3, N4, and N6: All of the optimization techniques had nearly the same performance in this set of functions, and there were negligible value variances. For example, in Zitzler–Deb–Thielse’s N2, the difference between minimum function 1 values between all optimizers was 0.000001 while considering the precision value of 6. All optimization techniques performed equally well in all of these test functions. In addition, eMPF had better performance than all other optimizers in the generational distance () except for the N4 test function.
Osyczka and Kundu Function: All of the optimization techniques had nearly the same optimal value in terms of minimum values for each objective function. However, the eMPF optimizer was able to find a more diverse set of solutions compared with the other optimization techniques. Moreover, it was able to generate good solutions with greater consistency. In addition, eMPF had the better generational distance () than NSGA-II.
Constr-Ex Function: The eMPF optimizer was able to achieve the lowest minimum values out of all of the optimizers. However, the average values were slightly higher than other optimization techniques, making it somewhat skewed. This skew can be clearly seen in Figure 4. The generational distance () does concur with the results due to its higher value for the eMPF. The spread (), on the other hand, showed good diversification of the solutions generated by eMPF.
VR-UC Test Functions: In the VR-UC test function 1, eMPF had the better average and the highest standard deviation compared with other optimizers. However, eMPF had a higher generational distance () than the other optimizers. Despite the higher generational distance, the spread of solutions is better for the eMPF optimizer. In the VR-UC test function 2, all the optimizers had a negligible difference in the averages, the generational distance (), and the spread ().
MSGA Test Function: eMPF outperformed all other optimizers in exploring the lowest fitness values of both objectives and was able to produce reliable solutions. This can be established with the lower mean and the higher standard deviations of the eMPF optimizer when compared to other optimizers. In addition, eMPF had a better generational distance () and spread () than NSGA-III and the M-PF optimizer.
Viennet Function: As mentioned in Appendix A, this was a three-dimensional minimization multi-objective optimization problem. The average fitness values of the eMPF optimizer were better than other optimizers in all of the three objective functions. The eMPF optimizer had better generational distance () than that of the M-PF optimizer, and it also had the highest spread () values over other optimizers.
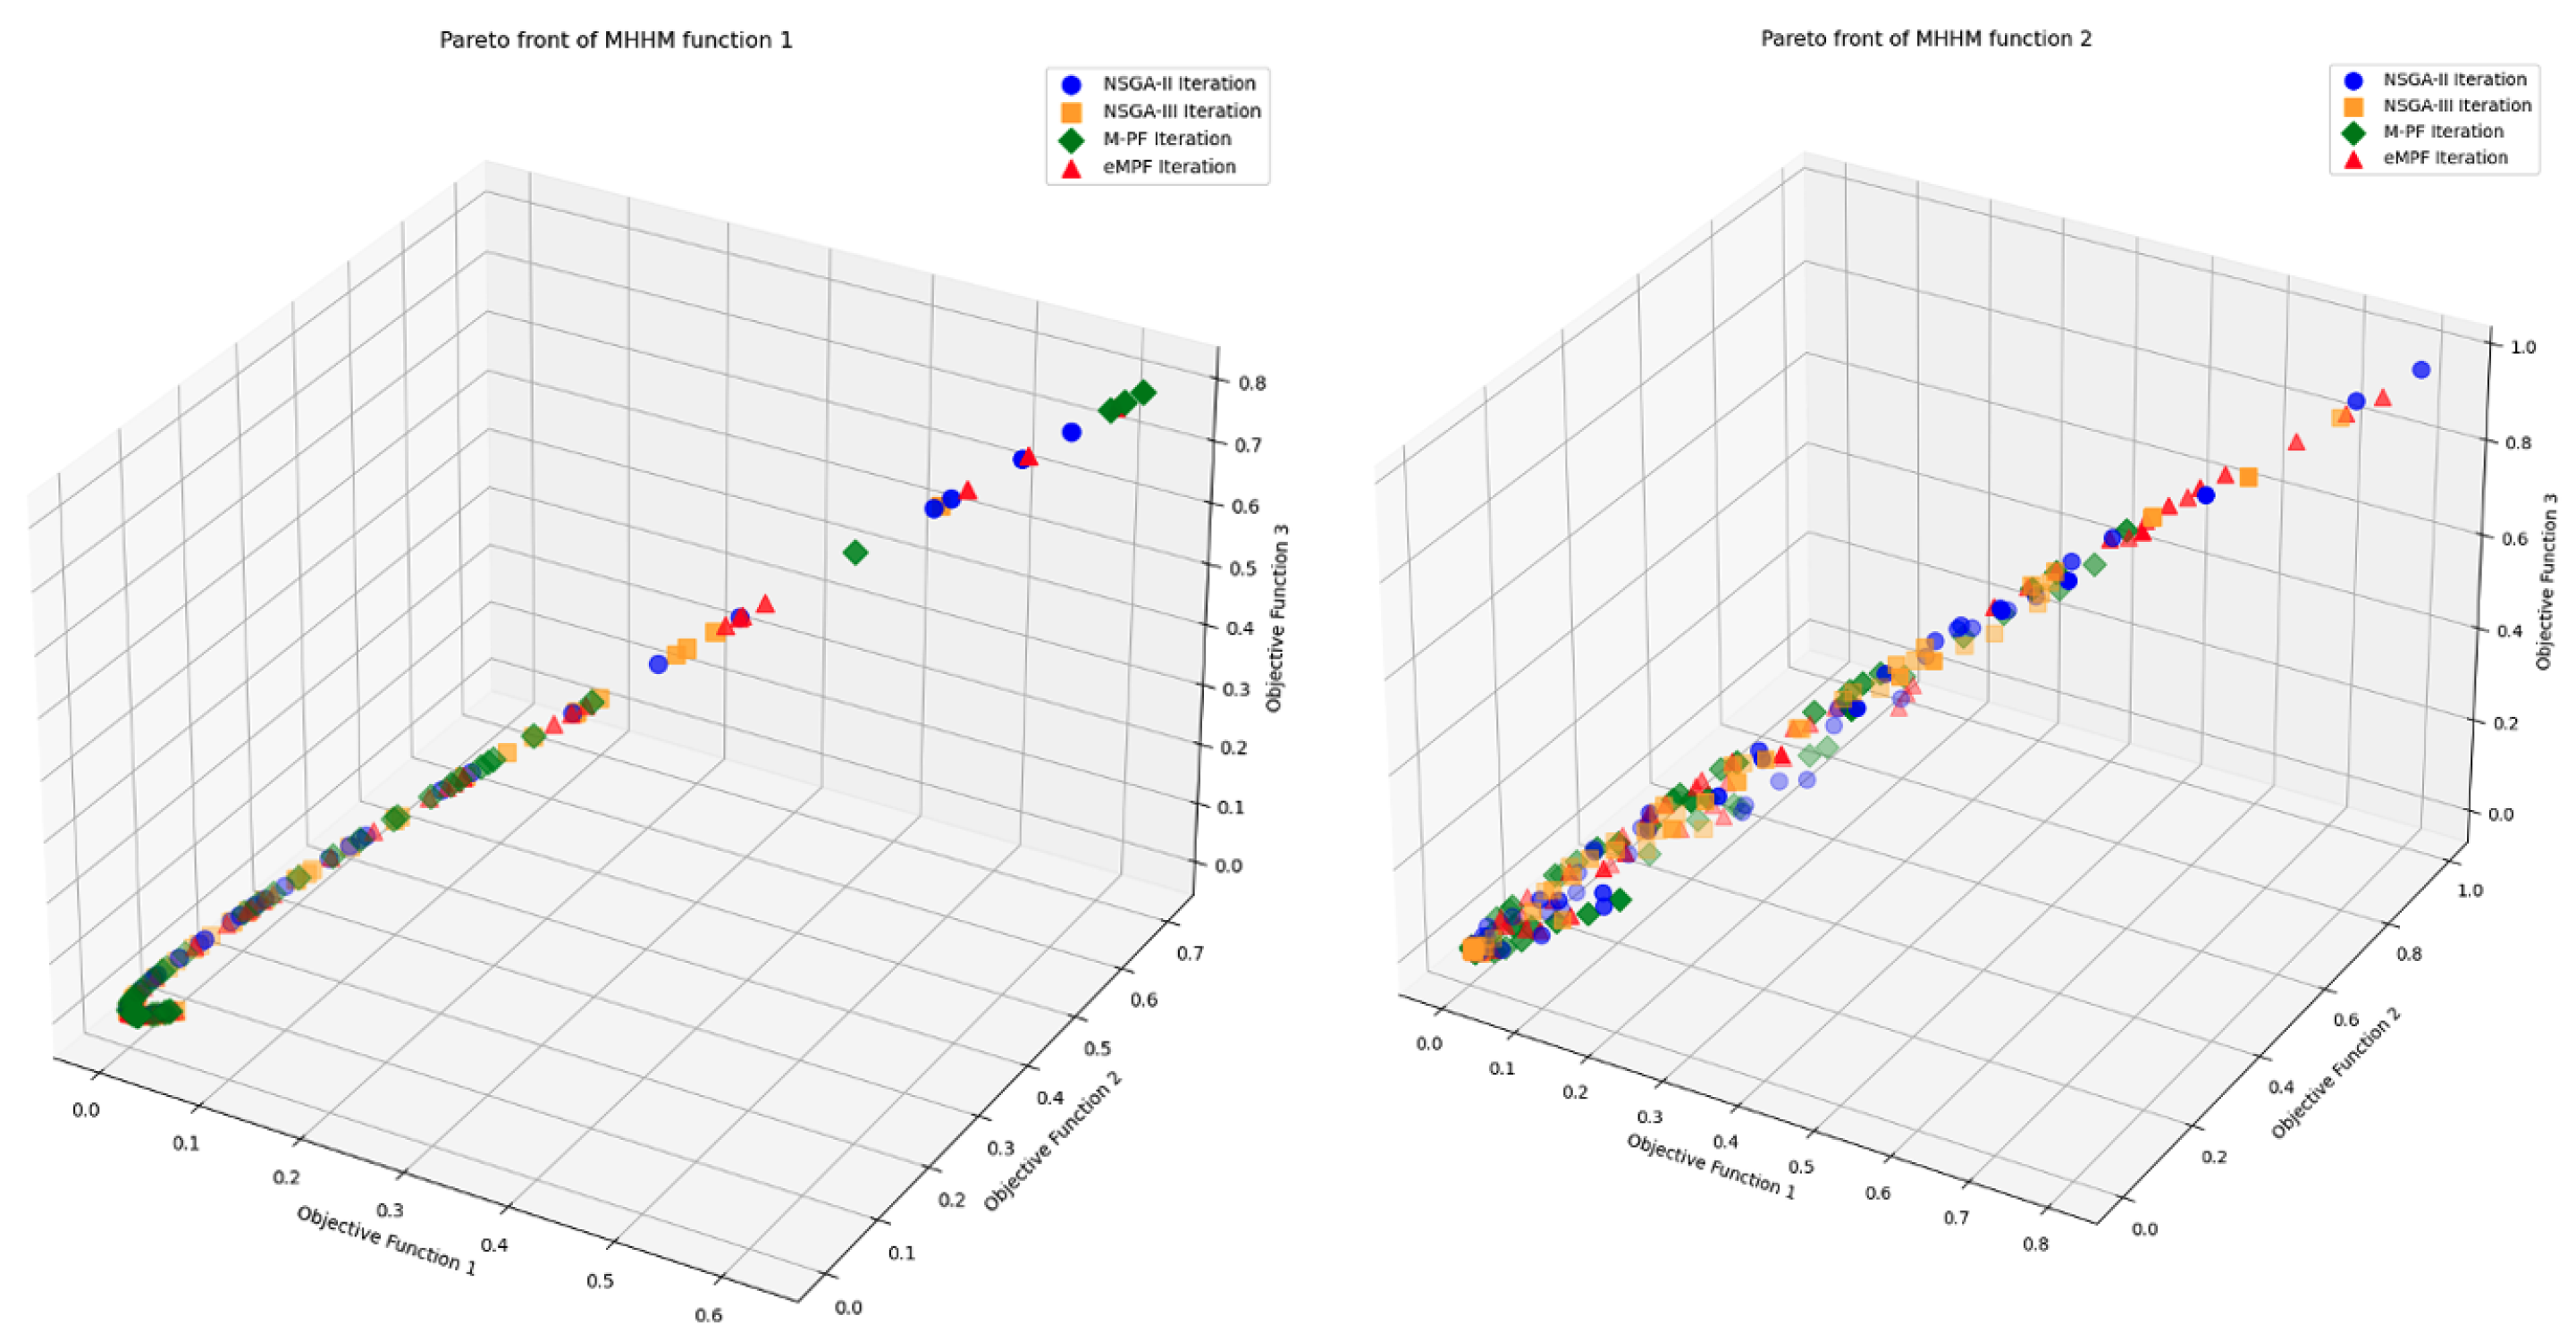
MHHM Functions: These test functions also had three objective functions as mentioned in Appendix A. In both of the test functions, eMPF had the lowest average fitness, lowest generational distance (), and highest spread () values over the other optimizers. This demonstrates eMPF’s dominance in generating better and more diverse solutions when compared to other optimizers on these test functions. The Pareto front plot confirms eMPF’s dominance, as shown in Figure 5.
Overall, eMPF was able to find diverse solutions in all test scenarios while maintaining consistency in the solution set. Moreover, it was able to find better solutions than existing optimization techniques. In challenging problems such as Zitzler–Deb–Thiele’s functions, it was able to generate better solutions than NSGA-II and NSGA-III. Reliability was also demonstrated with lower standard deviations for Schaffer functions and Poloni’s two objective functions. The learning curves generated from the fitness values showed a higher learning rate in most test scenarios than the other optimizers. Moreover, when the objective functions were increased from two to three, the eMPF optimizer was able to perform better than the other optimizers demonstrated using the Viennet and MHHM test functions.
However, the optimizer was not able to outperform other optimizers in all the test functions. The reliability and diversification of the solutions obtained using eMPF were not always better than other optimizer solutions. Additionally, when the true Pareto front was a straight line, such as in the Chankong Haimes function, the solutions from eMPF were not as reliable. This conclusion comes from using the generational distance () and the average fitness values. With a convex or concave Pareto front, eMPF always had the minimum optimal solution and consistency with repeatable solutions.
6. Conclusions
With a greater spread () than all the other mentioned optimization techniques, eMPF has demonstrated its effectiveness in generating a diverse solution set. When the number of objective functions was increased, eMPF consistently achieved better performance. In most of the test functions, eMPF demonstrated its performance by reaching nearly the lowest standard deviations. This proves its capabilities for achieving quality solutions over the other methods. However, as mentioned in Section 5, there were certain cases where other optimizers slightly outperformed eMPF, but overall, eMPF consistently performed either best or near best. Future work will focus on evaluating eMPF performance in more than three objective functions (many objective optimization) and in real world applications.
Author Contributions
Conceptualization, A.K.; methodology, A.K.; software, A.K.; validation, A.K.; formal analysis, A.K.; investigation, A.K.; resources, A.K.; data curation, A.K.; writing—original draft preparation, A.K.; writing—review and editing, A.K. and F.A.M.; visualization, A.K.; supervision, F.A.M. All authors have read and agreed to the published version of the manuscript.
Funding
This research received no external funding.
Data Availability Statement
https://github.com/kesireddyadarsh/mdpiAlgorithm, accessed on 31 March 2024.
Conflicts of Interest
The authors declare no conflicts of interest.
Abbreviations
The following abbreviations are used in this manuscript:
| MOO | Multi-Objective Optimization |
| MCDM | Multi-Criteria Decision Making |
| EA | Evolutionary Algorithm |
| TOPSIS | Technique for Order of Preference by Similarity to Ideal Solution |
| NSGA-II | Non-Dominated Sorting Genetic Algorithm-II |
| NSGA-III | Non-Dominated Sorting Genetic Algorithm-III |
| M-PF | Multi-Criteria Decision Making–Pareto Front |
| eMPF | elite Multi-Criteria Decision Making–Pareto Front |
| CCEA | Cooperative Co-evolutionary Algorithms |
Appendix A
This section contains all the test MOO functions used for this paper, including the constraints and search domains of each MOO function.

Table A1.
Multi-objective optimization test functions.
| Function | Test Function | Constraints | Search Domain |
|---|---|---|---|
| Binh and Korn Function | |||
| Chankong and Haimes Function | |||
| Fonseca–Fleming Function | |||
| Test Function 4 | 0 | ||
| Kursawe Function | |||
| Schaffer Function N1 | Values of A from 10 to | ||
| Schaffer Function N2 | |||
| Poloni’s Two-Objective Function | where | ; | |
| Zitzler–Deb–Thiele’s Function (ZDT) N1 | |||
| Zitzler–Deb–Thiele’s Function (ZDT) N2 | |||
| Zitzler–Deb–Thiele’s Function (ZDT) N3 | |||
| Zitzler–Deb–Thiele’s Function (ZDT) N4 | |||
| Zitzler–Deb–Thiele’s Function (ZDT) N6 | |||
| Osyczka & Kundu Function | |||
| Constr-Ex Problem | |||
| VR-UC Test 1 | |||
| VR-UC Test 2 | |||
| MSGA Test 1 | |||
| MHHM1 | |||
| MHHM2 | |||
| Viennet Function |
Appendix B
Thirty statistical simulation runs were performed using NSGA-II, NSGA-III, M-PF, and the eMPF optimizer on the test functions mentioned in Appendix A.
Table A2.
Results for the two-objective function using each optimization technique.
| Test Function | Method | Minimum | Mean | Standard Deviation | |||
|---|---|---|---|---|---|---|---|
| Function 1 | Function 2 | Function 1 | Function 2 | Function 1 | Function 2 | ||
| NSGA-II | 0.000948 | 4.005556 | 52.645992 | 17.283002 | 39.400303 | 12.500695 | |
| Binh and Korn | NSGA-III | 9.332152 | 4.533799 | 100.464088 | 10.277145 | 43.565188 | 13.756248 |
| M-PF | 9.498507 | 10.473067 | 32.993437 | 19.539373 | 18.265393 | 7.521567 | |
| eMPF | 0.002037 | 4.023522 | 14.015699 | 29.174421 | 17.331893 | 5.806211 | |
| NSGA-II | 10.119513 | −217.695484 | 113.45425 | −112.737342 | 62.128512 | 62.677727 | |
| Chankong Haimes | NSGA-III | 96.621684 | −217.730419 | 213.296477 | −210.363403 | 20.65679 | 24.166874 |
| M-PF | 57.01729 | −101.645503 | 80.131923 | −80.211533 | 48.913044 | 48.881173 | |
| eMPF | 10.125042 | −217.686516 | 127.519573 | −127.352052 | 23.87205 | 24.71453 | |
| Fonseca–Fleming | NSGA-II | 0.000034 | 0.000042 | 0.578248 | 0.580166 | 0.296733 | 0.296151 |
| NSGA-III | 0.092419 | 0.032975 | 0.723804 | 0.497992 | 0.153209 | 0.159965 | |
| M-PF | 0.070628 | 0.066346 | 0.609386 | 0.596173 | 0.226319 | 0.233033 | |
| eMPF | 0.000022 | 0.000021 | 0.511756 | 0.499501 | 0.465786 | 0.466366 | |
| NSGA-II | −6.504972 | −8.499939 | −1.534355 | −8.145423 | 3.336720 | 0.277358 | |
| Test Function 4 | NSGA-III | −6.506321 | −8.498921 | −5.331177 | −7.623771 | 3.929542 | 0.229023 |
| M-PF | −6.392928 | −8.316240 | −4.654117 | −7.854135 | 1.901964 | 0.210908 | |
| eMPF | −6.506243 | −8.499792 | −5.808833 | −7.636678 | 2.520614 | 0.161645 | |
| NSGA-II | −19.785629 | −5.138218 | −10.217168 | −2.560673 | 3.696744 | 1.566748 | |
| Kursawe | NSGA-III | −19.800519 | −2.761169 | −12.516551 | −1.290272 | 2.812103 | 0.732146 |
| M-PF | −12.427413 | −3.105100 | −9.705192 | −1.623625 | 0.963143 | 0.812313 | |
| eMPF | −19.823842 | −5.133368 | −12.190258 | −1.771524 | 3.224230 | 1.219680 | |
| NSGA-II | 0.000000 | 0.000000 | 1.309796 | 1.335708 | 1.171495 | 1.178720 | |
| Schaffer function N1 | NSGA-III | 0.458913 | 0.452471 | 2.092166 | 1.548018 | 1.830392 | 1.803354 |
| M-PF | 0.314452 | 0.365226 | 1.484631 | 1.911246 | 1.678226 | 1.713672 | |
| eMPF | 0.000000 | 0.000000 | 1.118533 | 1.121366 | 0.726276 | 0.734062 | |
| NSGA-II | −0.999966 | 0.000000 | 0.519161 | 7.217303 | 1.030891 | 4.693345 | |
| Schaffer function N2 | NSGA-III | −0.824930 | 7.796460 | −0.624833 | 14.028193 | 0.942749 | 4.035698 |
| M-PF | 0.178468 | 3.991629 | 0.742443 | 8.141138 | 1.744642 | 6.828264 | |
| eMPF | −0.999503 | 0.000000 | 2.162599 | 0.964716 | 0.513256 | 1.922794 | |
| NSGA-II | 1.000107 | 0.000011 | 6.867533 | 6.300837 | 5.010289 | 9.464460 | |
| Poloni’s two objectives | NSGA-III | 2.072667 | 8.096344 | 7.516216 | 13.666458 | 7.204542 | 11.749644 |
| M-PF | 2.646164 | 1.748814 | 12.385470 | 3.525388 | 5.237112 | 7.848127 | |
| eMPF | 1.000656 | 0.000035 | 3.790499 | 2.429406 | 2.910871 | 3.427426 | |
| NSGA-II | 0.000016 | 1.830778 | 0.259772 | 3.291023 | 0.295645 | 0.985772 | |
| ZDT’s N1 | NSGA-III | 0.000012 | 1.836794 | 0.294363 | 3.228128 | 0.313797 | 1.012261 |
| M-PF | 0.000016 | 1.852934 | 0.279310 | 3.224510 | 0.302015 | 0.972492 | |
| eMPF | 0.000027 | 1.831970 | 0.284748 | 3.219609 | 0.305802 | 0.967179 | |
| NSGA-II | 0.000020 | 3.360521 | 0.146886 | 4.209470 | 0.265380 | 0.626616 | |
| ZDT’s N2 | NSGA-III | 0.000018 | 3.397406 | 0.150892 | 4.200882 | 0.275458 | 0.627170 |
| M-PF | 0.000015 | 3.389850 | 0.124176 | 4.231827 | 0.244155 | 0.646990 | |
| eMPF | 0.000015 | 3.384750 | 0.154723 | 4.262611 | 0.274839 | 0.691868 | |
| NSGA-II | 0.000015 | 1.197987 | 0.302574 | 3.009383 | 0.295633 | 1.165188 | |
| ZDT’s N3 | NSGA-III | 0.000016 | 1.250750 | 0.288800 | 3.049543 | 0.294440 | 1.148127 |
| M-PF | 0.000015 | 1.230596 | 0.299095 | 3.019458 | 0.296260 | 1.142140 | |
| eMPF | 0.000014 | 1.221293 | 0.306138 | 2.997215 | 0.302244 | 1.155063 | |
| NSGA-II | 0.000014 | 28.918132 | 0.084849 | 64.349782 | 0.174179 | 32.479856 | |
| ZDT’s N4 | NSGA-III | 0.000017 | 30.178694 | 0.077131 | 69.368632 | 0.168524 | 34.873943 |
| M-PF | 0.000011 | 28.018323 | 0.081965 | 65.590350 | 0.166882 | 33.832099 | |
| eMPF | 0.000013 | 27.480261 | 0.105229 | 62.256601 | 0.201626 | 31.532401 | |
| NSGA-II | 0.280775 | 6.356673 | 0.492336 | 7.271715 | 0.278471 | 0.661174 | |
| ZDT’s N6 | NSGA-III | 0.280775 | 6.233513 | 0.499382 | 7.221104 | 0.281440 | 0.653730 |
| M-PF | 0.280775 | 6.276437 | 0.474475 | 7.257931 | 0.269862 | 0.630176 | |
| eMPF | 0.280775 | 6.268319 | 0.491137 | 7.239478 | 0.285670 | 0.677693 | |
| NSGA-II | −258.627419 | 5.194767 | −164.898915 | 28.366042 | 62.986998 | 21.322610 | |
| Osyczka and Kundu | NSGA-III | −258.633516 | 5.433823 | −168.598553 | 29.169913 | 62.053323 | 20.778173 |
| M-PF | −255.080484 | 5.367792 | −162.235317 | 26.606650 | 60.836597 | 18.988171 | |
| eMPF | −257.382419 | 5.312247 | −167.069531 | 28.639926 | 61.643875 | 21.469461 | |
| NSGA-II | 0.390717 | 1.007121 | 0.547760 | 4.747238 | 0.139116 | 2.426397 | |
| Const-Ex | NSGA-III | 0.390230 | 1.515615 | 0.441708 | 7.518592 | 0.093502 | 1.616727 |
| M-PF | 0.445405 | 1.175281 | 0.616617 | 2.902549 | 0.093789 | 1.547132 | |
| eMPF | 0.391615 | 1.004618 | 0.766952 | 1.719732 | 0.099745 | 1.512755 | |
| VR-UC Test 1 | NSGA-II | 0.052761 | 1.000574 | 0.156242 | 17.296326 | 0.193932 | 10.902374 |
| NSGA-III | 0.052718 | 2.866609 | 0.074163 | 31.895484 | 0.086781 | 8.590167 | |
| M-PF | 0.070903 | 2.921766 | 0.144710 | 7.997647 | 0.057197 | 3.582939 | |
| eMPF | 0.053224 | 1.000024 | 0.705932 | 2.339642 | 0.174928 | 5.048489 | |
| VR-UC Test 2 | NSGA-II | −4.995860 | −9.993871 | −4.995082 | −9.992874 | 0.002898 | 0.004093 |
| NSGA-III | −4.995535 | −9.993506 | −4.995059 | −9.992905 | 0.002668 | 0.003992 | |
| M-PF | −4.995112 | −9.993227 | −4.994349 | −9.992267 | 0.003135 | 0.003989 | |
| eMPF | −4.996121 | −9.994576 | −4.995738 | −9.993998 | 0.002667 | 0.003675 | |
| MSGA Test 1 | NSGA-II | 0.234489 | 0.235890 | 0.706906 | 0.709010 | 0.197887 | 0.197780 |
| NSGA-III | 0.549158 | 0.491633 | 0.779350 | 0.734232 | 0.086980 | 0.100268 | |
| M-PF | 0.554772 | 0.531218 | 0.768762 | 0.768141 | 0.051210 | 0.054106 | |
| eMPF | 0.231459 | 0.229316 | 0.661794 | 0.670574 | 0.247905 | 0.247862 | |
Table A3.
Results of the minimum values for three objective functions using each optimization technique.
Table A3.
Results of the minimum values for three objective functions using each optimization technique.
| Test Function | Method | Minimum | ||
|---|---|---|---|---|
| Function 1 | Function 2 | Function 3 | ||
| Viennet | NSGA-II | 0.000051 | 15.000000 | −0.099997 |
| NSGA-III | 131,609.806452 | 443,378.967742 | 0.000004 | |
| M-PF | 4292.110524 | 10,870.875716 | −0.002940 | |
| eMPF | 0.000028 | 15.000026 | −0.099998 | |
| MHHM1 | NSGA-II | 9.6666 × | 7.3333 × | 6.33333 × |
| NSGA-III | 6.193743 × | 4.7659963 × | 3.433997 × | |
| M-PF | 2.4781883 × | 7.064937 × | 7.134097 × | |
| eMPF | 1.0666 × | 9.6666 × | 5.3333 × | |
| MHHM2 | NSGA-II | 6.18220 × | 1.7605 × | 2.837620 × |
| NSGA-III | 0.001283 | 0.001229 | 0.00249529 | |
| M-PF | 0.00029338 | 0.0004046536 | 0.0006900754 | |
| eMPF | 6.868939 × | 1.63898 × | 4.5422 × | |
Table A4.
Results of the mean values for three objective functions using each optimization technique.
Table A4.
Results of the mean values for three objective functions using each optimization technique.
| Test Function | Method | Mean | ||
|---|---|---|---|---|
| Function 1 | Function 2 | Function 3 | ||
| Viennet | NSGA-II | 3.330086 | 15.285244 | 0.053903 |
| NSGA-III | 132,295.691684 | 445,689.241041 | 0.000004 | |
| M-PF | 4607.780516 | 11,696.522534 | 0.001230 | |
| eMPF | 0.572229 | 15.485611 | −0.024929 | |
| MHHM1 | NSGA-II | 0.0034099 | 0.0009104 | 0.00341086 |
| NSGA-III | 0.0013004 | 0.0005224 | 0.00474447 | |
| M-PF | 0.00443803 | 0.002016614 | 0.00459519 | |
| eMPF | 0.0026903 | 0.00020094 | 0.00271158 | |
| MHHM2 | NSGA-II | 0.0054150 | 0.005925 | 0.00555724 |
| NSGA-III | 0.0035569 | 0.003649 | 0.0063590 | |
| M-PF | 0.004642219 | 0.00528738 | 0.005879 | |
| eMPF | 0.0042817 | 0.0046030 | 0.004078 | |
Table A5.
Results of the standard deviations for three objective functions using each optimization technique.
Table A5.
Results of the standard deviations for three objective functions using each optimization technique.
| Test Function | Method | Standard Deviation | ||
|---|---|---|---|---|
| Function 1 | Function 2 | Function 3 | ||
| Viennet | NSGA-II | 2.688537 | 0.511459 | 0.081092 |
| NSGA-III | 6979.937413 | 26,870.603732 | 0.000000 | |
| M-PF | 2278.826105 | 7778.051973 | 0.010432 | |
| eMPF | 0.330933 | 0.328919 | 0.049485 | |
| MHHM1 | NSGA-II | 0.00313115 | 0.00079 | 0.0031071 |
| NSGA-III | 0.0016641 | 0.0004383 | 0.00146057 | |
| M-PF | 0.0045989 | 0.00074356 | 0.004502838 | |
| eMPF | 0.001529 | 0.00059 | 0.0015419 | |
| MHHM1 | NSGA-II | 0.003749 | 0.00417569 | 0.0037675 |
| NSGA-III | 0.001986 | 0.0018050 | 0.0020722 | |
| M-PF | 0.0032253 | 0.0035306 | 0.0034066 | |
| eMPF | 0.0020989 | 0.0021489 | 0.002019 | |
Appendix C
In this part, the Pareto front spread value obtained for the fitness values is presented. The Pareto fronts generated for Appendix B were used to generate this. The code used for generating this is in the Github link provided.
Table A6.
Generational distance (), spread (), and spacing () of the test functions.
| Test Function | Method | Generational Distance | Spread () | Spacing () |
|---|---|---|---|---|
| Binh and Korn | NSGA-II NSGA-III M-PF eMPF | 0.069016 0.378684 1.333222 0.770759 | 0.938548 1.530796 1.233198 1.584592 | 0.185688 0.554448 1.062628 1.040446 |
| Chankong Haimes | NSGA-II NSGA-III M-PF eMPF | 0.132257 6.711842 1.897858 10.481315 | 0.803492 1.600441 0.99258 1.220204 | 0.216754 3.754718 0.41429 2.947663 |
| Fonseca Fleming | NSGA-II NSGA-III M-PF eMPF | 0.000838 0.002347 0.000664 0.006234 | 0.86052 1.401653 1.134345 1.664327 | 0.001535 0.004618 0.00218 0.006798 |
| Test Function 4 | NSGA-II NSGA-III M-PF eMPF | 0.006338 0.133243 0.020431 0.081445 | 0.938548 1.530796 1.233198 1.584592 | 0.039957 0.287708 0.061413 0.14012 |
| Kursawe | NSGA-II NSGA-III M-PF eMPF | 0.006938 0.70871 0.127039 0.075359 | 0.803527 0.911151 1.19283 0.892111 | 0.336557 0.470105 0.334158 0.45627 |
| Schaffer Function N1 | NSGA-II NSGA-III M-PF eMPF | 0.000985 0.003258 0.003113 0.002111 | 0.772657 1.44585 1.44585 1.274417 | 0.002629 0.007116 0.00495 0.005048 |
| Schaffer Function N2 | NSGA-II NSGA-III M-PF eMPF | 0.001906 0.130632 0.010325 0.096201 | 0.742149 1.514319 1.319566 1.621567 | 0.006122 0.097936 0.023796 0.070892 |
| Poloni’s Two Objectives | NSGA-II NSGA-III M-PF eMPF | 0.0127 0.102661 0.031244 0.186827 | 1.47718 1.789741 1.791253 1.55847 | 0.737613 0.693373 0.664818 0.984685 |
| Zitzler–Deb–Thiele’s N1 | NSGA-II NSGA-III M-PF eMPF | 0.042448 0.052309 0.045381 0.048533 | 0.7066 0.712719 0.721581 0.685075 | 0.074755 0.077806 0.07787 0.147347 |
| Zitzler–Deb–Thiele’s N2 | NSGA-II NSGA-III M-PF eMPF | 0.073596 0.041085 0.068744 0.070442 | 0.697774 0.710485 0.738163 0.712368 | 0.19127 0.113637 0.120021 0.16111 |
| Zitzler–Deb–Thiele’s N3 | NSGA-II NSGA-III M-PF eMPF | 0.032912 0.030987 0.044047 0.040325 | 0.714989 0.660256 0.662726 0.72205 | 0.098628 0.102081 0.111724 0.084448 |
| Zitzler–Deb–Thiele’s N4 | NSGA-II NSGA-III M-PF eMPF | 0.810677 2.272926 2.018945 2.279626 | 0.744636 0.757631 0.786935 0.738201 | 9.043884 7.516822 8.574137 9.78726 |
| Zitzler–Deb–Thiele’s N6 | NSGA-II NSGA-III M-PF eMPF | 0.191495 0.099431 0.065991 0.092465 | 0.685276 0.59864 0.638246 0.69825 | 0.115021 0.140287 0.173285 0.260617 |
| Osycak and Kundu Function | NSGA-II NSGA-III M-PF eMPF | 1.504086 1.294484 1.316762 1.388888 | 1.178373 1.127386 1.132501 1.2232 | 3.283527 2.84922 3.077236 3.686033 |
| Constr-Ex Problem | NSGA-II NSGA-III M-PF eMPF | 0.00495 0.043087 0.02453 0.07408 | 0.714432 1.313374 1.179857 1.683737 | 0.012929 0.067725 0.042256 0.090675 |
| MSGA Test 1 | NSGA-II NSGA-III M-PF eMPF | 0.000538 0.013212 0.012998 0.003187 | 0.972065 1.038185 1.492854 1.242157 | 0.002284 0.015305 0.006631 0.004642 |
| VR-UC Test 1 | NSGA-II NSGA-III M-PF eMPF | 0.01332 0.070166 0.142823 0.38772 | 0.786952 1.427575 1.316431 1.695775 | 0.05018 0.176857 0.190408 0.402943 |
| VR-UC Test 2 | NSGA-II NSGA-III M-PF eMPF | 9.4 × 9.4 × 0.000324 0.000273 | 0.717724 0.636498 0.577738 0.712867 | 0.00000 0.00000 0.00000 0.00000 |
| Vinnet Function | NSGA-II NSGA-III M-PF eMPF | 0.00169 0.627138 1.615187 0.648107 | 0.782624 0.989541 1.21211 1.557092 | 0.015777 0.087255 0.169447 0.095202 |
| MHHM1 | NSGA-II NSGA-III M-PF eMPF | 6 × 2.8 × 1.8 × 2.3 × | 0.772737 1.640253 1.620182 1.688381 | 1.1 × 3.3 × 2.6 × 3.5 × |
| MHHM2 | NSGA-II NSGA-III M-PF eMPF | 0.000401 0.001194 0.000514 0.001207 | 0.651384 0.765195 0.798712 0.702216 | 0.003814 0.001724 0.003292 0.001756 |
References
- Garey, M.R.; Johnson, D.S. Computers and Intractability; Freeman: San Francisco, CA, USA, 1979; Volume 174. [Google Scholar]
- Hooshyar, M.; Huang, Y.M. Meta-heuristic Algorithms in UAV Path Planning Optimization: A Systematic Review (2018–2022). Drones 2023, 7, 687. [Google Scholar] [CrossRef]
- Muñoz, M.A.; Sun, Y.; Kirley, M.; Halgamuge, S.K. Algorithm selection for black-box continuous optimization problems: A survey on methods and challenges. Inf. Sci. 2015, 317, 224–245. [Google Scholar] [CrossRef]
- Deb, K.; Pratap, A.; Agarwal, S.; Meyarivan, T. A fast and elitist multiobjective genetic algorithm: NSGA-II. IEEE Trans. Evol. Comput. 2002, 6, 182–197. [Google Scholar] [CrossRef]
- Deb, K.; Jain, H. An evolutionary many-objective optimization algorithm using reference-point-based nondominated sorting approach, part I: Solving problems with box constraints. IEEE Trans. Evol. Comput. 2013, 18, 577–601. [Google Scholar] [CrossRef]
- Kennedy, J.; Eberhart, R. Particle swarm optimization. In Proceedings of the ICNN’95-International Conference on Neural Networks, Perth, WA, Australia, 27 November–1 December 1995; Volume 4, pp. 1942–1948. [Google Scholar]
- Dorigo, M.; Birattari, M.; Stutzle, T. Ant colony optimization. IEEE Comput. Intell. Mag. 2006, 1, 28–39. [Google Scholar] [CrossRef]
- Horn, J.; Nafpliotis, N.; Goldberg, D.E. A niched Pareto genetic algorithm for multiobjective optimization. In Proceedings of the First IEEE Conference on Evolutionary Computation, IEEE World Congress on Computational Intelligence, Orlando, FL, USA, 27–29 June 1994; pp. 82–87. [Google Scholar]
- Gunasekara, R.C.; Mehrotra, K.; Mohan, C.K. Multi-objective optimization to identify key players in social networks. In Proceedings of the 2014 IEEE/ACM International Conference on Advances in Social Networks Analysis and Mining (ASONAM 2014), Beijing, China, 17–20 August 2014; pp. 443–450. [Google Scholar]
- Stavroulakis, G.E.; Charalambidi, B.G.; Koutsianitis, P. Review of computational mechanics, optimization, and machine learning tools for digital twins applied to infrastructures. Appl. Sci. 2022, 12, 11997. [Google Scholar] [CrossRef]
- Murray, A.T.; Baik, J. Opensource spatial optimization in GIScience for strategic positioning. Trans. GIS 2023, 27, 646–662. [Google Scholar] [CrossRef]
- Sahoo, S.K.; Goswami, S.S. A comprehensive review of multiple criteria decision-making (MCDM) Methods: Advancements, applications, and future directions. Decis. Mak. Adv. 2023, 1, 25–48. [Google Scholar] [CrossRef]
- Chen, H.; Lu, C.; Feng, L.; Liu, Z.; Sun, Y.; Chen, W. Structural optimization design of BIW using NSGA-III and entropy weighted TOPSIS methods. Adv. Mech. Eng. 2023, 15, 16878132231220351. [Google Scholar] [CrossRef]
- Akbari, M.; Asadi, P.; Rahimi Asiabaraki, H. A Hybrid Method of NSGA-II and TOPSIS to Optimize the Performance of Friction Stir Extrusion. Iran. J. Mater. Form. 2021, 8, 46–62. [Google Scholar]
- Alkayem, N.F.; Cao, M.; Ragulskis, M. Damage diagnosis in 3D structures using a novel hybrid multiobjective optimization and FE model updating framework. Complexity 2018, 2018, 3541676. [Google Scholar] [CrossRef]
- Kesireddy, A.; Carrillo, L.R.G.; Baca, J. Multi-criteria decision making-pareto front optimization strategy for solving multi-objective problems. In Proceedings of the 2020 IEEE 16th International Conference on Control & Automation (ICCA), Singapore, 9–11 October 2020; pp. 53–58. [Google Scholar]
- Méndez, M.; Frutos, M.; Miguel, F.; Aguasca-Colomo, R. Topsis decision on approximate pareto fronts by using evolutionary algorithms: Application to an engineering design problem. Mathematics 2020, 8, 2072. [Google Scholar] [CrossRef]
- Coello Coello, C.A.; González Brambila, S.; Figueroa Gamboa, J.; Castillo Tapia, M.G.; Hernández Gómez, R. Evolutionary multiobjective optimization: Open research areas and some challenges lying ahead. Complex Intell. Syst. 2020, 6, 221–236. [Google Scholar] [CrossRef]
- Roy, B. Problems and methods with multiple objective functions. Math. Program. 1971, 1, 239–266. [Google Scholar] [CrossRef]
- Long, Q.; Wu, X.; Wu, C. Non-dominated sorting methods for multi-objective optimization: Review and numerical comparison. J. Ind. Manag. Optim. 2021, 17. [Google Scholar] [CrossRef]
- Taherdoost, H.; Madanchian, M. Multi-criteria decision making (MCDM) methods and concepts. Encyclopedia 2023, 3, 77–87. [Google Scholar] [CrossRef]
- Stević, Ž.; Durmić, E.; Gajić, M.; Pamučar, D.; Puška, A. A novel multi-criteria decision-making model: Interval rough SAW method for sustainable supplier selection. Information 2019, 10, 292. [Google Scholar] [CrossRef]
- Vaidya, O.S.; Kumar, S. Analytic hierarchy process: An overview of applications. Eur. J. Oper. Res. 2006, 169, 1–29. [Google Scholar] [CrossRef]
- Sarkar, A. A TOPSIS method to evaluate the technologies. Int. J. Qual. Reliab. Manag. 2013, 31, 2–13. [Google Scholar] [CrossRef]
- Borgulya, I. A ranking method for multiple-criteria decision-making. Int. J. Syst. Sci. 1997, 28, 905–912. [Google Scholar] [CrossRef]
- Blickle, T.; Thiele, L. A comparison of selection schemes used in evolutionary algorithms. Evol. Comput. 1996, 4, 361–394. [Google Scholar] [CrossRef]
- Sharma, S.; Kumar, V. A comprehensive review on multi-objective optimization techniques: Past, present and future. Arch. Comput. Methods Eng. 2022, 29, 5605–5633. [Google Scholar] [CrossRef]
- Li, X.; Wang, K.; Liu, L.; Xin, J.; Yang, H.; Gao, C. Application of the entropy weight and TOPSIS method in safety evaluation of coal mines. Procedia Eng. 2011, 26, 2085–2091. [Google Scholar] [CrossRef]
- Trautmann, H.; Rudolph, G.; Dominguez-Medina, C.; Schütze, O. Finding evenly spaced Pareto fronts for three-objective optimization problems. In EVOLVE-A Bridge between Probability, Set Oriented Numerics, and Evolutionary Computation II; Springer: Berlin/Heidelberg, Germany, 2013; pp. 89–105. [Google Scholar]
- Ishibuchi, H.; Masuda, H.; Tanigaki, Y.; Nojima, Y. Modified distance calculation in generational distance and inverted generational distance. In Proceedings of the Evolutionary Multi-Criterion Optimization: 8th International Conference, EMO 2015, Guimarães, Portugal, 29 March–1 April 2015; Part II 8. pp. 110–125. [Google Scholar]
- Riquelme, N.; Von Lücken, C.; Baran, B. Performance metrics in multi-objective optimization. In Proceedings of the 2015 Latin American Computing Conference (CLEI), Arequipa, Peru, 19–23 October 2015; pp. 1–11. [Google Scholar]
- Schott, J.R. Fault Tolerant Design Using Single and Multicriteria Genetic Algorithm Optimization. Ph.D. Thesis, Massachusetts Institute of Technology, Cambridge, MA, USA, 1995. [Google Scholar]
- Binh, T.T.; Korn, U. MOBES: A multiobjective evolution strategy for constrained optimization problems. In Proceedings of the Third International Conference on Genetic Algorithms (Mendel 97), Brno, Czech Republic, 25–27 June 1997; Volume 25, p. 27. [Google Scholar]
- Fonseca, C.M.; Fleming, P.J. An overview of evolutionary algorithms in multiobjective optimization. Evol. Comput. 1995, 3, 1–16. [Google Scholar] [CrossRef]
- Kita, H.; Yabumoto, Y.; Mori, N.; Nishikawa, Y. Multi-objective optimization by means of the thermodynamical genetic algorithm. In Parallel Problem Solving from Nature—PPSN IV, Proceedings of the International Conference on Evolutionary Computation—The 4th International Conference on Parallel Problem Solving from Nature, Berlin, Germany, 22–26 September 1996; Proceedings 4; Springer: Berlin/Heidelberg, Germany, 1996; pp. 504–512. [Google Scholar]
- Kursawe, F. A variant of evolution strategies for vector optimization. In Proceedings of the International Conference on Parallel Problem Solving from Nature, Dortmund, Germany, 1–3 October 1990; pp. 193–197. [Google Scholar]
- Schaffer, J.D. Multiple objective optimization with vector evaluated genetic algorithms. In Proceedings of the First International Conference on Genetic Algorithms and Their Applications; Psychology Press: London, UK, 2014; pp. 93–100. [Google Scholar]
- Khatamsaz, D.; Peddareddygari, L.; Friedman, S.; Allaire, D. Bayesian optimization of multiobjective functions using multiple information sources. AIAA J. 2021, 59, 1964–1974. [Google Scholar] [CrossRef]
- Deb, K.; Thiele, L.; Laumanns, M.; Zitzler, E. Scalable multi-objective optimization test problems. In Proceedings of the 2002 Congress on Evolutionary Computation. CEC’02 (Cat. No. 02TH8600), Honolulu, HI, USA, 12–17 May 2002; Volume 1, pp. 825–830. [Google Scholar]
- Osyczka, A.; Kundu, S. A new method to solve generalized multicriteria optimization problems using the simple genetic algorithm. Struct. Optim. 1995, 10, 94–99. [Google Scholar] [CrossRef]
- Rendón, M.V. A non-generational genetic algorithm for multiobjective optimization. In Proceedings of the 7th Interational Conference on Genetic Algorithms, East Lansing, MI, USA, 19–23 July 1997; pp. 658–665. [Google Scholar]
- Lis, J.; Eiben, Á.E. A multi-sexual genetic algorithm for multiobjective optimization. In Proceedings of the 1997 IEEE International Conference on Evolutionary Computation (ICEC’97), Indianapolis, IN, USA, 13–16 April 1997; pp. 59–64. [Google Scholar]
- Vlennet, R.; Fonteix, C.; Marc, I. Multicriteria optimization using a genetic algorithm for determining a Pareto set. Int. J. Syst. Sci. 1996, 27, 255–260. [Google Scholar] [CrossRef]
- Mao, J.; Hirasawa, K.; Hu, J.; Murata, J. Genetic symbiosis algorithm for multiobjective optimization problems. Trans. Soc. Instrum. Control Eng. 2001, 37, 893–901. [Google Scholar] [CrossRef]
Figure 1.
Set of objective space solutions for objective functions along with A, B, and C solutions.
Figure 1.
Set of objective space solutions for objective functions along with A, B, and C solutions.
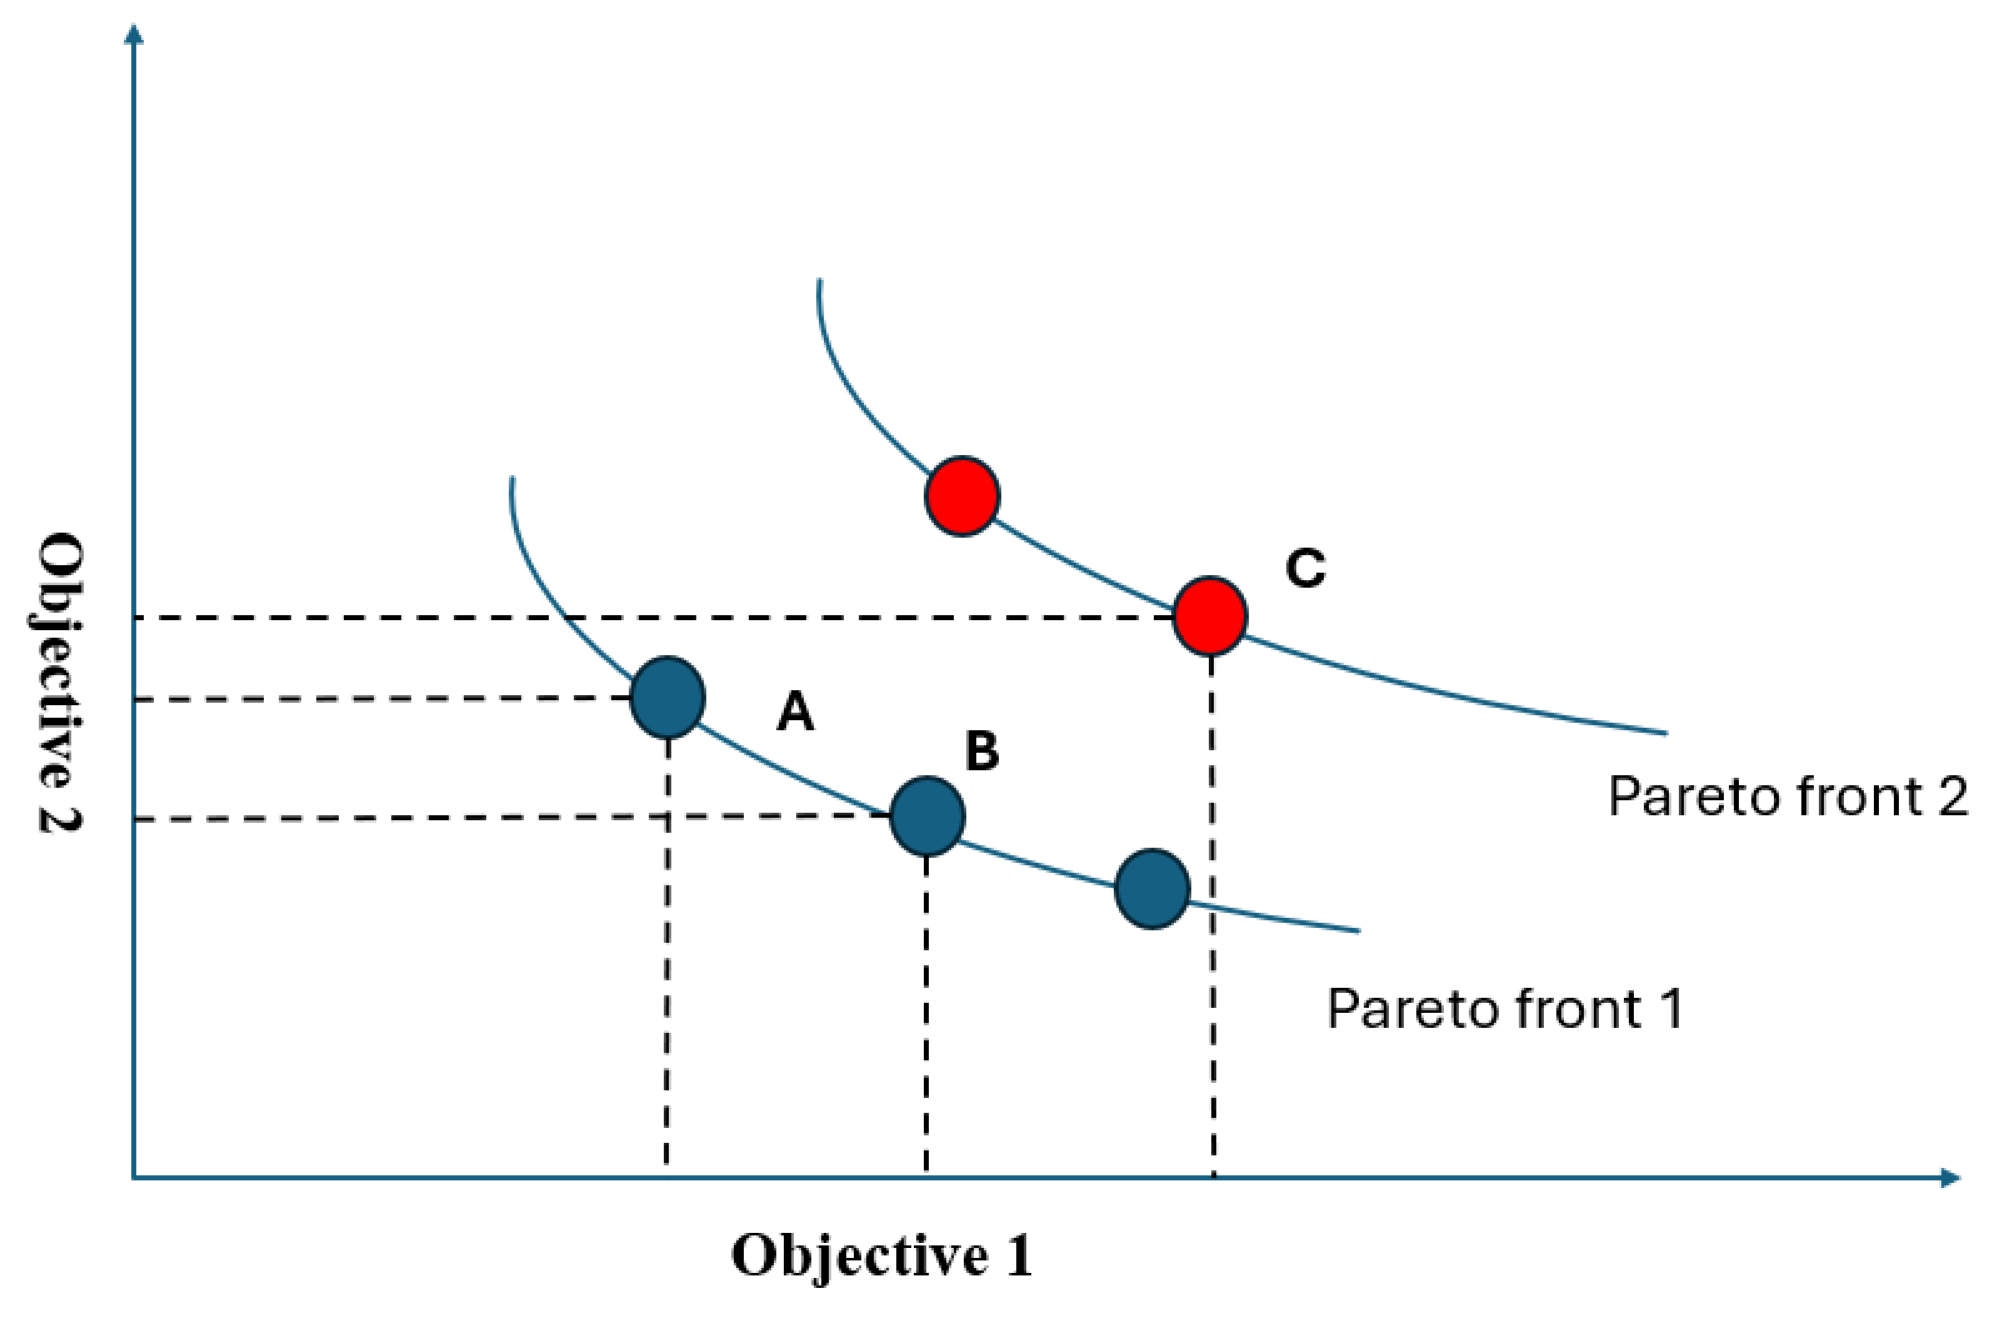
Figure 2.
eMPF process flow chart.
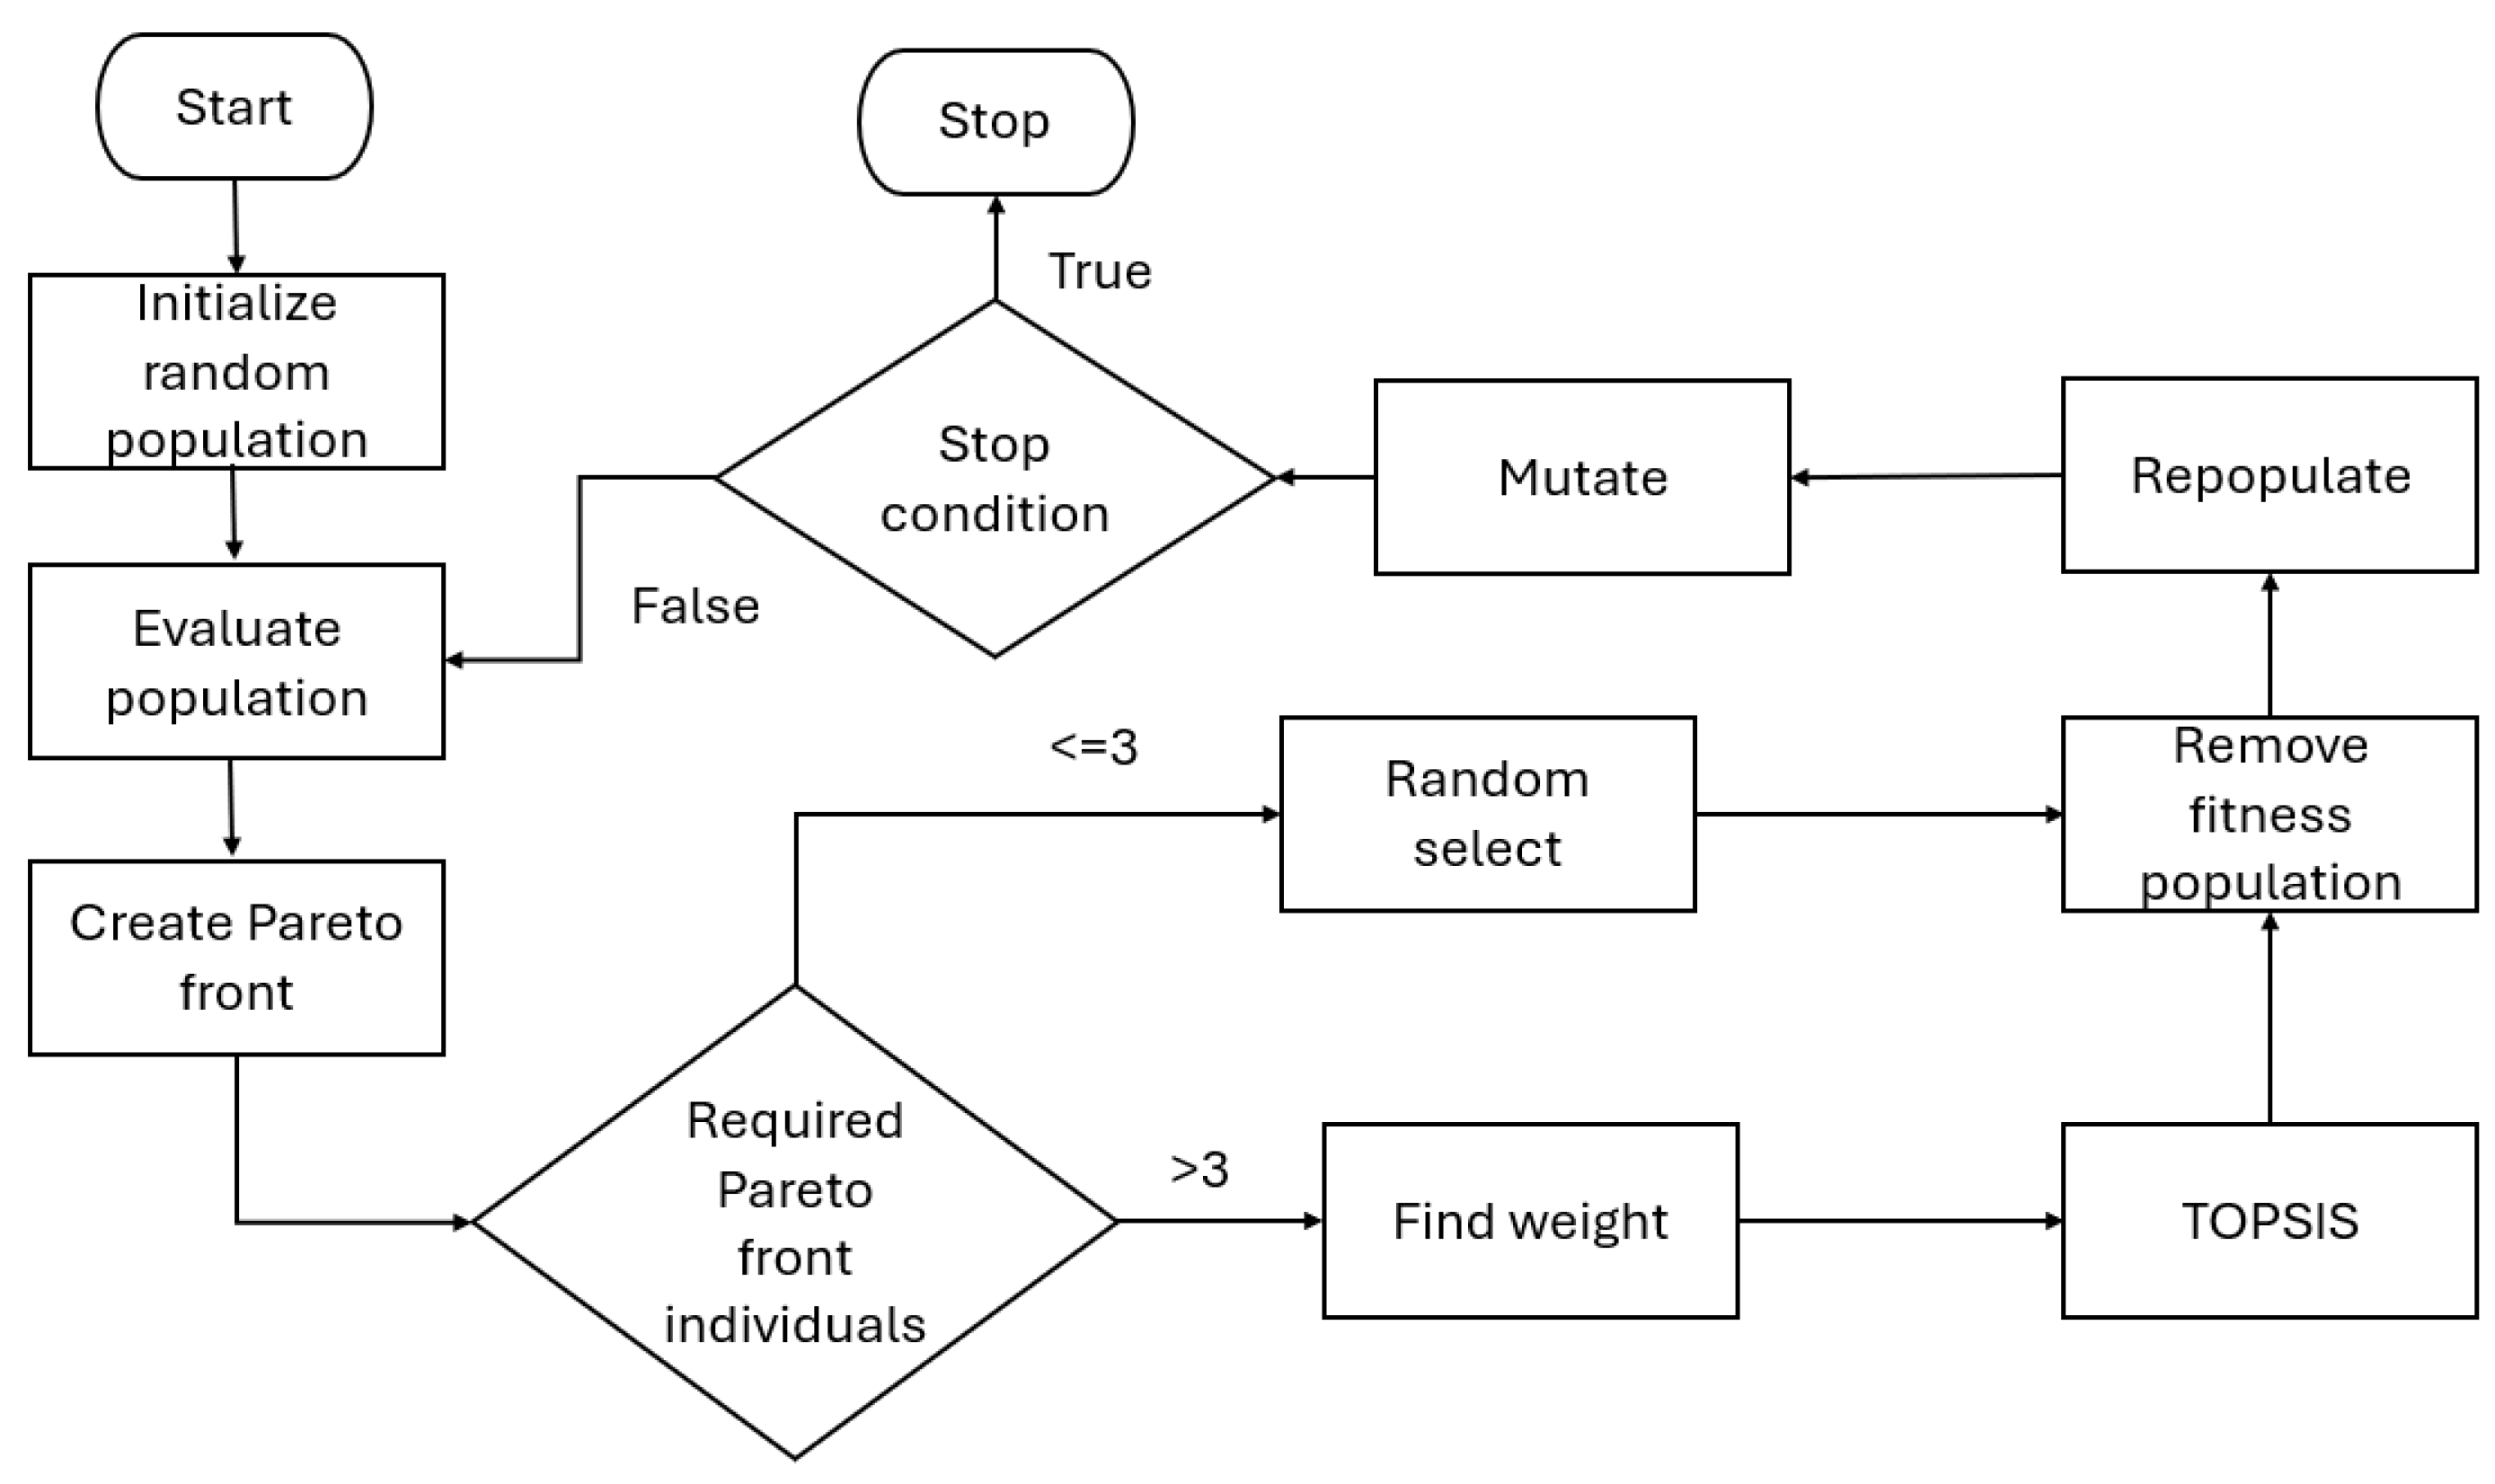
Figure 3.
Pareto front generated for the Chancing and Haimes function using NSGA-II, NSGA-III, M-PF, and eMPF optimizers.
Figure 3.
Pareto front generated for the Chancing and Haimes function using NSGA-II, NSGA-III, M-PF, and eMPF optimizers.
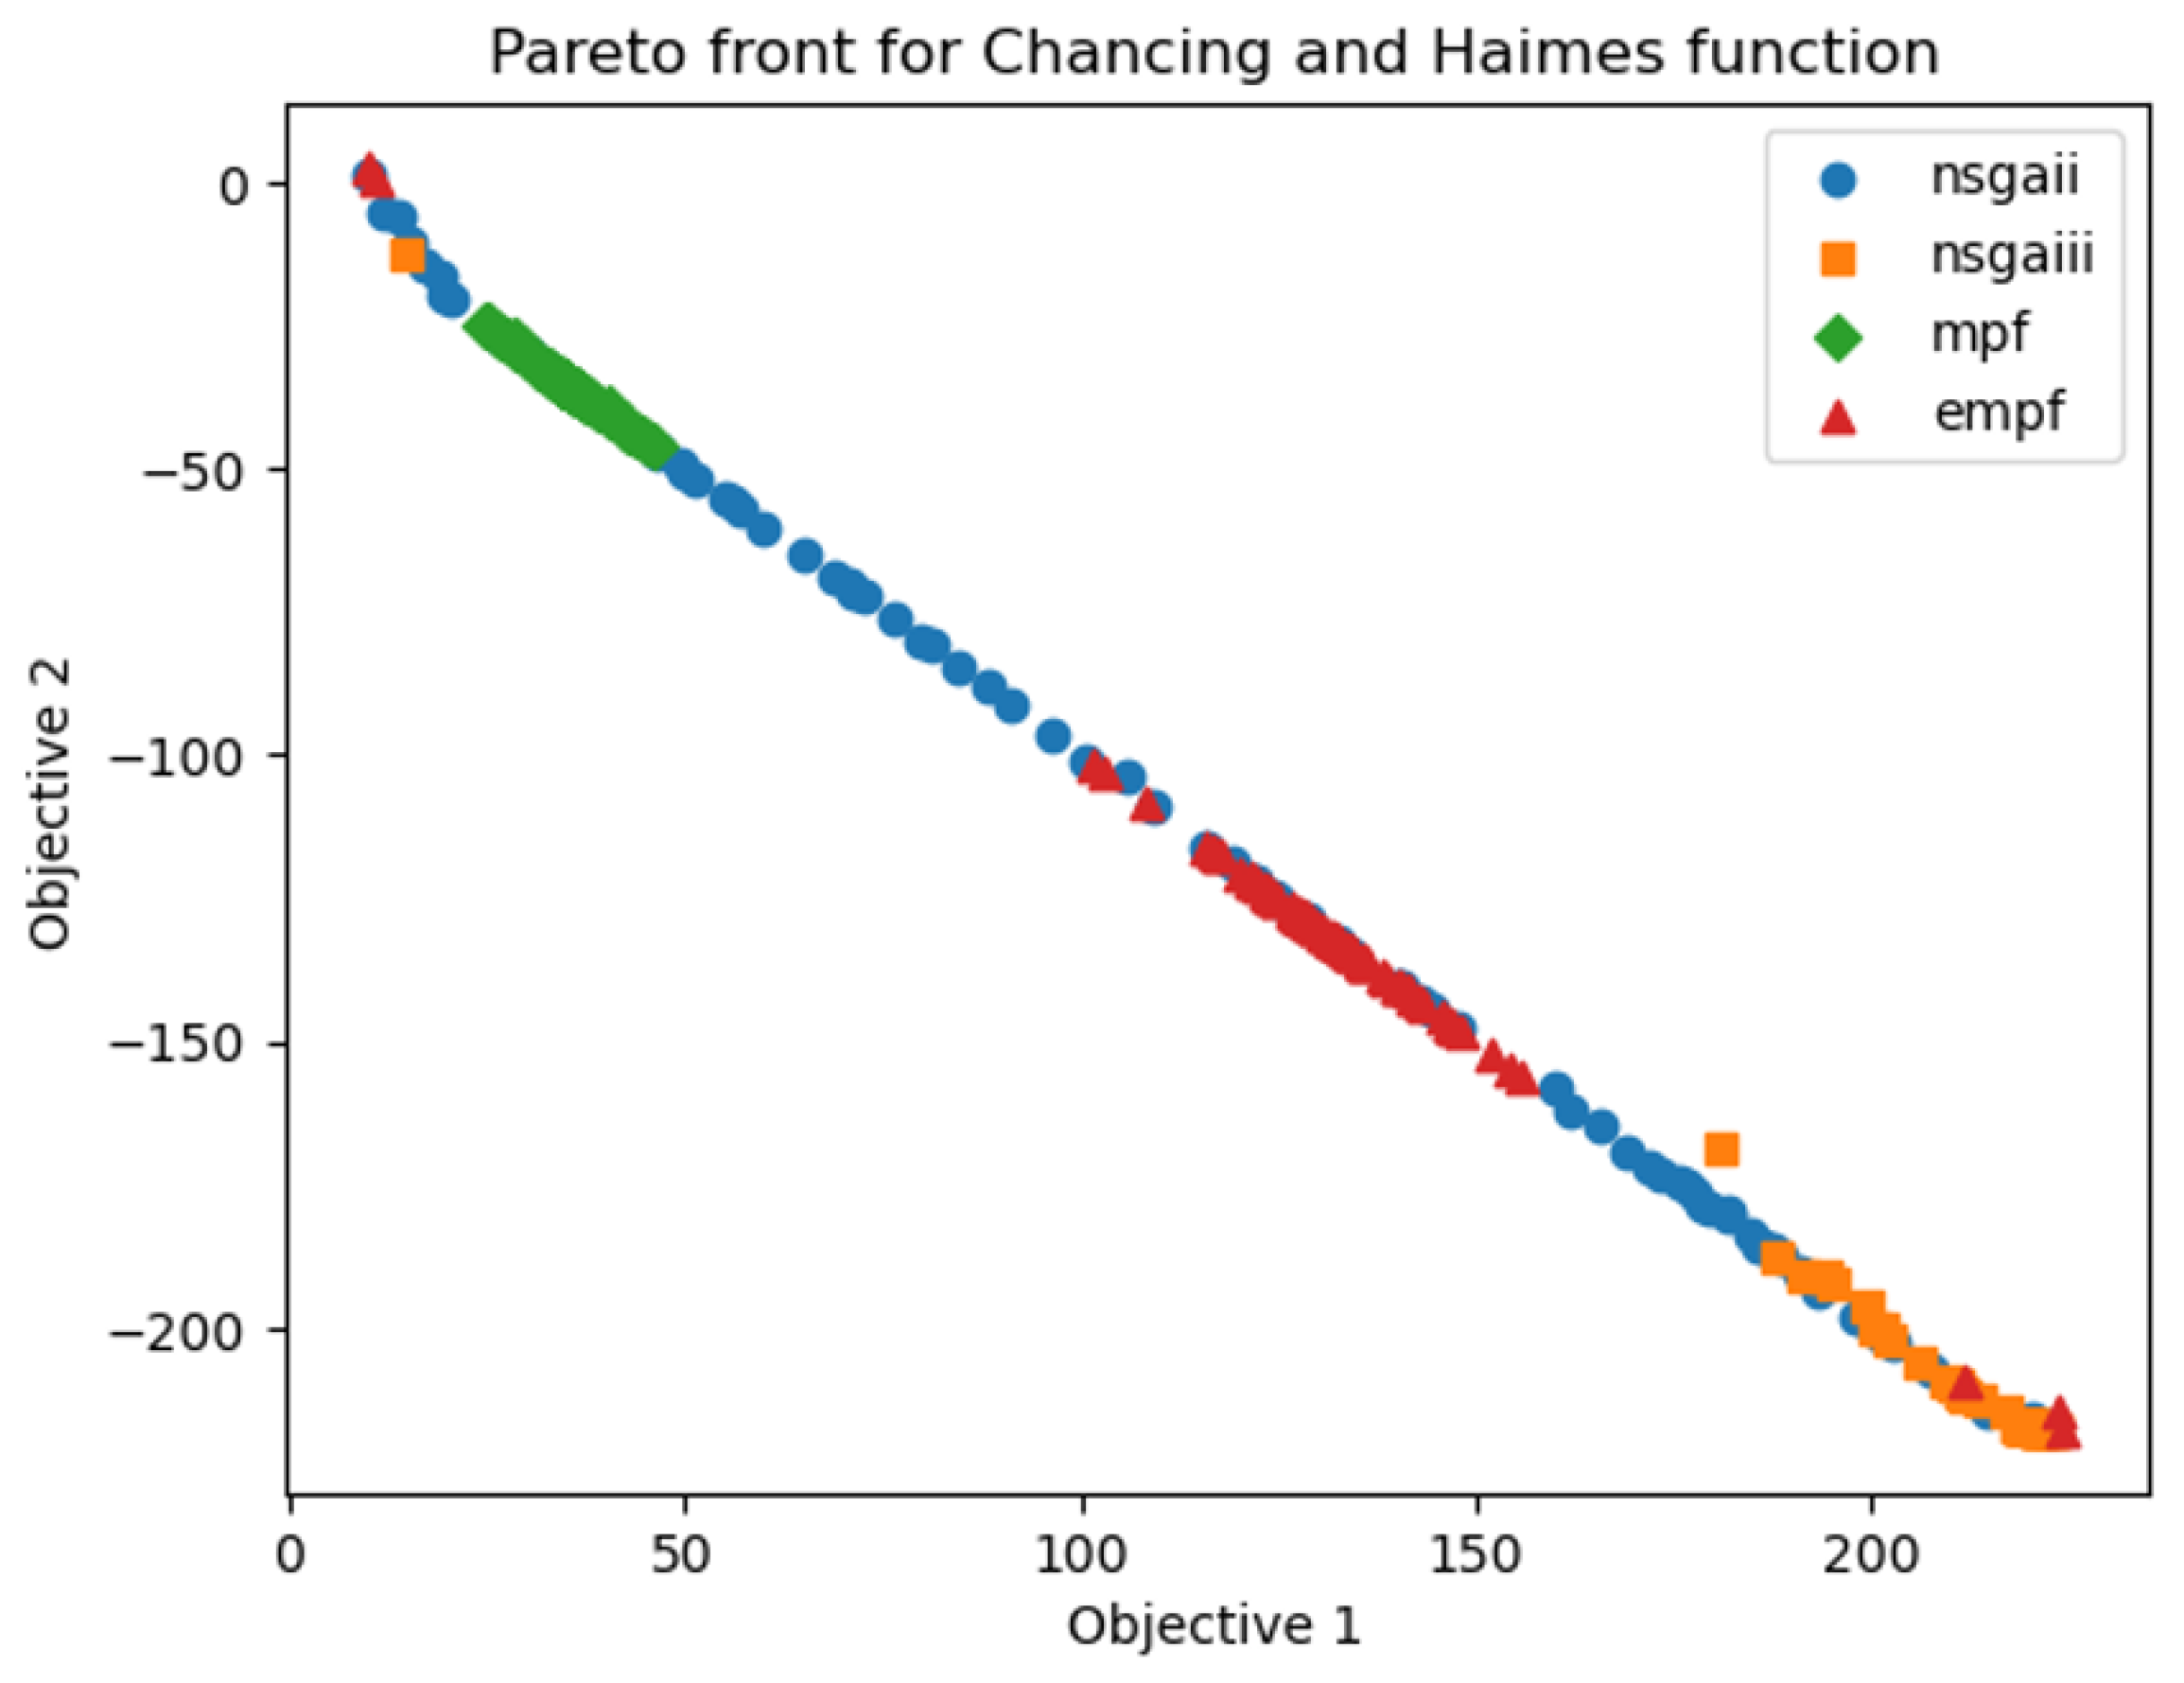
Figure 4.
Search space solutions for Const-Ex function.
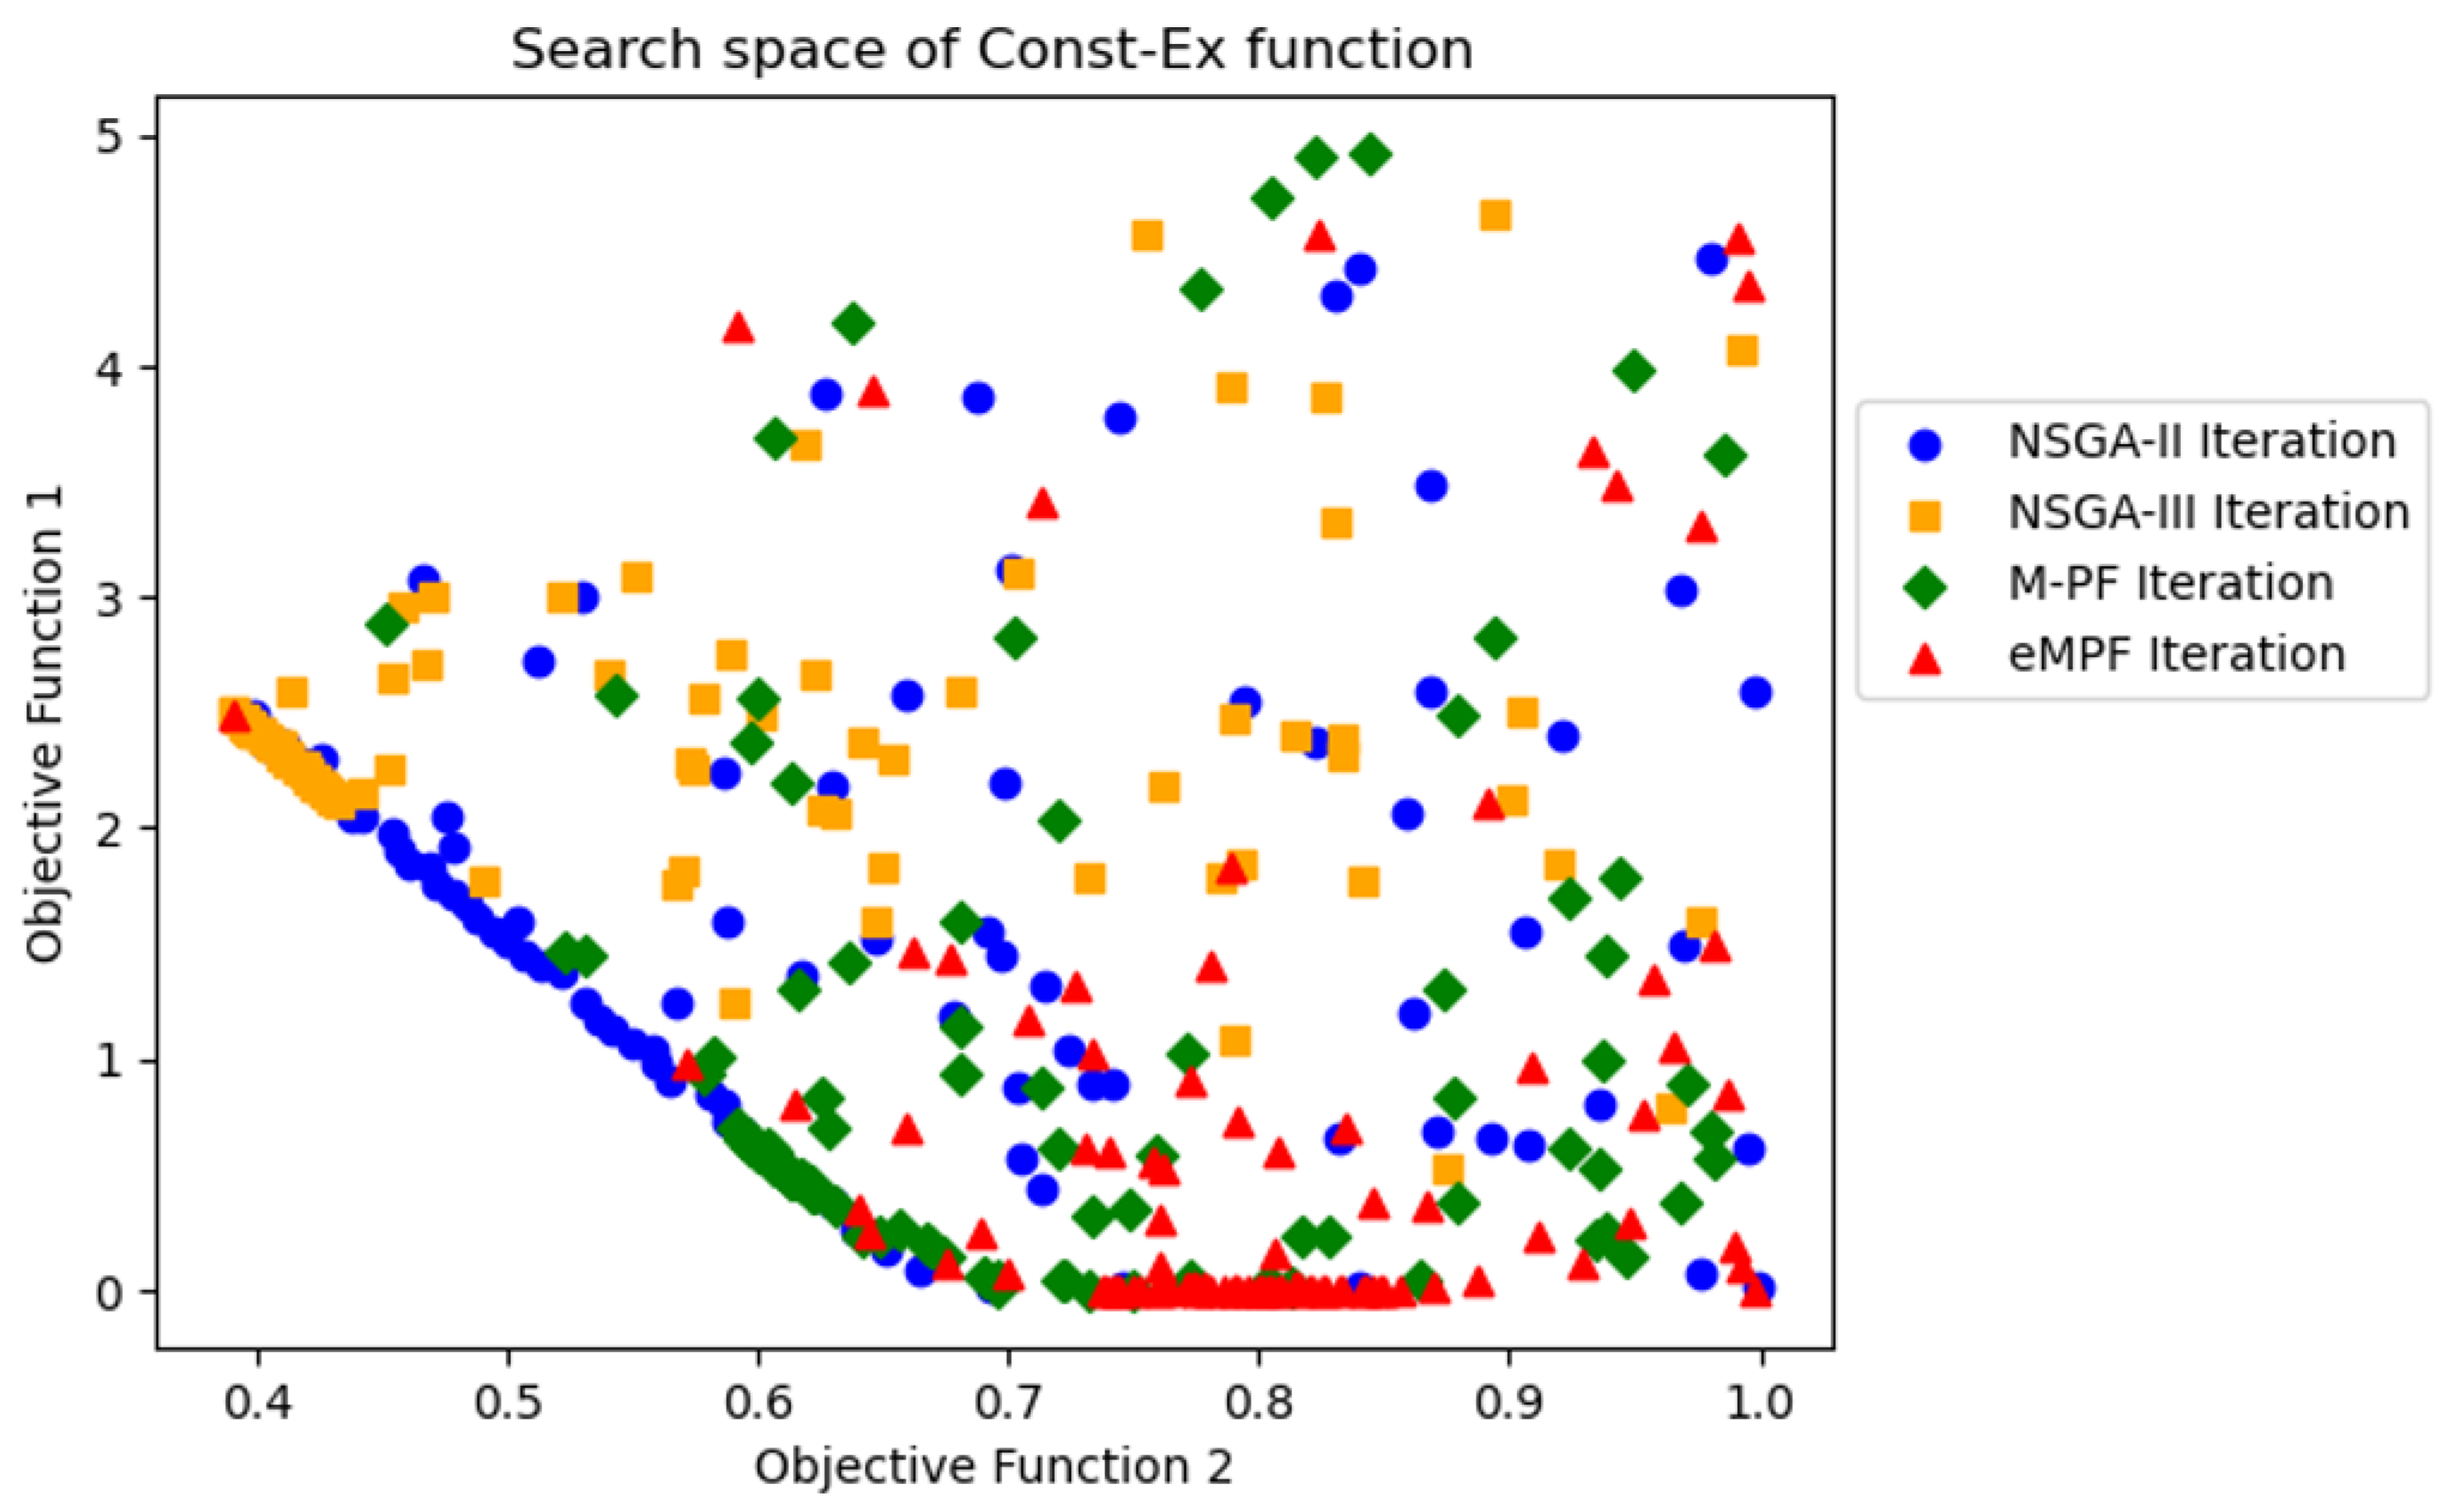
Figure 5.
Pareto front for the MHHM functions.
Disclaimer/Publisher’s Note: The statements, opinions and data contained in all publications are solely those of the individual author(s) and contributor(s) and not of MDPI and/or the editor(s). MDPI and/or the editor(s) disclaim responsibility for any injury to people or property resulting from any ideas, methods, instructions or products referred to in the content. |
© 2024 by the authors. Licensee MDPI, Basel, Switzerland. This article is an open access article distributed under the terms and conditions of the Creative Commons Attribution (CC BY) license (https://creativecommons.org/licenses/by/4.0/).
Share and Cite
MDPI and ACS Style
Kesireddy, A.; Medrano, F.A. Elite Multi-Criteria Decision Making—Pareto Front Optimization in Multi-Objective Optimization. Algorithms 2024, 17, 206. https://doi.org/10.3390/a17050206
AMA Style
Kesireddy A, Medrano FA. Elite Multi-Criteria Decision Making—Pareto Front Optimization in Multi-Objective Optimization. Algorithms. 2024; 17(5):206. https://doi.org/10.3390/a17050206
Chicago/Turabian StyleKesireddy, Adarsh, and F. Antonio Medrano. 2024. "Elite Multi-Criteria Decision Making—Pareto Front Optimization in Multi-Objective Optimization" Algorithms 17, no. 5: 206. https://doi.org/10.3390/a17050206
Note that from the first issue of 2016, this journal uses article numbers instead of page numbers. See further details here.