Damage Diagnosis of Reactive Powder Concrete under Fatigue Loading Using 3D Laser Scanning Technology


1
College of Civil Engineering, Northeast Forestry University, Harbin 150040, China
2
College of Science, Northeast Forestry University, Harbin 150040, China
*
Authors to whom correspondence should be addressed.
Algorithms 2019, 12(12), 260; https://doi.org/10.3390/a12120260
Submission received: 31 October 2019
/
Revised: 30 November 2019
/
Accepted: 3 December 2019
/
Published: 4 December 2019
(This article belongs to the Special Issue Algorithms for Diagnostics and Nondestructive Testing)
Abstract
:Damage mechanisms of Reactive Powder Concrete (RPC) under fatigue loading are investigated using the 3D laser scanning technology. An independently configured 3D laser scanning system is used to monitor the damaging procedure. Texture analysis technique is also applied to enhance the understanding of the damage mechanisms of RPC under fatigue loading. In order to obtain the characteristic parameters of point cloud data, a point clouds projection algorithm is proposed. Damage evolution is described by the change of point cloud data of the damage in the 2D plane and 3D space during fatigue loading. The Gray Level Co-occurrence Matrix (GLCM) method is used to extract the characteristic parameters to evaluate the statue of the structural. Angular Second Moment and Cluster Shadow of typical sensitive characteristic indexes is screened by using the Digital Feature Screening. The reliability of the damage index was verified by image texture analysis and data expansion. Indexes extracted in this paper can be used as a new structural health monitoring indicator to assess health condition.
1. Introduction
In recent years, considerable attention has been paid to the health monitoring of advanced composite structures. Damage identification through various non-destructive testing techniques predict or diagnose the health of composite structures [1,2,3]. Reactive Powder Concrete (RPC), an emerging materials, are widely concerned in railway engineering, roads, buildings, airports and nuclear industrial facilities—ultra high strength, high toughness and high durability [4,5,6,7,8,9]. However, there are few researches on damage identification and detection of composite structures using RPC as raw materials. It is critical to popularize intelligent damage monitoring technology of RPC structure damage.
Certain damage, which have considerable impact on structure reliability and security, are inevitably retained because of the influence of fatigue load [10,11,12]. The process of causing damage caused by cyclic loading includes the combined results of the cumulative process of crack initiation, expansion and final fracture. When the RPC structure is subjected to a continuous fatigue load, initial microcracks appear on the surface of the structure. The stress generated by the matrix crack increases and continues to aggregate, expanding and eventually forming macroscopic cracks. Scholars evaluate the health status of the structure by monitoring the development of damage [13,14,15]. Finding damage in time and predicting injuries is the key to avoiding temporary accidents. Therefore, it is very necessary to fully grasp the development of crack damage as well as find an intelligent method to quickly and conveniently monitor the health of the structure.
At present, the research on RPC mainly focuses on the influence of material parameters on its performance and the establishment of constitutive models. However, there is a lack of investigations on the damage characterization of materials and damage evolution mechanism [5,16,17]. The stress-strain characteristics of RPC under fatigue loading are nonlinear. Therefore, it is important to use appropriate non-destructive testing methods to probe the quality of RPC structures. Accompanied by the destruction process, the structure is deformed and accompanied by local crack damage, which can be recorded by the 3D laser scanning technology (3D LST). Some scholars have found that 3D laser scanning can be used as an effective technique for fatigue damage accumulation research in RPC (see, for example, [18,19,20] as well as [21]). The 3D LST can be used to continuously monitor the development of damage or structure deformation and defects in RPC structure dynamically. In addition, we can use image processing methods to correlate the damage generation process with the feature parameters of the 3D image. The damage mode of RPC is extremely complicated, and the displacement and deformation characteristics exhibited during the fatigue loading process are obvious, which indicates that the 3D LST is an extremely effective technique for detecting the damage process. Moreover, many recent studies show that in the detection method of damage, the 3D LST, which can quickly and accurately implement structural modeling, non-destructive, non-contact, and does not require a light source and cost of wiring, has significant advantages [22,23]. At the same time, in the intelligent method of pattern recognition, artificial intelligence recognition technology, such as clustering technology and data mining, which can accurately and quickly identify the type of the damage, has received widespread attention. These results open the door to research the life prediction and mechanical behavior of RPC structure. More importantly, the 3D laser scanning technology affords unique advantages in the fatigue damage detection of RPC structure because it can evaluate the information contained in the damage to assess damage on-line.
However, the study of bending fatigue damage performance is extremely complicated. At present, the research object is limited to small-scale specimen experiments, the experimental data obtained is relatively simple and the versatility is insufficient. Especially for building structures, as a new type of material, RPC has just been invested in by engineering construction. Compared with regular specimen structures, extracting the characteristics of point cloud data acquired by 3D laser scanning technology is more complex and more cost. There are few reports on the damage characteristics of such complex structures under fatigue loads until now.
The purpose of this study was to investigate the evolution and development of RPC rupture process under 3D laser scanning technology under fatigue loading. The main part of damage extraction are performed by the Gray Level Co-occurrence Matrix (GLCM) method. In addition, the paper also discusses the variation of fatigue damage characteristics at different stages. The different techniques implemented in this work, that is, the extraction of 3D laser scanning events at various stages of the test, can classify and analyze crack development. It also provides an effective way to monitor damage.
2. Materials and Methods
2.1. Design Principle of 3D Laser Scanning System
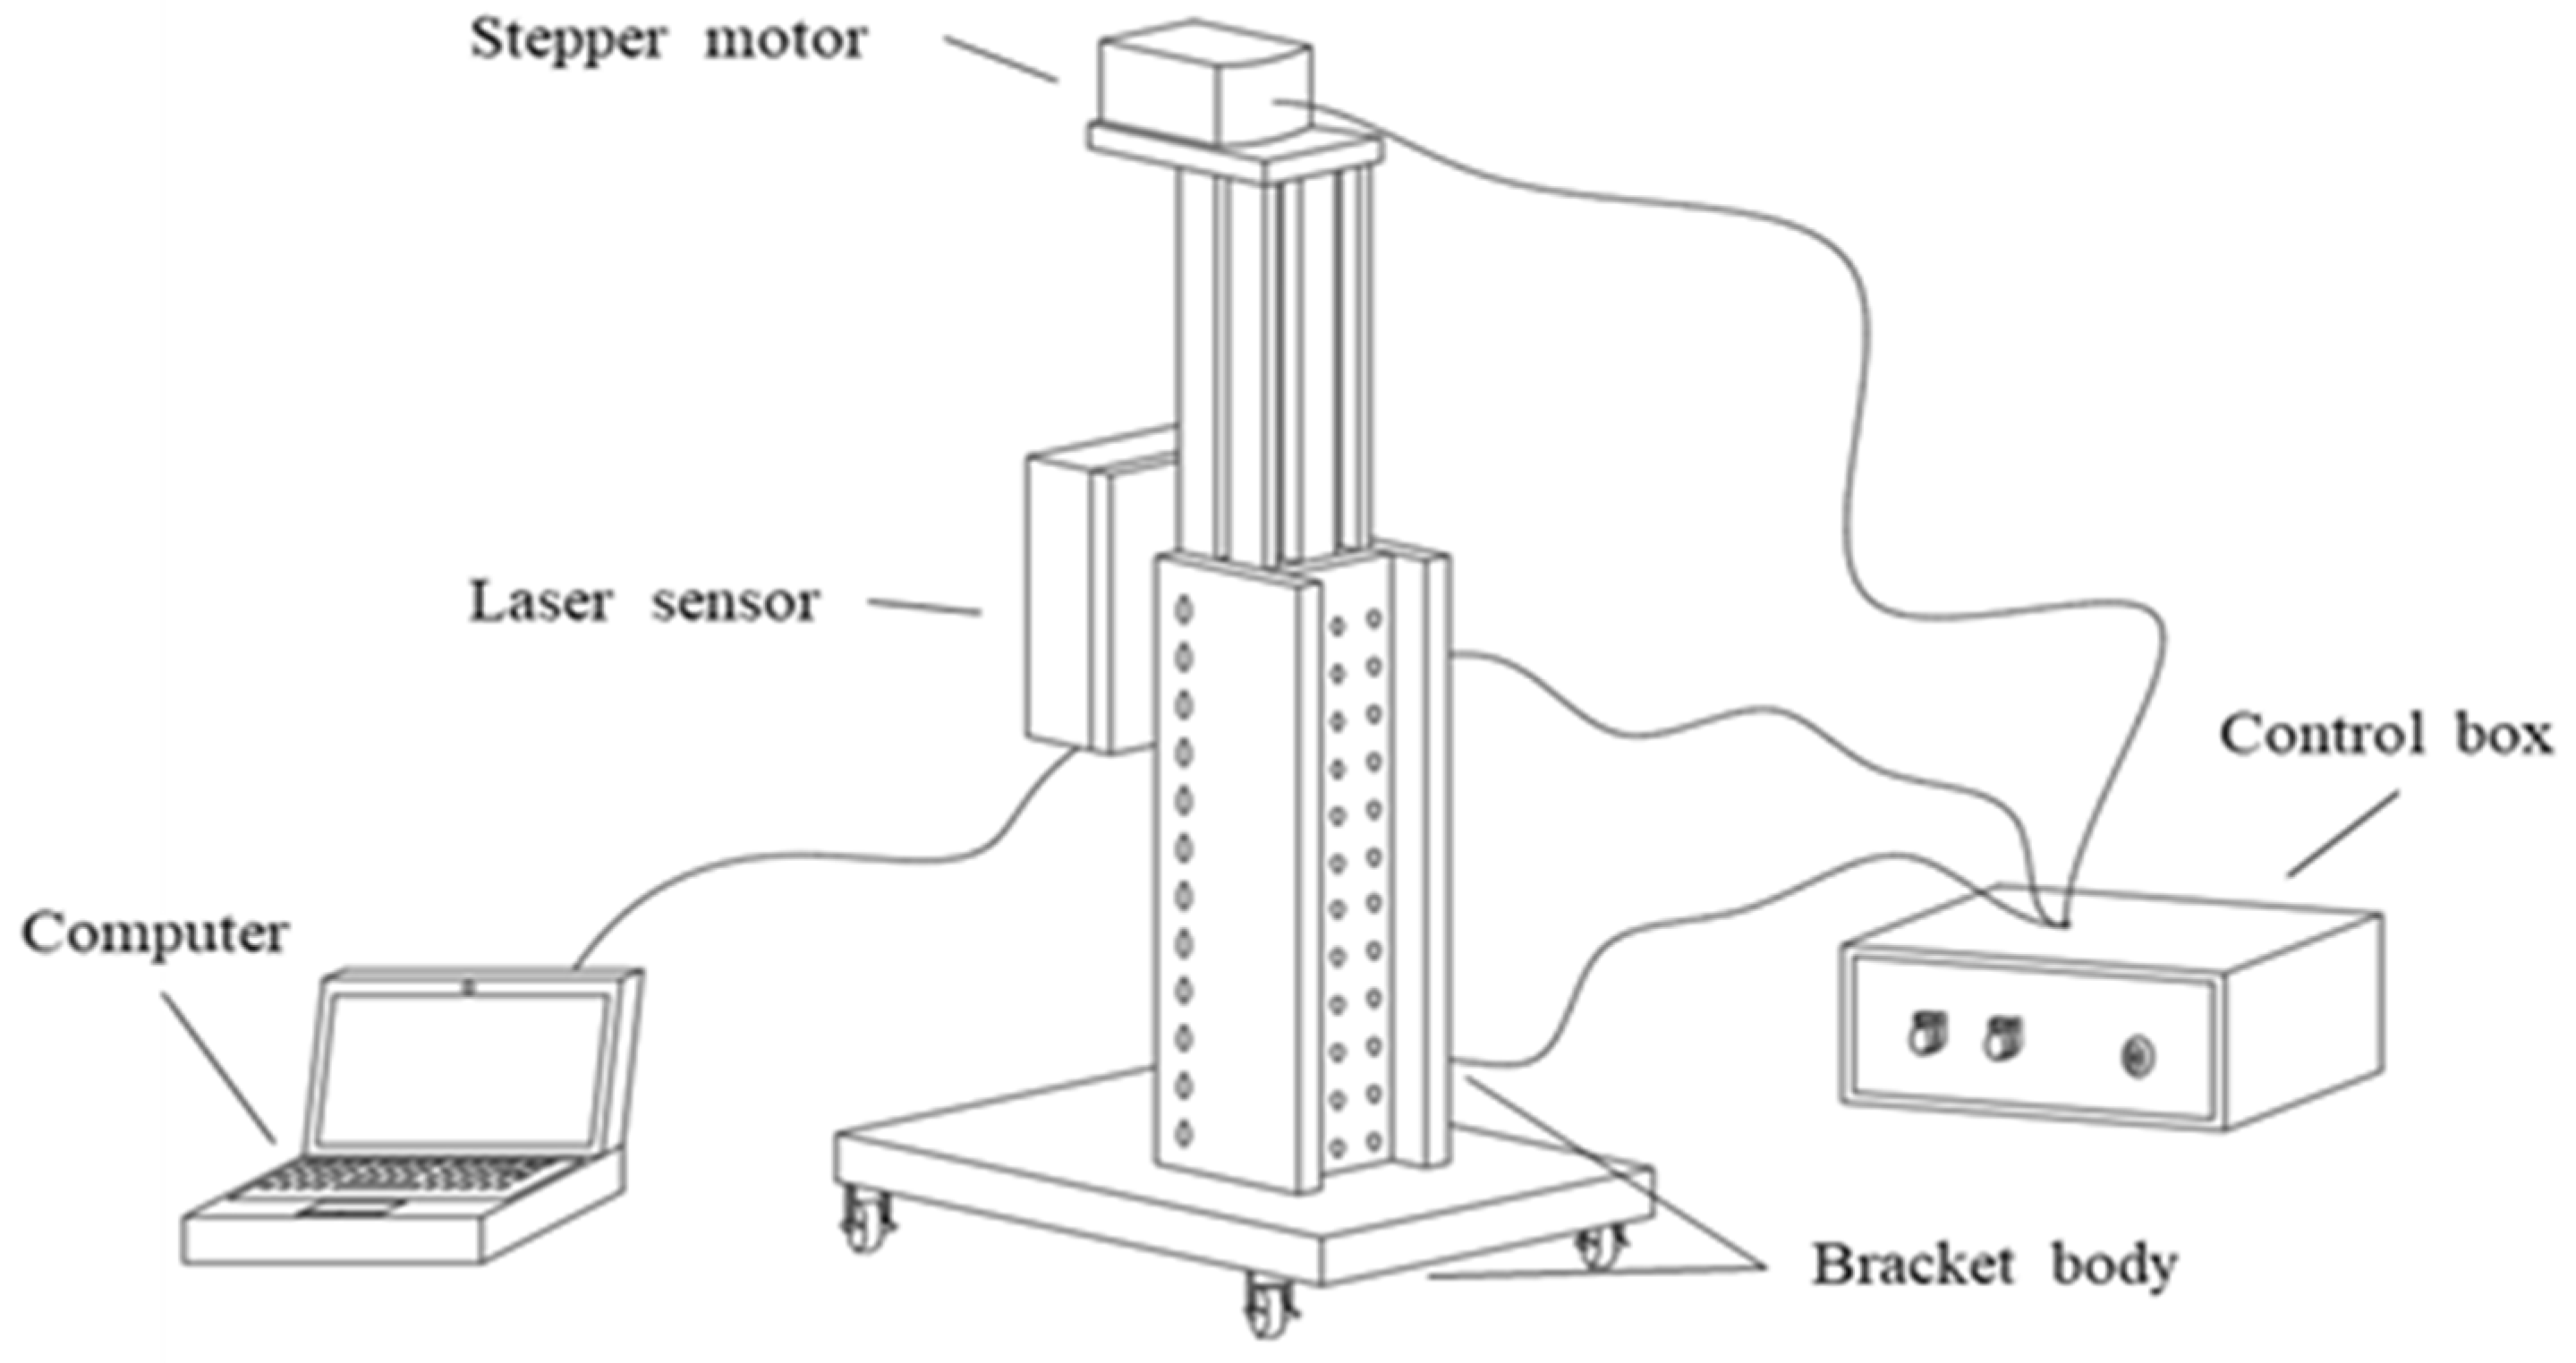
The 3D laser scanning system is mainly composed of a 2D laser ranging sensor, sliding mold combination, bracket, control box and computer, as shown in Figure 1. The scanning system is divided into four parts: a transmission actuator, a transmission control device, a laser ranging sensor and a sensor control interface. The transmission actuator is driven by a stepping motor to output a high-precision, controllable lifting movement. The sensor scan plane is parallel to the ground and perpendicular to the drive direction. The parameters of the laser sensor are set on the surface of the sensor control interface, so that the scanning optical center lifting speed is consistent with the linear sliding group motion output. The unit consists of a stepper motor driver, PLC and related components. The control slider performs a uniform linear ascending and descending motion on the slide rail through the M programming language. For the purpose control the uniform linear lifting scanning action of the laser ranging sensor, it is fixed mounted on the slider through the connecting plate. The sensor scan plane is parallel to the ground and perpendicular to the drive direction. The parameters of the laser sensor are set on the surface of the sensor control interface. The lifting speed of the scanning optical center is consistent with the motion output of the linear sliding group.
2.2. Principle of GLCM
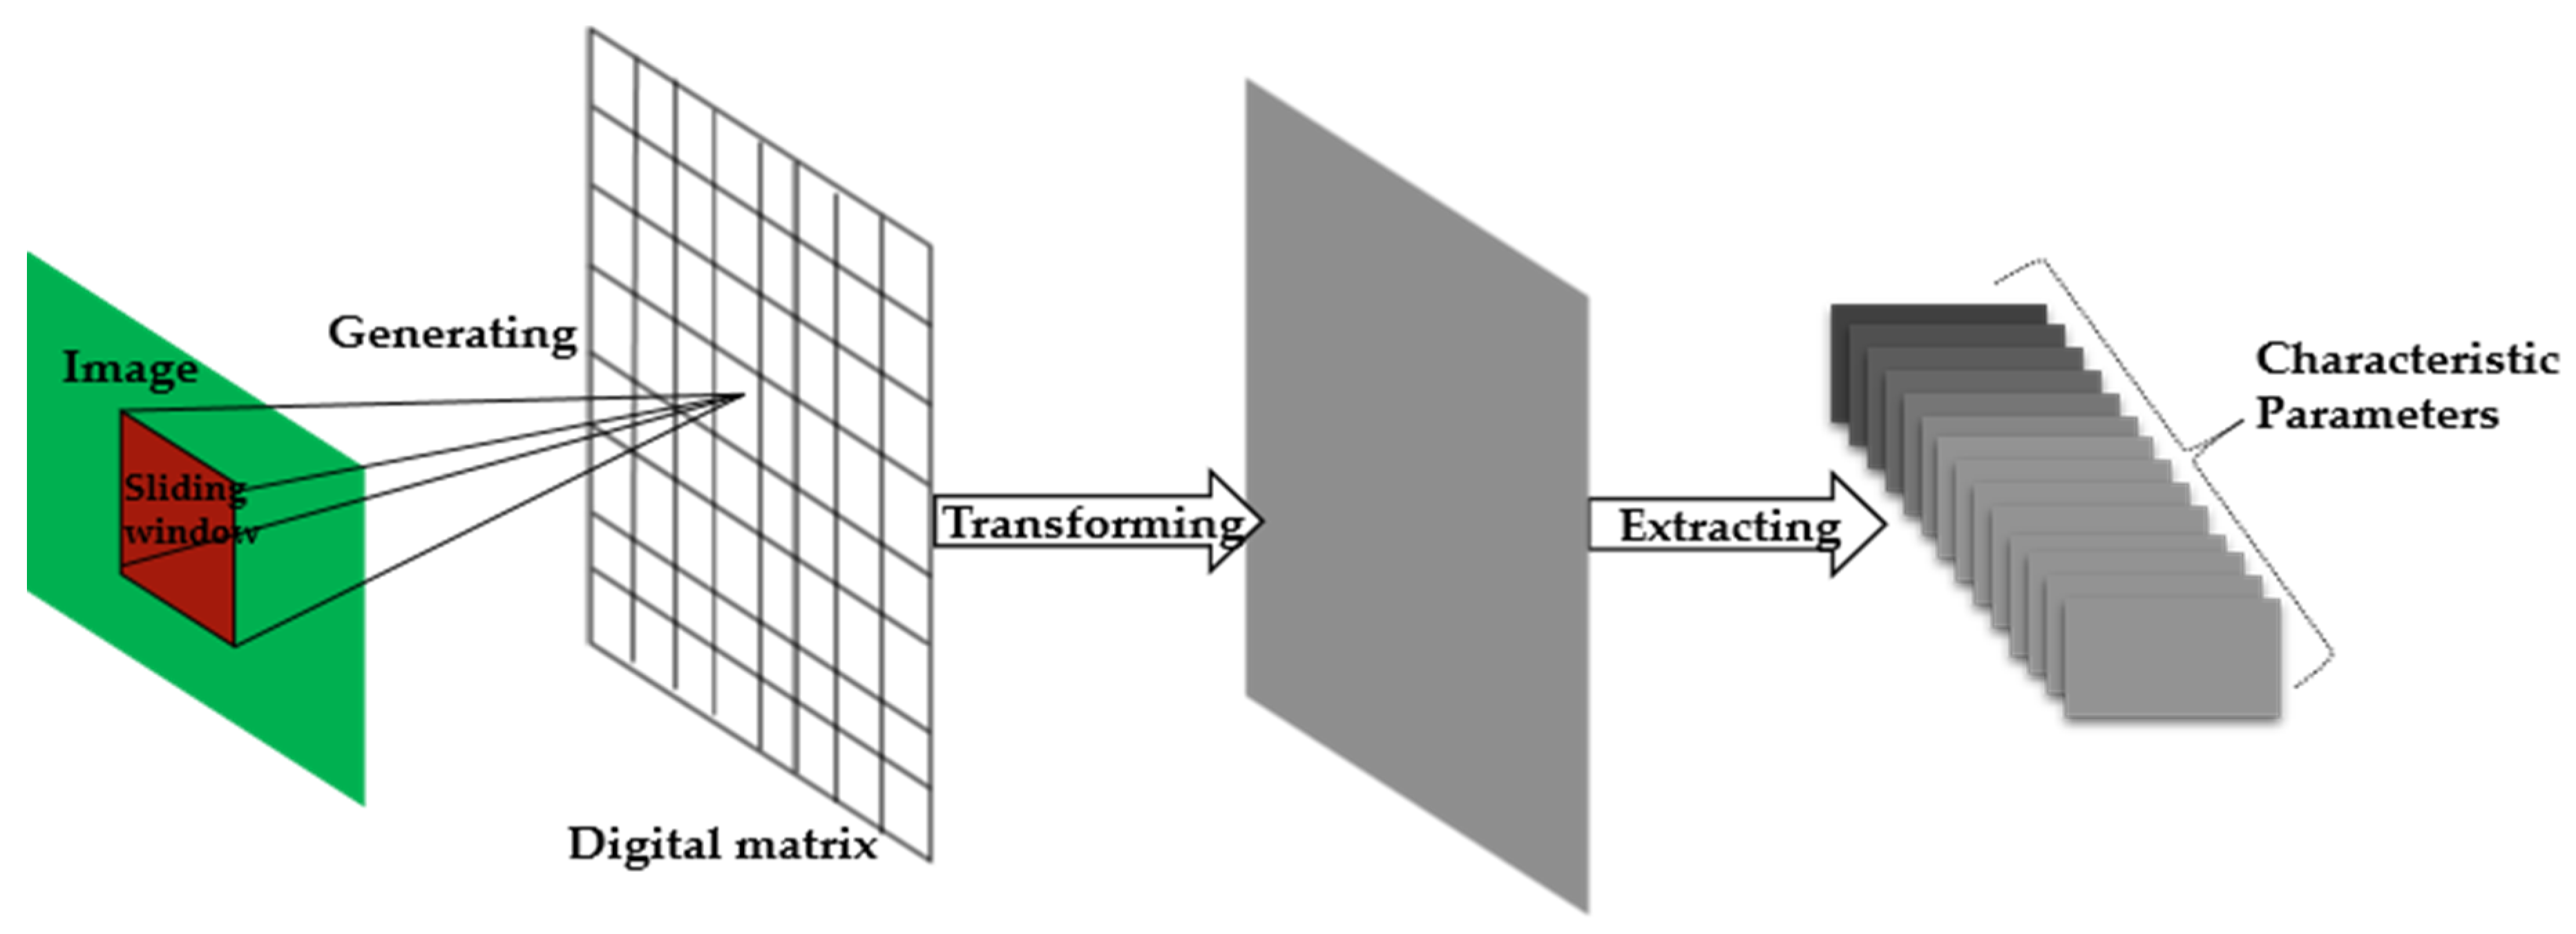
Texture is an important image function, and because of its powerful discrimination ability, it can be used as certainly effective tool for pattern recognition technology. The most widely applied texture analysis technology is the Gray Level Co-occurrence Matrix (GLCM), in which texture features are extracted from the co-occurrence matrices Pd, θ of gray values f(i) and gray values f(j) based on statistical methods (Haralick, Shanmugam, & Dinstein 1973). The principle diagram of gray symbiosis matrix, as shows in Figure 2.
The following explains the GLCM schematic in Figure 2. First, input an image. Then a standard window is specified, and the probability of pixel pairs appearing under the same specified conditions is calculated. The probability distribution values are counted to generate a number matrix. Finally, the matrix is converted to a grayscale image. Additionally, the feature parameters characterizing the image properties are extracted. The characteristic parameters extracted in this study include: Angular Second Moment (ASM); Entropy (ENT); Variance (VAR); Correlation (COR); inverse difference moment (IDM); Cluster shadow (CLS), as shown in Table 1.
Table 1 introduces formulas and damage characteristics of the parameters. The direction, trend and complexity of fracture damage in gray space were quantitatively described by feature parameters
2.3. Bending Fatigue Test
Under the repeated load during the actual engineering, the initial microscopic pores and cracks in the structure generate new micro-cracks. At the same time, the continuous development of the original pores and micro-cracks reduces the durability of the structure and causes fatigue damage. Under cyclic loading, the bending fatigue failure mode of reactive powder concrete is manifested as the failure mode of single critical fatigue main crack. The laser scanning system captures the failure process of the fatigue main crack, monitors the damage, and predicts the structural damage pattern. Therefore, a three-point bending fatigue loading test was carried out to verify the reliability of the 3D laser scanning system.
2.3.1. Material
PO42.5 ordinary Portland cement is used for cement, and its performance index is shown in Table 2. The steel fibers used had a diameter of 0.22 mm, a fiber length of 13 mm, and a tensile strength of more than 2850 MPa. A KY-1 type polycarboxylic acid high performance water reducing agent with a water reduction rate of 35% is selected. The admixture is made of grade I fly ash and micro silica.
2.3.2. Production of Test Pieces
According to the “Standards for Active Powder Concrete” GB/T 31387-2015, the mix ratio is shown in Table 3. The specifications and quantities of the test pieces are shown in Table 4.
Under the standard curing conditions, the specimens of the specimens were removed after 24 h of curing. Then, after curing at 90 °C for 72 h, it was allowed to stand under standard curing conditions for 28 days.
2.4. Experiment
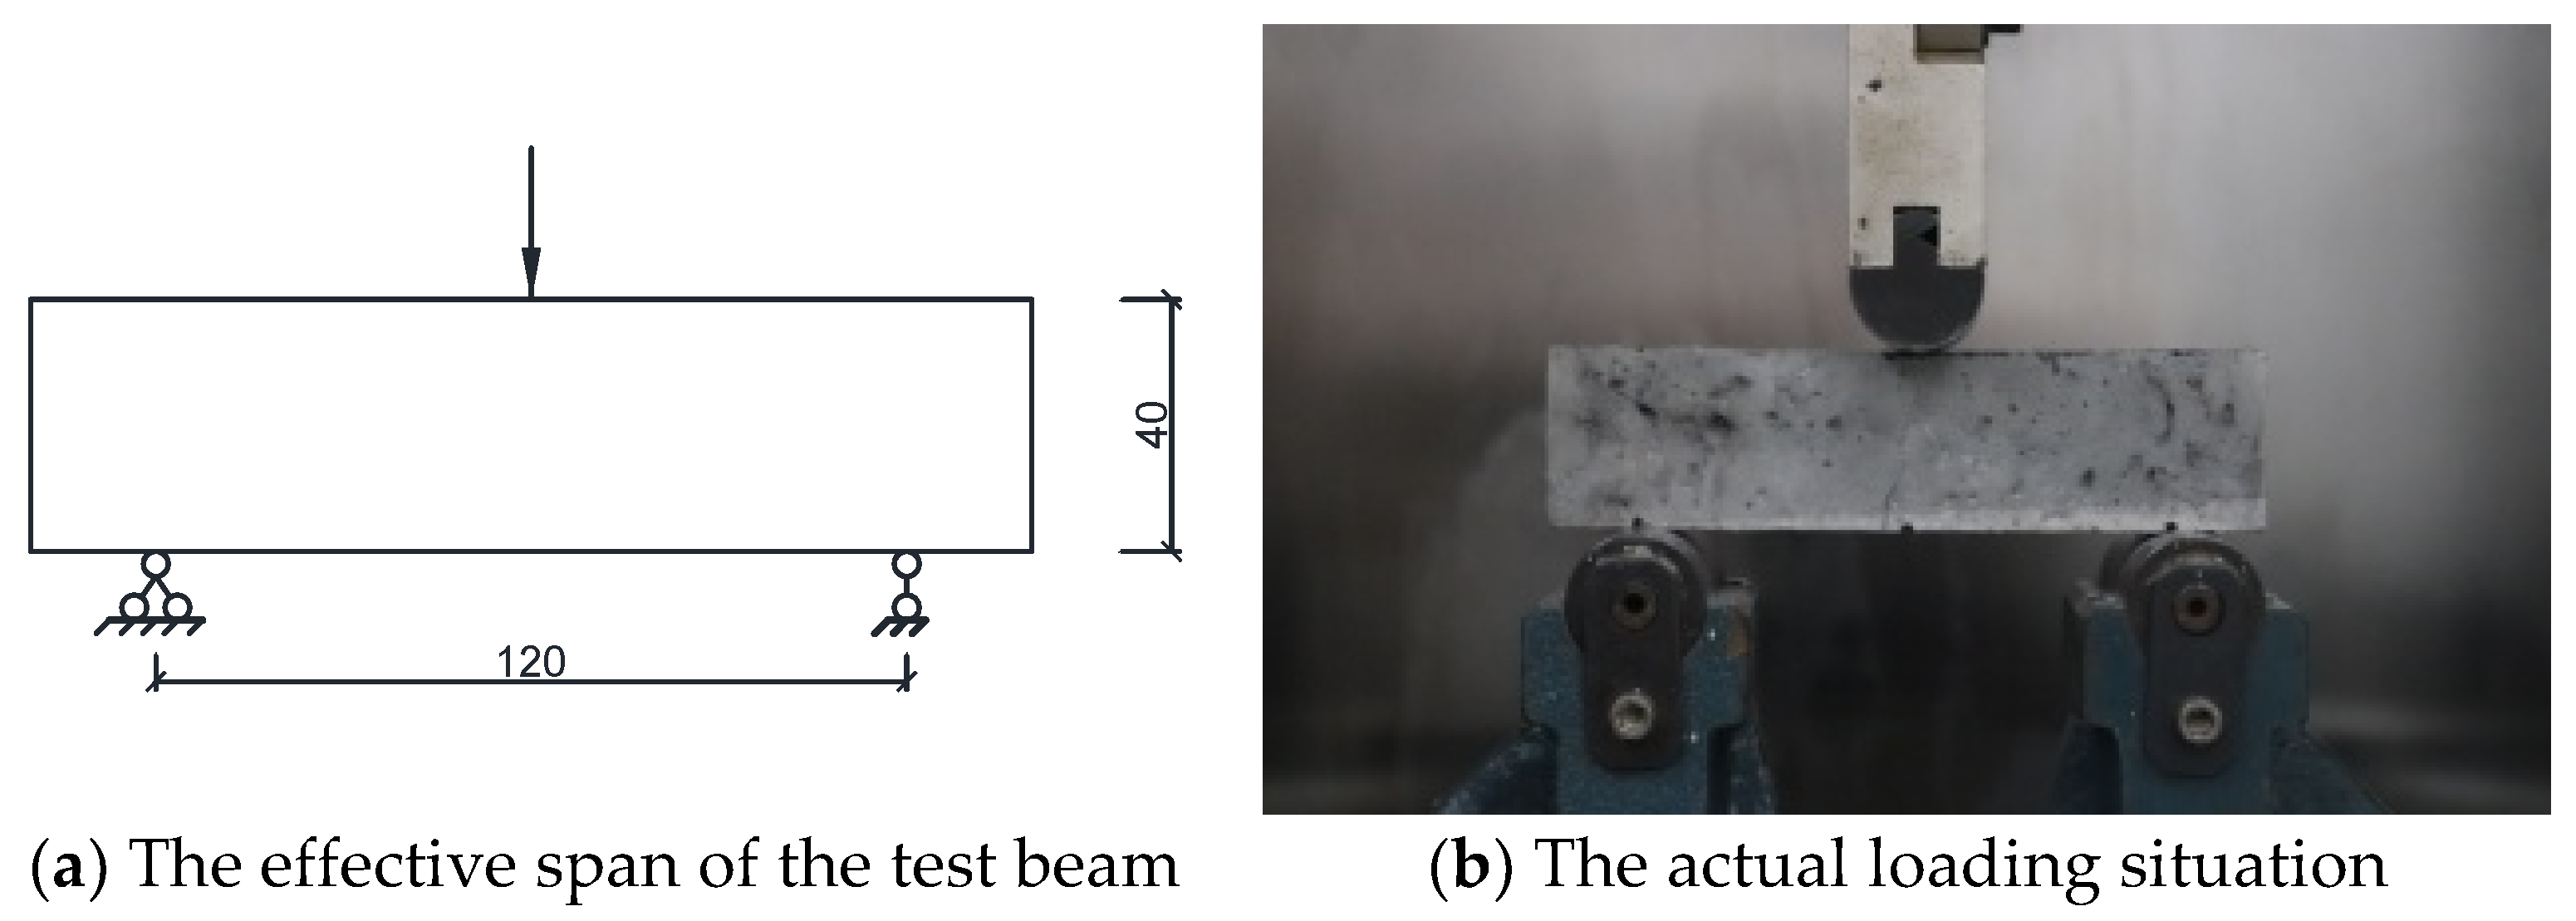
The RPC bending fatigue specimens are three-point bending loads. The fatigue testing machine uses IPC Global UTM-30 dynamic hydraulic servo multi-function material testing machine. The effective span of the test beam is 120 mm, as shown in Figure 3a. The actual loading situation is shown in Figure 3b. The equal-amplitude sine wave load is selected, the load frequency is 15 Hz, and the fatigue load is performed in a stress control manner.
3. Result and Analysis
The whole process of damage mechanism of RPC under fatigue loading are investigated using the 3D laser scanning technology as show in Figure 4.
The overall process consists of six parts in Figure 4. The establishment of a 3D laser scanning system. The execution of RPC fatigue loading test. Further, the GLCM is generated. Including extracted feature parameters, parameter screening and verification processes. Stack each part as the main line of research. And mark the core content of each part.
3.1. Bending Strength
Four sets of test pieces were selected for the static load bending test, and the average value of the 28-day bending strength was measured, as shown in Table 5.
There was no significant change in the surface of the test piece before the test loading. The initial crack occurs in the test piece when the loading force reaches 70% to 80% of the ultimate bending strength. The flexural strength value did not decrease as the specimen appeared across the crack. It was not until the steel fiber in the cracked cross-section was pulled out that the test specimen was completely damaged.
3.2. Data Collection
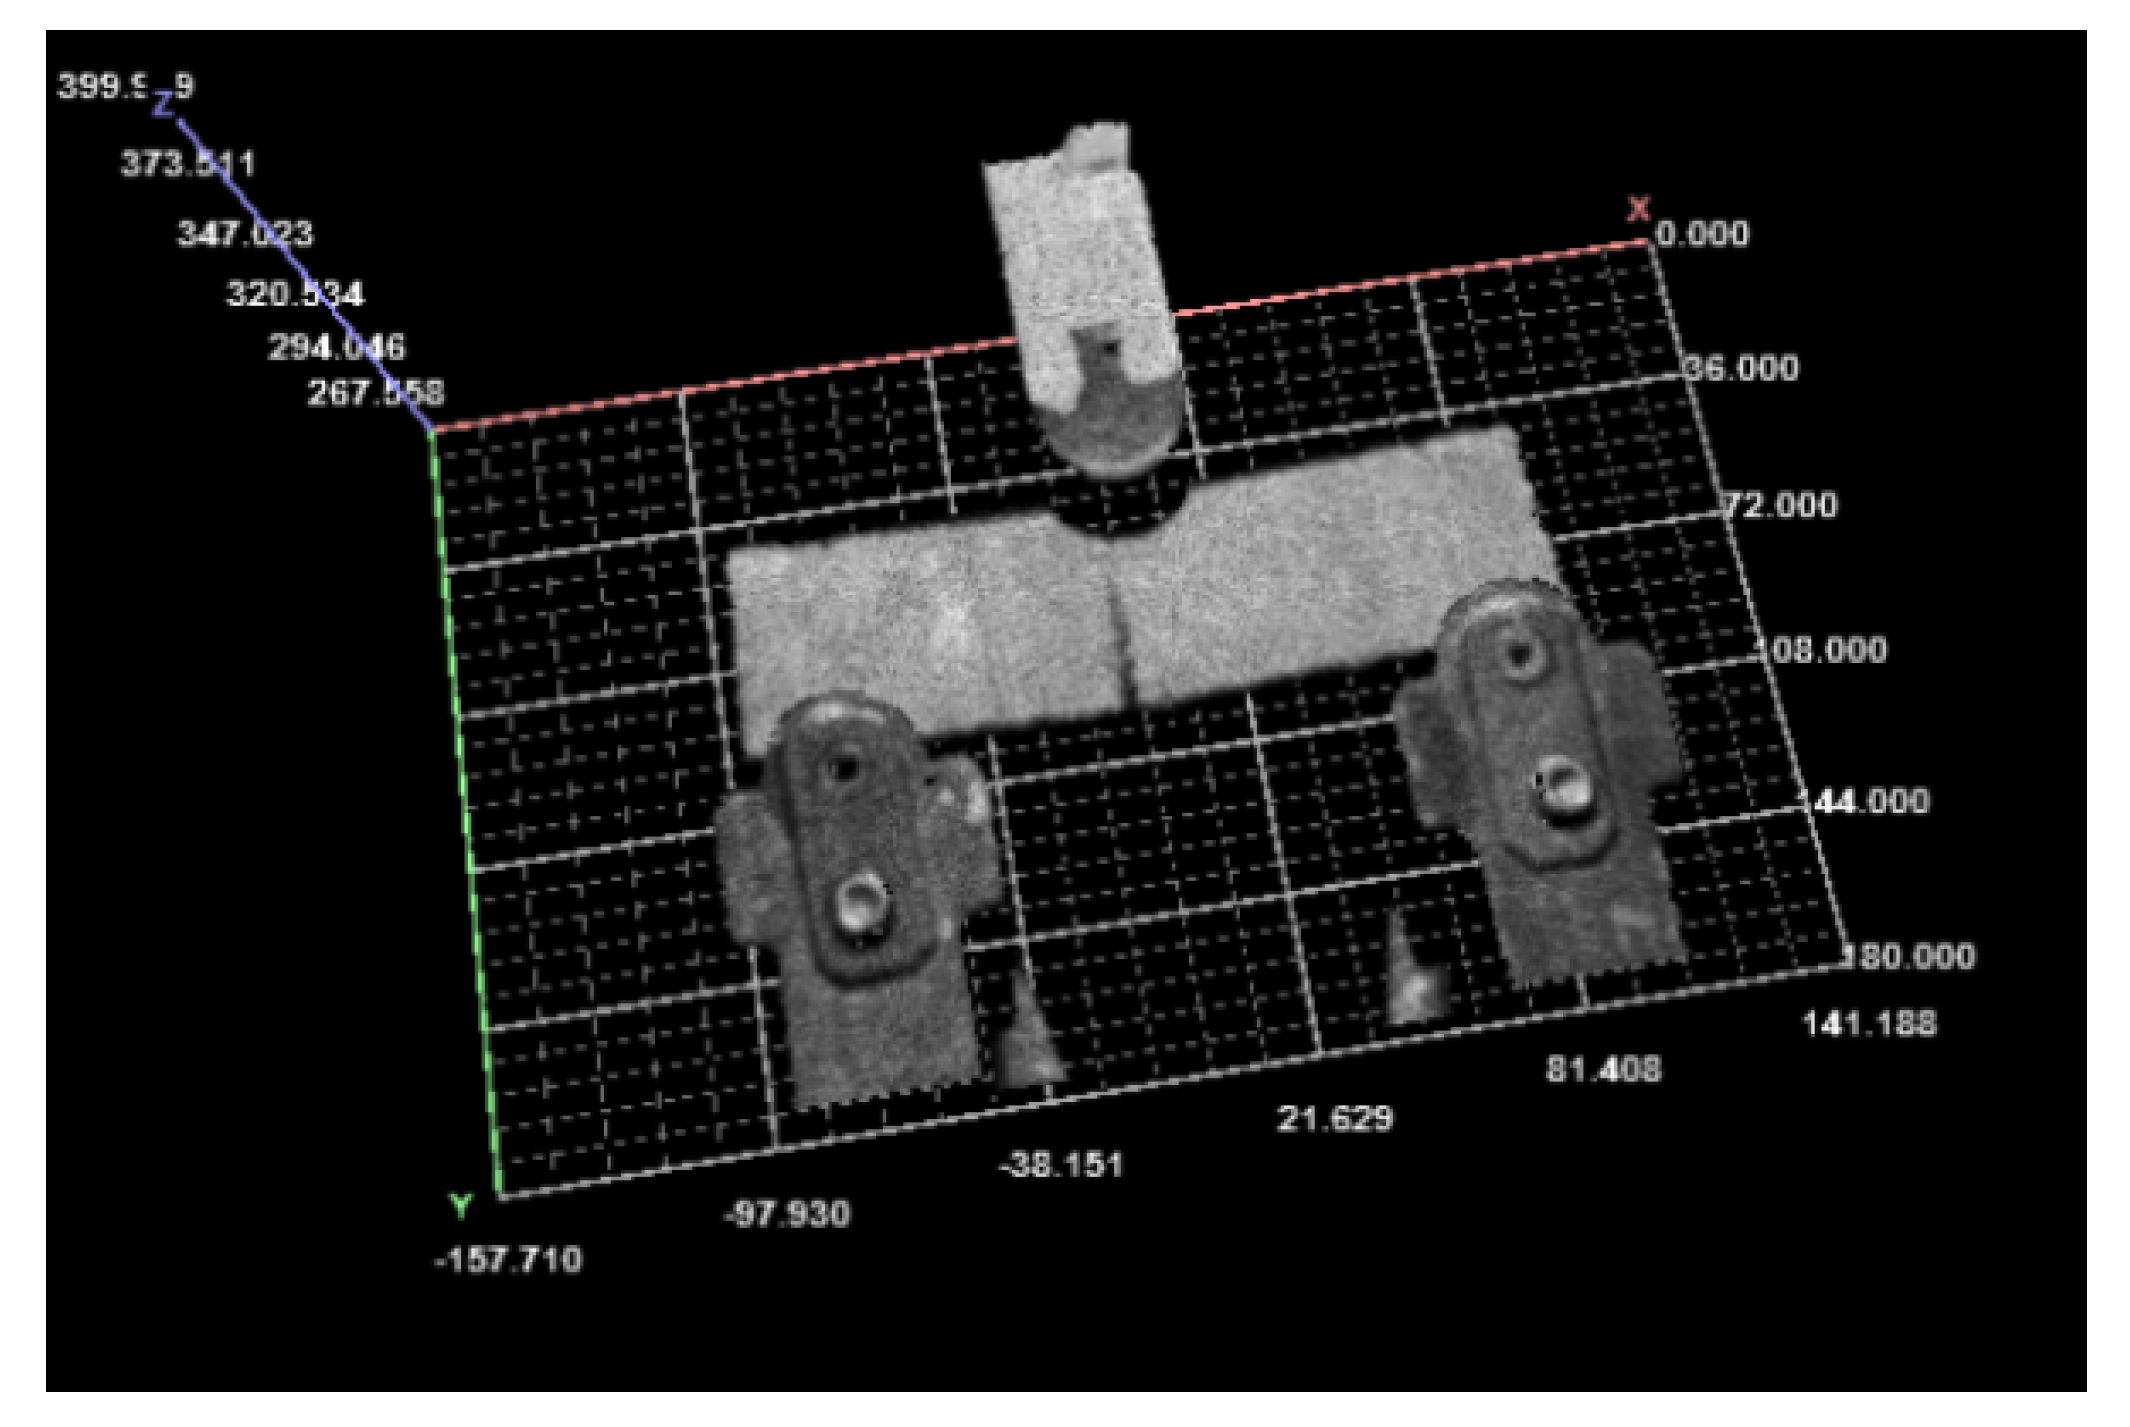
The structure is located in the scanning sector detection area by adjusting the horizontal position of the holder body. In order to ensure complete structural modeling information, the effective detection range in the vertical direction is greater than the height of the detected object. The data acquisition process as shown in Figure 8.
3.3. Damage Parameter Acquisition
When the damage degree of the RPC structure is slight, the displacement and deflection of the damage source area are small. However, the location and elevation information of the damaged area is constantly changing as the degree of damage continues to develop. This change can be obtained in two ways. On the one hand, the continuous development of cracks in 2D plane can be achieved. On the other hand, the displacement of the crack and the change in height information in the 3D space.
The 2D image can be captured by the CCD camera built in the 2D laser ranging sensor. According to the principle of the independently developed 3D laser scanning system, the point cloud data for obtaining the scanned test piece is a digital matrix composed of data points having position information. This value can be calculated by the Formula (2). Therefore, the damage region of the digital matrix composed of the 2D image and the point cloud elevation information is selected as the Region of Interest (ROI), respectively. The GLCM of the ROI is constructed separately, the feature parameters are extracted, and the texture features are calculated therefrom. The angles are determined as 0°, 45°, 90°, and 135°, the image grayscale is selected as 265, and the distance between the pixel pairs is 2 pixels. Therefore, when the construction factor is d = 2, g = 28 and θ selects 0°, 45°, 90° and 135°, and six characteristic parameters of the damaged area of the test piece are extracted. In order to satisfy the image rotation invariance, the average of the 4 angles is taken as the final value function parameter.
3.4. Parameter Extraction in 2D Plane
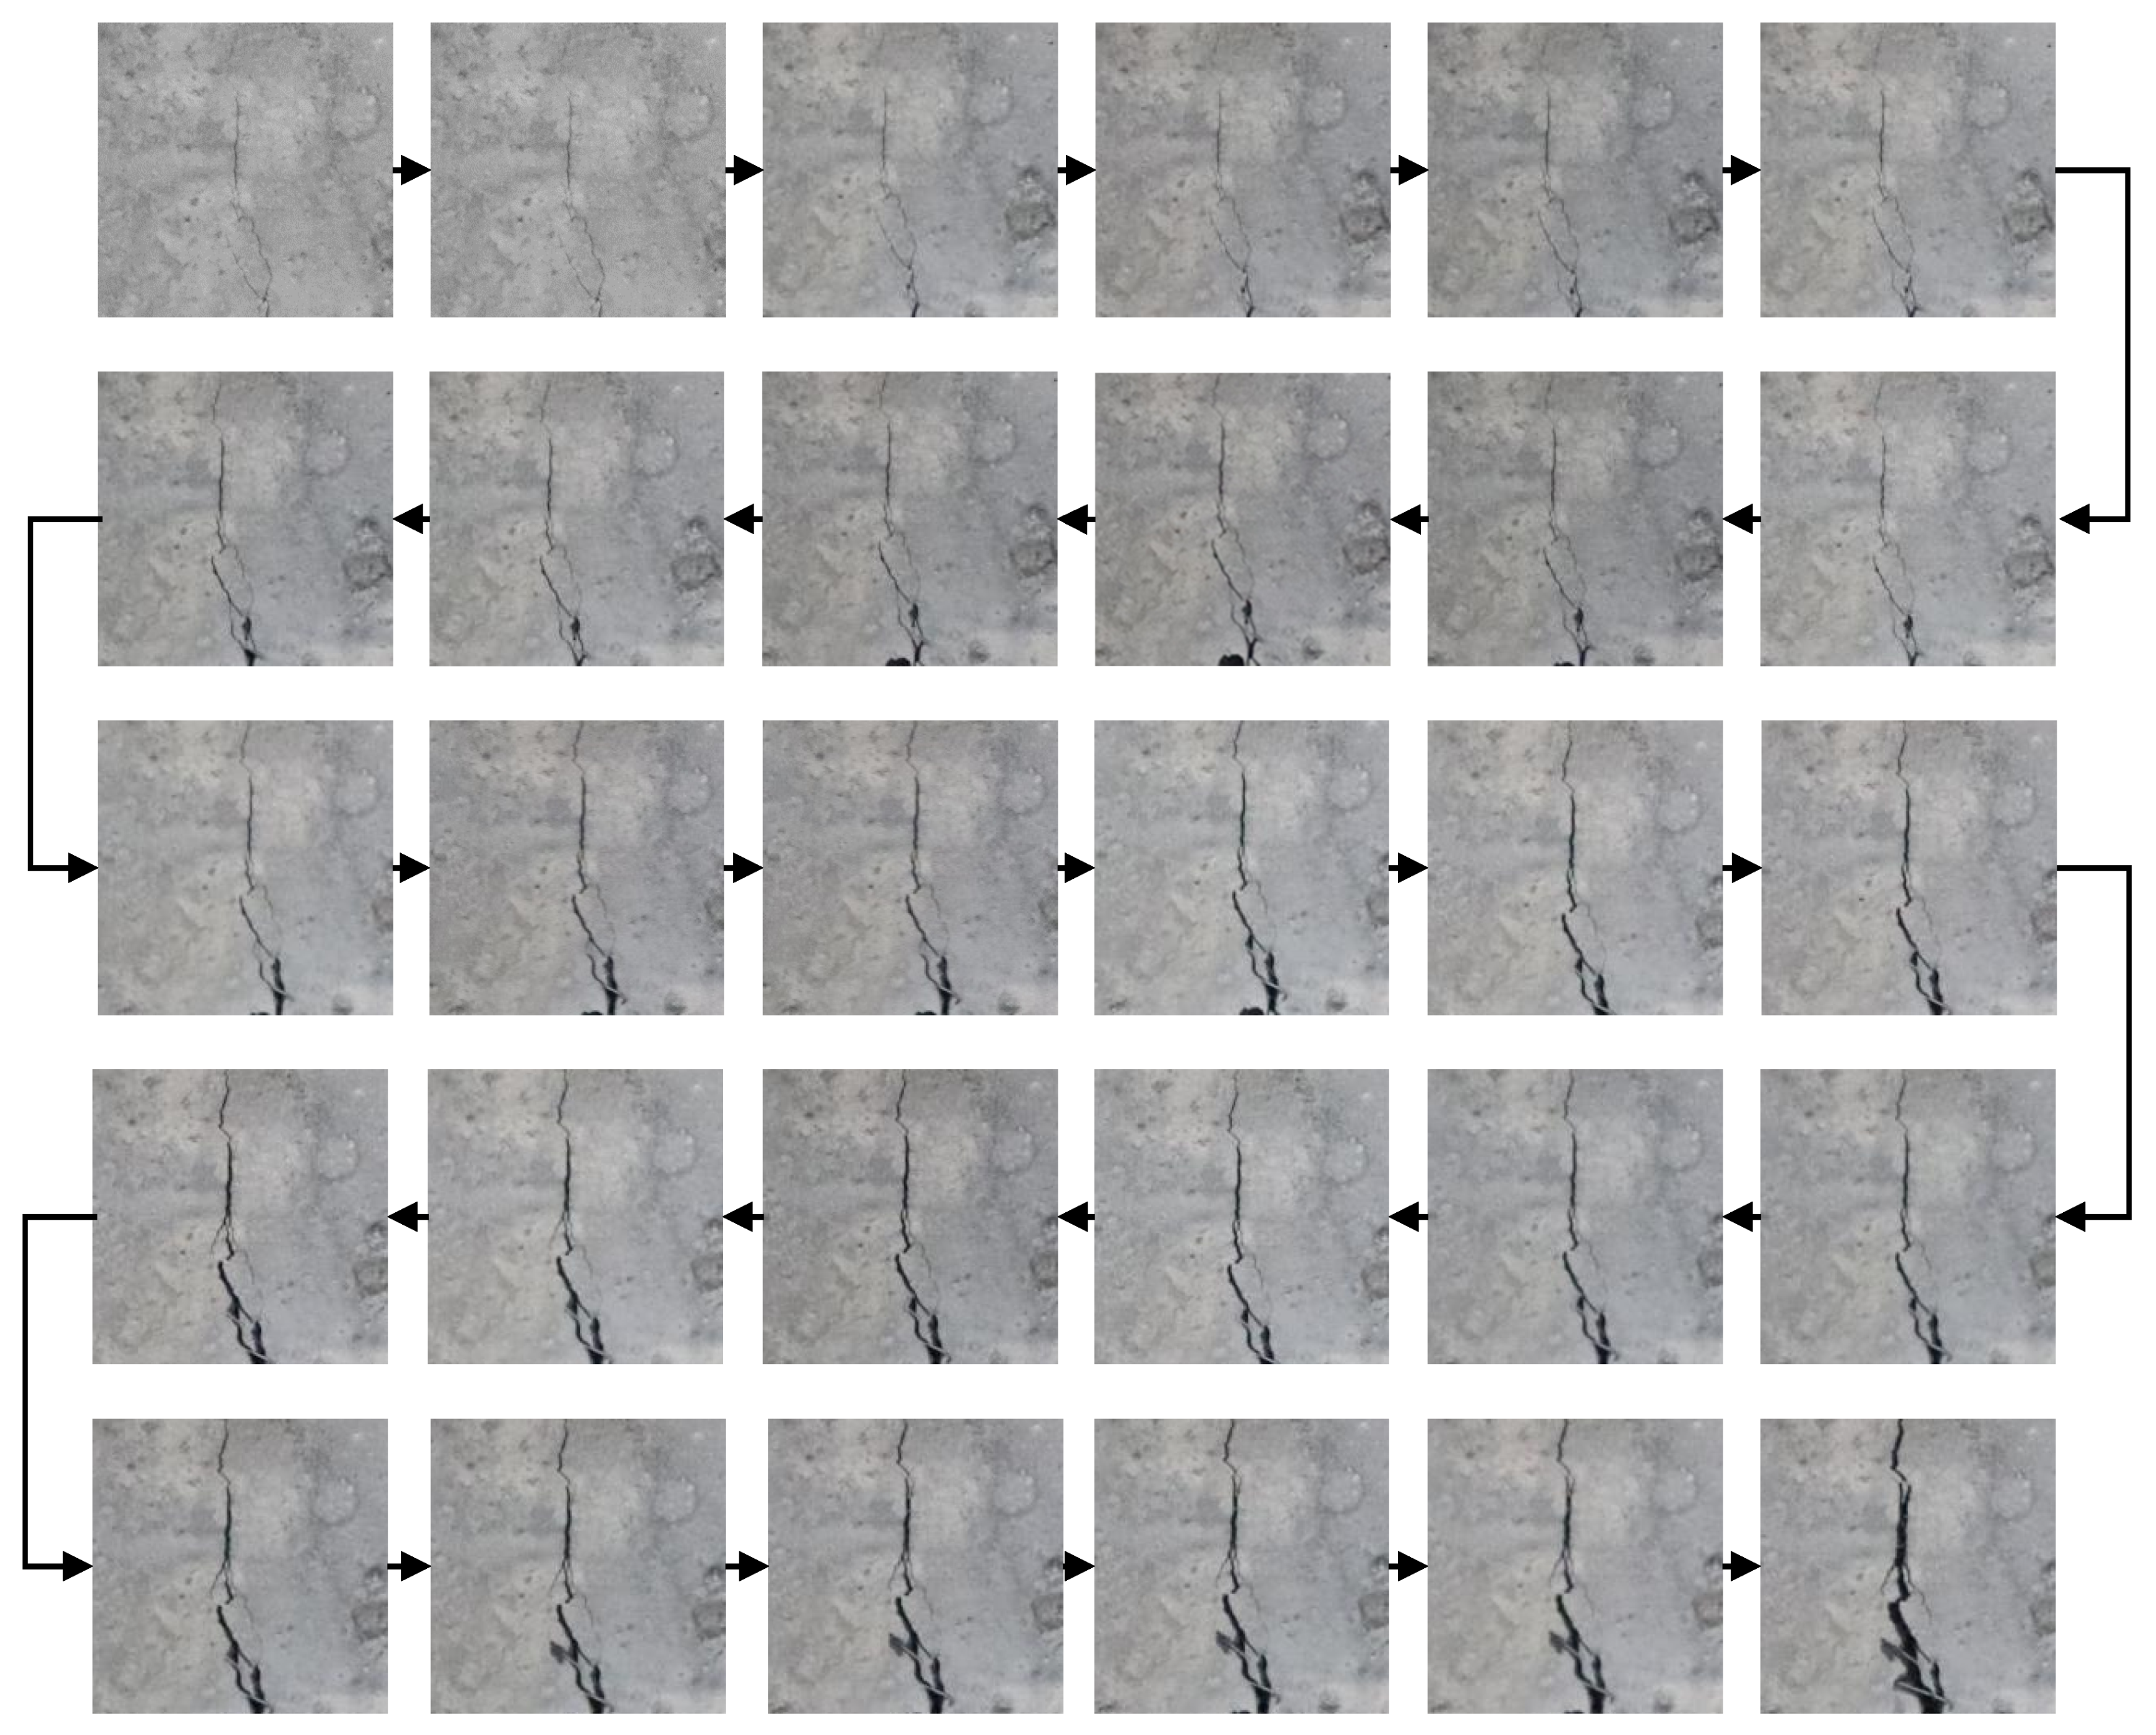
The images of the fixed damage area are acquired with the same number of frames, as shown in Figure 7.
The ROI of damage images were captured in Figure 7. The number of image acquisition interval frames is 10 images. The direction of the arrow indicates the direction of damage development. As fatigue loads continue to accumulate, damage continues to expand and develop. A nonlinear texture change is formed on a 2D plane. The characteristic parameters of each image were acquired and data recorded.
3.5. Parameter Extraction in 3D Space
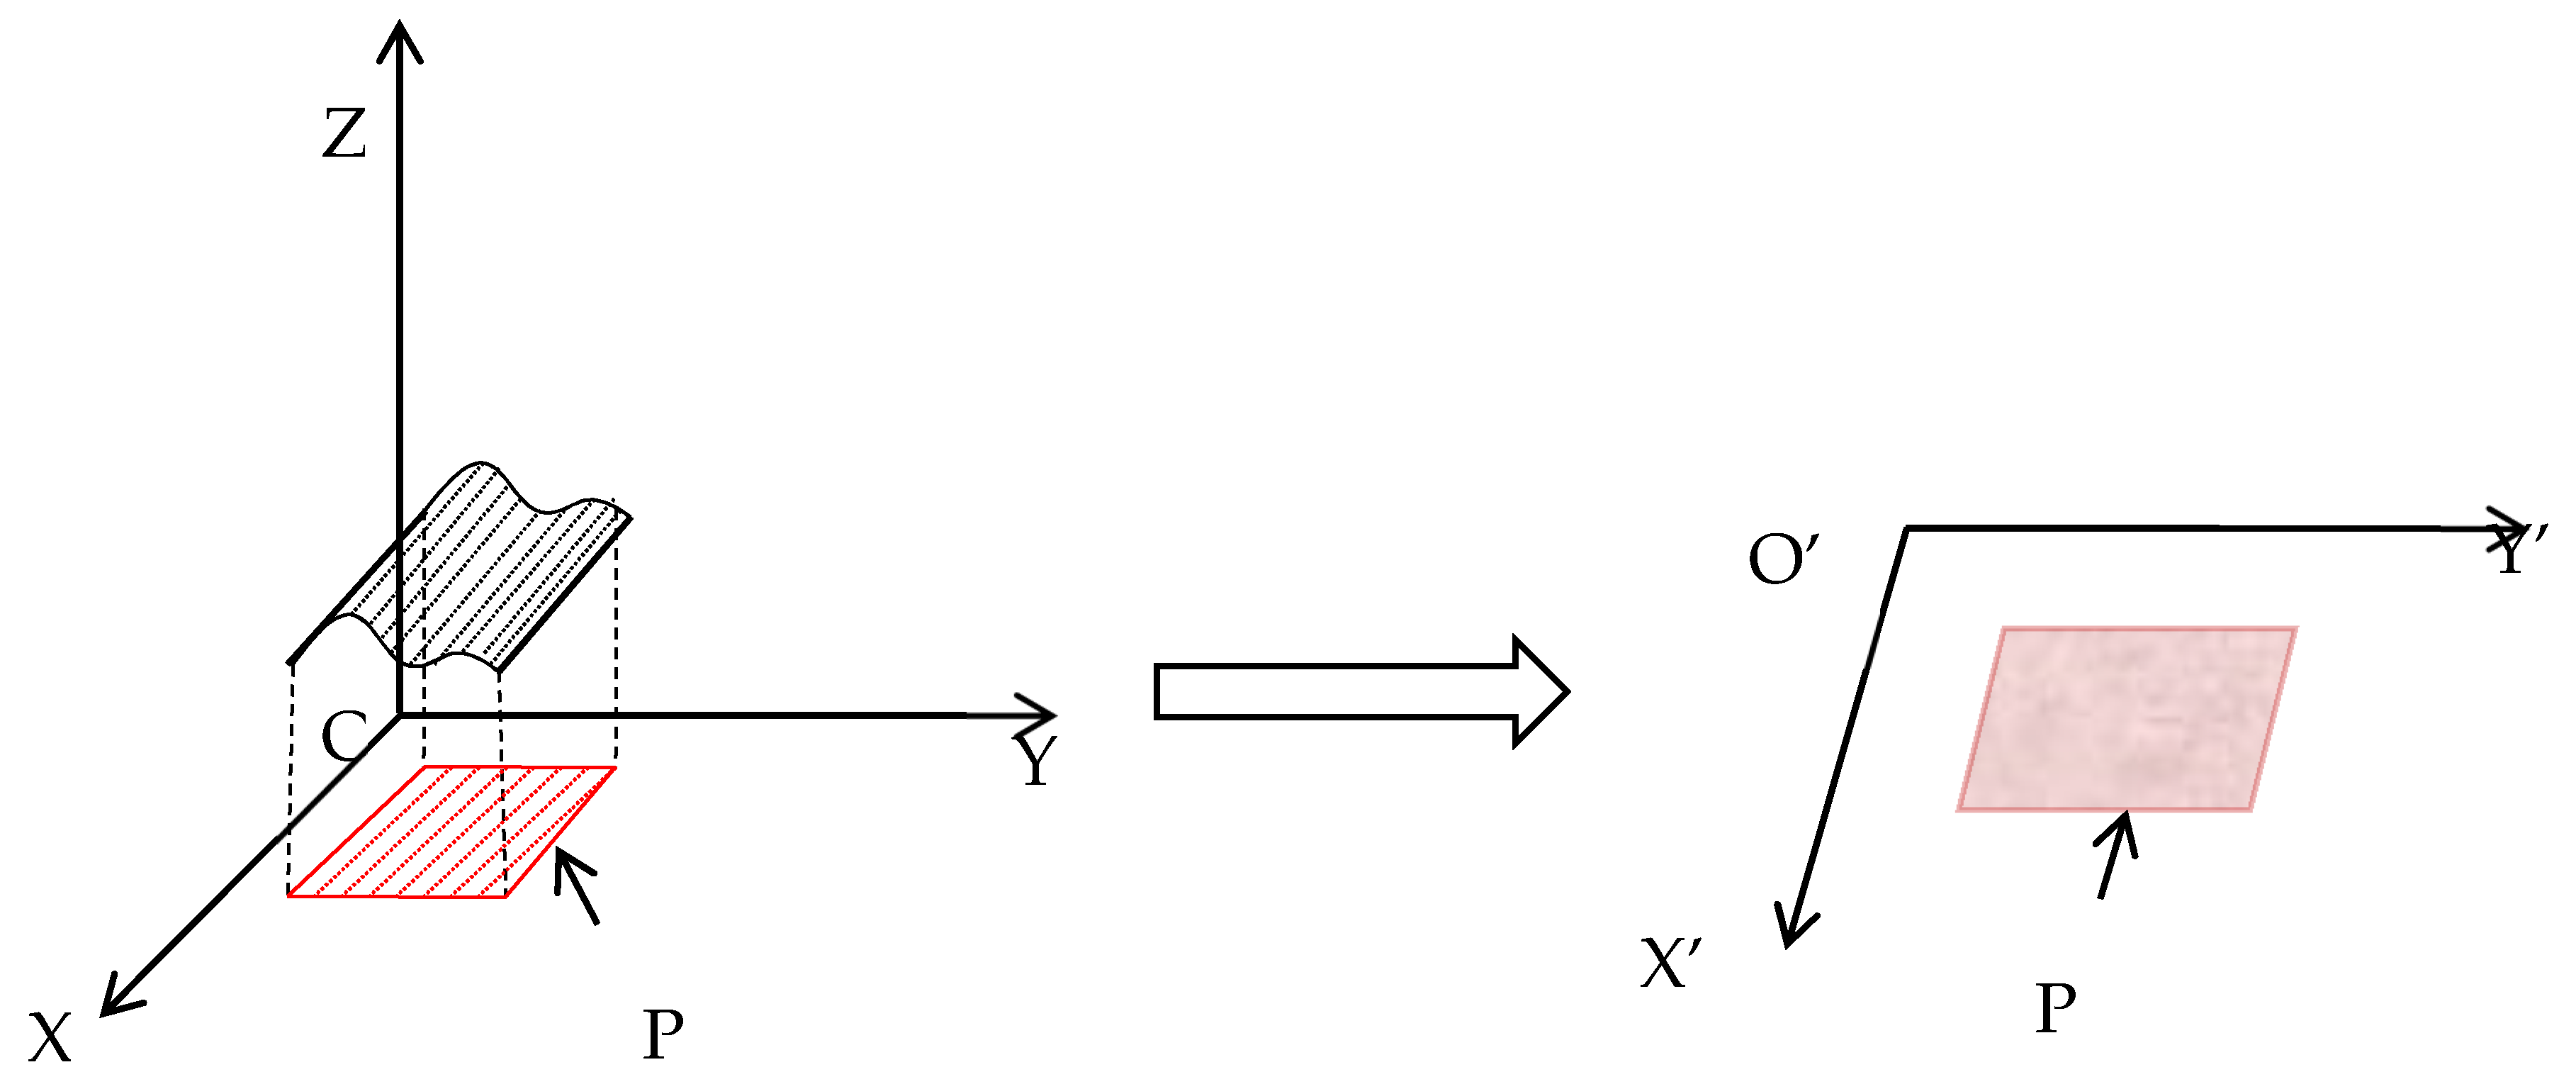
A transformation algorithm for transforming 3D scene data into 2D elevation image is proposed based on the principle of orthogonal projection. Figure 8 is a schematic diagram of a conversion algorithm for 3D point cloud data projection elevation data information.
In Figure 8, the elevation information of the3D image is represented by the Z-axis in the coordinate system. Therefore, the projection point on the projection plane is the elevation data of the image, which can be represented by a matrix Z(x, y) consisting of discrete quantities:
where x is the range of values (0, m) and the range of y is (0, n).
All points in the Z(x, y) matrix are represented by one byte of 8 bits, converted to any value in the 0–255 interval, based on the one-dimensional sampling theorem and the principle of linear quantization. Therefore, the matrix Z(x, y) is a grayscale image of 256 gradation values. The converted image is named an elevation projection. An elevation digital matrix corresponding to images of a 2D plane is obtained. Then, convert them into projected images in sequentially. Feature parameters of the projected image are extracted separately. Finally, data statistics are performed.
3.6. Damage Diagnosis
For the purpose of obtaining the damage indicators of fatigue damage model, the parameters is screening use the DFS (Digital Feature Screening) method. The DFS method establishes the selection criteria of the damage characteristic index: obtaining the crack image in a fixed area under the step of increasing the loading level, and sequentially performing image numbering. Finally, damage characteristic index of the crack image is obtained. Further, a digital feature screening analysis chart is established, as shown in Figure 9.
Figure 9a shows the variation of the characteristic parameters as the damage grows in 3D space. After analysis, it is known that as the fatigue damage increases, the ASM characteristic parameters will continue to increase according to certain rules. The remaining characteristic parameters change irregularly with the development of the fracture, so the remaining characteristic parameters are excluded. In order to monitor the development of fractures in 3D space, ASM characteristic parameters with good positive correlation with fracture development trends were selected.
Figure 9b shows a tendency of characteristic parameters to change as the damage advances in the 2D plane. Analysis of the data changes in the graph shows that as the fatigue damage increases, the CLS characteristic parameters continue to decrease. As the crack develops, the other characteristic parameters show different trends. Therefore, it is excluded. In order to monitor the development of two-dimensional spatial crack damage, the CLS characteristic parameters which are negatively correlated with the crack development trend are selected.
Figure 9a,b respectively count the changes of the crack development of the six characteristic parameters, and obtain the monitoring basis of the 2D plane and 3D space cracks. The characteristic parameters ASM and CLS can quantify the development of cracks in different spaces and fully describe the development of cracks. Therefore, CLS and ASM characteristic parameters can be used as damage indicators for fatigue damage in RPC bending loading test to detect the development of damage.
4. Experimental Validation
The reliability of the damage indicator can be verified in two ways. Firstly, it is analyzed whether the texture characteristics characterized by the feature parameters are consistent with the development of the damage. Secondly, multiple sets of experiments were performed, and 30 images of continuous lesion areas were randomly acquired for data verification.
4.1. Texture Feature Verification
In order to verify the reliability of the damage index, it is analyzed whether the texture characteristics of the texture are consistent with the development trend of the damage. Table 6 shows texture characteristics of damage indicators.
Analysis of the texture characteristics of the damage indicators in Table 5 results in the following conclusions. It shows that in the 2D plane, with the continuous development of fatigue damage, the damage image width with damage as the texture element is increasing. In 3D space, the increase in fatigue damage causes the image texture uniformity to continuously decrease. Therefore, the texture characteristics indicated by the damage index are consistent with the continuous accumulation process of fatigue damage. Finally, the reliability of the damage index is verified.
4.2. Data Verification
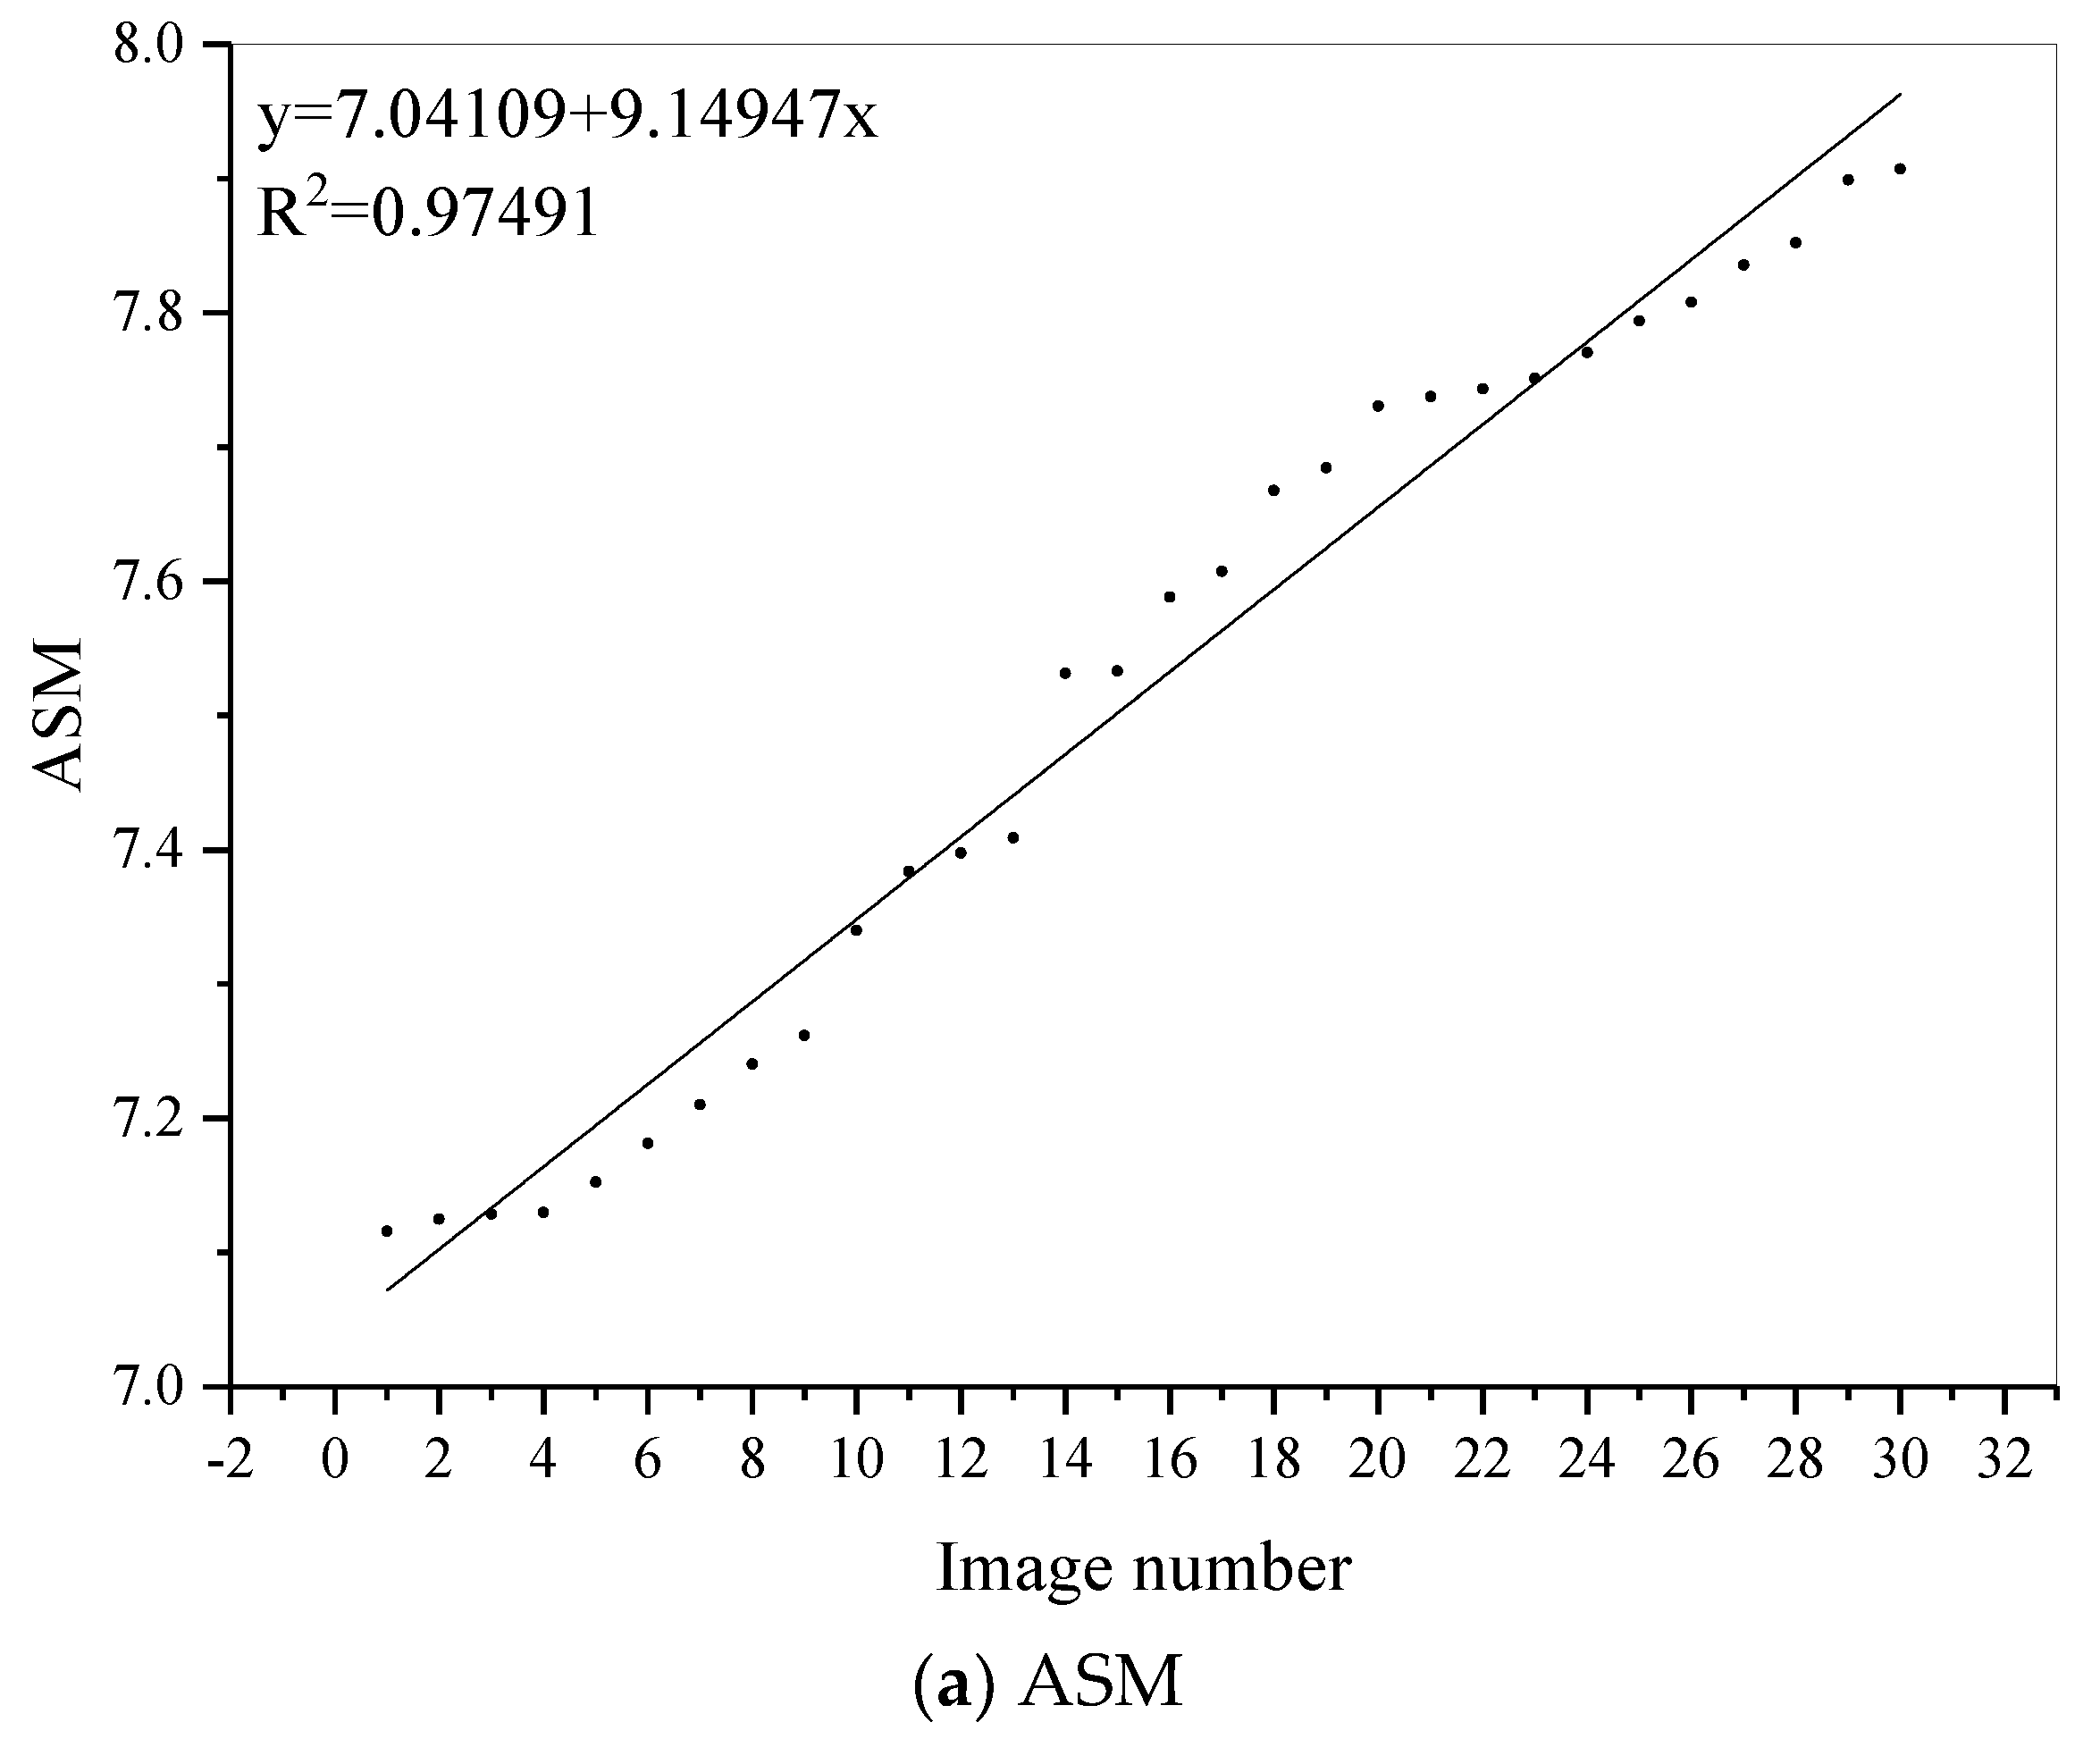
In order to further verify the broad validity of the damage index. The damage index of the randomly acquired damage continuous image is extracted. Additionally, the fitting relationship is established, as show in Figure 10.
There is a specify positive correlation between ASM and the development trend of injury. Additionally, CLS is identify negatively correlated with the development of fatigue damage. CLS and ASM have the same trend and fantastic stability after comparison with multiple experimental images. The verification results show that the CLS and ASM can used as indicators of damage sensitivity characteristics of crack damage monitoring. This indicator can comprehensively monitor the damage status of cracks and accurately predict the health trend of the structure.
5. Conclusions
The 3D laser scanning technology of RPC under fatigue load conditions can clearly and effectively reveal the point cloud data features during the damage process. This work can provide a basis for the health monitoring of the RPC structure. Some of the conclusions drawn are as follows:
- The production principle and process of the inventive 3D laser scanning system was described. Using the system, the damage process of RPC under fatigue load was studied. In the process, the scanned 3D point cloud data simulates the RPC damage process.
- When the damage degree of the RPC structure is slight, the displacement and deflection of the damage source area are small. However, as the degree of damage continues to develop, the location and elevation information of the damaged area is constantly changing. The nonlinear variation of the damage region is described by the GLCM. And the damage characteristic parameter is extracted.
- The sensitive characteristic index is selected based on DFS. The reliability of indicators is verified by the texture characteristics and the random test sample.
- Damage point cloud data acquired from 3D laser scanning technology contains a considerable amount of information to the damage. Damage monitoring method based on 3D laser scanning performs an important role in condition monitoring and life prediction of RPC. In addition, the combination of texture analysis technologies and statistical theory can further demonstrate the advantages of 3D laser scanning technology.
The system can be popularized and applied to the detection and diagnosis of the health status of other composite materials. The damage mechanism is analyzed by the extracted damage index. However, the scanning system is limited to the detection of damaged areas inside the three-dimensional space that can be scanned by laser. Therefore, it is necessary to use methods combined with other non-destructive testing new technologies to try to explore the indicators that are more in line with modern structural damage monitoring.
Author Contributions
Conceptualization, K.L.; Methodology, K.L. and J.W.; Software, K.L. and J.W.; Validation, K.L.; Formal analysis, K.L.; Investigation, K.L.; Resources, K.L.; Data curation, K.L.; Writing—original draft preparation, K.L.; Writing—review and editing, K.L. and D.Q.; Visualization, K.L.; Supervision, K.L., J.W. and D.Q.; Project administration, K.L.; Funding acquisition, K.L.
Funding
This work was founded by the Heilongjiang Natural Science Fund Project(ZD2019E001), the National Science Foundation of China (Grant No. 51605459), funded by the Fundamental Research Fund for the Central University (No.2572018AB31) and Heilongjiang Provincial Postdoctoral Scientific Research Development Fund (Project No.LBH-Q15011).
Conflicts of Interest
The authors declare no conflict of interest.
References
- Sikdar, S.; Ostachowicz, W.; Pal, J. Damage-induced Acoustic Emission Source Identification in an Advanced Sandwich Composite Structure. Compos. Struct. 2018, 202, 860–866. [Google Scholar] [CrossRef]
- Shirsendu, S.; Wiesław, O. Nondestructive analysis of core-junction and joint-debond effects in advanced composite structure. Polym. Test. 2019, 73, 31–38. [Google Scholar]
- Sikdar, S. Multi-level nondestructive analysis of joint-debond effects in sandwich composite structure. Polym. Test. 2019, 80, 1–9. [Google Scholar] [CrossRef]
- Han, B.; Wang, Z.; Zeng, S.; Zhou, D.; Yu, X.; Cui, X. Properties and modification mechanisms of nano-zirconia filled reactive powder concrete. Constr. Build. Mater. 2017, 141, 426–434. [Google Scholar] [CrossRef] [Green Version]
- Dong, S.; Han, B.; Ou, J.; Li, Z.; Han, L.; Yu, X. Electrically conductive behaviors and mechanisms of short-cut super-fine stainless wire reinforced reactive powder concrete. Cem. Concr. Compos. 2016, 72, 48–65. [Google Scholar] [CrossRef] [Green Version]
- Mao, X.Q.; Qu, W.; Zhu, P. Mixture optimization of green reactive powder concrete with recycled powder. J. Mater. Civ. Eng. 2019, 31, 04019033. [Google Scholar] [CrossRef]
- Sanchayan, S.; Foster, S.J. High temperature behaviour of hybrid steel–pva fibre reinforced reactive powder concrete. Mater. Struct. 2016, 49, 769–782. [Google Scholar] [CrossRef]
- Flansbjer, M.; Portal, N.W.; Vennetti, D.; Mueller, U. Composite behaviour of textile reinforced reactive powder concrete sandwich façade elements. Int. J. Concr. Struct. Mater. 2018, 12, 1–17. [Google Scholar] [CrossRef]
- Ju, B.Y.; Wang, L.; Liu, H.; Ma, G. Experimental investigation into mechanical properties of polypropylene reactive powder concrete. ACI Mater. J. 2018, 115, 21–32. [Google Scholar] [CrossRef]
- He, M.; Li, N.; Zhu, C.; Chen, Y.; Wu, H. Experimental investigation and damage modeling of salt rock subjected to fatigue loading. Int. J. Rock Mech. Min. Sci. 2018, 114, 17–23. [Google Scholar] [CrossRef]
- Jian, L.; Peng, Z.; Lei, L.; Fei, L.; Miao, X.-T.; Le, C.; Zhou, B.-B.; He, X.-H.; Zhou, C.-Y. Effect of pre-strain on fatigue crack growth behavior for commercial pure titanium at ambient temperature. Int. J. Fatigue 2018, 117, 27–38. [Google Scholar]
- Lin, J.; Huang, P.; Guo, X.; Zheng, X.; Zhao, C. Fatigue performance of rc beams strengthened with cfrp under coupling action of temperatures and vehicle random loads. Fatigue Fract. Eng. Mater. Struct. 2019, 42, 31–44. [Google Scholar] [CrossRef] [Green Version]
- Hanif, M.U.; Ibrahim, Z.; Ghaedi, K.; Hashim, H.; Javanmardi, A. Damage assessment of reinforced concrete structures using a model-based nonlinear approach—A comprehensive review. Constr. Build. Mater. 2018, 192, 846–865. [Google Scholar] [CrossRef]
- Li, X.; Ma, D.; Liu, H.; Tan, W.; Gong, X.; Zhang, C. Assessment of failure criteria and damage evolution methods for composite laminates under low-velocity impact. Compos. Struct. 2019, 207, 727–739. [Google Scholar] [CrossRef]
- Wang, R.Z.; Zhu, S.P.; Wang, J.; Zhang, X.C.; Tu, S.T.; Zhang, C.C. High temperature fatigue and creep-fatigue behaviors in a ni-based superalloy: Damage mechanisms and life assessment. Int. J. Fatigue 2018, 118, 8–21. [Google Scholar] [CrossRef]
- Li, B.; Wang, K.-Y.; Mao, J.-Z.; Guo, Q.-Y. Study on the damage mechanism of pore structure in concrete subjected to freeze-thaw cycles. Civ. Eng. J. 2015, 24, 1–11. [Google Scholar] [CrossRef]
- Wang, Y.-J.; Wen, W.-L.; Wu, C.-Y.; Yu, Z.-T.; Guo, X.-Y.; Zhao, C.-J. Maize Plant Phenotyping: Comparing 3D Laser Scanning, Multi-View Stereo Reconstruction, and 3D Digitizing Estimates. Remote Sens. 2018, 11, 63. [Google Scholar] [CrossRef] [Green Version]
- Chen, D.M.; Xu, Y.F.; Zhu, W.D. Identification of damage in plates using full-field measurement with a continuously scanning laser doppler vibrometer system. J. Sound Vib. 2018, 422, 542–567. [Google Scholar] [CrossRef]
- Valenca, J.; Puente, I.; Júlio, E.; González-Jorge, H.; Arias-Sánchez, P. Assessment of cracks on concrete bridges using image processing supported by laser scanning survey. Constr. Build. Mater. 2017, 146, 668–678. [Google Scholar] [CrossRef]
- Park, B.; Sohn, H.; Liu, P. Accelerated noncontact laser ultrasonic scanning for damage detection using combined binary search and compressed sensing. Mech. Syst. Signal Process. 2017, 92, 315–333. [Google Scholar] [CrossRef]
- Acikgoz, S.; Soga, K.; Woodhams, J. Evaluation of the response of a vaulted masonry structure to differ8ential settlements using point cloud data and limit analyses. Constr. Build. Mater. 2017, 150, 916–931. [Google Scholar] [CrossRef]
- Cheng, B.; Shrestha, S.; Chou, K. Stress and deformation evaluations of scanning strategy effect in selective laser melting. Addit. Manuf. 2018, 1, 240–251. [Google Scholar]
- Fina, F.; Madla, C.M.; Goyanes, A.; Zhang, J.; Gaisford, S. Fabricating 3d printed orally disintegrating printlets using selective laser sintering. Int. J. Pharm. 2018, 541, 101–107. [Google Scholar] [CrossRef] [PubMed]
Figure 1.
Design drawing of 3D laser scanning system.

Figure 2.
The schematic diagram of GLCM.

Figure 3.
Loading diagram.

Figure 4.
Analysis of the whole process.

Figure 5.
Data acquisition.

Figure 6.
Structure point cloud diagram.

Figure 7.
Development of damage in 2D space.

Figure 8.
Transformation algorithm.

Figure 9.
Screening result.

Figure 10.
Fitting relationship between damage index and crack development trend.


Table 1.
Characteristic parameters.
| Texture Parameter | Calculation Formulas | Damage Characteristics |
|---|---|---|
| ASM | Gray distribution uniformity and texture thickness. | |
| COR | Texture distribution. | |
| CLS | Texture uniformity. | |
| IDM | Local texture changes. | |
| ENT | Content randomness and image texture complexity. | |
| VAR | Texture period size. |
Note: , , , , m is the average of , .
Table 2.
Performance indexes of cement.
| Soundness | Setting Time /min | Compressive Strength /MPa | Flexural Strength /MPa | |||
|---|---|---|---|---|---|---|
| Initial Setting | Final Setting | 3d | 28d | 3d | 28d | |
| Up to standard | 170 | 238 | 22.3 | 42.9 | 5.7 | 7.7 |
Table 3.
Mix proportions of RPC kg/m3.
| Water-binder Ratio | Water | Cement | Silica Fume | Fly Ash | Quartz Powder | Quartz Sand | Water Reducer | Steel Fiber |
|---|---|---|---|---|---|---|---|---|
| 0.19 | 171 | 620.7 | 155.2 | 124.1 | 362.7 | 846.3 | 27 | 96 |
Table 4.
Specification and quantity.
| Test Type | Specification/mm | Quantity |
|---|---|---|
| Flexural strength | 40 × 40 × 160 | 12 |
| Fatigue loading | 40 × 40 × 160 | 72 |
Table 5.
Test results of flexural tensile strength.
| Specimen Type | RPC |
|---|---|
| Bending strength (MPa) | 27.76 |
Table 6.
Texture characteristics of damage indicators.
| Damage Index | Texture Characteristics |
|---|---|
| ASM | Image texture width |
| CLS | Image texture uniformity |
© 2019 by the authors. Licensee MDPI, Basel, Switzerland. This article is an open access article distributed under the terms and conditions of the Creative Commons Attribution (CC BY) license (http://creativecommons.org/licenses/by/4.0/).
Share and Cite
MDPI and ACS Style
Li, K.; Wang, J.; Qi, D. Damage Diagnosis of Reactive Powder Concrete under Fatigue Loading Using 3D Laser Scanning Technology. Algorithms 2019, 12, 260. https://doi.org/10.3390/a12120260
AMA Style
Li K, Wang J, Qi D. Damage Diagnosis of Reactive Powder Concrete under Fatigue Loading Using 3D Laser Scanning Technology. Algorithms. 2019; 12(12):260. https://doi.org/10.3390/a12120260
Chicago/Turabian StyleLi, Kexin, Jun Wang, and Dawei Qi. 2019. "Damage Diagnosis of Reactive Powder Concrete under Fatigue Loading Using 3D Laser Scanning Technology" Algorithms 12, no. 12: 260. https://doi.org/10.3390/a12120260
Note that from the first issue of 2016, this journal uses article numbers instead of page numbers. See further details here.