
Improved Bond Equations for Fiber-Reinforced Polymer Bars in Concrete


Abstract
:1. Introduction
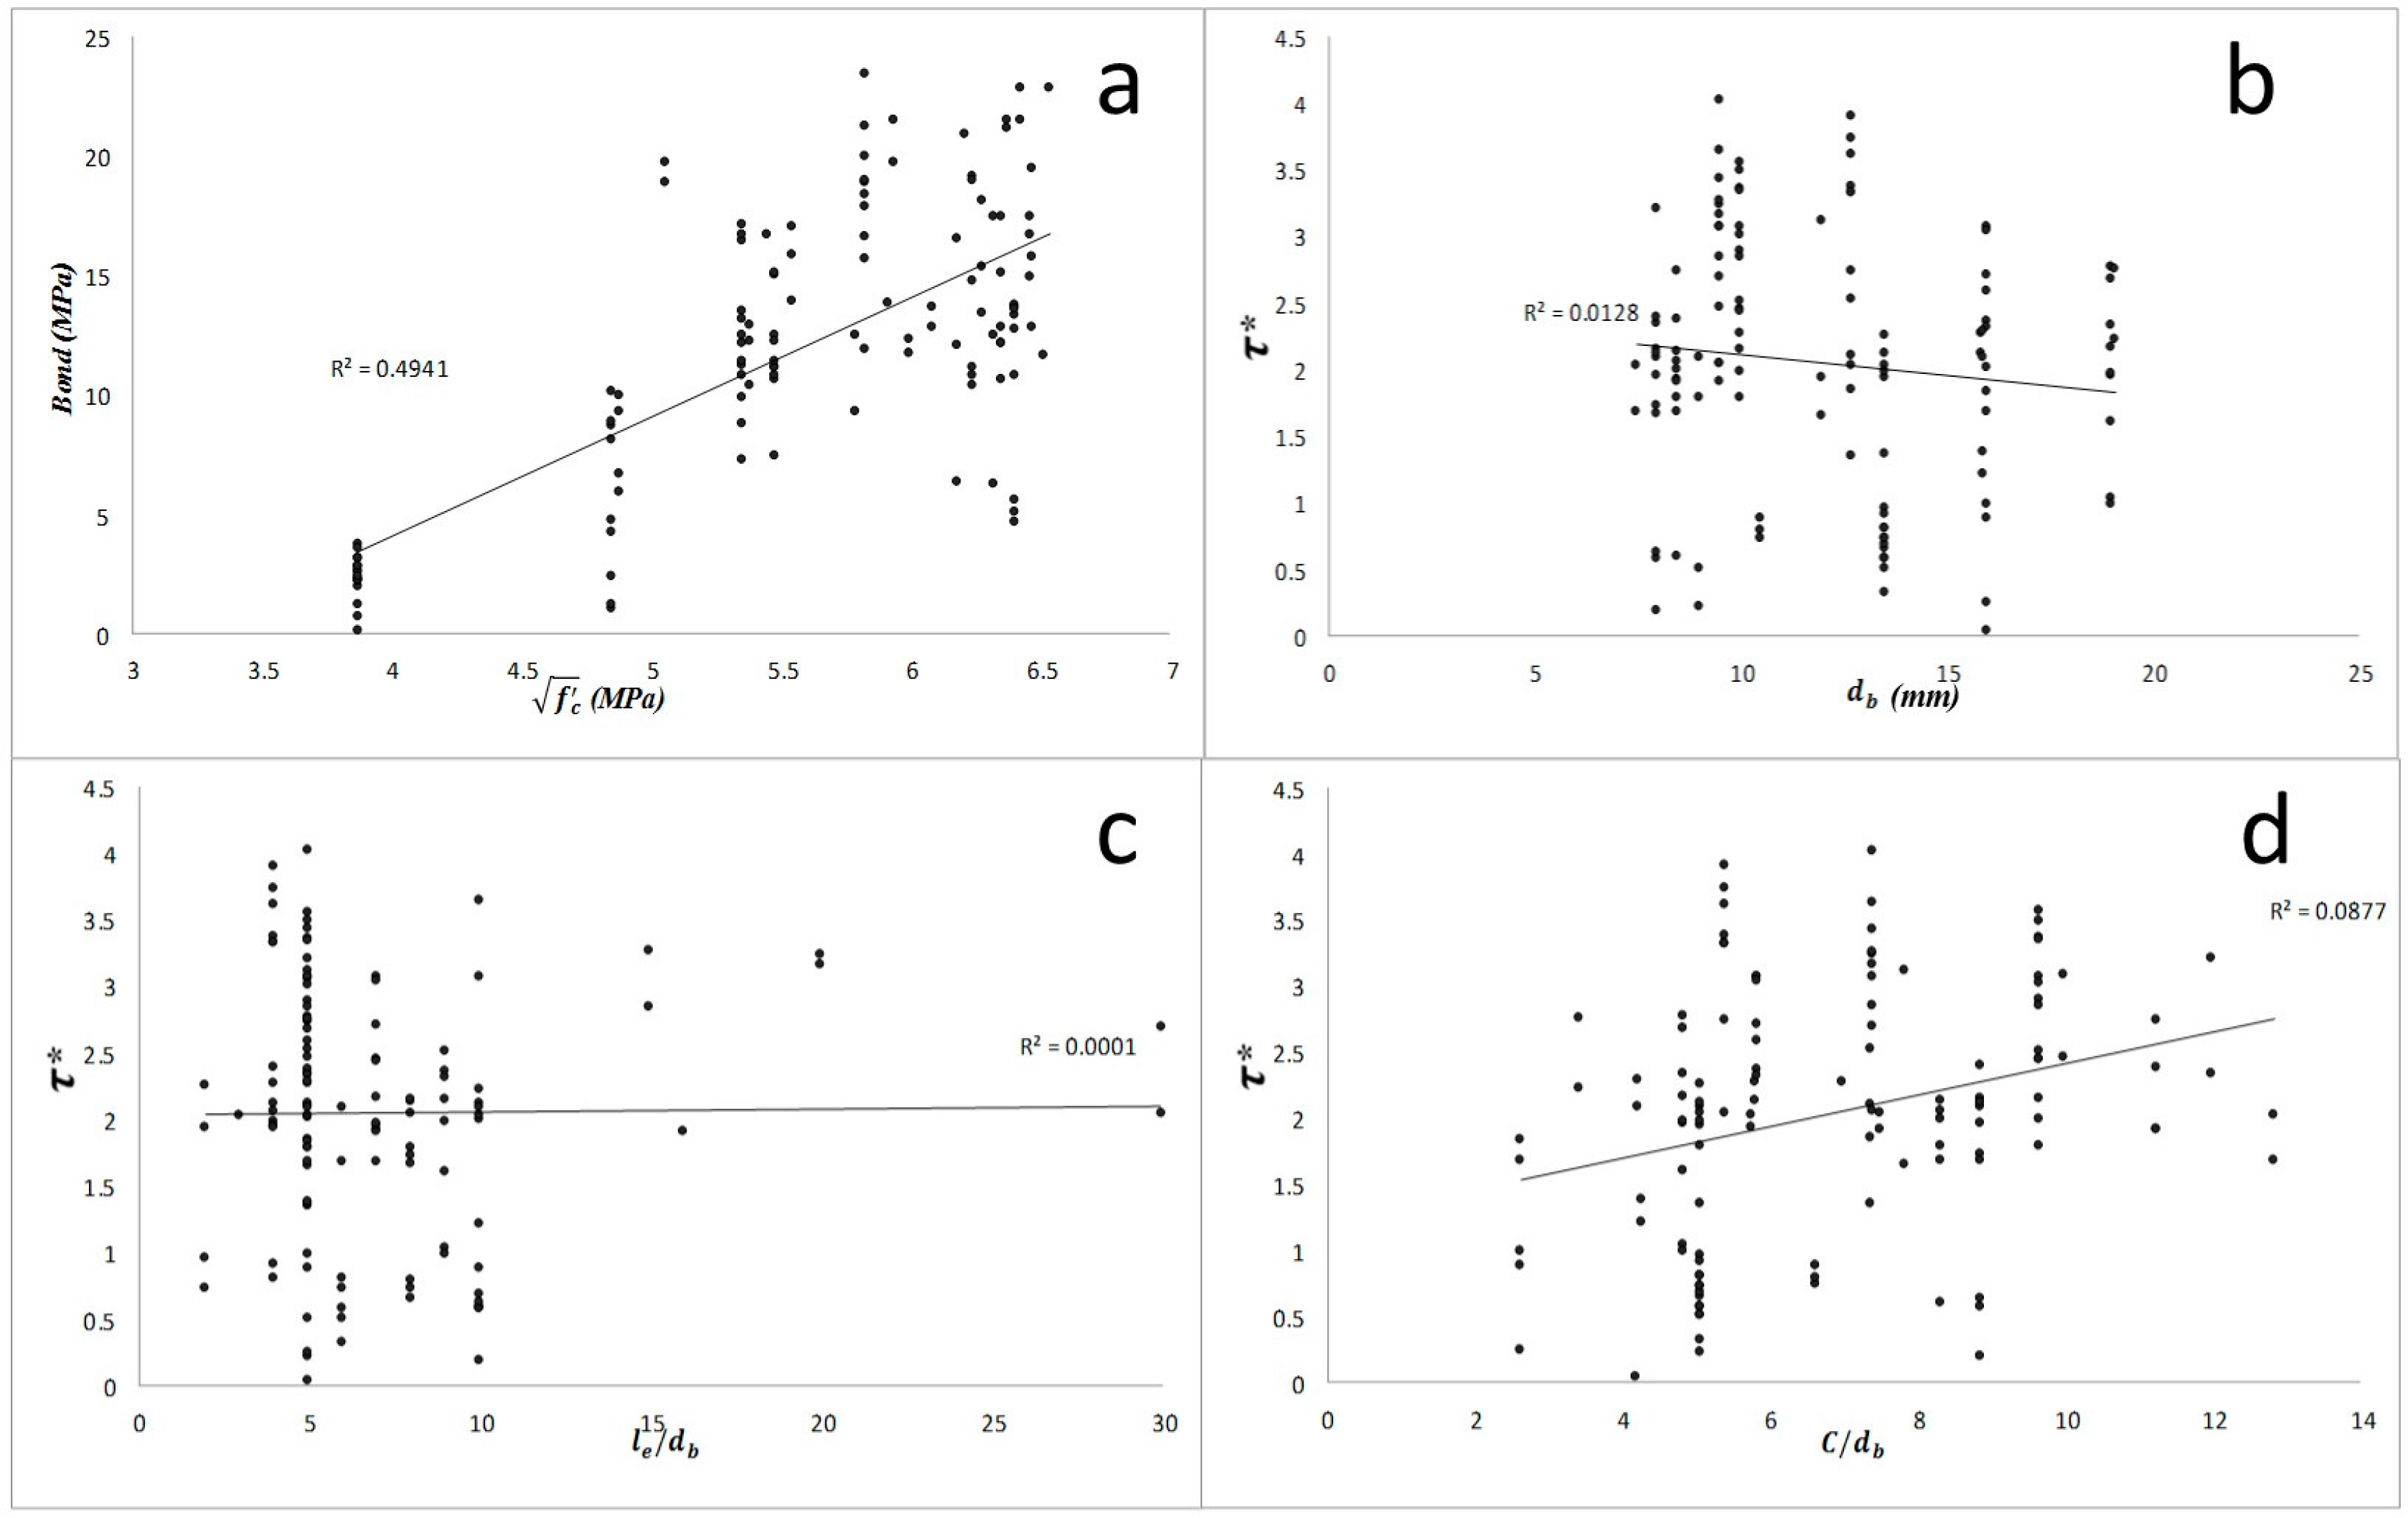
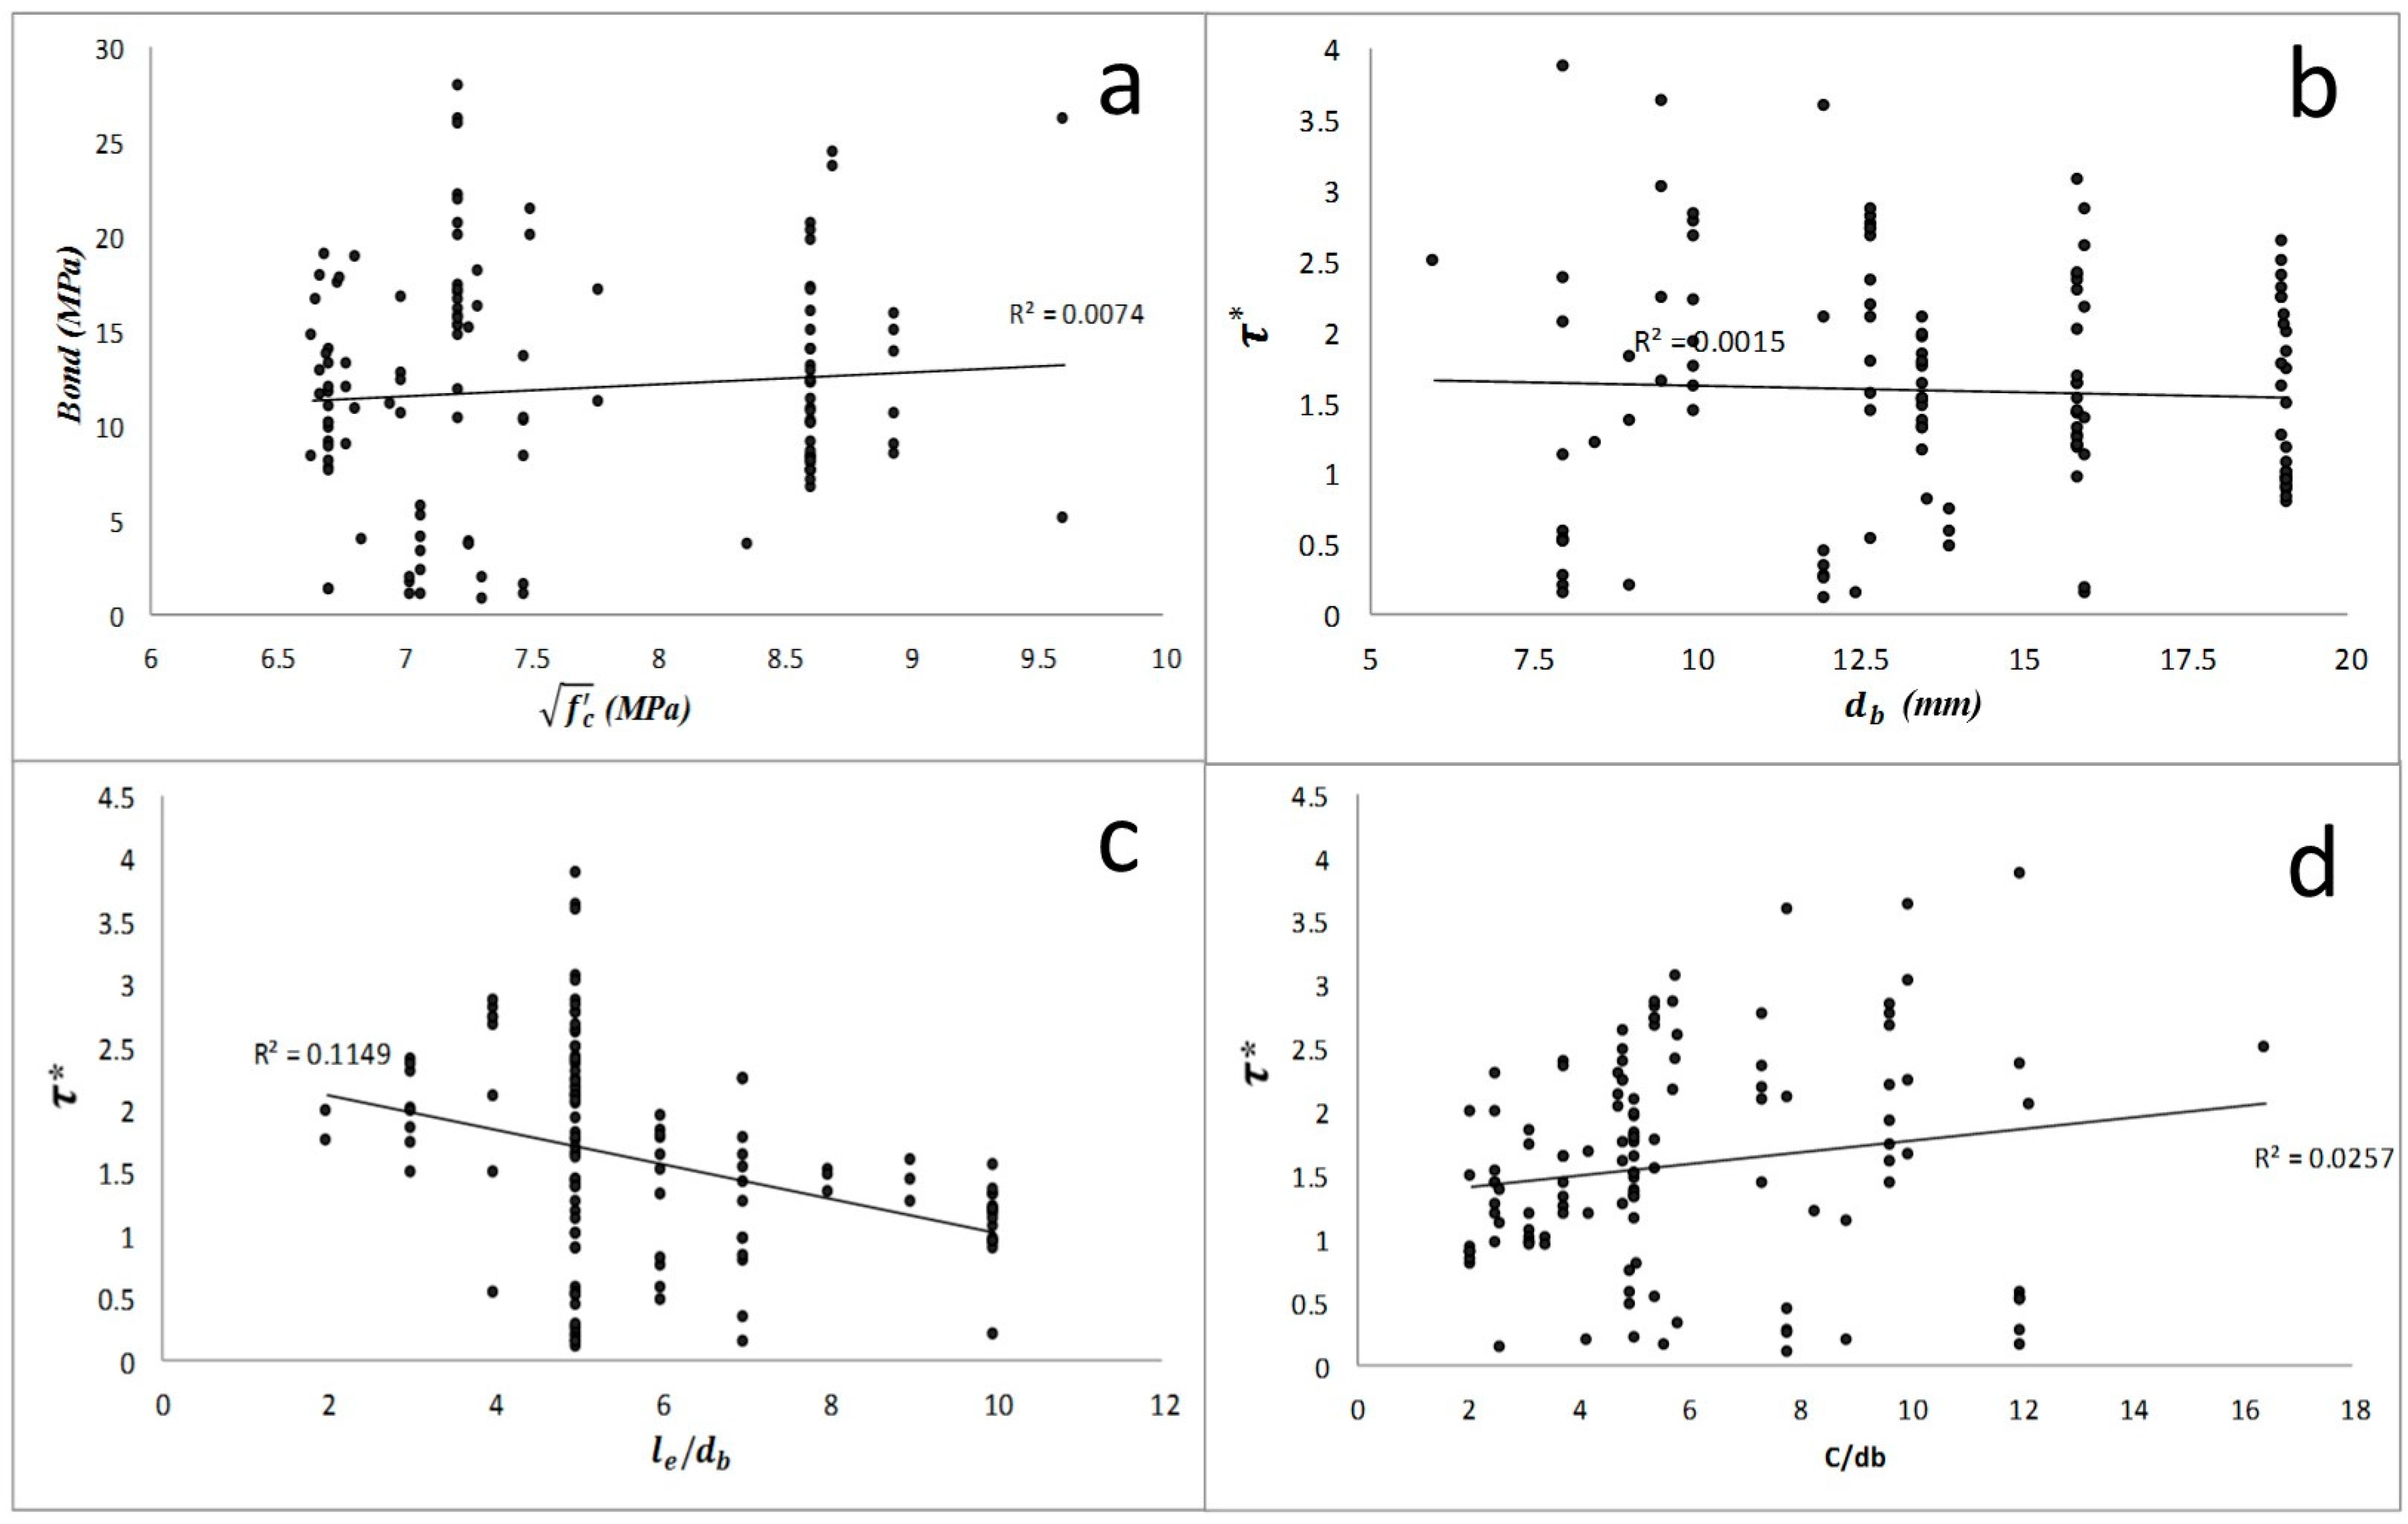
2. Experimental Database
3. Suggested Factors Affecting the Bond Behavior of FRP-Reinforced Concrete
- 1.
- 2.
- Concrete cover: the concrete affects the bond failure mechanism because it increases the bond strength due to providing the rebar’s confinement [19]. Concrete cover is defined as the distance between the center of embedded reinforcement and the outer surface of the concrete.
- 3.
- Bar diameter: the bond capacity is reduced with increased bar diameter [17].
- 4.
- Embedment length: the initial bond stiffness of FRP bars increases when the embedment length is long. However, the stress is distributed along a longer length as embedment length increases, therefore there will be a decrease in bond capacity [17].
- 5.
- Bar cast position: upward movement of air and water and their getting trapped under the rebar during the horizontal placement of concrete have a negative effect on bond strength [17].
- 6.
- 7.
- Type of rebar surface: although in general it has been observed that the deformed bars have better bond behavior than bars with a smooth surface, no definite relation between rebar surface and bond strength has been determined [17].
- 8.
- Transverse reinforcement: confinement provided by transverse reinforcement limits the improvement of splitting crack. So, occurrence of bond failure requires a greater force [17].
4. Existing Equations for Predicting Bond Strength
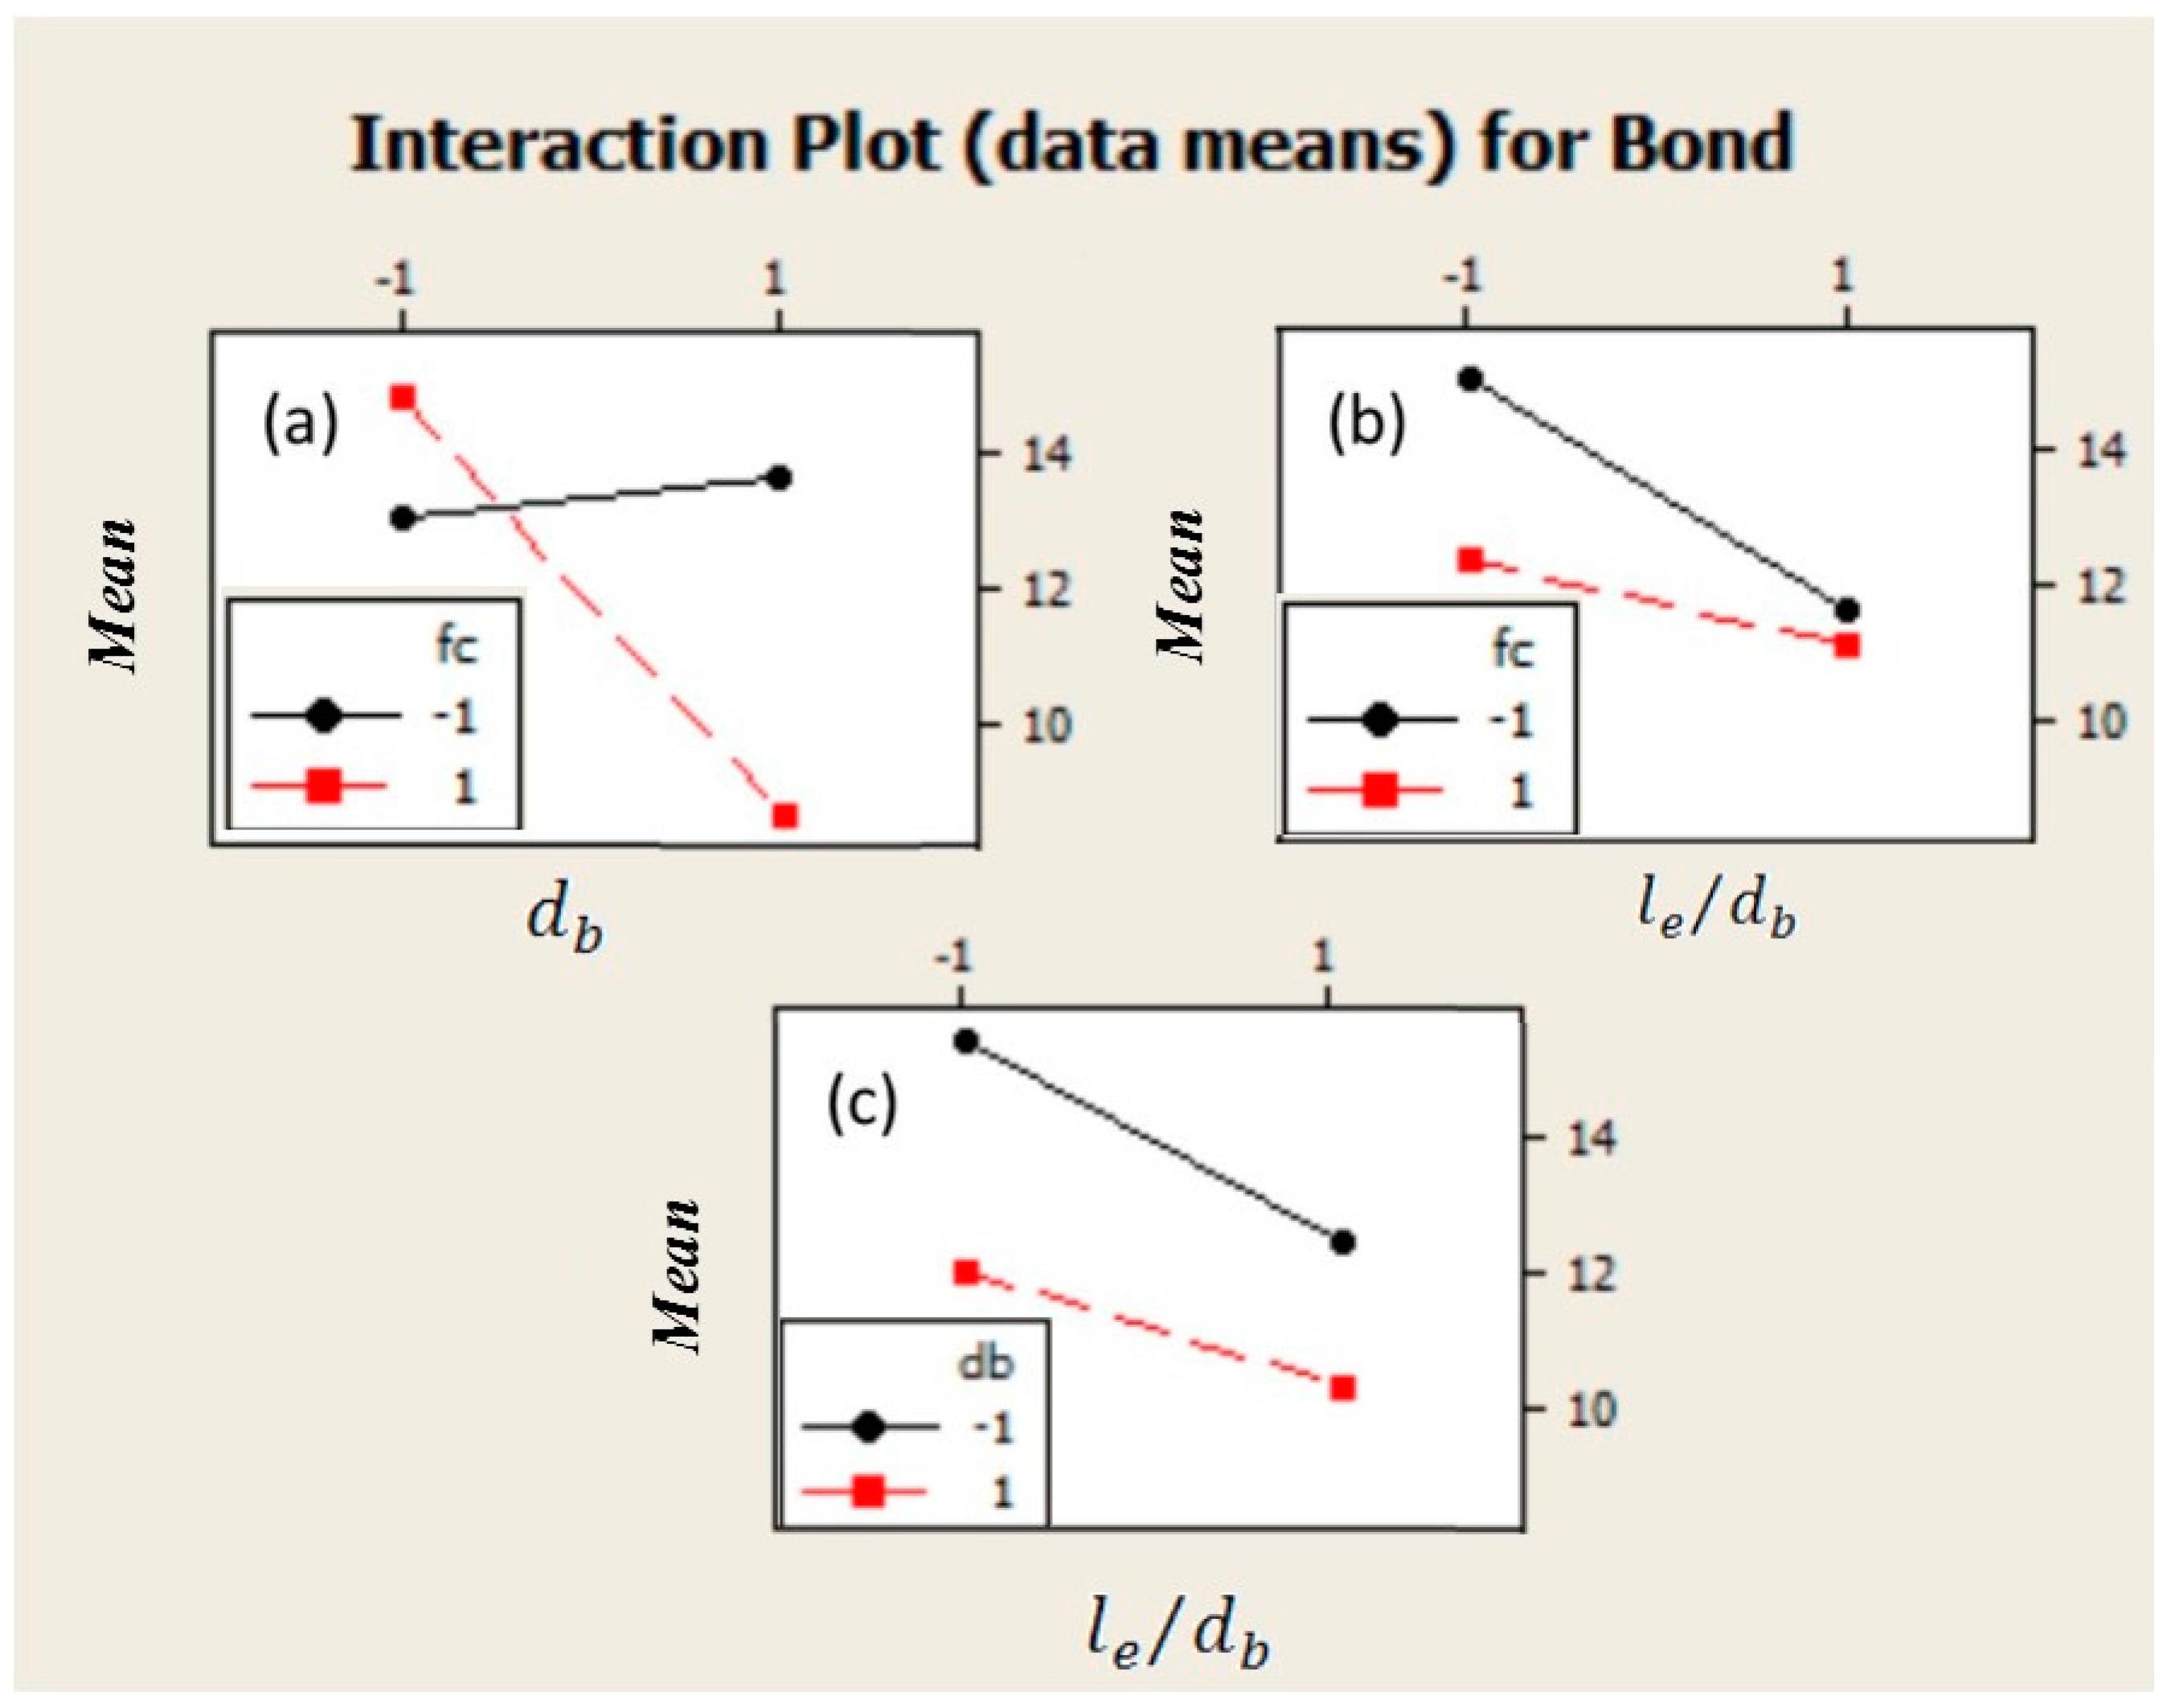
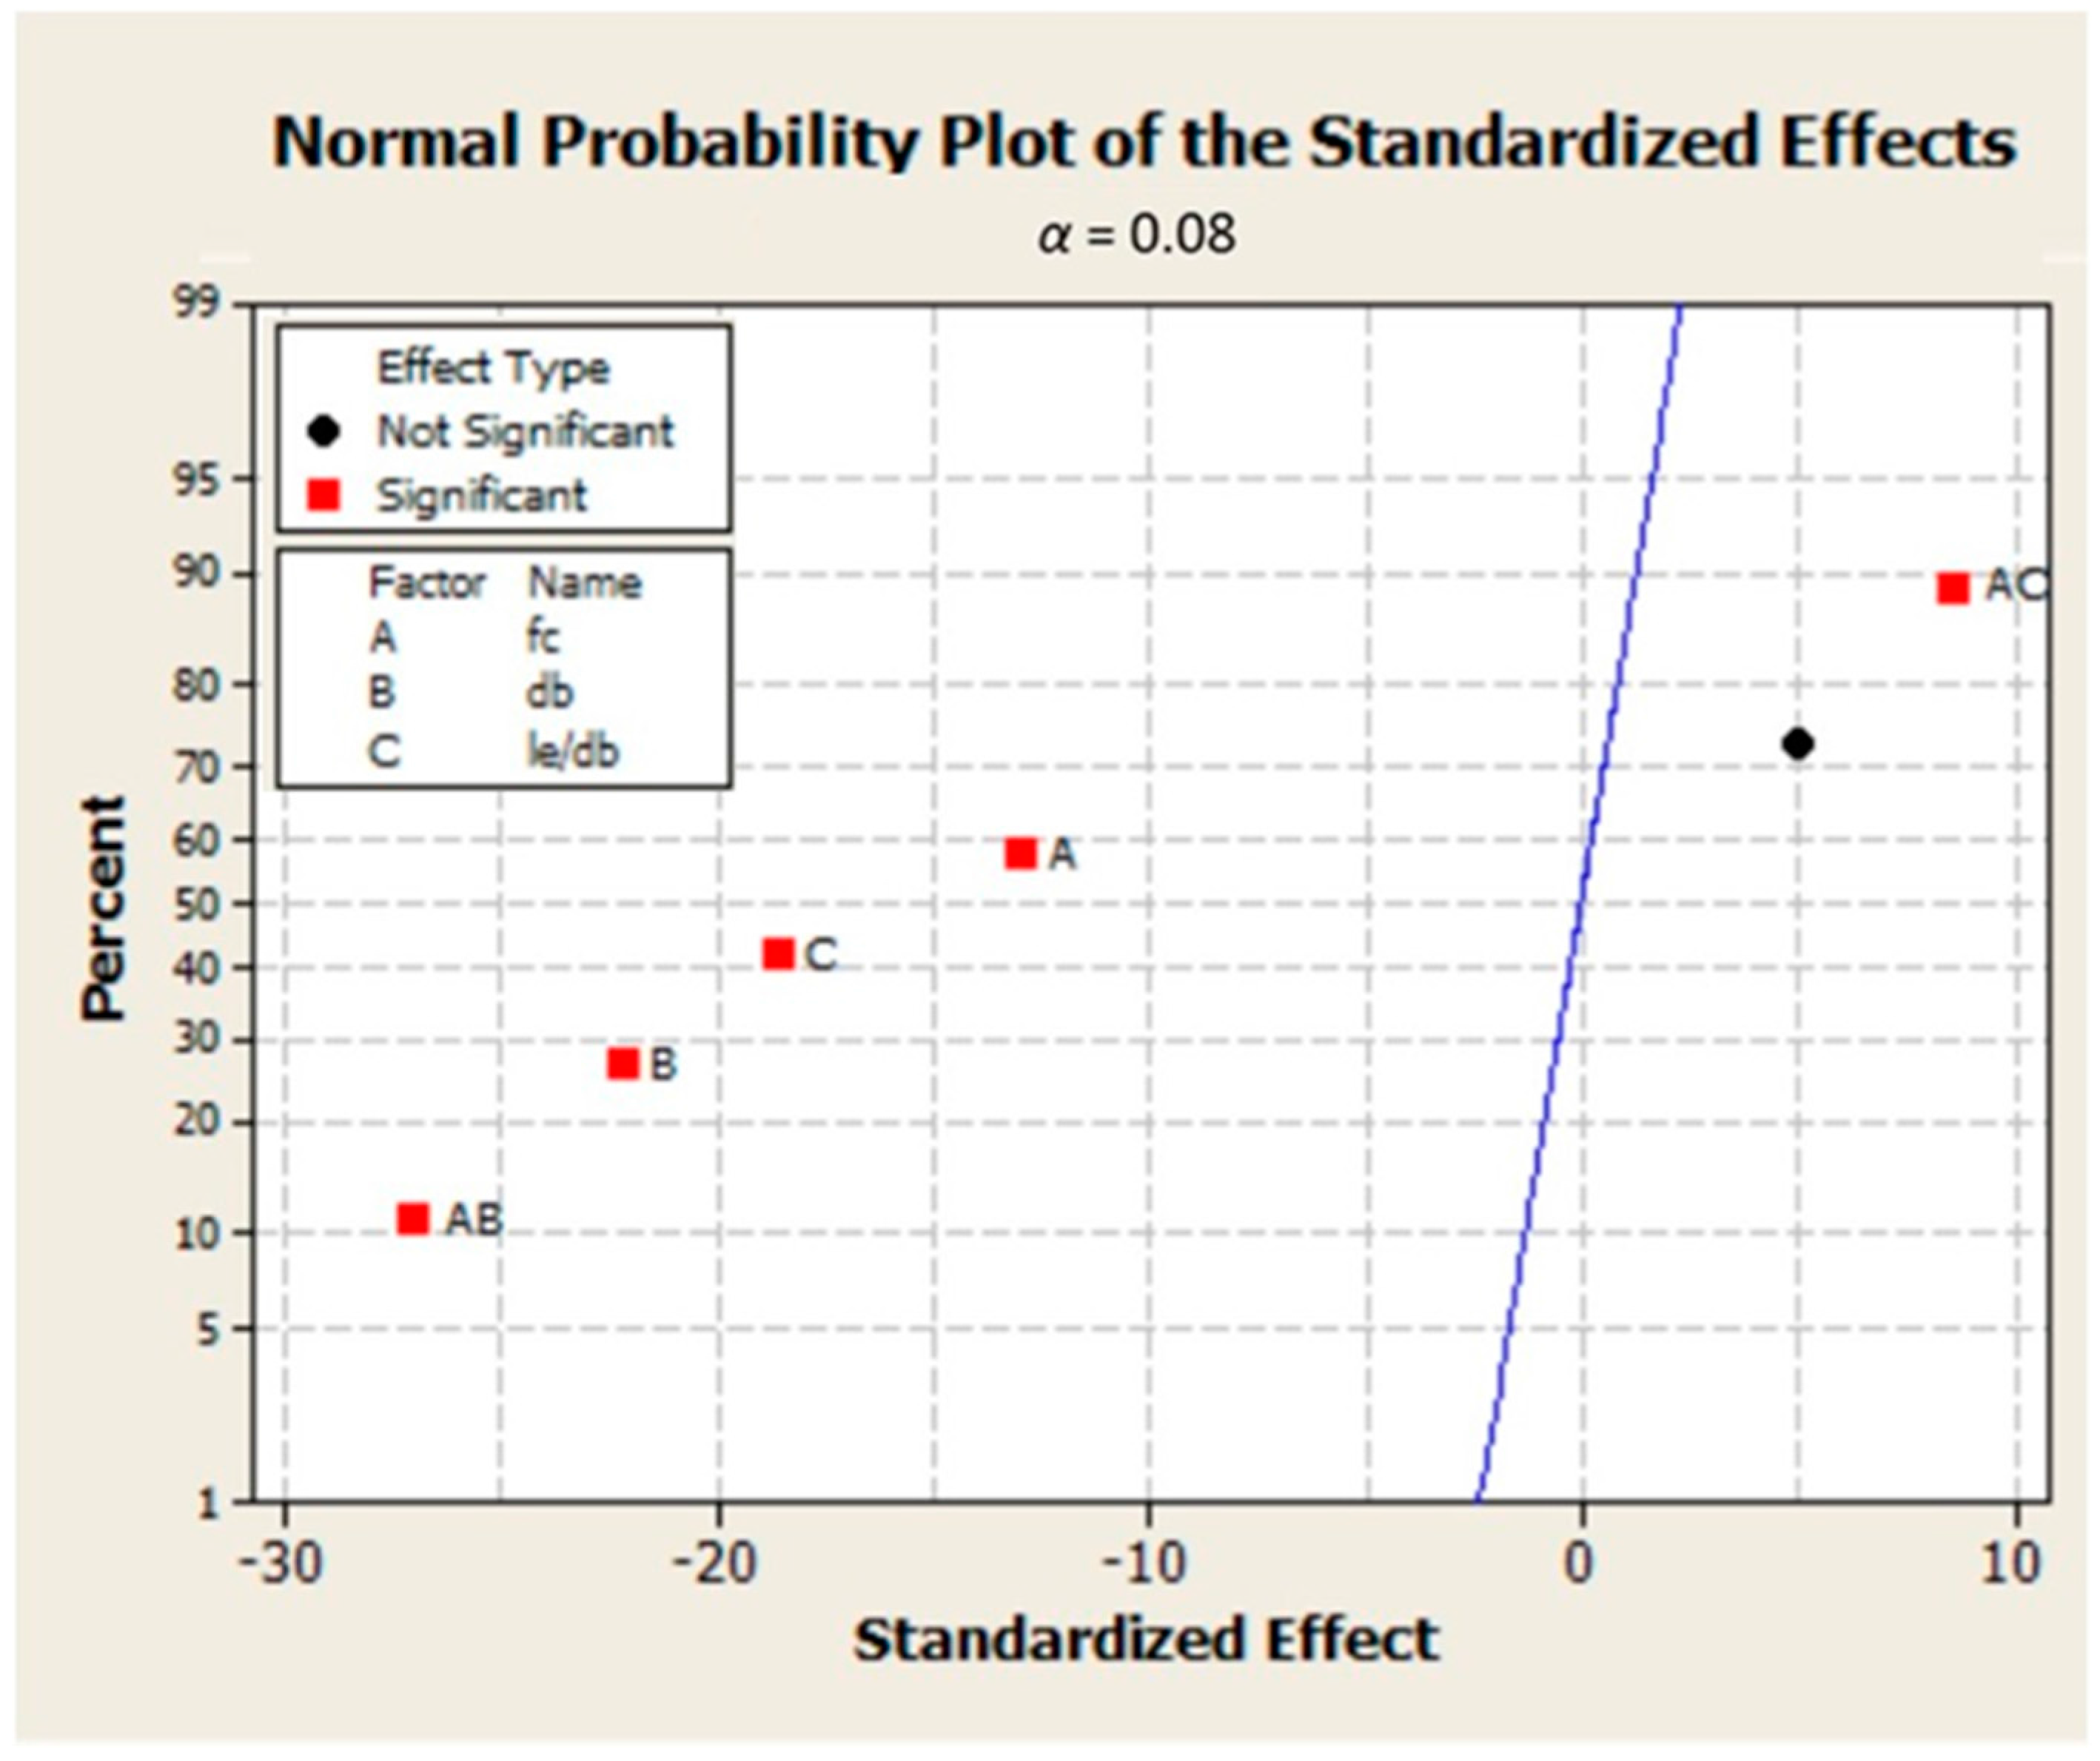
5. A 23 Factorial Design for Parameter Screening
6. New Bond Prediction Equations
7. How to Compare Different Bond Models
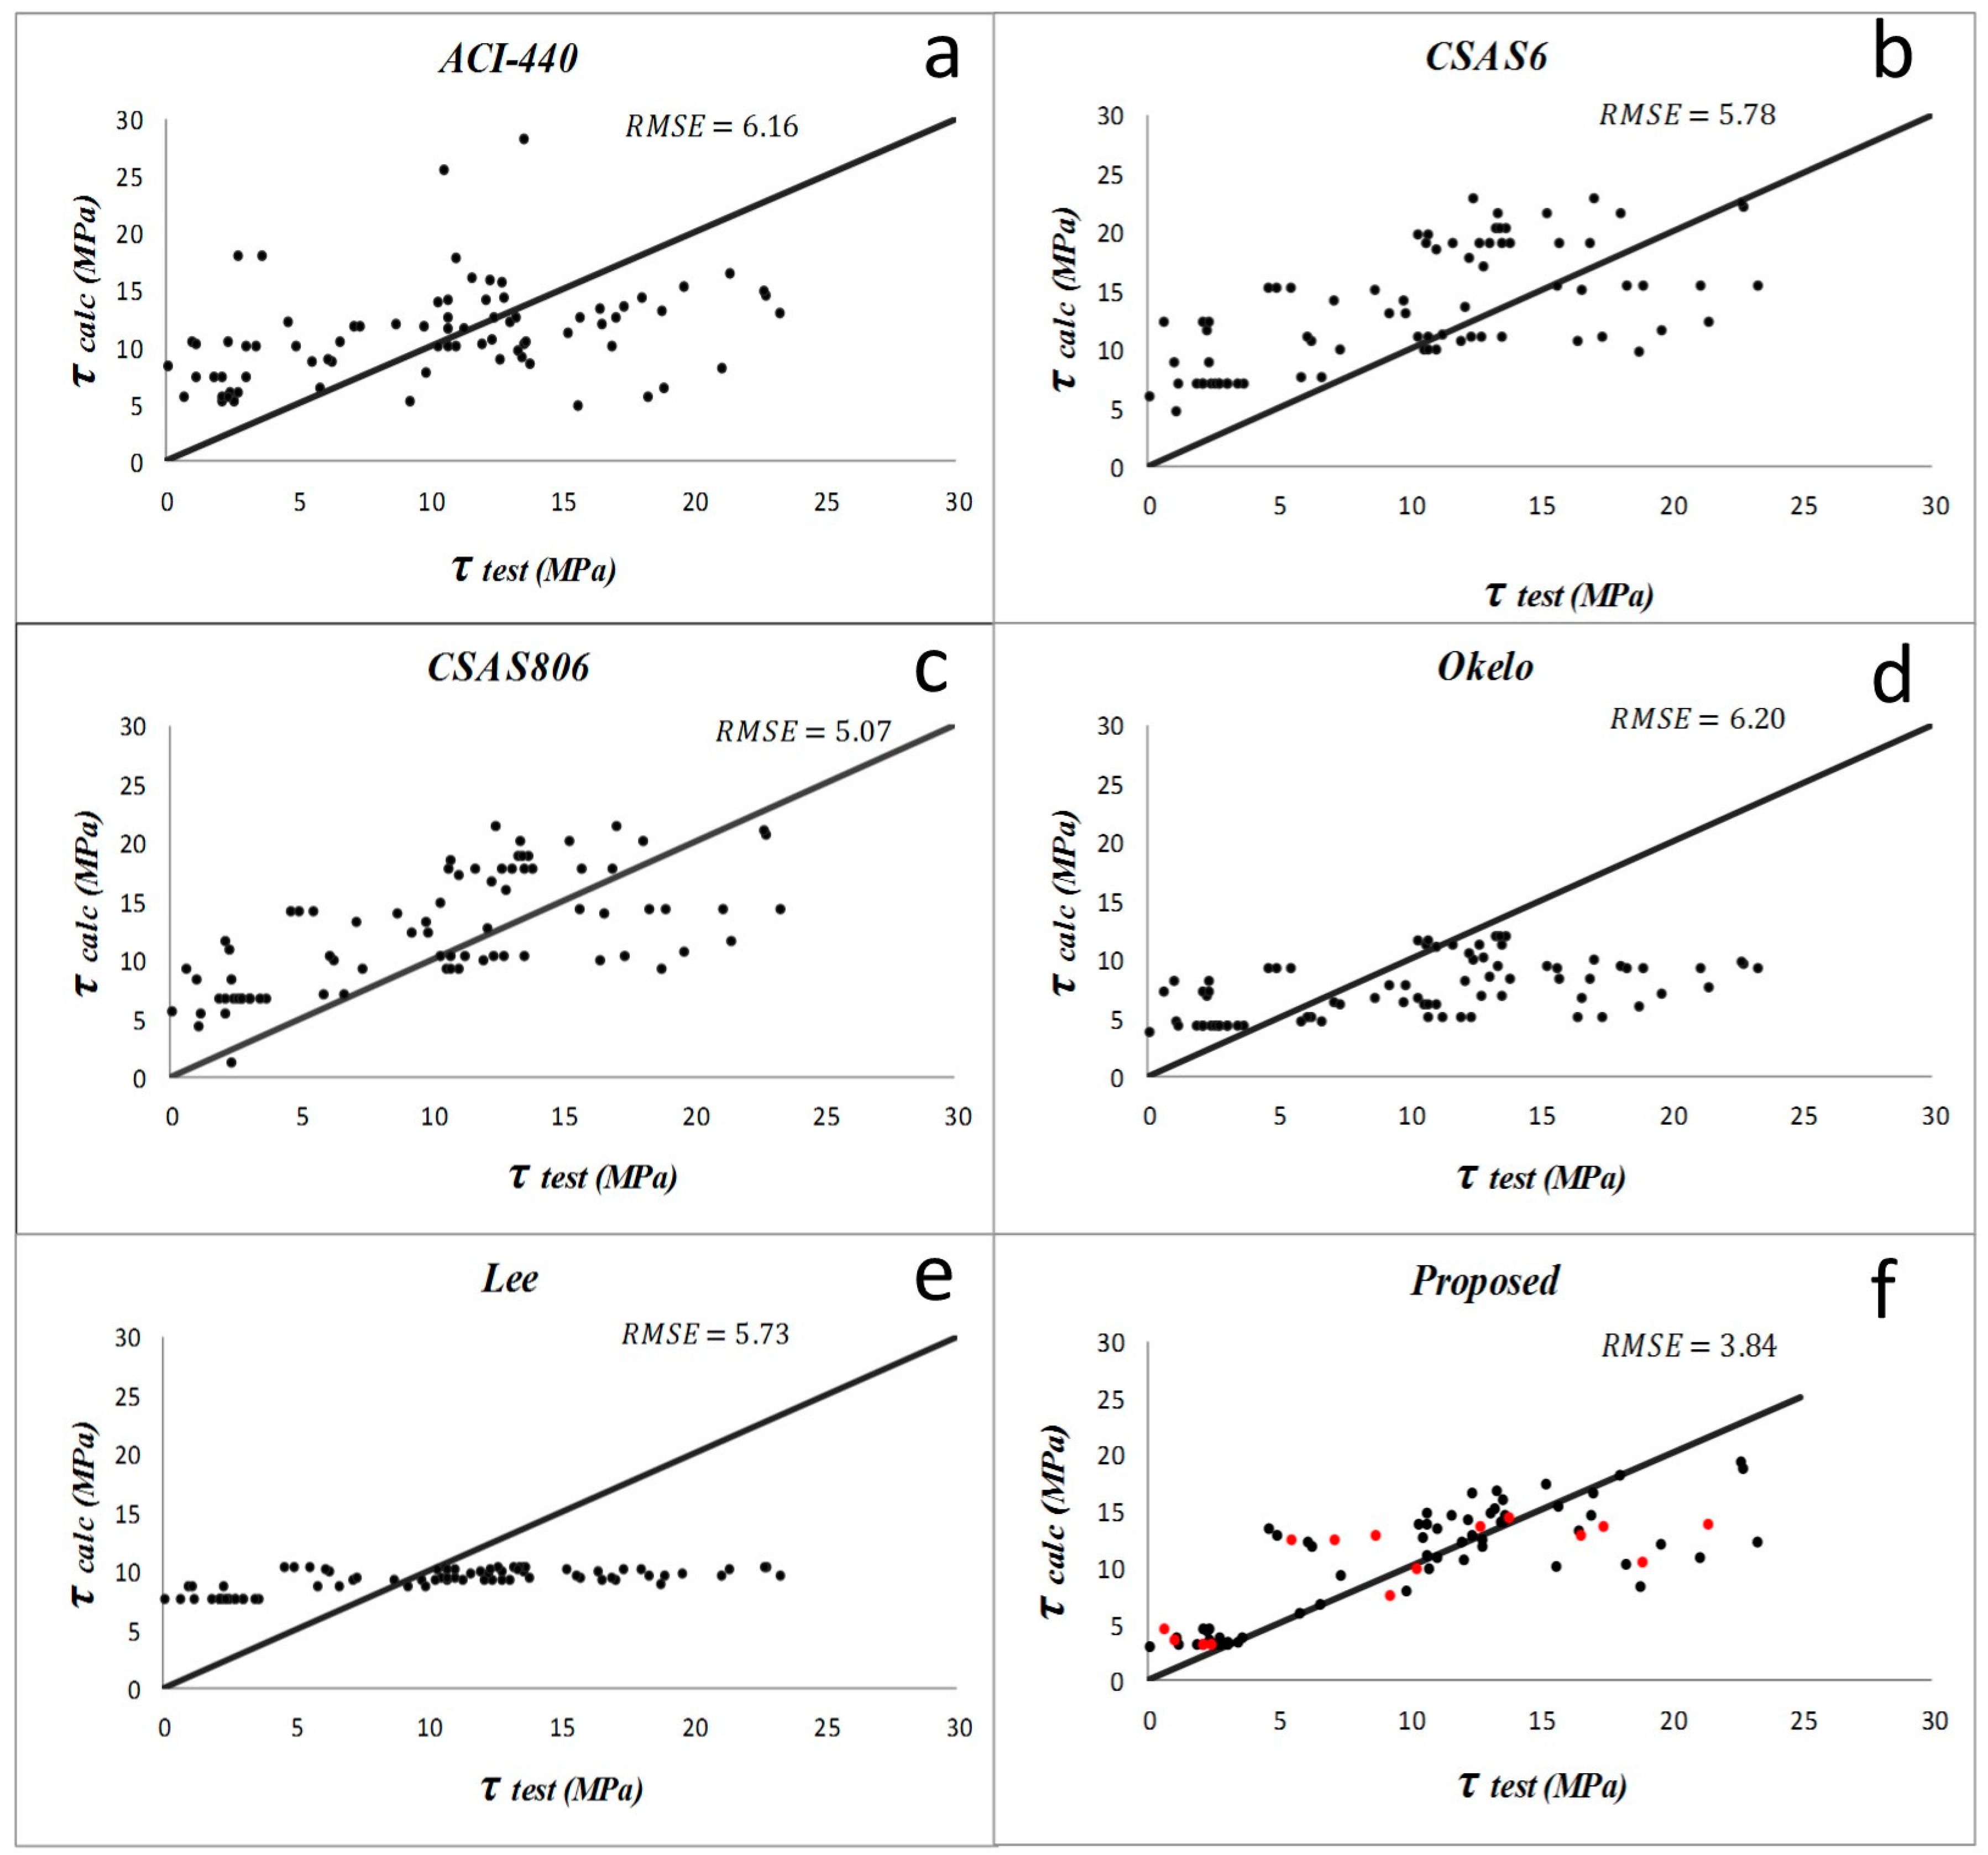
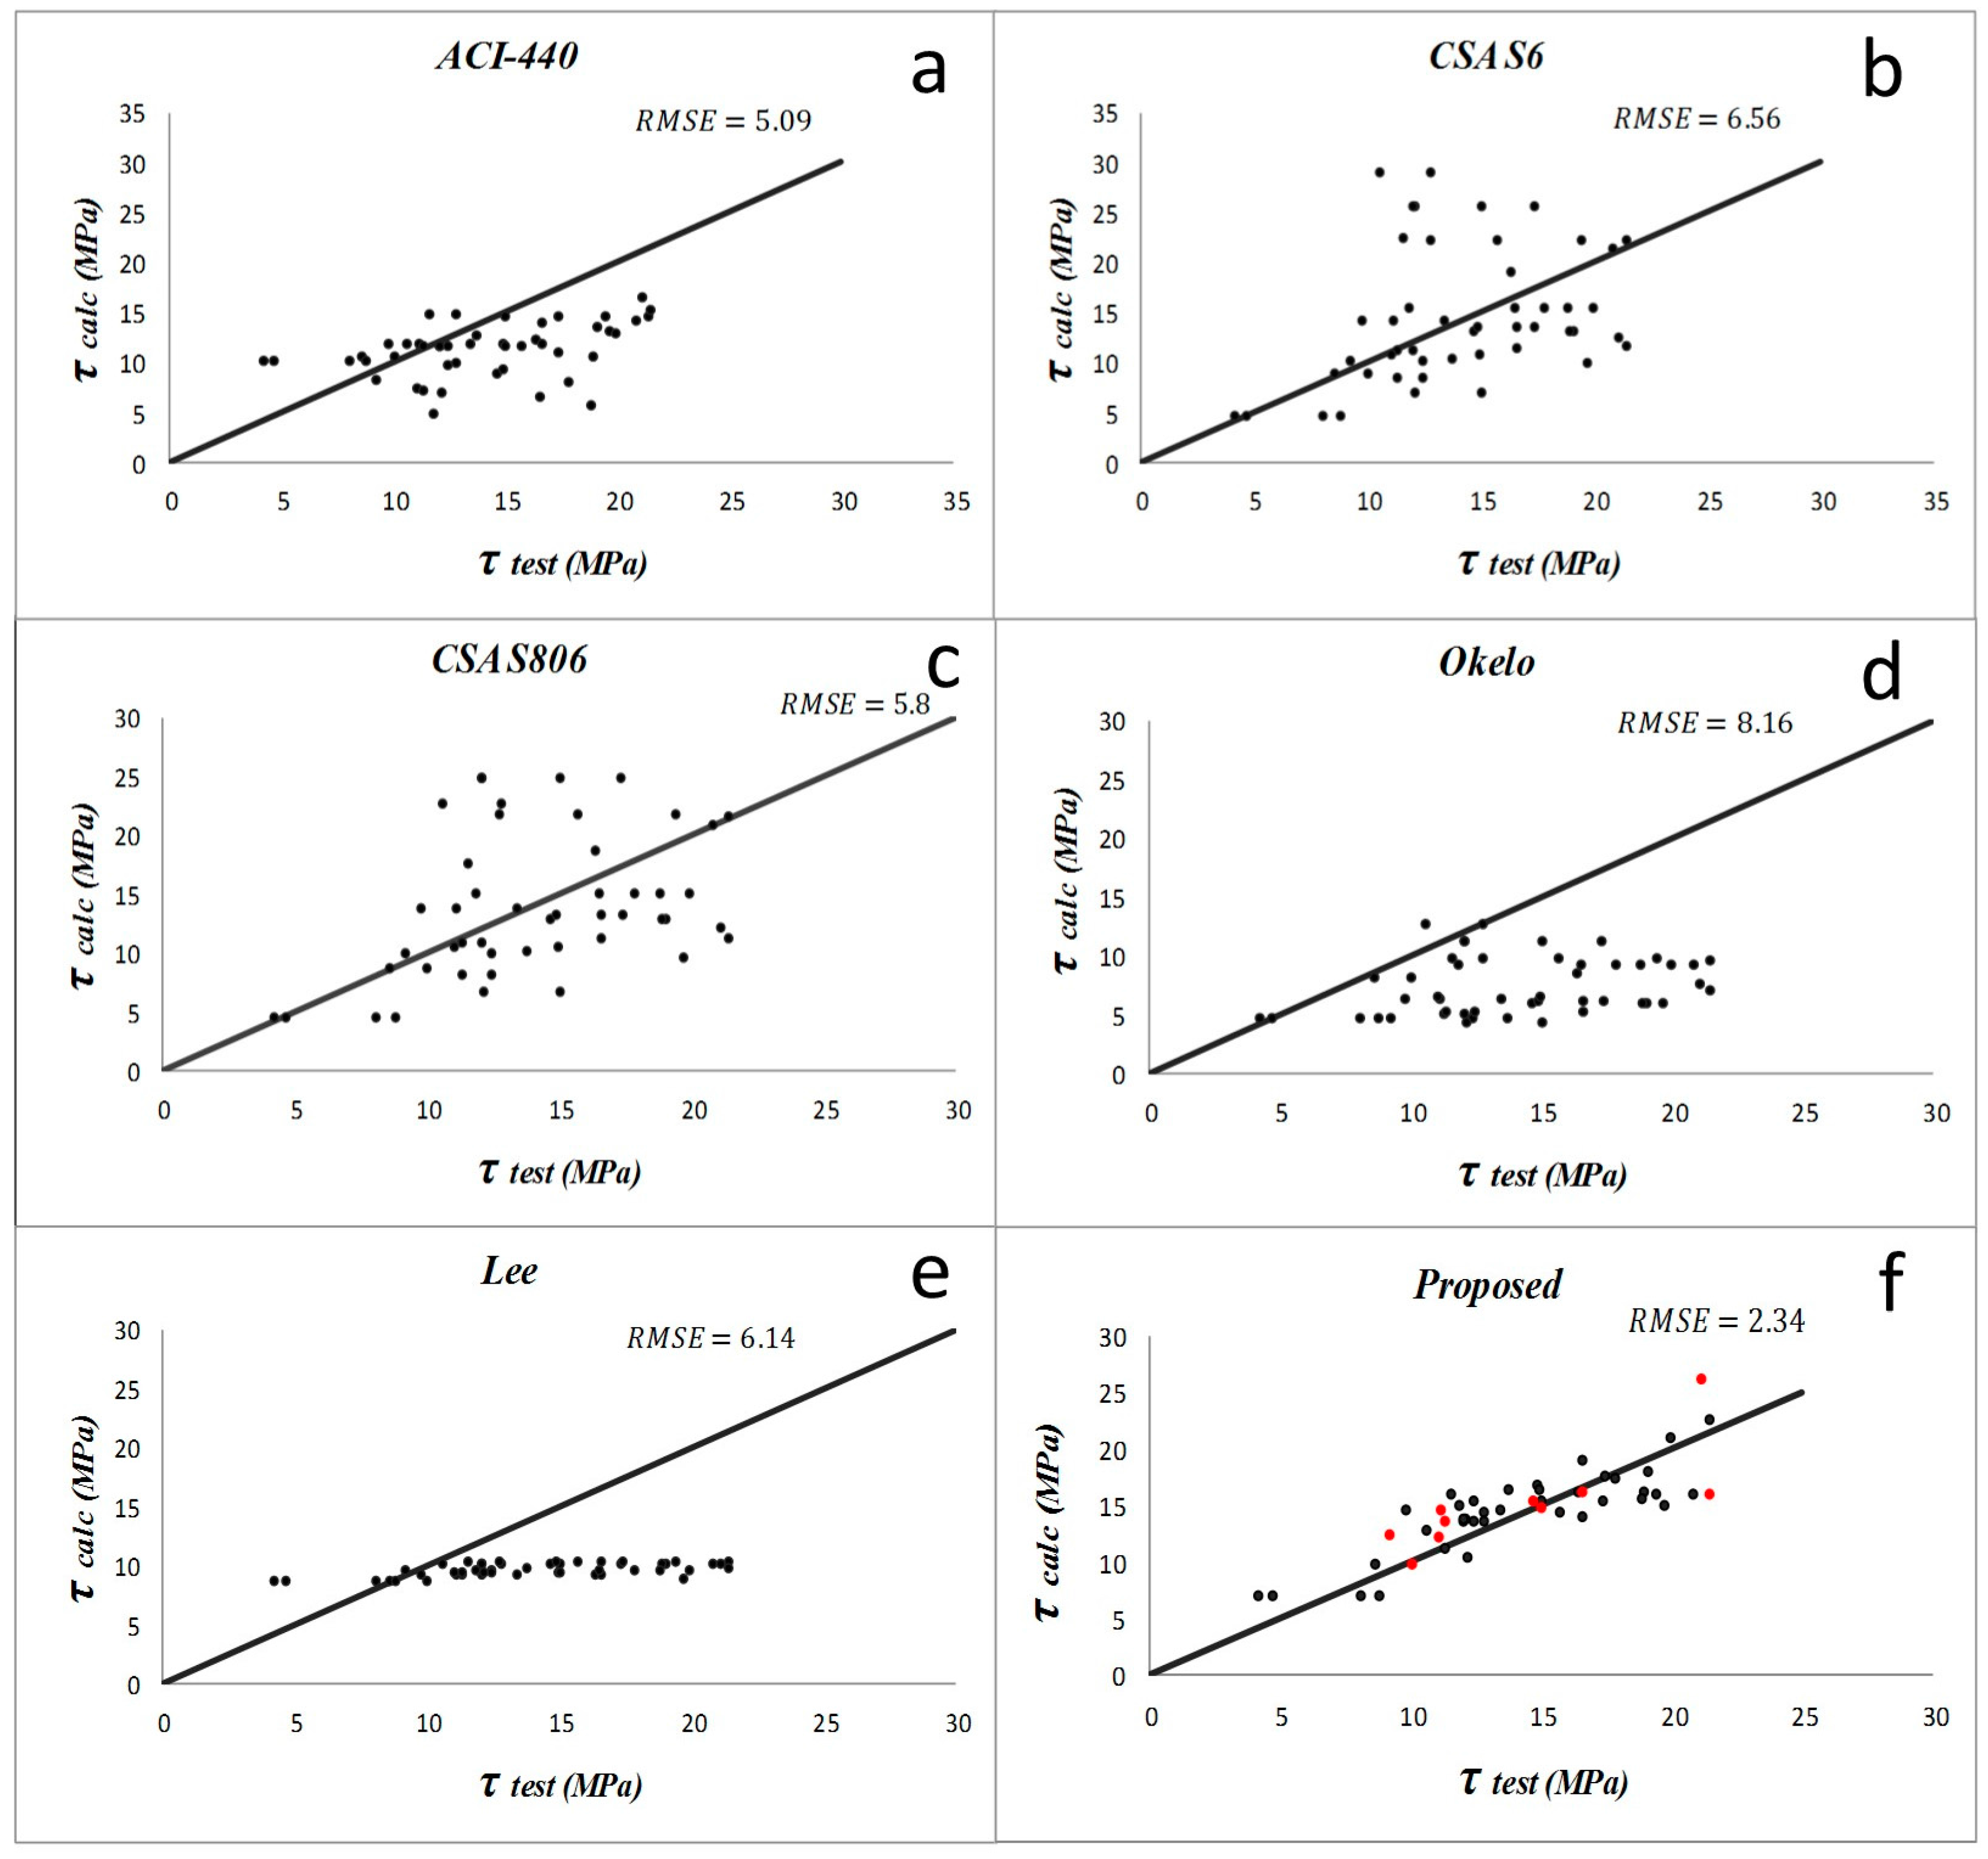
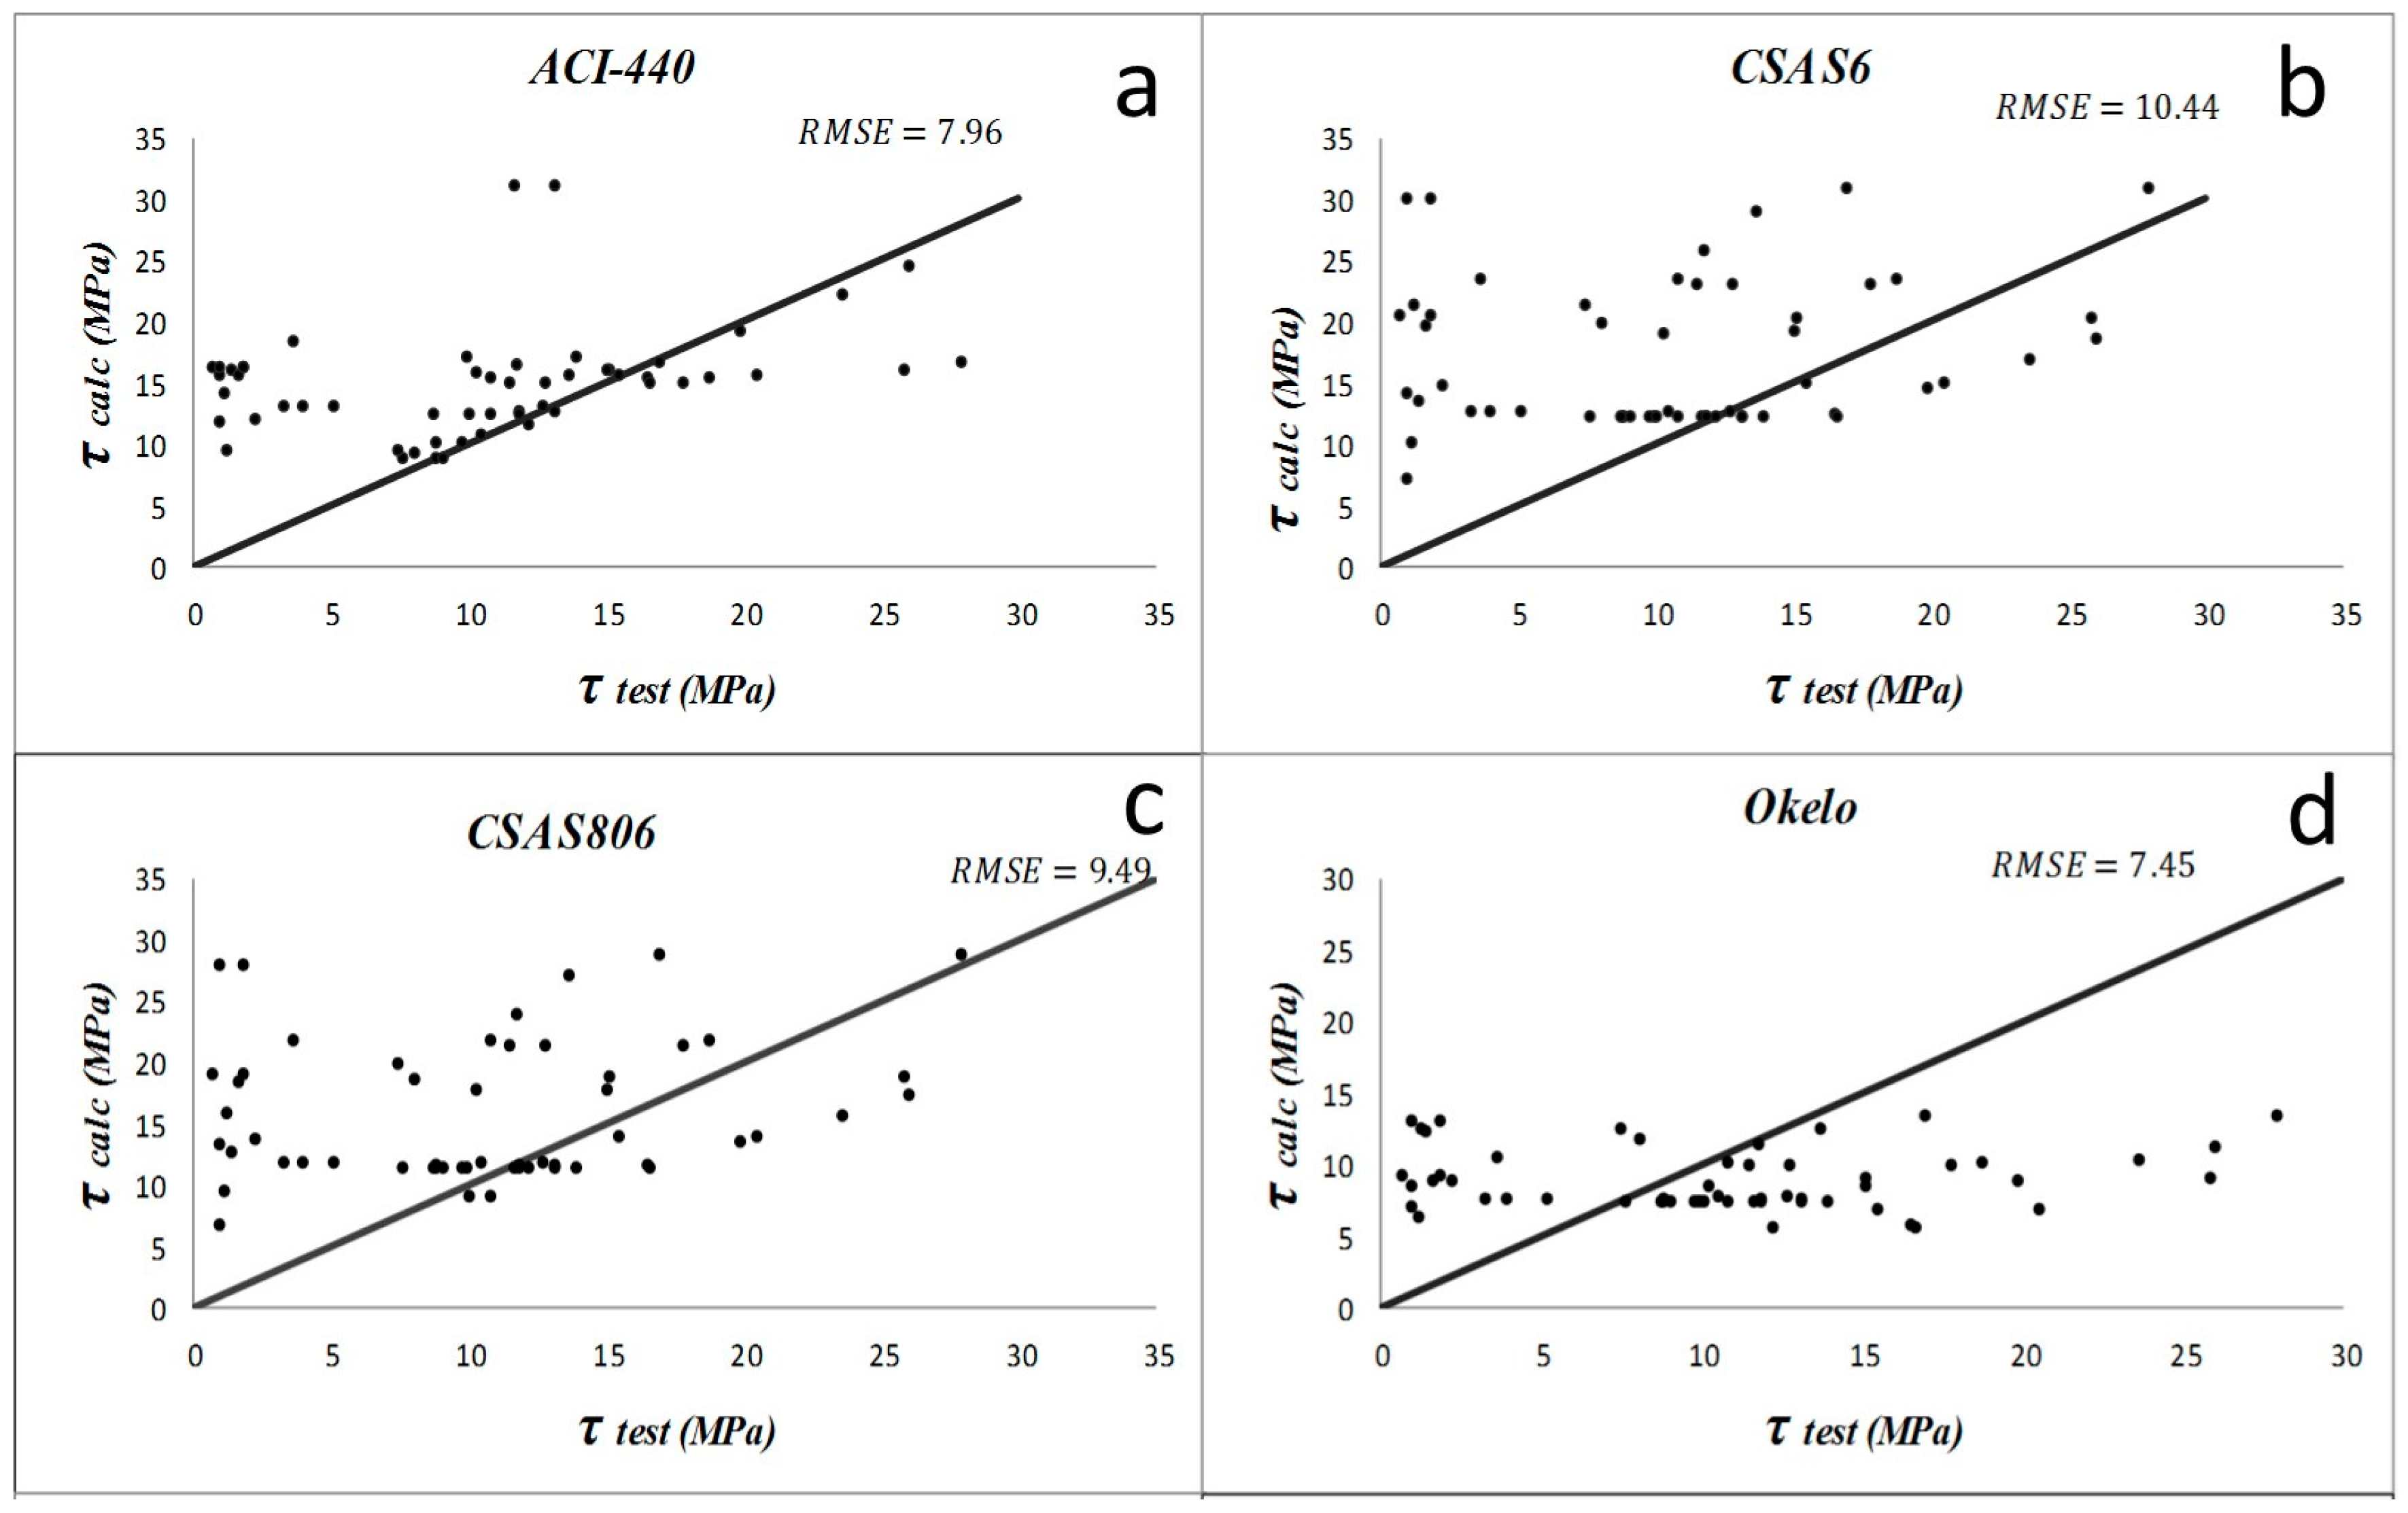
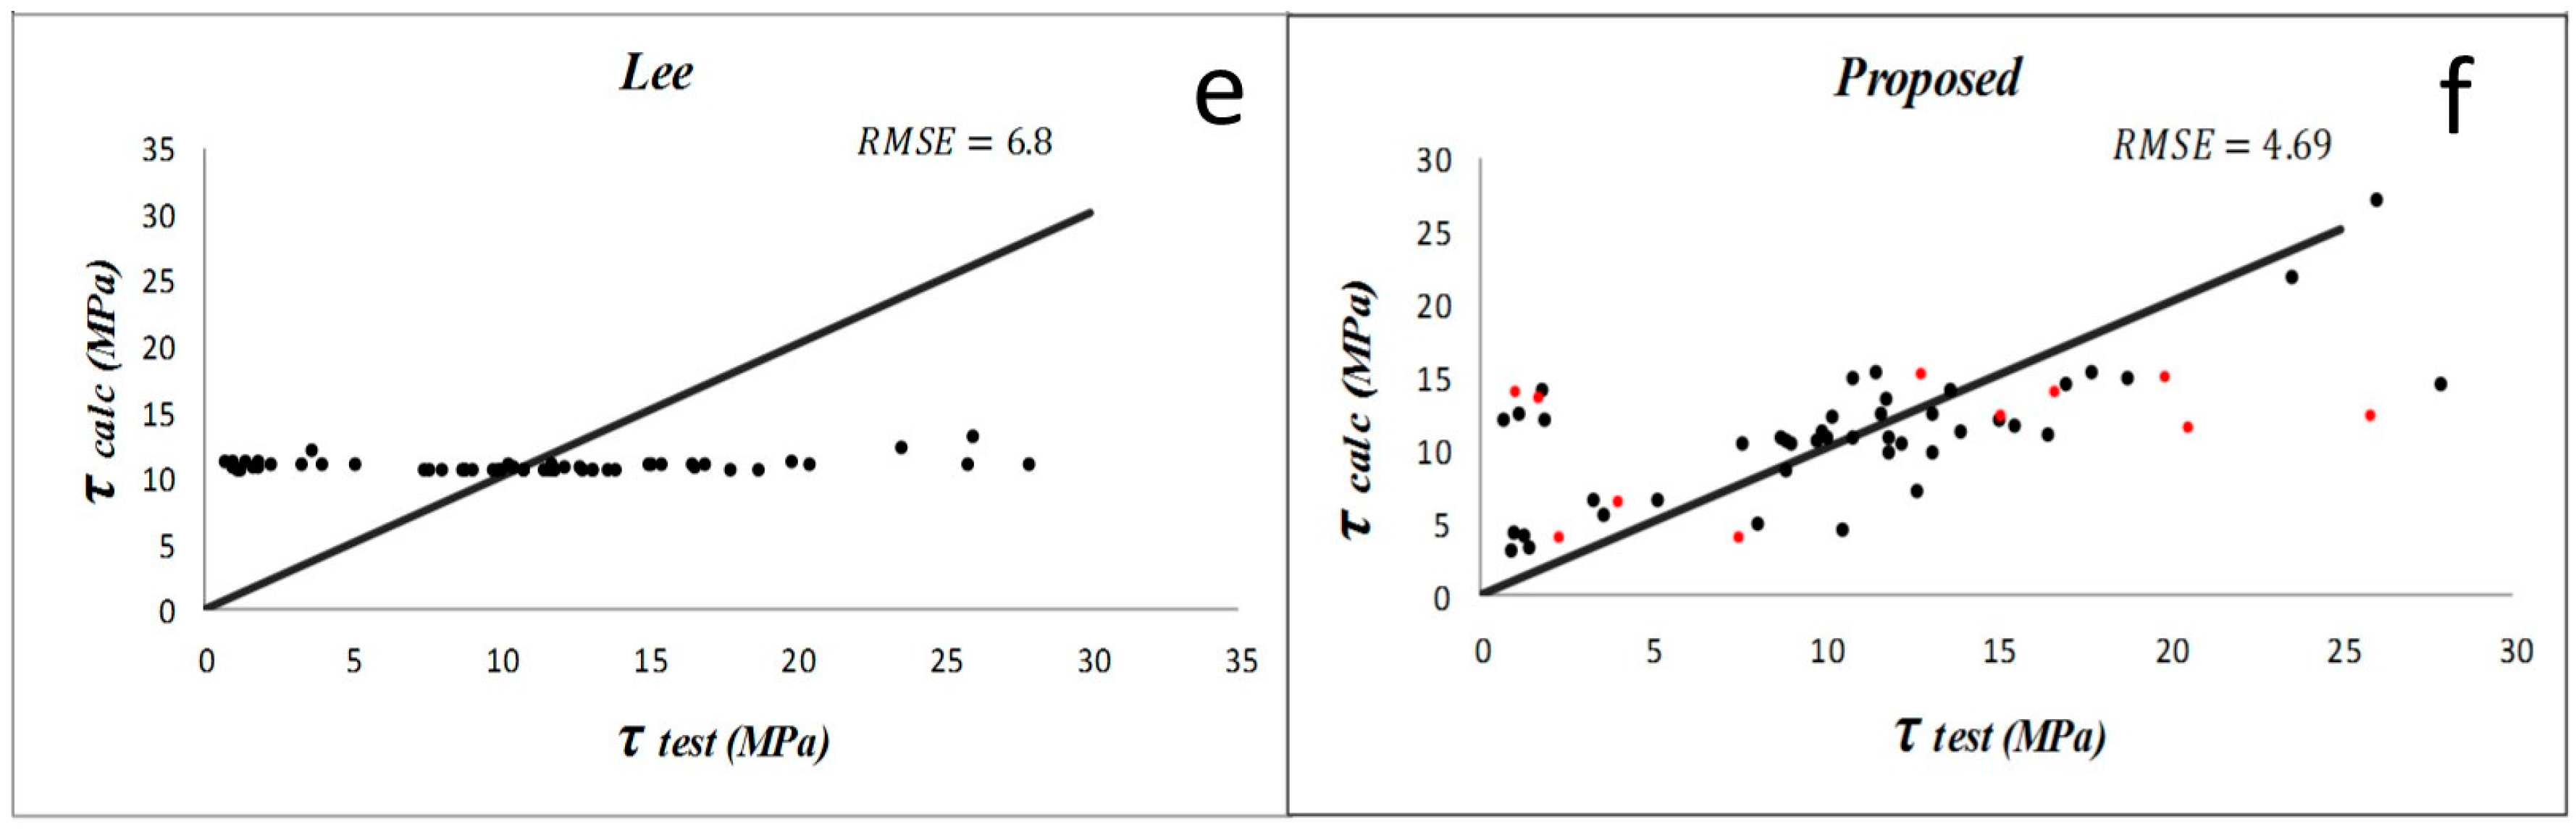
8. Results of the Bond Equations for Each Study Group
9. Conclusions
- According to the conducted factorial design, the square root of compressive strength of concrete (), rebar diameter (), the embedment length to bar diameter ratio (), and also the concrete cover to bar diameter ratio () have a good correlation with the bond capacity of FRP to concrete. It can also be concluded that the combined effects of compressive strength of concrete and the other three factors () could influence the bond behavior significantly. Hence, considering these nonlinear interaction terms, besides the main factors, significantly improved the accuracy of the bond strength predictions. The highest percent contribution among all these factors was found to be for ratio.
- Based on the comparative study among different bond equations for different groups of concrete specimens, all the statistical measures of the newly proposed equations showed superior performance. In particular, for the tests carried out with normal concrete, the COV of the new bond equations is 17% less than the average COV of previous models. Also, the average PF is very close to 1 and the R2 is ~0.6. Therefore, the proposed models seem to be more accurate to predict the bond strength.
- Since most of the previous models are not applicable to high strength concrete members, the presented improved bond equations can be further evaluated and compared to similar new models/new experimental data that will be developed in future.
Acknowledgments
Author Contributions
Conflicts of Interest
Abbreviations
| Concrete compressive strength | |
| Rebar diameter | |
| Embedment length to bar diameter ratio | |
| Concrete cover to bar diameter ratio | |
| Smallest of the distance from the closest concrete surface to the center of the bar being developed or two-thirds the center-to-center spacing of the bars being developed | |
| Bar location | |
| Concrete density | |
| Bar size | |
| Bar fiber | |
| Bar surface profile | |
| Number of tests | |
| Root square | |
| Bond strength | |
| Experimental bond strength | |
| Predicted bond strength | |
| α | Significance level |
| Standard deviation | |
| Root Mean Square Error | |
| Average absolute error |
References
- Lee, J.Y.; Kim, T.Y.; Kim, T.J.; Yi, C.K.; Park, J.S.; You, Y.C.; Park, Y.H. Interfacial bond strength of glass fiber reinforced polymer bars in high-strength concrete. Compos. Part B Eng. 2008, 39, 258–270. [Google Scholar] [CrossRef]
- Okelo, R.; Yuan, R.L. Bond strength of fiber reinforced polymer rebars in normal strength concrete. J. Compos. Constr. 2005, 9, 203–213. [Google Scholar] [CrossRef]
- Cosenza, E.; Manfredi, G.; Realfonzo, R. Behavior and modeling of bond of FRP rebars to concrete. J. Compos. Constr. 1997, 2, 40–51. [Google Scholar] [CrossRef]
- Hossain, K.M.A.; Ametrano, D.; Lachemi, M. Bond Strength of Standard and High-Modulus GFRP Bars in High-Strength Concrete. J. Mater. Civ. Eng. 2014, 26, 449–456. [Google Scholar] [CrossRef]
- Aiello, M.A.; Leone, M.; Pecce, M. Bond Performances of FRP Rebars-Reinforced Concrete. J. Mater. Civ. Eng. 2007, 19, 205–213. [Google Scholar] [CrossRef]
- Arias, J.P.M.; Vazquez, A.; Escobar, M.M. Use of sand coating to improve bonding between GFRP bars and concrete. J. Compos. Mater. 2012, 46, 2271–2278. [Google Scholar] [CrossRef]
- Achillides, Z.; Pilakoutas, K. Bond behavior of fiber reinforced polymer bars under direct pullout conditions. J. Compos. Constr. 2004, 8, 173–181. [Google Scholar] [CrossRef]
- Hao, Q.; Wang, Y.; He, Z.; Ou, J. Bond strength of glass fiber reinforced polymer ribbed rebars in normal strength concrete. Constr. Build. Mater. 2009, 23, 865–871. [Google Scholar] [CrossRef]
- Alunno Rossetti, V.; Galeota, D.; Giammatteo, M.M. Local bond stress-slip relationships of glass fibre reinforced plastic bars embedded in concrete. Mater. Struct. 1995, 28, 340–344. [Google Scholar] [CrossRef]
- Silva-Rodriguez, R.; Larralde, J. Bond and slip of FRP rebars in concrete. J. Mater. Civ. Eng. 1993, 5, 30–40. [Google Scholar]
- Chaallal, O.; Benmokrane, B. Pullout and bond of glass-fibre rods embedded in concrete and cement grout. Mater. Struct. 1993, 26, 167–175. [Google Scholar] [CrossRef]
- Benmokrane, B.; Zhang, B.; Laoubi, K.; Tighiouart, B.; Lord, I. Mechanical and bond properties of new generation of carbon fibre reinforced polymer reinforcing bars for concrete structures. Can. J. Civ. Eng. 2002, 29, 338–343. [Google Scholar] [CrossRef]
- Soong, W.H.; Raghavan, J.; Rizkalla, S.H. Fundamental mechanisms of bonding of glass fiber reinforced polymer reinforcement to concrete. Constr. Build. Mater. 2011, 25, 2813–2821. [Google Scholar] [CrossRef]
- Muñoz, M.B. Study of Bond Behaviour between FRP Reinforcement and Concrete. Ph.D. Thesis, Universitat de Girona, Girona, Spain, October 2010. [Google Scholar]
- Canadian Standards Association. Design and Construction of Building Components with Fibre-Reinforced Polymers; S806-12; Canadian Standards Association: Mississauga, ON, Canada, 2012. [Google Scholar]
- Canadian Standards Association. Canadian Highway Bridge Design Code (CHBDC); Canadian Standards Association: Rexdale, ON, Canada, 2006. [Google Scholar]
- Quayyum, S. Bond Behavior of Fibre Reinforced Polymer (FRP) Rebars in Concrete. Ph.D. Thesis, University of British Columbia, Kelowna, BC, Canada, June 2010. [Google Scholar]
- American Concrete Institute. Bond and Development of Straight Reinforcing Bars in Tension; ACI 408R-03; American Concrete Institute: Farmington Hills, MI, USA, 2003. [Google Scholar]
- American Concrete Institute. Guide for the Design and Construction of Structural Concrete Reinforced with FRP Bars; ACI 440.1R-06; American Concrete Institute: Farmington Hills, MI, USA, 2006. [Google Scholar]
- Canadian Standards Association. Design and Construction of Building Components with Fibre-Reinforced Polymers; CSA S806-02; Canadian Standards Association: Rexdale, ON, Canada, 2002. [Google Scholar]
- Canadian Standards Association. Canadian Highway Bridge Design Code; CAN/CSA S6-06; Canadian Standards Association International: Mississauga, ON, Canada, 2006. [Google Scholar]
- Shahnewaz, M.; Alam, M.S. Improved Shear Equations for Steel Fiber-Reinforced Concrete Deep and Slender Beams. ACI Struct. J. 2014, 111, 851–860. [Google Scholar] [CrossRef]
- Montgomery, D.C. Design and Analysis of Experiments; John Wiley & Sons: Hoboken, NJ, USA, 2008. [Google Scholar]

| Parameters | Sum of Squares | Contribution % | P Value |
|---|---|---|---|
| Main Effects | |||
| 5.53 | 9.6 | 0.049 | |
| db | 15.4 | 26.8 | 0.029 |
| le/db | 10.8 | 18.8 | 0.034 |
| 2-Way Interactions | |||
| × db | 22.7 | 39.6 | 0.024 |
| × le/db | 2.31 | 4.02 | 0.074 |
| db × le/db | 0.78 | 1.36 | 0.126 |
| Group Number | Concrete Compressive Strength | Rebar Surface | Bond Equation |
|---|---|---|---|
| 1 | Normal Concrete | Non-Sand-Coated | = −5.3014 + 1.76 − 21.058 + 1.914 − 159.614 + 14.209 − 0.0379 + 5.85 |
| 2 | Normal Concrete | Sand-Coated | = − 78.85 + 14.806 + 133.97 + 16.747 − 941.28 + 193.256 − 3.187 − 16.695 |
| 3 | High Strength Concrete | Non-Sand-Coated | =450.77 − 64.15 − 1371.33 + 11.237 − 2494.57 +321.312 − 1.25 + 205.133 |
| 4 | High Strength Concrete | Sand-Coated | = 13.013 − 1.515 + 427.715 + 11.88 − 1965.237 + 239.92 − 1.397 − 45.88 |
| Bond Equations | AAE (%) | RMSE | |||
|---|---|---|---|---|---|
| Avg. PF | Std. PF | COV (%) | |||
| Okelo and Yuan (2005) [2] | 1.35 | 0.83 | 61.47 | 119.96 | 6.20 |
| Lee et al. (2008) [1] | 1.04 | 0.60 | 57.54 | 193.10 | 5.73 |
| ACI 440-1R-06 [19] | 0.86 | 0.47 | 55.04 | 205.94 | 6.16 |
| CSA S806-02 [20] | 0.79 | 0.47 | 59.26 | 160.64 | 5.07 |
| CSA S6-06 [21] | 0.71 | 0.41 | 57.72 | 187.15 | 5.78 |
| Proposed bond equation | 0.97 | 0.40 | 41.37 | 59.48 | 3.84 |
| Bond Equations | AAE (%) | RMSE | |||
|---|---|---|---|---|---|
| Avg. PF | Std. PF | COV (%) | |||
| Okelo and Yuan (2005) [2] | 2.11 | 0.74 | 35.13 | 46.12 | 8.16 |
| Lee et al. (2008) [1] | 1.45 | 0.41 | 27.79 | 33.49 | 6.14 |
| ACI 440-1R-06 [19] | 1.35 | 0.54 | 39.98 | 29.94 | 5.09 |
| CSA S806-02 [20] | 1.17 | 0.45 | 37.98 | 32.66 | 5.80 |
| CSA S6-06 [21] | 1.14 | 0.45 | 39.09 | 35.76 | 6.56 |
| Proposed bond equation | 1.00 | 0.18 | 18.11 | 12.30 | 2.34 |
| Bond Equations | AAE (%) | RMSE | |||
|---|---|---|---|---|---|
| Avg. PF | Std. PF | COV (%) | |||
| Okelo and Yuan (2005) [2] | 1.29 | 0.84 | 64.45 | 168.32 | 7.45 |
| Lee et al. (2008) [1] | 1.00 | 0.62 | 62.13 | 182.26 | 6.80 |
| ACI 440-1R-06 [19] | 0.74 | 0.42 | 57.15 | 246.75 | 7.96 |
| CSA S806-02 [20] | 0.74 | 0.46 | 62.15 | 278.18 | 9.49 |
| CSA S6-06 [21] | 0.68 | 0.42 | 62.13 | 317.08 | 10.44 |
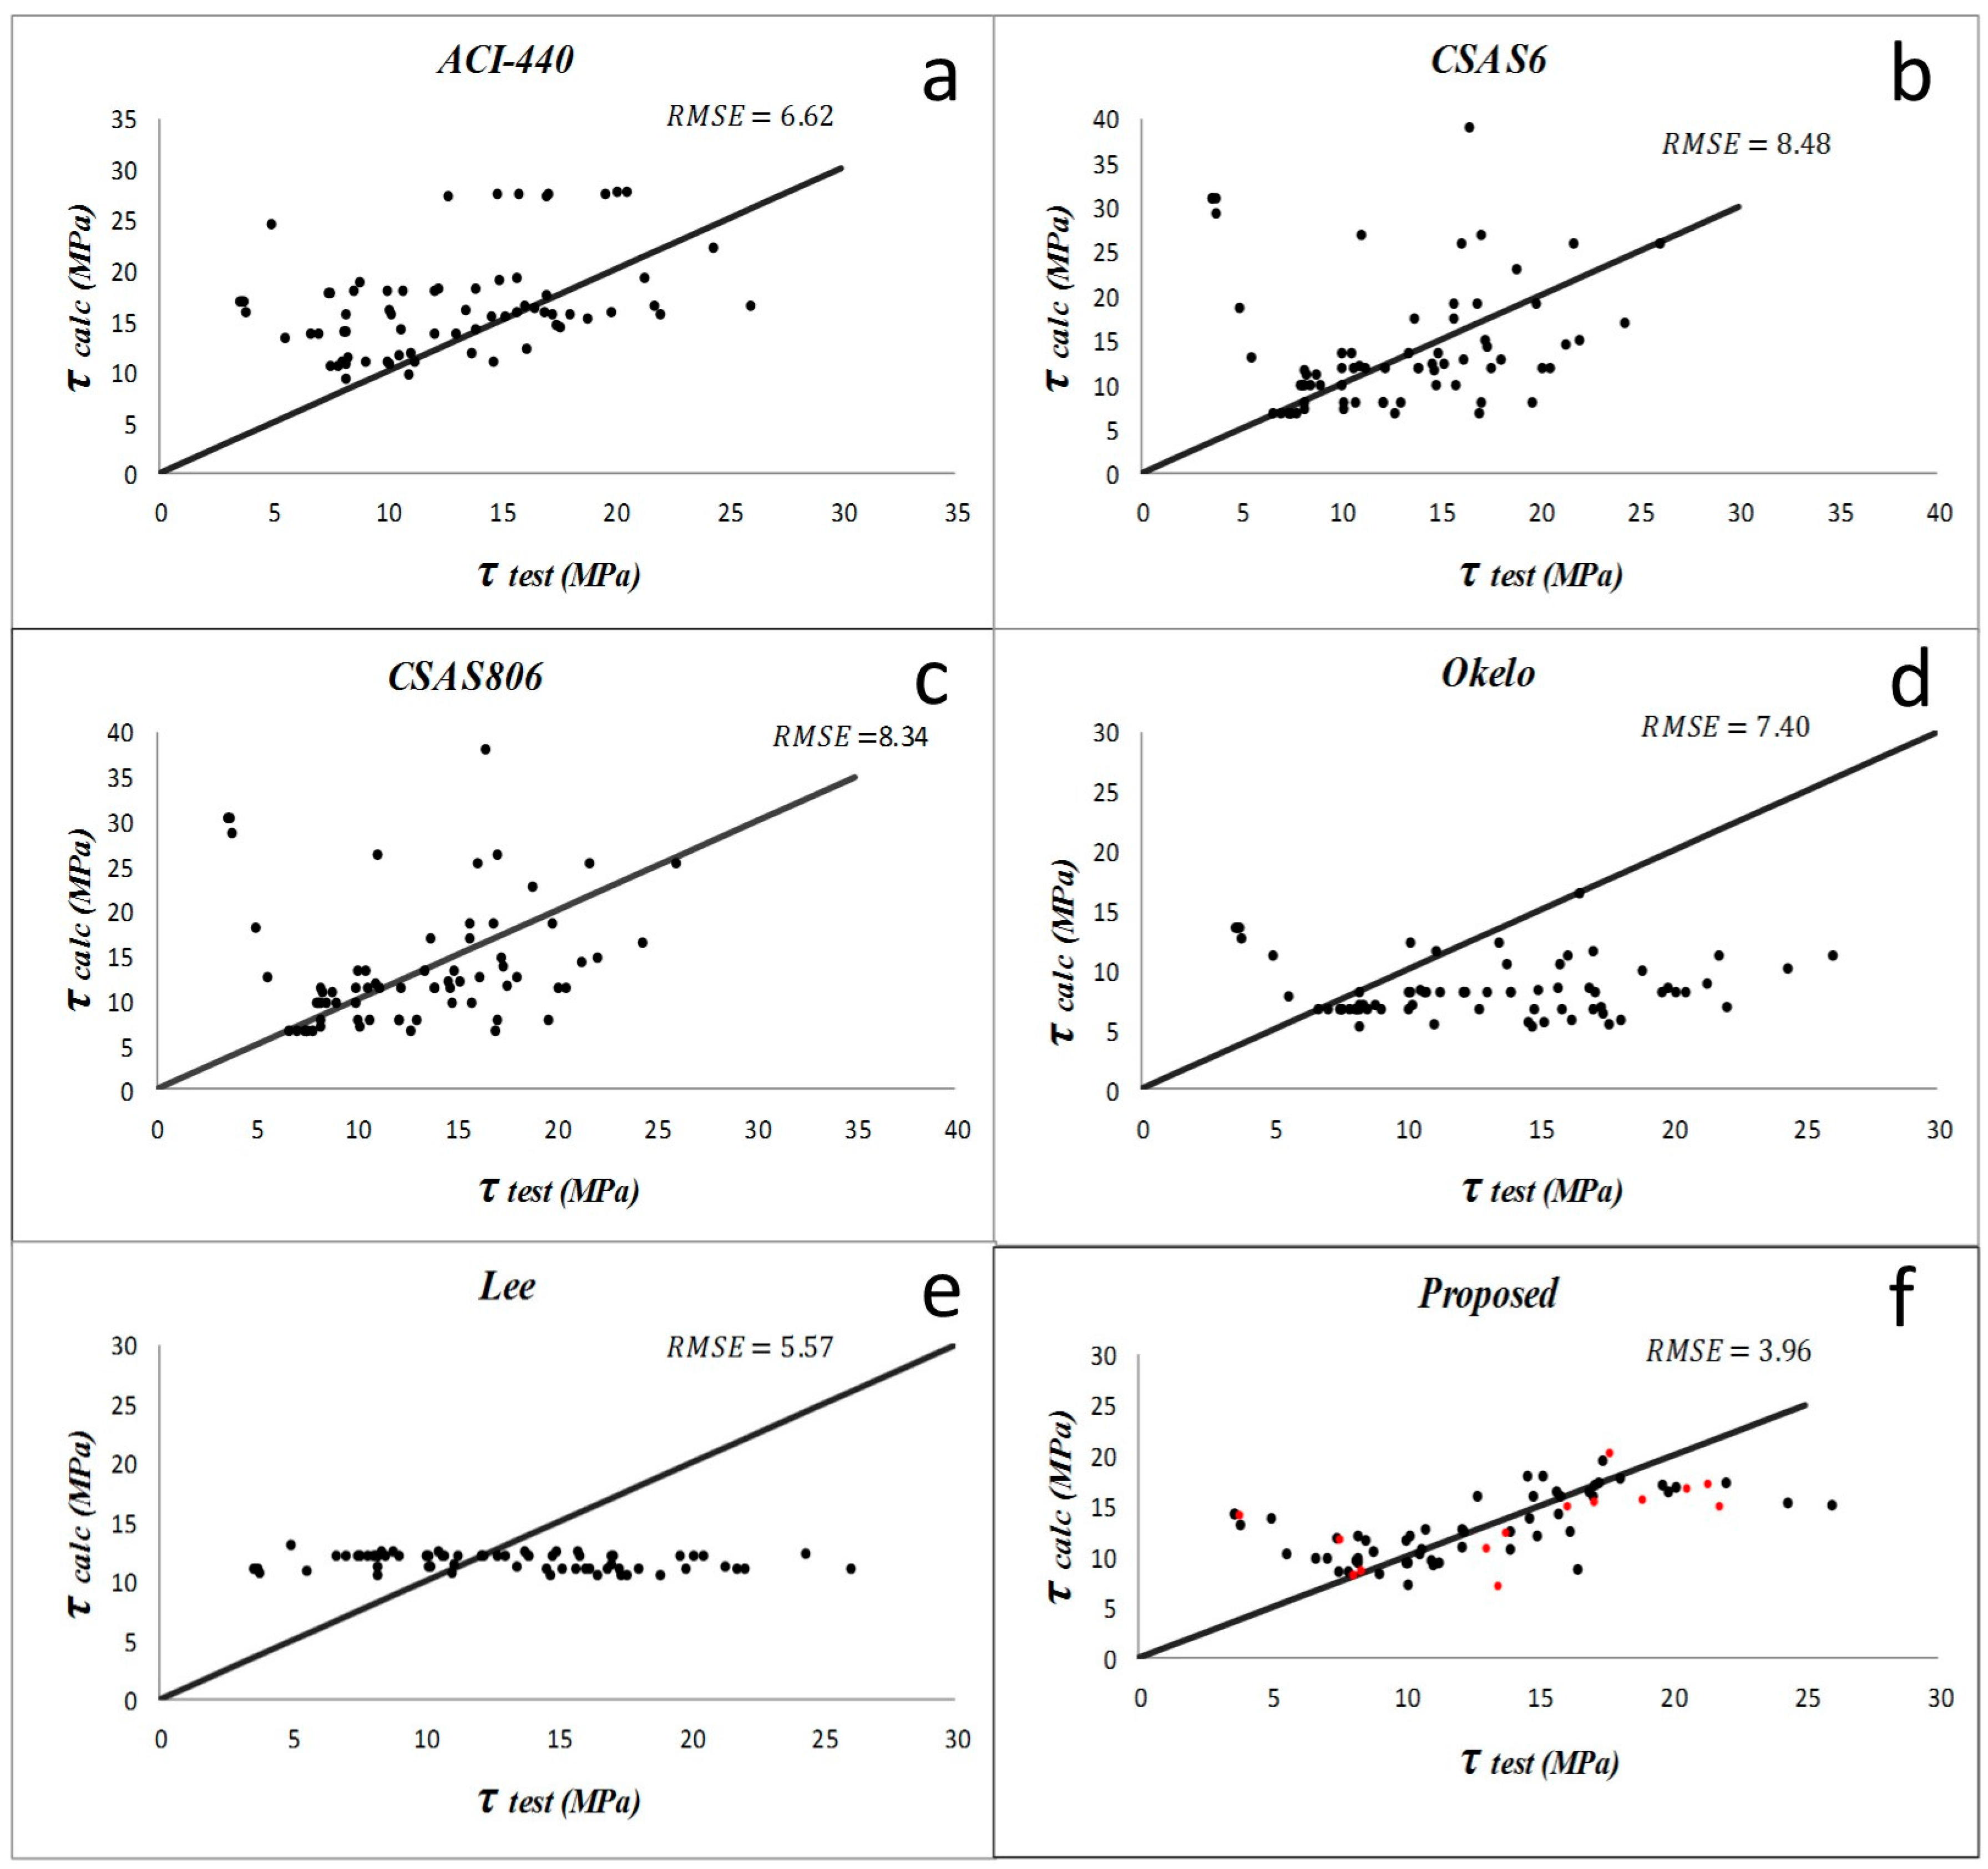
| Proposed bond equation | 0.97 | 0.5 | 51.23 | 118.20 | 4.69 |
| Bond Equations | AAE (%) | RMSE | |||
|---|---|---|---|---|---|
| Avg. PF | Std. PF | COV (%) | |||
| Okelo and Yuan (2005) [2] | 1.65 | 0.74 | 44.09 | 50.86 | 7.40 |
| Lee et al. (2008) [1] | 1.13 | 0.48 | 42.71 | 42.81 | 5.57 |
| ACI 440-1R-06 [19] | 0.82 | 0.32 | 38.45 | 60.08 | 6.62 |
| CSA S806-02 [20] | 1.13 | 0.51 | 45.21 | 69.60 | 8.34 |
| CSA S6-06 [21] | 1.11 | 0.50 | 45.21 | 70.79 | 8.48 |
| Proposed bond equation | 1.00 | 0.32 | 31.71 | 27.04 | 3.96 |
© 2016 by the authors; licensee MDPI, Basel, Switzerland. This article is an open access article distributed under the terms and conditions of the Creative Commons Attribution (CC-BY) license (http://creativecommons.org/licenses/by/4.0/).
Share and Cite
Pour, S.M.; Alam, M.S.; Milani, A.S. Improved Bond Equations for Fiber-Reinforced Polymer Bars in Concrete. Materials 2016, 9, 737. https://doi.org/10.3390/ma9090737
Pour SM, Alam MS, Milani AS. Improved Bond Equations for Fiber-Reinforced Polymer Bars in Concrete. Materials. 2016; 9(9):737. https://doi.org/10.3390/ma9090737
Chicago/Turabian StylePour, Sadaf Moallemi, M. Shahria Alam, and Abbas S. Milani. 2016. "Improved Bond Equations for Fiber-Reinforced Polymer Bars in Concrete" Materials 9, no. 9: 737. https://doi.org/10.3390/ma9090737