Article

Optimization of Supercritical Fluid Extraction of Total Alkaloids, Peimisine, Peimine and Peiminine from the Bulb of Fritillaria thunbergii Miq, and Evaluation of Antioxidant Activities of the Extracts

Ningbo Institute of Technology, Zhejiang University, Ningbo 315100, China
*
Author to whom correspondence should be addressed.
Materials 2016, 9(7), 524; https://doi.org/10.3390/ma9070524
Submission received: 31 March 2016 / Revised: 23 June 2016 / Accepted: 24 June 2016 / Published: 29 June 2016
(This article belongs to the Special Issue Optimisation and Scale-Up of Supercritical Fluid Extraction Processes)

Abstract

:
Supercritical fluid extraction (SFE) was used to extract total alkaloids, peimisine, peimine and peiminine from the bulb of Fritillaria thunbergii Miq. The antioxidant capacity of the extracts was evaluated by DPPH radical scavenging activity (DPPH-RSA), ABTS radical scavenging activity (ABTS-RSA) and ferric reducing capacity (FRAP) assay. A central composite design (CCD) with four variables and five levels was employed for optimization of process parameters, and response surface plots were constructed in accordance with a second order polynomial model. Under optimal conditions of 3.0 h, 60.4 °C, 26.5 MPa and 89.3% ethanol, the highest yields were predicted to be 3.8 mg/g for total alkaloids, 0.5 mg/g for peimisine, 1.3 mg/g for peimine and 1.3 mg/g for peiminine, and the antioxidant capacity of extracts displayed EC50, DPPH value of 5.5 mg/mL, EC50, ABTS value of 0.3 mg/mL and FRAP value of 118.2 mg ascorbic acid equivalent (AAE)/100 g.

1. Introduction

Fritillaria is a genus of 130–165 species [1,2] within the monocot family Liliaceae, and is native to temperate regions of the Northern Hemisphere [3]. The bulbs of Fritillaria species growing in China have been used as antitussive and expectorant herbs in Traditional Chinese Medicine (TCM) for more than 200 years, Fritillaria thunbergii Miq. (Chinese name Zhe Beimu) being the first one from genus Fritillaria [4]. Alkaloids, as the main active ingredients, contribute to the antitussive and expectorant function and they are usually extracted by classical solvent extraction [5,6]. According to Chinese Pharmacopeia (2010 edition), the content of peimine and peiminine in the bulb of F. Thunbergii extracted by the CHCl3/CH3OH = 4:1 and analyzed by HPLC must be higher than 0.1% for medical use (chemical structure of peimisine, peimine, and peiminine see Figure 1) [7]. However, solvent extraction is time-consuming and also causes some damages to the environment and health.
Supercritical carbon dioxide (SC-CO2) extraction is of great interest as a cost effective and environmentally friendly method for extracting useful components [8]. Supercritical fluid extraction (SFE) possesses several advantages such as good selectivity, environmental safety, less or no use of organic solvents, and higher speed [9]. Regarding the extraction of alkaloids, SC-CO2 has received considerable attention [10,11,12]. However, the SFE of alkaloids from the bulb of F. Thunbergii has not been disclosed in the literature so far. As known, one drawback of SC-CO2 is the non-polar nature of this solvent, but this problem can be resolved by the addition of a co-solvent such as ethanol, which is also classified as a natural or bio-derived solvent [13]. In addition, one of the main aspects under careful consideration in SFE is the extraction efficiency. The optimization of various variables influencing the SFE extractions could significantly enhance the recovery or extraction yield of a target compound [14]. A central composite design (CCD) based on response surface methodology (RSM) is an effective mathematical and statistical tool for performing, improving and optimizing the independent factors that influence response in a given set of experiments. It defines not only the effect of independent variables, but also their interaction effects [15].
The role of antioxidants in the maintenance of health and prevention of disorders and diseases has received much attention. Above all, the action and effects of natural antioxidants contained in foods have been the subjects of extensive studies [16,17,18]. The activity of antioxidants is usually measured by DPPH-RSA, ABTS-RSA, FRAP assay and CUPRAC (cupric reducing antioxidant capacity) assay [19,20,21]. Since the antioxidant activity of F. thunbergii bulbs has not been critically evaluated, its antioxidant activity was measured using three different methods (DPPH-RSA, ABTS-RSA and FRAP assays) to ascertain their potential as functional foods and functional ingredients in this paper.
In this study, different combinations of extraction time, temperature, pressure, and ethanol concentration as modifier were developed to an optimal SFE of alkaloids from the bulb of F. thunbergii, to evaluate the antioxidant activity of the total extract.

2. Results

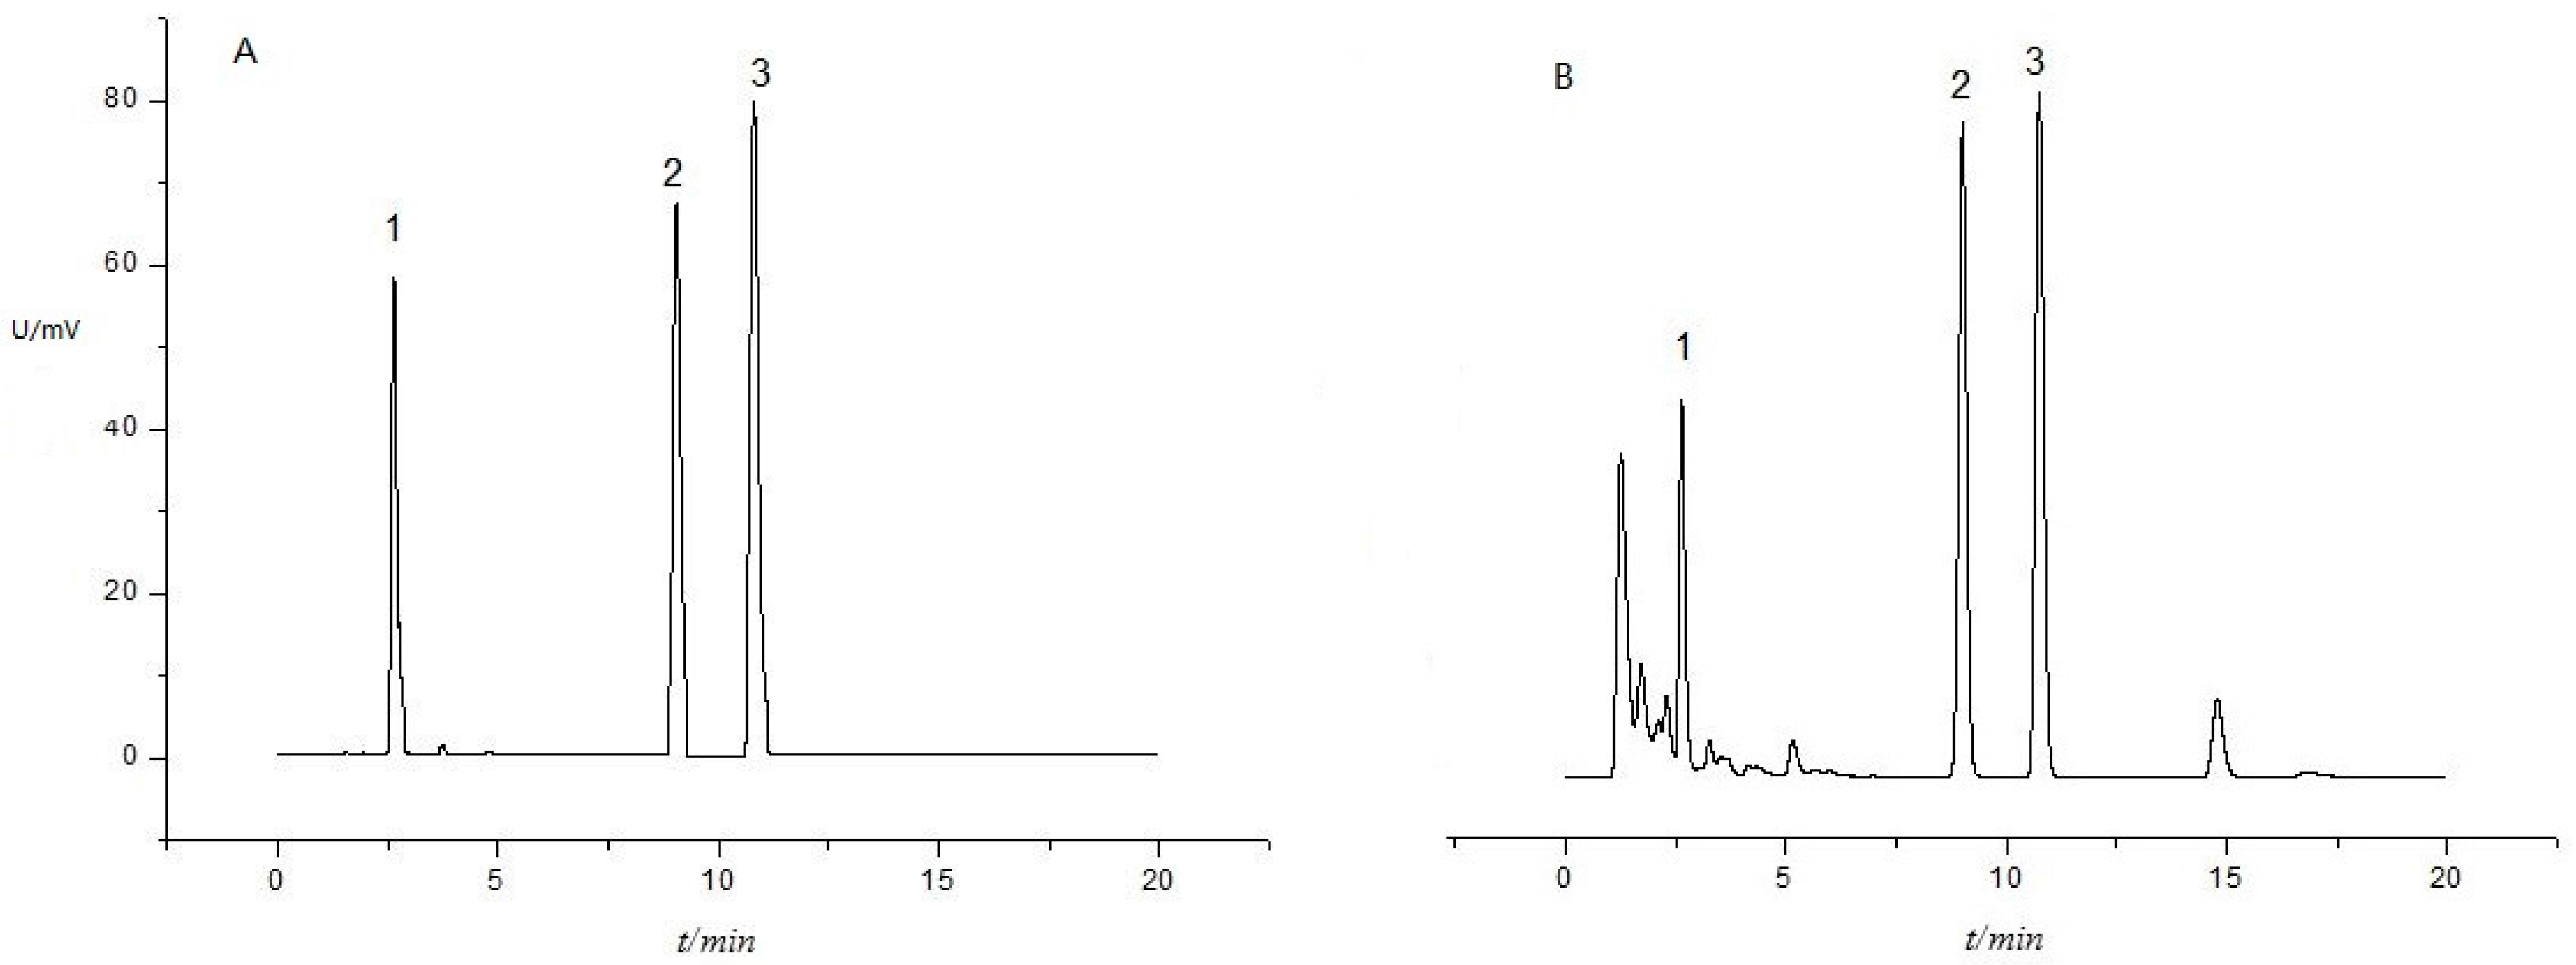
2.1. UPLC Chromatogram

Typical UPLC chromatogram of SFE extract of F. thunbergii bulb purified by solid-phase extraction column is shown in Figure 2B. Based on the available standards of peimisine, peimine and peiminine, it was possible to identify the peaks with retention times of 2.6, 9.1 and 10.8 min, respectively.

2.2. Optimization Strategy

Since various factors could potentially affect the extraction process, optimization of experimental conditions represented a critical step in the development of a SFE method. The effects of four independent process variables including extraction time (X1: 1.5–3.5 h), temperature (X2: 45–65 °C), pressure (X3: 10–30 MPa) and co-solvent concentration (X4: ethanol-water ratio, 80%–100%) were investigated during SFE of F. Thunbergii bulb. The four dependent responses of interest were related to total alkaloids, peimisine, peimine and peiminine yields. The experimental design and corresponding response data are presented in Table 1. As shown, the yields of total alkaloids, peimisine, peimine and peiminine varied from 1.8 to 3.7 mg/g, 0.04 to 0.5 mg/g, 0.3 to 1.2 mg/g and 0.2 to 1.2 mg/g, respectively, indicating that the extraction yields were highly influenced by extraction condition and that optimization was essential.
The mathematical model describing the extraction yield of total alkaloids (Y1, mg/g), peimisine (Y2, mg/g), peimine (Y3, mg/g) and peiminine (Y4, mg/g) as functions of the coded independent variables in the selected ranges was given by the following second-order polynomial equations, respectively.
Y 1 ( mg / g ) = 3.47 + 0.33 X 1 + 0.12 X 2 + 0.28 X 3 + 0.43 X 4 0.18 X 1 2 0.56 X 2 2 0.14 X 3 2 0.44 X 4 2 + 0.000625 X 1 X 2 0.037 X 1 X 3 0.066 X 1 X 4 + 0.019 X 2 X 3 + 0.023 X 2 X 4 0.049 X 3 X 4
Y 2 ( mg / g ) = 0.42 + 0.01 X 1 + 0.0081 X 2 + 0.053 X 3 0.098 X 4 0.0086 X 1 2 0.0035 X 2 2 0.011 X 3 2 0.047 X 4 2 + 0.0005625 X 1 X 2 + 0.002063 X 1 X 3 + 0.000437 X 1 X 4 + 0.00218 X 2 X 3 + 0.006438 X 2 X 4 + 0.014 X 3 X 4
  Y 3 ( mg / g ) = 1.17 + 0.078 X 1 + 0.037 X 2 + 0.075 X 3 0.049 X 4 0.0040 X 1 2 0.015 X 2 2 0.041 X 3 2 0.18 X 4 2 0.006125 X 1 X 2 + 0.008 X 1 X 3 + 0.0045 X 1 X 4 0.009625 X 2 X 3 + 0.017 X 2 X 4 + 0.054 X 3 X 4
Y 4 ( mg / g ) = 0.1.18 + 0.066 X 1 + 0.056 X 2 + 0.069 X 3 + 0.025 X 4 0.045 X 1 2 0.005 X 2 2 0.05 X 3 2 0.24 X 4 2 + 0.024 X 1 X 2 + 0.019 X 1 X 3 + 0.026 X 1 X 4 + 0.039 X 2 X 3 0.011 X 2 X 4 + 0.051 X 3 X 4
where X1, X2, X3 and X4 are the coded variables, i.e., extraction time, temperature, pressure and ethanol concentration, respectively.
The reliability of the generated model was evaluated by analysis of variance (ANOVA) and a statistical summary was given in Table 2. p value was a measure of the statistical significance, and R2 represented the proportion of the total variability that had been explained by the mathematical mode [22]. All regression showed that the p values were less than the significance level of 0.05, validating adequacy of these models. When p value was less than 0.05, the factor had significant impact on the response. Values of R2 were 0.97 for total alkaloids, 0.99 for peimisine, 0.99 for peimine and 0.98 for peiminine, which illustrated that the models were able to explain variability of 99% in new data for peimisine and peimine combination, and 97% for total alkaloids and peiminine combination. The values of the adjusted determination coefficient were R2 = 0.95 for total alkaloids, 0.99 for peimisine, 0.99 for peimine, and 0.96 for peiminine.

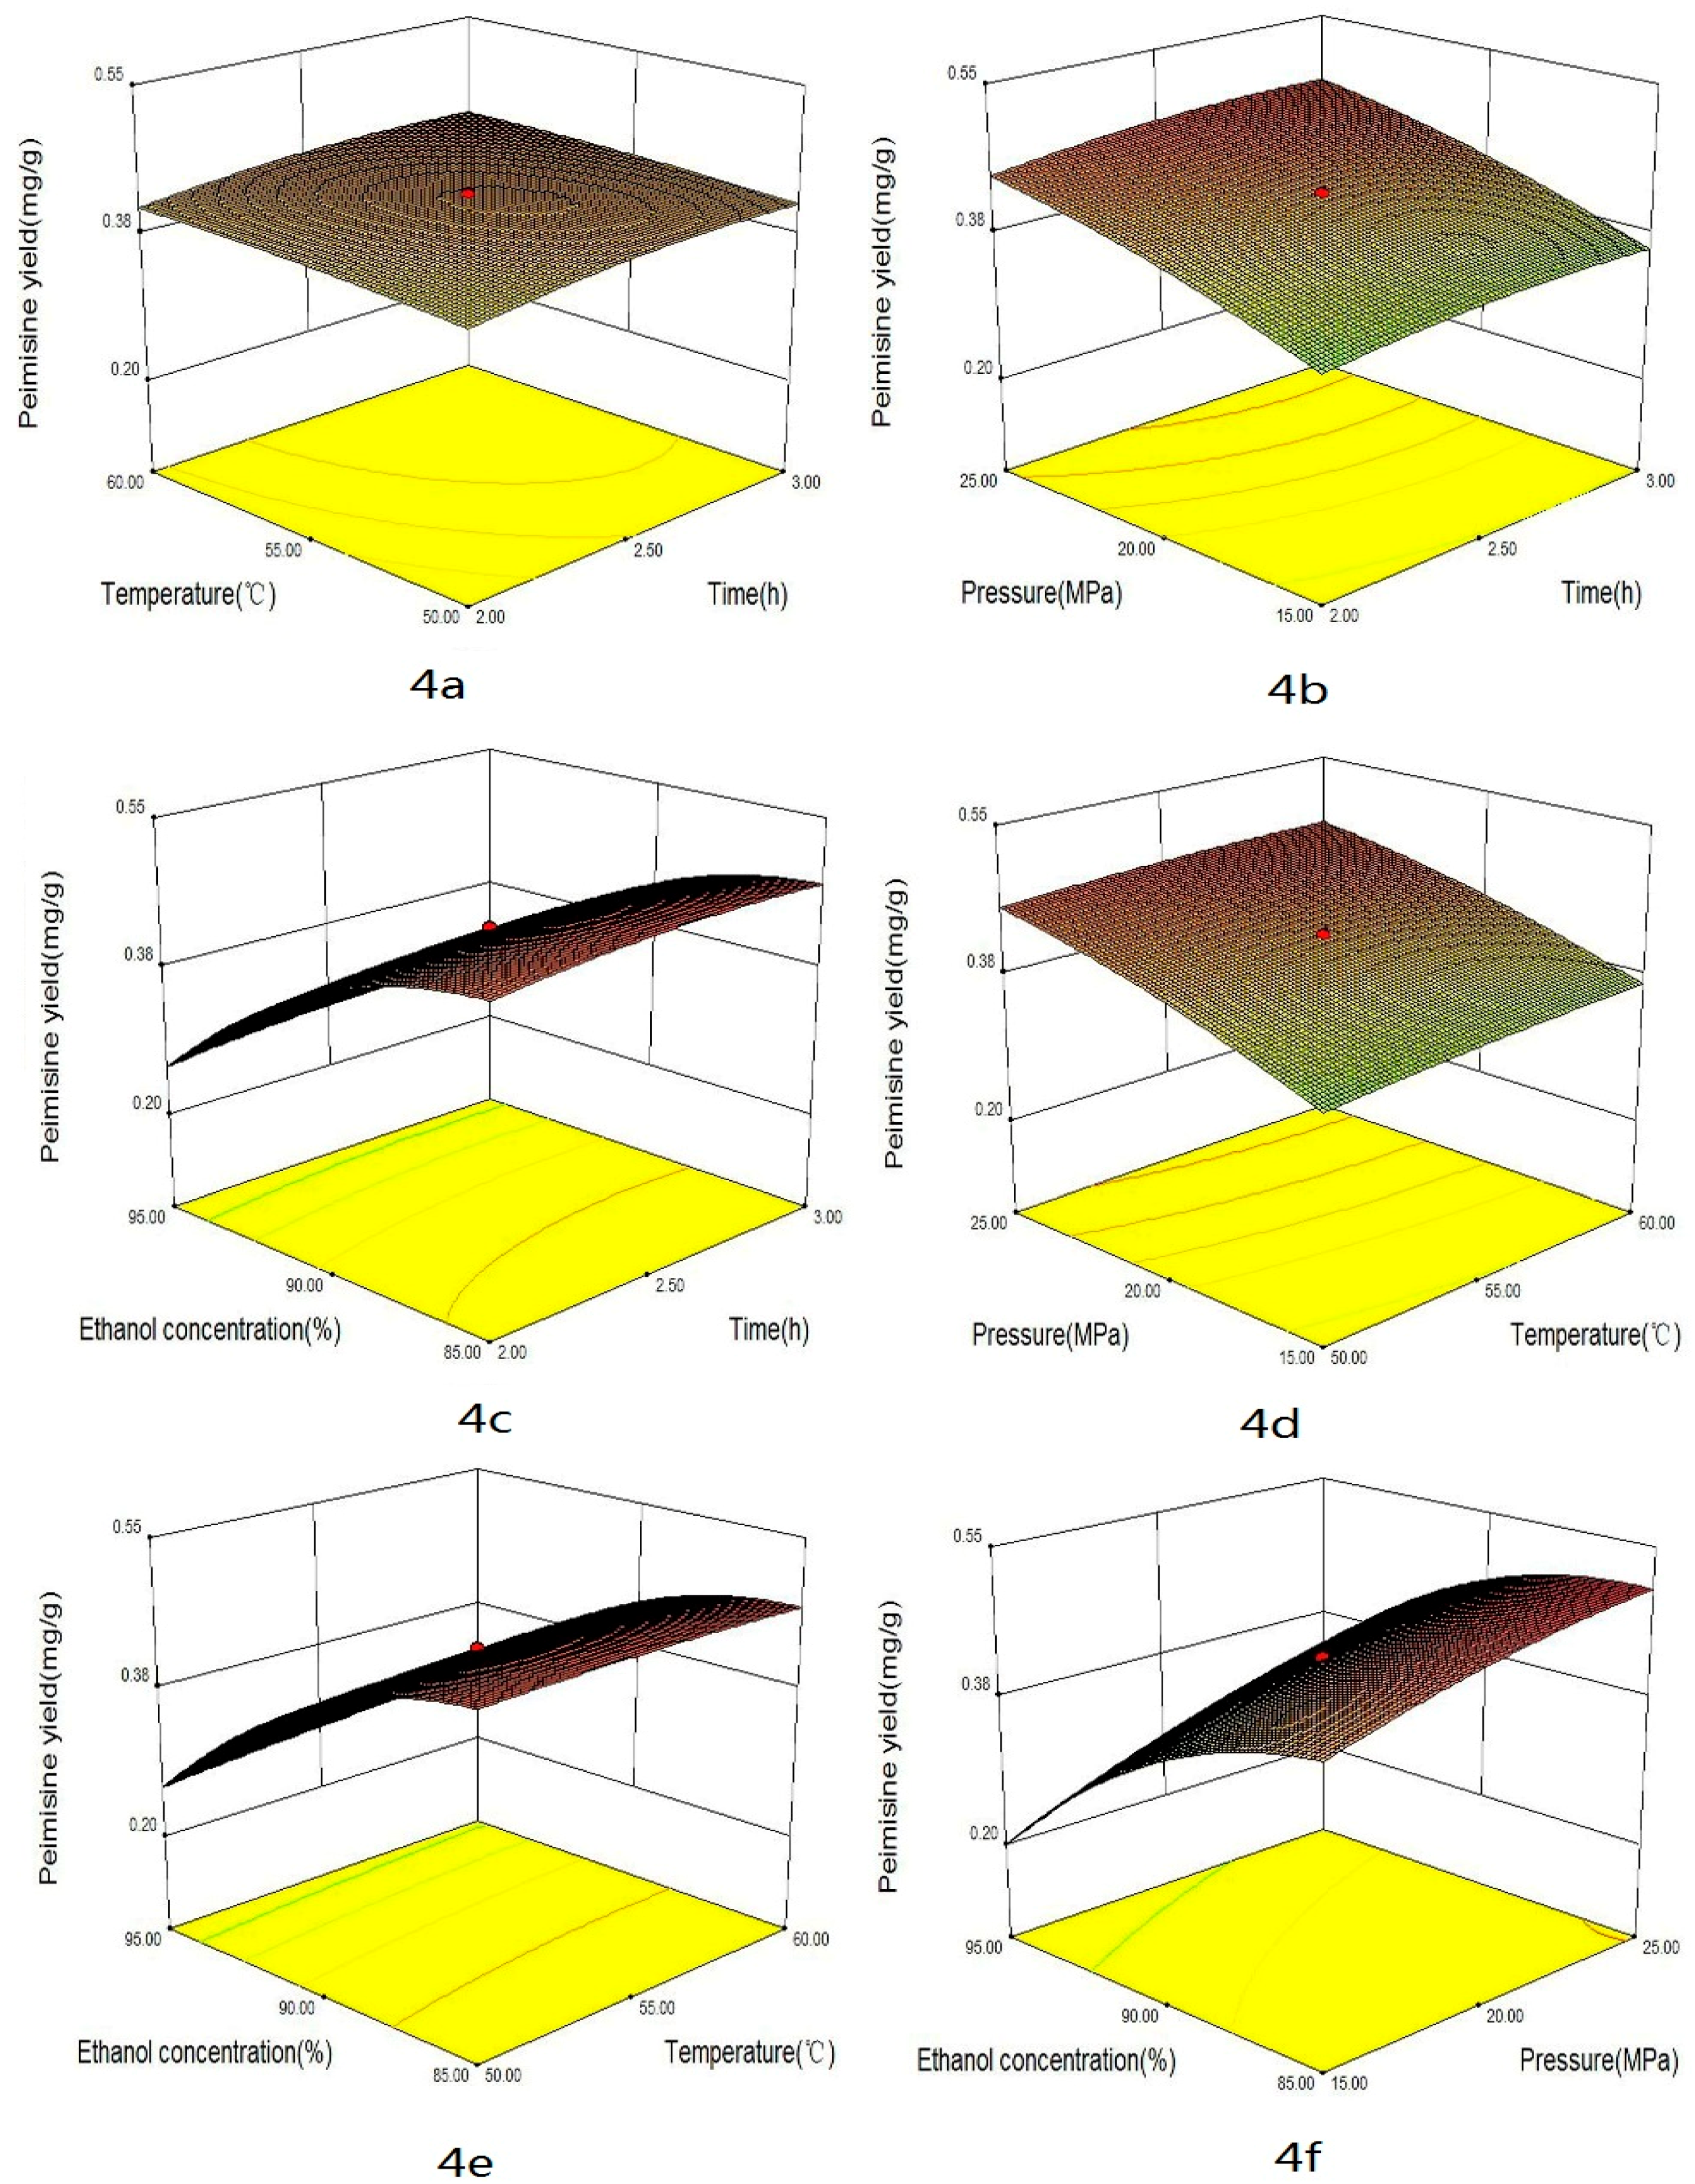
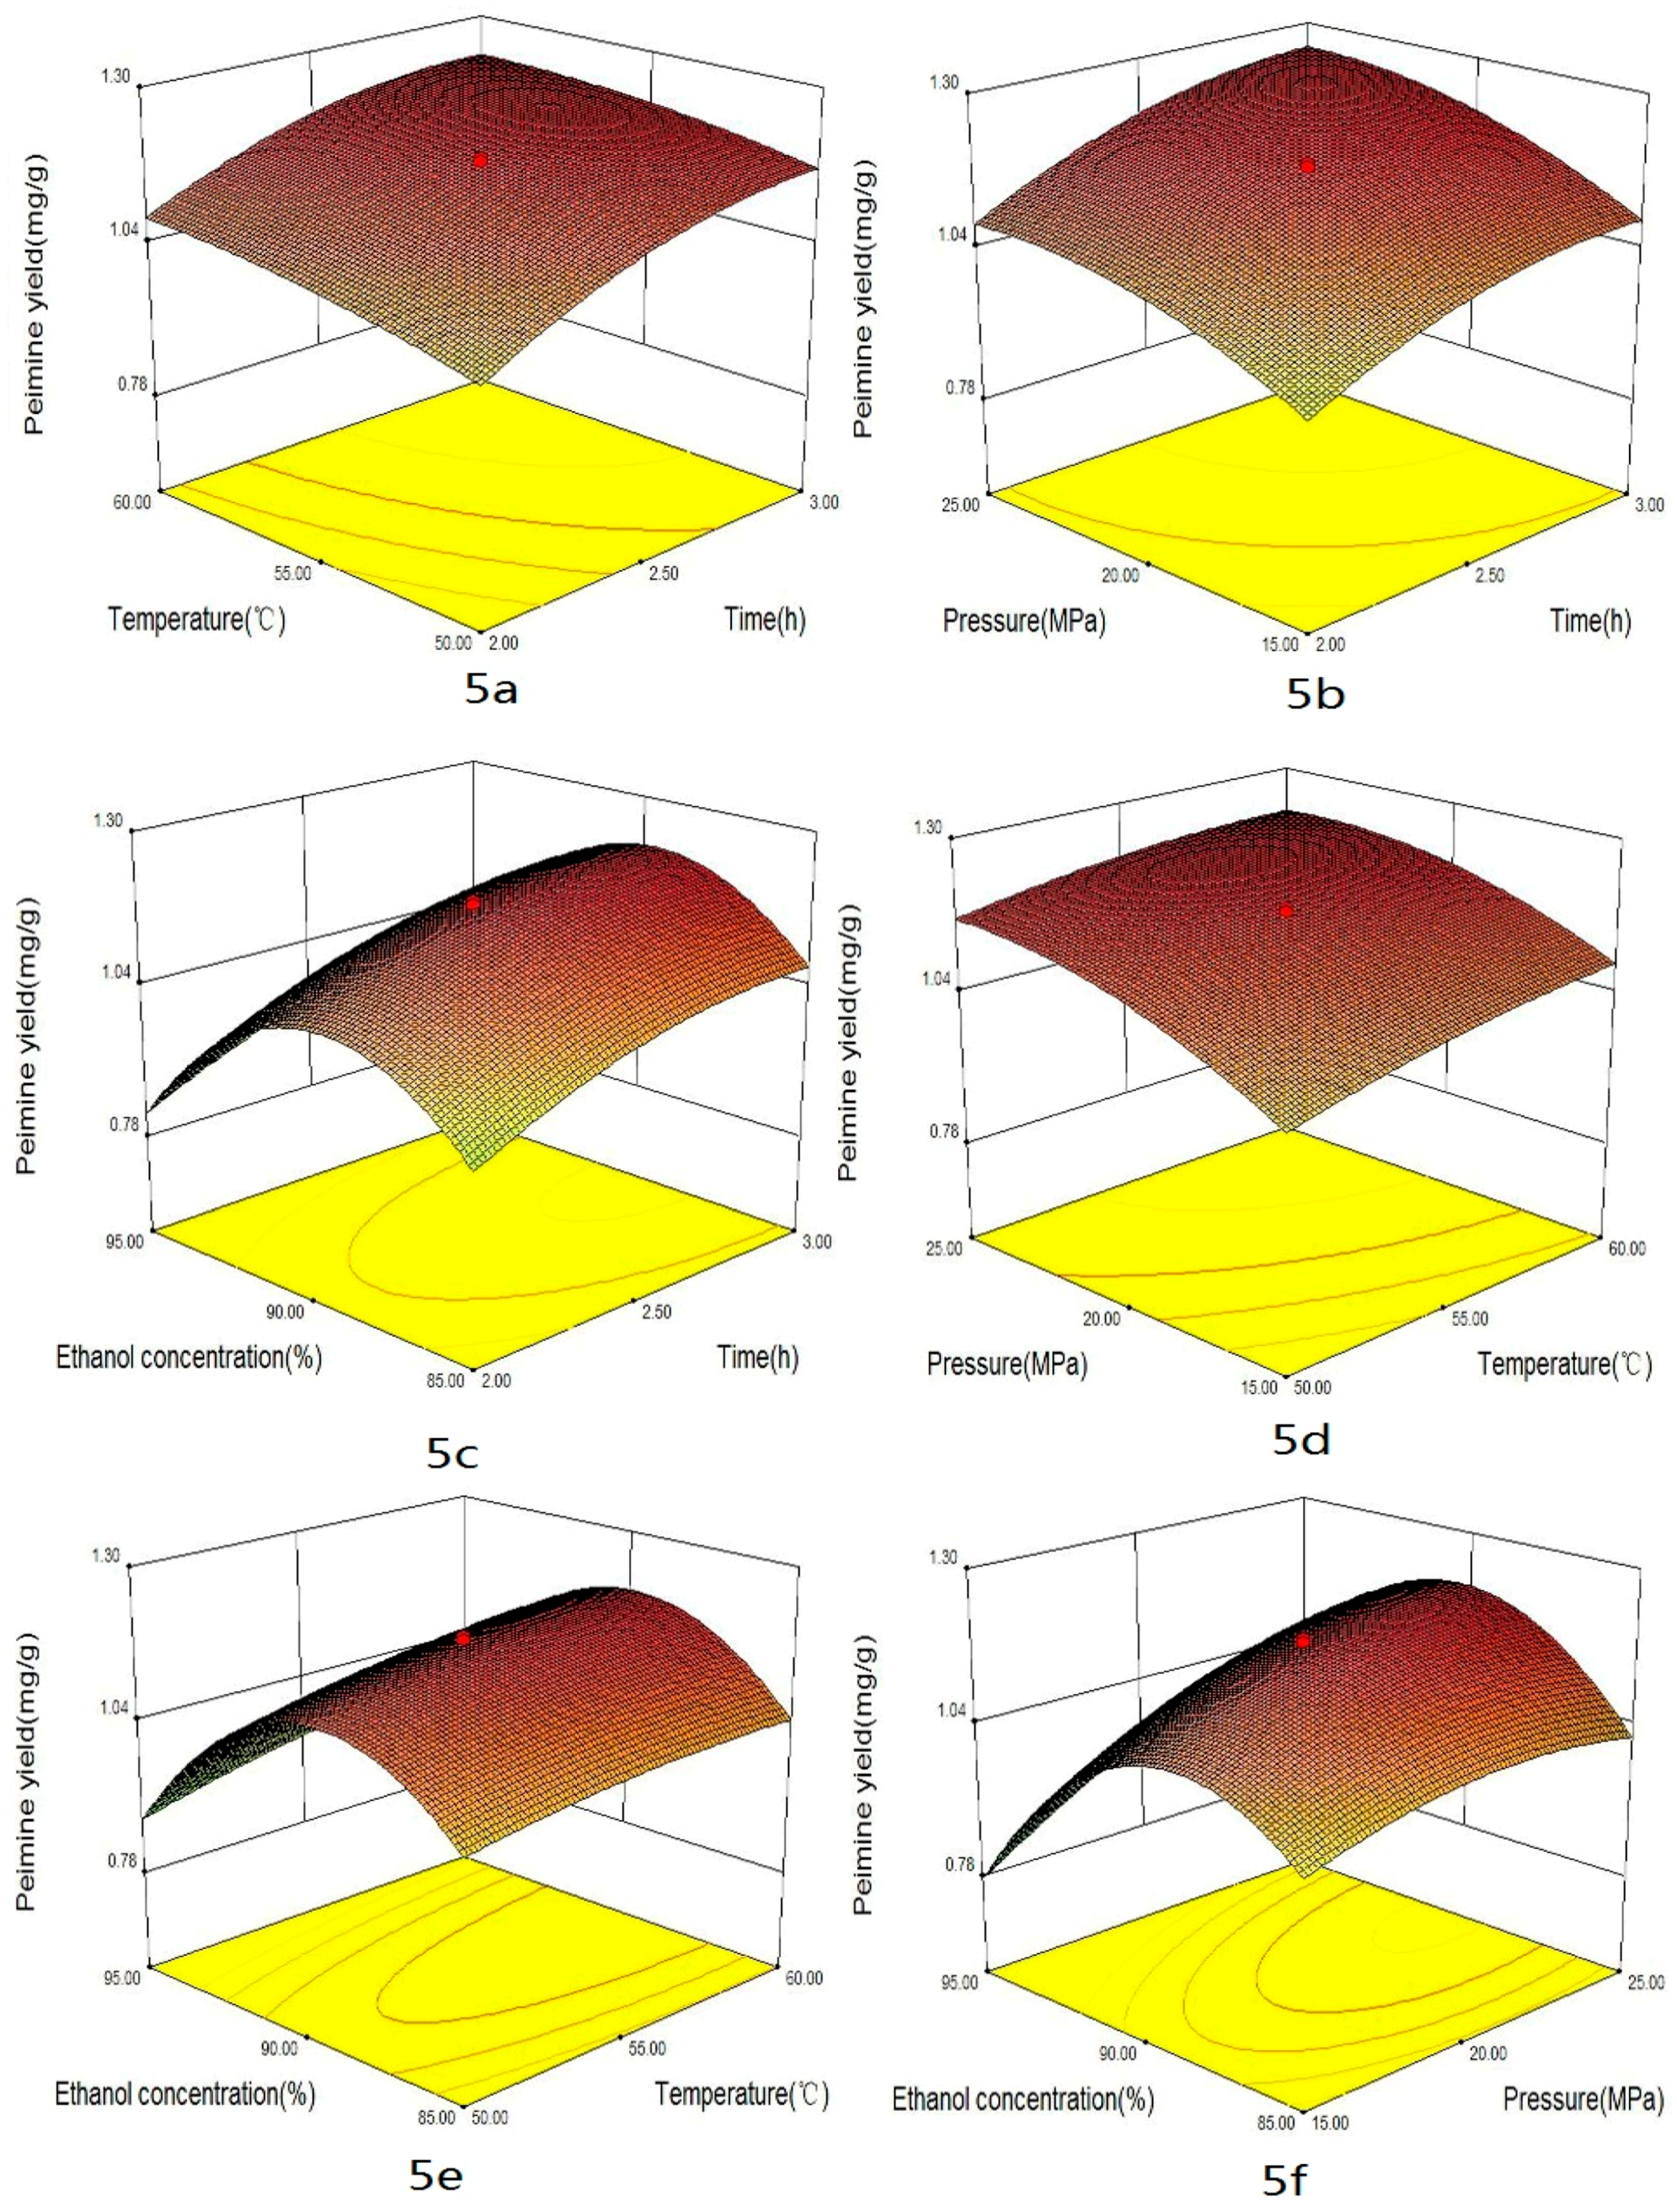
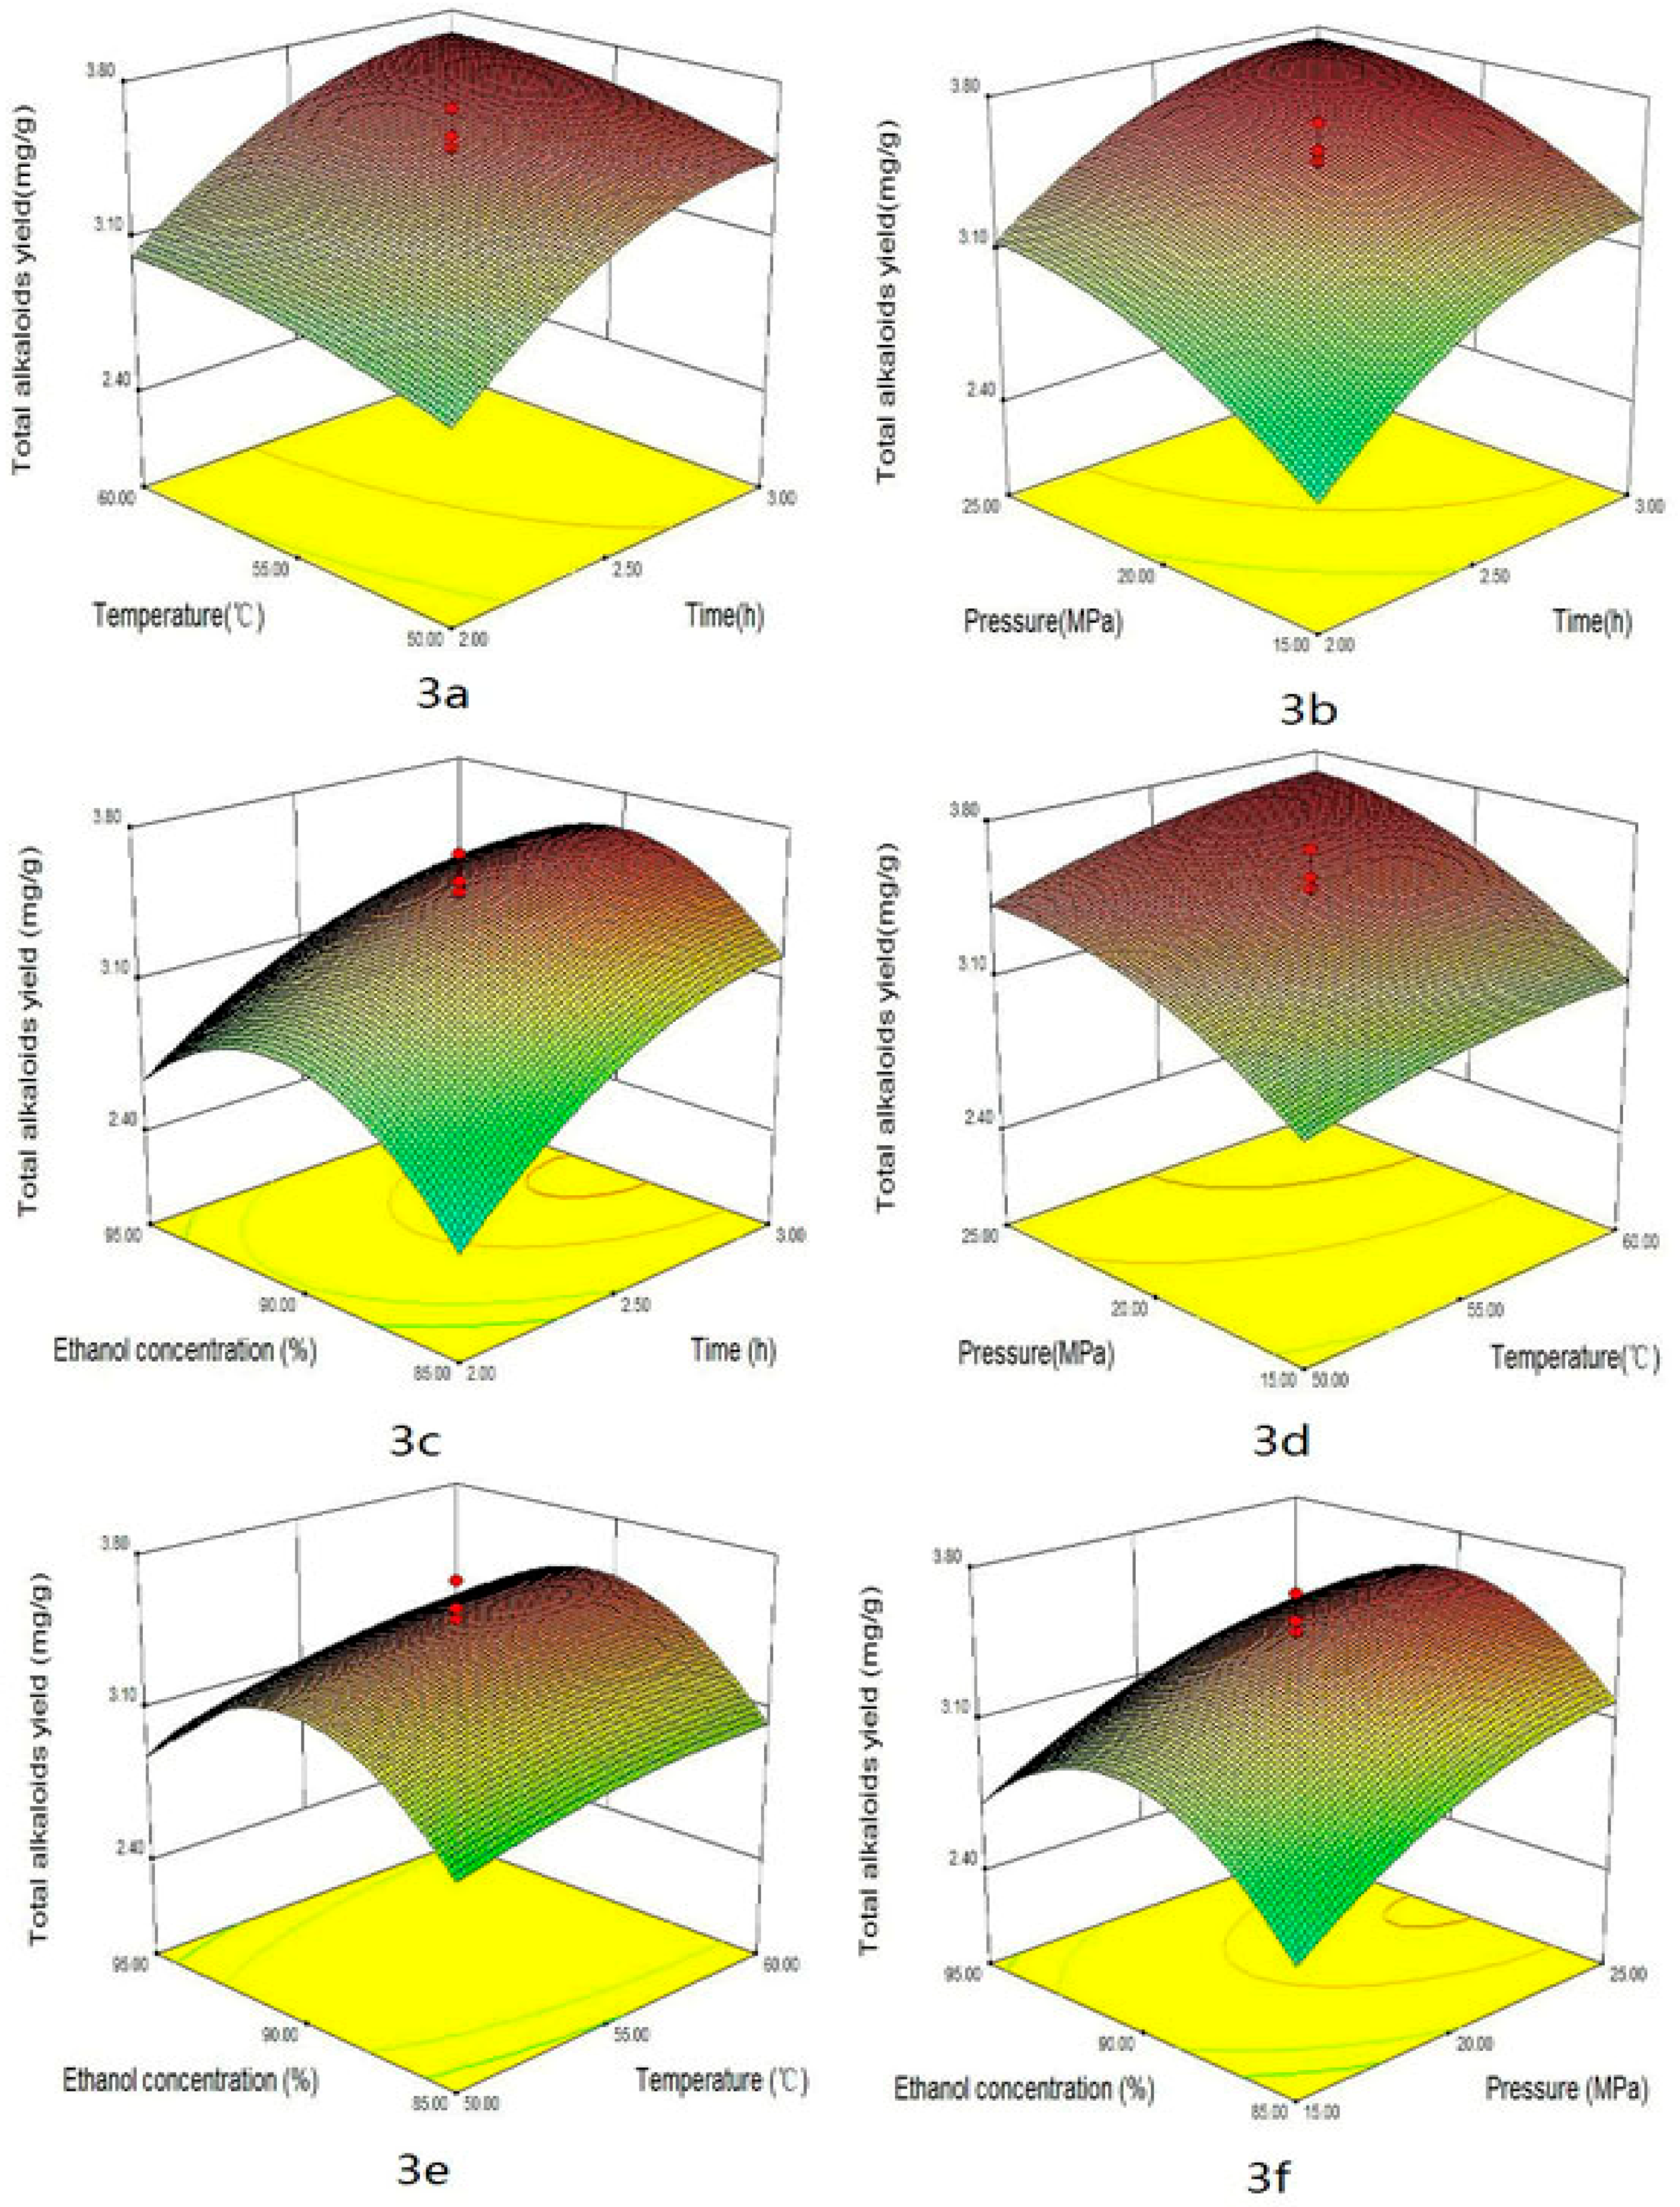
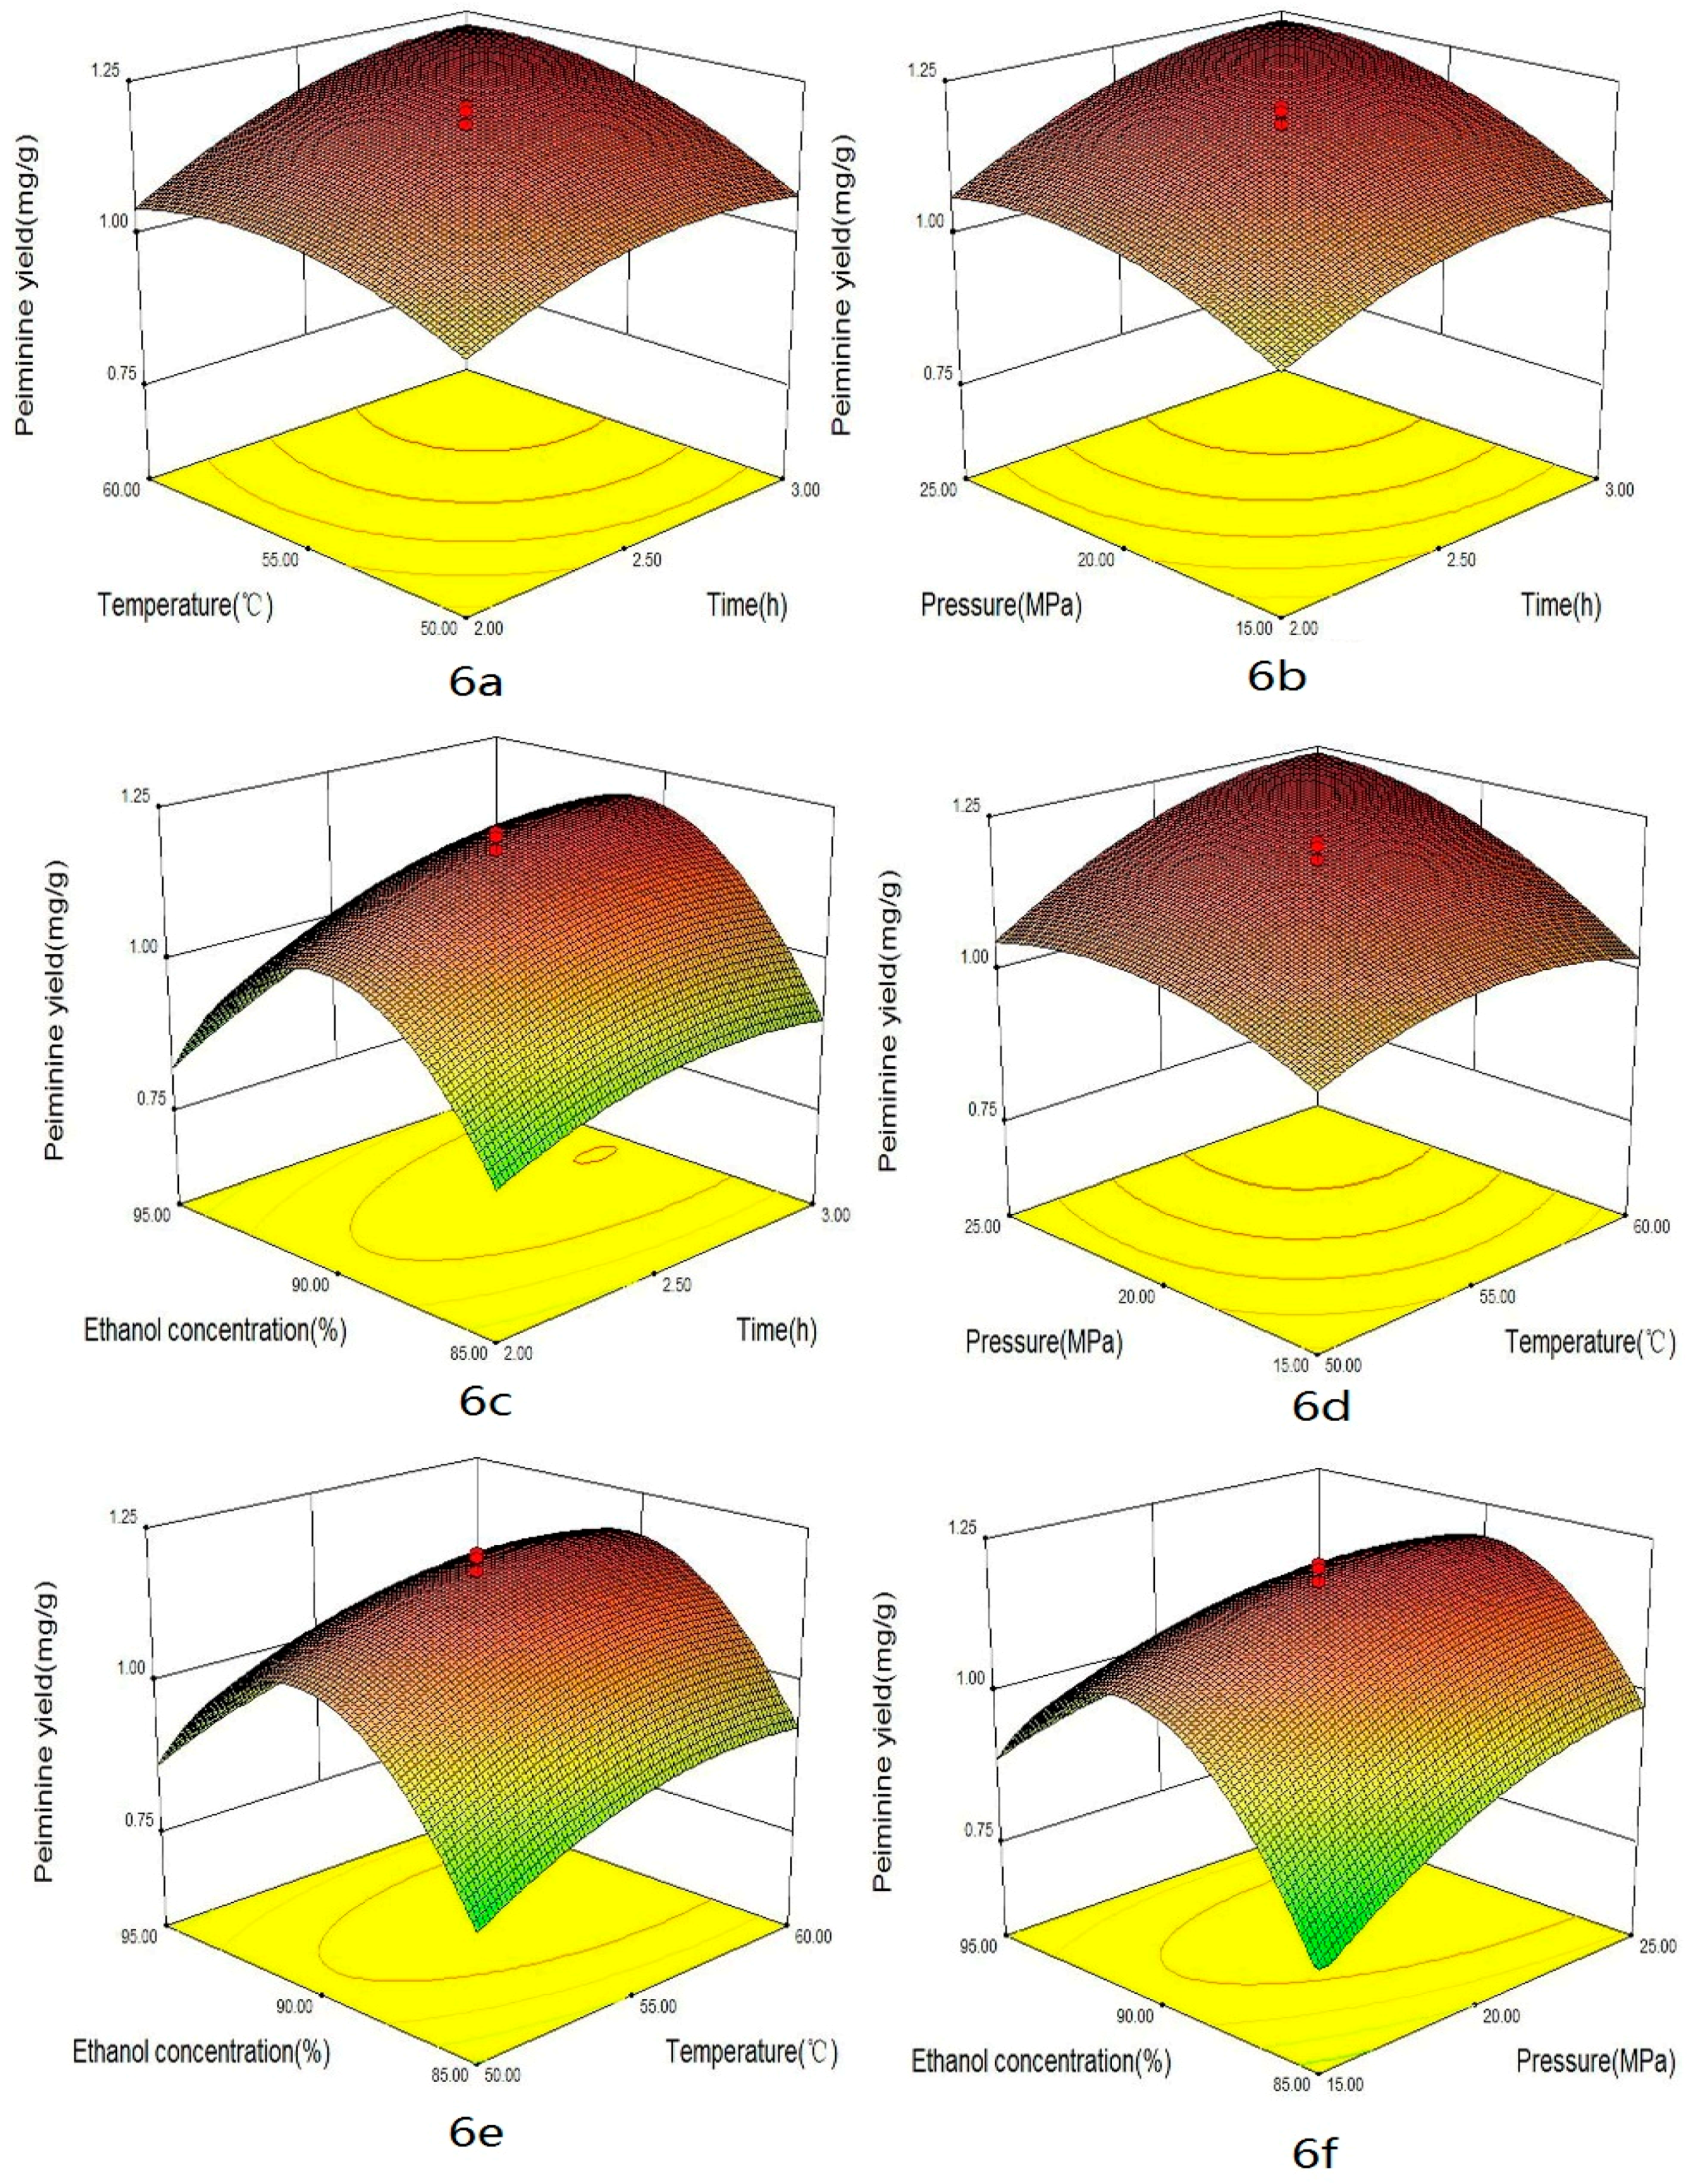
2.3. Effect of the Factors

Some factors, such as extraction time, temperature, pressure and co-solvent could impact the yield of alkaloids in supercritical CO2 extraction. The combined effects of four factors on the yields of total alkaloids, peimisine, peimine and peiminine are shown in Figure 3, Figure 4, Figure 5 and Figure 6, respectively. These graphs could be used for visually predicting future responses and for determining factor values that optimize the response function. Considering the combination effect of different factors on extraction yield, 3D response surface plots could provide a better understanding of the interaction between any two factors while the other two factors were held at constant optimum values. Figure 3a, Figure 4a, Figure 5a and Figure 6a show the effect of extraction times (X1) and temperature (X2) on the yields of total alkaloids, peimisine, peimine and peiminine, respectively, while pressure and co-solvent were kept constant at 20 MPa and 90% ethanol. One can see that longer extraction time and higher temperatures favored the extraction. As time increased, the yield increased quickly in the period of time less than 2.5 h, and then the yield increased slightly at time over 2.5 h. This indicated that optimization of extraction time was necessary [12,23]. Shorter time would cause incomplete extraction while longer time would waste time and energy. Higher total alkaloids yield (3.5 mg/g) was achieved at times longer than 2.5 h and temperature higher than 55 °C. In this study, the effect of time was significant for total alkaloids extraction (p < 0.05). Moreover, the effect of temperature on the yield could come from two ways. One was the increase of solute vapor pressure with temperature rise to cause an increase of solubility, and another was the decrease of solvent density with temperature rise to cause a decrease of solubility. The improvement of yield depended on which effect was more important. If the effect of vapor pressure were predominant, the solubility of solute in the supercritical phase would increase at higher temperatures, producing higher yield. On the contrary, if the effect of density were overwhelming, the solubility of solute would decrease at higher temperatures. In this study, higher temperature was favor of total alkaloids extraction, which meant that vapor pressure played a major role in the effect of temperature. Temperature had significant effect on the yield (p < 0.05). Similar effects of time and temperature on peimisine, peimine and peiminine yields can also be observed in Figure 4a, Figure 5a and Figure 6a, respectively. At times longer than 2.5 h and temperatures over 55 °C, extraction yields of total alkaloids, peimisine, peimine and peiminine were higher than 80%, respectively (all yields being based on the recovery obtained after 3.5 h). The effect of time and temperature was significant for the four interests (p < 0.05). However, the interaction effect between time and temperature (X1 × X2) was not statistically significant (p > 0.05) except for the yield of peimine.
The effects of extraction time and pressure (X2 × X3) on the yields of total alkaloids, peimisine, peimine and peiminine are shown in Figure 3b, Figure 4b, Figure 5b and Figure 6b, respectively. Higher pressure enhanced the extraction efficiency and the higher yields (3.4 mg/g, 0.4 mg/g, 1.2 mg/g and 1.2 mg/g for total alkaloids, peimisine, peimine and peiminine, respectively) were attained at the extraction time of 2.5 h and the pressure of 20 MPa. The phenomenon of higher yield obtained at higher pressure could be attributed to the increase of fluid density with elevating pressure, causing an increase of solubility. The effect of pressure was significant for the four analytes. The interaction between X1 and X3 was significant for peimine (p < 0.05), but not significant for the others.
For extraction of alkaloids with supercritical CO2, it was necessary to add a small amount of polar co-solvent in CO2 in order to increase the polarity of fluid, so as to improve extraction efficiency and reduce extraction time [12,24,25]. Figure 3c, Figure 4c, Figure 5c and Figure 6c display the effect of extraction time and ethanol concentration (X1 × X4) on yields of total alkaloids, peimisine, peimine and peiminine, respectively, while temperature and pressure were kept constant at 55 °C and 20 MPa. The yields of total alkaloids, peimine and peiminine were improved from 1.8 mg/g to 3.5 mg/g, from 0.5 mg/g to 1.2 mg/g, and from 0.2 mg/g to 1.1 mg/g, respectively, as ethanol concentration increased from 80% to 90%, and then the yields reduced as the ethanol concentration further increased. For extraction of peimisine, however, the higher yield could be attained by using lower ethanol concentration (80%). The effect of ethanol concentration could be explained by the fact of a similar polar solvent dissolving a similar polar solute. Higher yield could be attained when the polarity of the fluid matched with the polarity of the analytes. It was believed that the solubility of alkaloids increases at a given concentration range of ethanol/water, which resulted in the increase in the extraction recovery [11,26]. Ethanol concentration had significant effect on the yields of the four analytes. X1 × X4 interaction was significant for peimine (p < 0.05), but not significant for the others.
The effects of pressure and temperature on the yields of total alkaloids, peimisine, peimine and peiminine are shown in Figure 3d, Figure 4d, Figure 5d and Figure 6d, respectively. The increase of temperature and pressure enhanced the yields of the four analytes. Higher extraction yields were obtained in temperature between 55 and 65 °C, and pressure between 20 and 30 MPa. X1 × X3 interaction was significant for peimine and peiminine (p < 0.05), but not significant for the alkaloids and peimisine (p > 0.05).
The effects of temperature and ethanol concentration interaction (X2 × X4) on the yields are illustrated in Figure 3e, Figure 4e, Figure 5e and Figure 6e. It could be seen that higher yield was attained in the range of ethanol concentration between 82% and 92%, and temperature between 52 and 65 °C for the extraction of total alkaloids, peimine and peiminine. It was suitable to use <75% ethanol as co-solvent for getting higher peiminine yield (Figure 4e). The interaction X2 × X4 was significant for peimine (p < 0.05), but not significant for total alkaloids peimisine and peiminine (p > 0.05).
Figure 3f, Figure 4f, Figure 5f and Figure 6f show the effects of pressure and ethanol concentration (X3 × X4) on the yields of total alkaloids, peimisine, peimine and peiminine, respectively. The yields were improved as pressure increased for the four analytes at certain ethanol concentration. The yields could be influenced obviously by ethanol concentration. Higher yields of total alkaloids and peiminine appeared in the range of ethanol concentration between 83% and 92%, while higher yield of peimisine was attained at ethanol concentration below 87%. The interaction (X3 × X4) was significant for the extraction of peimisine, peimine and peiminine (p < 0.05). For the total alkaloids, however, the interaction (X3 × X4) was insignificant (p > 0.05).

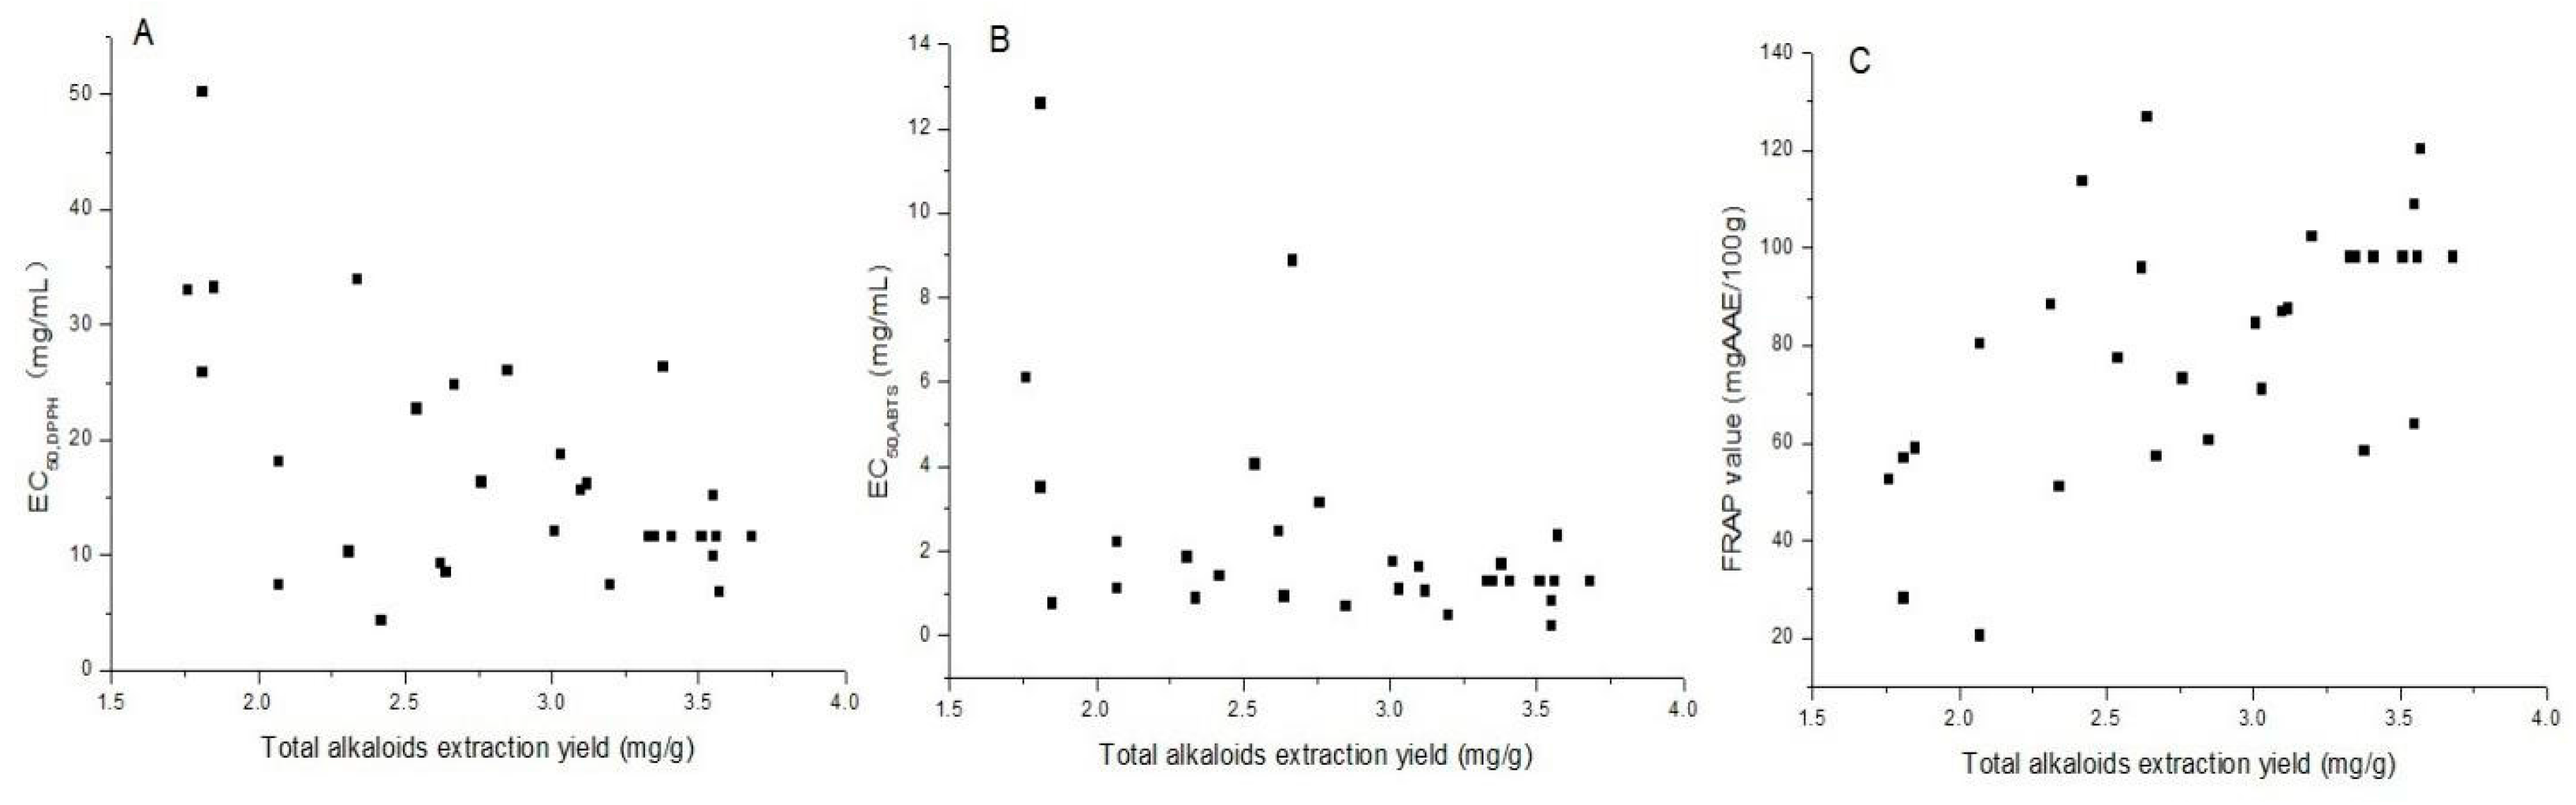
2.4. Antioxidant Activities and Correlation with Total Alkaloids

The antioxidant activity of F. thunbergii bulb was determined by DPPH, ABTS and FRAP methods to give a comprehensive prediction for antioxidant efficacy of the extracts. As shown in Figure 7, the antioxidant activities varied widely and significantly. The antioxidant activity ranged from 4.4 to 50.3 mg/mL by DPPH assay, from 0.2 to 12.6 mg/mL by ABTS assay, and the FRAP value as a measurement of the reducing power ranged from 20.4 to 126.9 mg AAE/100 g for the extracts. The extract could exhibit stronger antioxidant power in vivo because the intervention of enzymes and products caused radicals scavenging and increased the activities of antioxidative enzymes [27,28].
Relevant connection between alkaloids and their antioxidant activity was found in the literature [29,30,31]. In this work, attempts were made to analyze the correlation between the antioxidant activities (DPPH-RSA, ABTS-RSA, and FRAP) and total alkaloids yields using the Pearson’s correlation coefficient (r). The correlation coefficient (r) between the total alkaloids and antioxidant capacity of the extracts was −0.55 for DPPH-RSA, −0.23 for ABTS-RSA and 0.58 for FRAP assay. Antioxidant activities as measured by DPPH and FRAP methods showed moderate correlation with the total alkaloids yields, and antioxidant activity as measured by ABTS methods showed low correlation with the total alkaloids yields. These alkaloids compounds were not only significant to the function of relieving cough and reducing sputum, but also to antioxidant power. The different results found by these three methods could be explained by the involved mechanisms. ABTS-RSA and FRAP assays are based on electron transfer (ET) mechanism. In the case of DPPH assay, the reaction between DPPH radicals and the antioxidants could go simultaneously through a HAT (hydrogen atom transfer) and ET mechanisms [32,33]. What is more, antioxidant capacity also depended on pH value, as well supported by several research reports [34,35,36].

2.5. Optimization of Extraction Conditions and Verification Tests

The final purpose of determining the levels of key processing variables was to produce an extract with highest alkaloids content. For the four responses, the optimal conditions were obtained using Design Expert software as follow: extraction time, 3.0 h; extraction temperature, 60.4 °C; extraction pressure, 26.5 MPa; and ethanol concentration, 89.3%. As shown in Table 3, the respective experimental values of 3.8 mg/g, 0.5 mg/g, 1.3 mg/g and 1.3 mg/g for total alkaloids, peimisine, peimine and peiminine well matched the predicted values of 3.8 mg/g, 0.5 mg/g, 1.3 mg/g and 1.3 mg/g, respectively. The good agreement between the observed and estimated values verified that the fitted model for each response was reliable to simulate SFE of alkaloids from F. thunbergii bulb.
In order to better elucidate the SFE efficiency of alkaloids from F. thunbergii bulb, Soxhlet extraction was carried out as a comparison. As seen in Table 3, the yields of total alkaloids, peimine and peiminine obtained by SFE extraction was increased by 30% compared to those by Soxhlet extraction, and the yield of peimisine was particularly increased 67%. EC50, DPPH and EC50, ABTS value of SFE extraction were 0.5 and five times higher than those, and FRAP value of Soxhlet extraction was twice that of SFE extraction, indicating that antioxidant activities of SFE extraction was higher than those of Soxhlet extraction. These results suggested that efficiency of SFE extract was superior to Soxhlet extraction.

3. Materials and Methods

3.1. Materials and Reagents

The bulbs of F. thunbergii were obtained from Zhangshuizhen (Ningbo, China) and dried at 60 °C for 24 h in oven before use. Then, the dried bulbs were ground into powder using an herbal pulverizer (FW 100, Tianjin Taisite Instrument Co. Ltd., Tianjin, China) and sieved under 250 μm size for solvent extraction later. The cylinder of CO2 (99.5% purity) were supplied from Fangxin Gas Ltd. (Ningbo, China). Peimine, peiminine and peimisine standards were purchased from the National Institute for the Control of Pharmaceutical and Biological Products (Beijing, China). Acetonitrile of HPLC grade, 2,2-diphenyl-1-picrylhydrazyl (DPPH), 2,2′-azino-bis(3-ethylbenzthiozoline-6) sulfonic acid (ABTS), 2,4,6-tripyridyl-s-triazine (TPTZ), and ascorbic acid were purchased from Sigma Chemical (Louis, MO, USA). Ultrapure water, FeCl36H2O, FeSO4, Potassium persulfate, sodium acetate, acetic acid, methanol, and ethanol with analytical grade were purchased from Sinopharm Chemical Reagent Co. Ltd. (Shanghai, China). The purities of these compounds were determined to be more than 99.0% by UPLC. Bond Elut-C18 OH columns (500 mg/3 mL) used for solid-phase extraction were purchased from Agilent Technologies (Santa Clara, CA, USA).

3.2. Supercritical Fluid Extraction

Supercritical CO2 extraction was carried out at Spe-ed SFE-2 (Applied Separation, Hamilton, PA, USA). The extractor volume was 50 mL, thus it was filled with about 15 g of ground bulbs of F. thunbergii and the void volume was filled with celite. Flow-rate of CO2 (gaseous state) and flow-rate of co-solvent was fixed at 2 L/min and 0.4 mL/min, respectively, during dynamic extraction under each condition. The independent variables included time (1.5, 2, 2.5, 3, and 3.5 h), temperature (45, 50, 55, 60, and 65 °C), pressure (10, 15, 20, 25, and 30 MPa) and co-solvent (ethanol:water) ratio (80%, 85%, 90%, 95%, and 100%, v/v). After setting the required values according to the experimental design (central composite design), the extracting pressure and temperature were automatically controlled and maintained throughout the system. When both the set pressure and temperature were reached, the extraction was started. At the end of extraction, the extracts were collected from the separator outlet after releasing CO2 from the system.
The extracts were quantitatively transferred to a 50 mL volumetric flask by washing the cell with 80% ethanol, in which 3.3 mL were used for measurement of total alkaloids, 2.5 mL used for analysis with UPLC, and the remainder used for activities identification.

3.3. Soxhlet Extraction

A certain amount of grounded sample (15.0 g) was accurately weighed and added into a thimble, and then was extracted in a 500 mL of extractor with 375 mL of 89.3% ethanol at a syphon rate of 1 cycle/15 min. After 7 h of extraction, the extraction solvent was essentially colorless and the extracts were transferred to a 500 mL volumetric flask, in which 33 mL were used for measurement of total alkaloids, 2.5 mL used for analysis with UPLC, and the remained used for activities identification.

3.4. UPLC-ELSD Analysis

An ultra high performance liquid chromatography system (Agilent, Santa Clara, CA, USA) equipped with an Agilent pump (model L-1290) and an Evaporative Light Scattering Detector (ELSD) detector (Agilent, model L-1260) was used. The column used for separation was a SB-C18 column (1.8 um, 150 mm × 4.6 mm i.d., Agilent Technologies, Beijing, China). The mobile phase was acetonitrile:water:triethylamine (70:30:0.03, v/v/v) at a flow-rate of 1 mL/min. Detection was conducted at a grain of 6, filter of 7 and drift tube was set at 85 °C. For all experiments, 8 μL of standards or sample extract were injected.
The contents of peimisine, peimine and peiminine were determined by referring to the calibration curve established by running standards at varying concentrations through the UPLC system under the same conditions. The calibration curves were linear from 30.0 ug/mL to 600.0 ug/mL (y = −0.91 + 1.52x, R = 0.99, n = 6, y = Log peak area, x = Log concentration) for peimisine, 22.3 to 1109.6 μg/mL (y = −0.67 + 1.33x, R = 0.99, n = 6, y = Log peak area, x = Log concentration) for peimine, and from 30.1 to 1666.3 μg/mL (y = −0.88 + 1.41x, R = 0.99, n = 6, y = Log peak area, x = Log concentration) for peiminine. The limits of detection (LOD) and quantification (LOQ) for each analyte were determined at a signal-to-noise ratio (S/N) of about 3 and 10, respectively. LOD and LOQ of peimisine, peimine and peiminine were 2.0 μg/mL and 11.1 μg/mL, 2.9 μg/mL and 11.4 μg/mL, 3.3 μg/mL and 11.8 μg/mL, respectively.
The intra- and inter-day precisions were evaluated by a standard mixture solution of the three alkaloids under the selected chromatography conditions with five replicates in a day for intraday precision and once a day on three consecutive days for inter-day precision. RSD was taken as a measure of the intra- and inter-day precisions, with 2.0% and 3.1% for peimisine, 2.3% and 3.2% for peimine and 2.1% and 2.8% for peiminine, respectively. Standard addition test was performed to determine recovery in triplicates for each level at two concentrations level. The determined recoveries for peimisine, peimine and peiminine were 98.0%, 99.4% and 101.2% with RSD 3.3%, 3.5% and 4.4%, respectively.

3.5. Determination of Total Alkaloids Content

Total content of alkaloids was determined by the Chinese Pharmacopoeia (2010 edition) [7] with some modifications. The extracts were evaporated under reduced pressure at 50 °C to remove the solvent and then the residue was dissolved in 0.5 mL of 0.1 mol/L HCl and 2 mL deionized water. The solution was transferred to a 25 mL volumetric flask, water was added to the flask scale and then filtered. After that, 2 mL of deionized water and 2 mL of bromocresol green were transferred to separating funnel and shaken, and then accurately added 10 mL of CHCl3 and vigorously shaken for 2 min. The solution was allowed to stand. Chloroform layer was collected and measured absorbance at 411 nm. According to the standard curve A = 0.04C − 0.01 (A: absorbance, C: peimine concentration, μg/mL, R = 0.99, n = 6), total alkaloids contents could be calculated.

3.6. DPPH Radical Scavenging Assay

The DPPH radical scavenging activity assay was carried out in a Biotek Synergy 2 Multi-Detection Microplate Reader (Biotek, Winooski, VT, USA) according to the procedure described by Chandrasekar et al. [37] with minor modifications. All the experiments were run using a 400 uL 96-well plate. In brief, a series of samples with various concentrations in methanol were prepared, and then 50 uL of each sample solution was mixed with 50 uL of 0.2 mM DPPH solution freshly prepared in methanol. Methanol and l-ascorbic acid were used as the negative and positive control, respectively. After incubation for 30 min at room temperature in the dark, the absorbance of reactant was measured at 517 nm. The measurements of DPPH radical scavenging activity were carried out in triplicate. The percent of radical scavenging activity was determined from the difference in absorbance (A) of DPPH between the negative control and samples.
Radical scavenging  ( % ) = [ A negative control A sample A negative control ] × 100

3.7. ABTS Radical Scavenging Assay

The ABTS radical scavenging assay was performed according to Li’s method [20] with some modification. ABTS radical cation (ABTS•+) was produced by reacting ABTS solution (7 mM in water) with 2.5 mM potassium persulfate for 12 h with a ratio of 2:1 (v/v) at 4 °C in dark (stock solution). Then, the ABTS•+ stock solution was diluted with ethanol to an absorbance of approximately 1.0 at 750 nm, which was stable for at least 2 days in the dark. Fifty microliters of diluted ABTS radical solution was mixed with 50 μL of different samples. Ten minutes later, the absorbance was measured at 750 nm against the corresponding blank. The ABTS activity of samples was calculated using the Equation (5).

3.8. Ferric Reduction Activity Power (FRAP)

The FRAP assay was performed according to Mário Paz’s method [38]. In short, FRAP reagent (10 mL of 300 mmol/L acetate buffer (pH 3.6), 1 mL of 10 mmol/L TPTZ in 40 mmol/L HCl, and 1 mL of 20 mmol/L FeCl3) were diluted to one-third with acetate buffer. One hundred eighty microliters of this solution was added to each well, along with 20 μL of sample. The control assay was performed using 180 μL of FRAP reagent and 20 μL of ethanol. Absorbance was measured at 593 nm and 37 °C. The calibration curve (A = 1.29 × 10³C + 0.13, where A: absorbance, C: ascorbic acid concentration, µmol/L, R = 0.99, n = 6) was prepared with ascorbic acid (AA). The results were expressed as mg ascorbic acid equivalent/100 g (mg AAE/100 g).

3.9. Experimental Design and Evaluation

Central composite design (CCD) with four variables and five levels was generated using the Design-Expert Software (Stat-Ease Inc., Minneapolis, MN, USA) in order to optimize the extraction conditions for maximum recovery of bioactive alkaloids and antioxidant capacity. The tested variables and levels were reported in Table 4. In this study, 30 experimental points (16 factorial points, 8 axial points and 6 center points) were conducted to fit a second order polynomial model. The experimental design used for this study was shown in Table 1.
For statistical calculations, the relation between the coded values and actual values were described as the following equation:
X i = ( Z i Z 0 ) / Δ Z i = 1 , 2 , 3 , 4 , 5
where Xi was a coded value of the variable; Zi was the actual value of variable; Z0 was the actual value of the Zi at the center point; and ΔZ the step change of variable.
The relationship between the response and the independent variables was calculated by the second-order polynomial equation (Equation (7)). The non-linear computer-generated quadratic model was used for this model:
Y = β 0 + i   =   0 4 β i X i + i   =   0 4 β i i X i 2 + i 3 j   =   i   +   1 4 β i j X i X j
where Y was the predicted response; Xi and Xj were independent variables which influenced the response variable Y; β0 was the offset term; βi was the ith linear coefficient; βii was the ith quadratic coefficient; and βij was the ijth interaction coefficient.

4. Conclusions

In this study, the effects of extraction time, temperature, pressure, and ethanol concentration were evaluated in order to develop an optimized SFE method. The effect of four variables was significant for the extraction of total alkaloids, peimisine, peimine and peiminine (p < 0.05). The interaction of pressure and ethanol concentration (X3 × X4) was significant for the extraction of peimisine, peimine and peiminine (p < 0.05). Under the optimal conditions of extraction time 3.0 h, temperature 60.4 °C, pressure 26.5 MPa and ethanol concentration 89.3%, the yields of total alkaloids, peimisine, peimine and peiminine reached 3.8 mg/g, 0.5 mg/g, 1.3 mg/g and 1.3 mg/g, respectively, and they matched with the predicted value very well. From overall analysis, SFE with ethanol as co-solvent could be a useful alternative for the extraction of the compounds with high efficiency. These results proved suitable for the SFE of other alkaloids from other types of plants. Additionally, the extracts of F. thunbergii bulb showed good antioxidant activity in vitro, and moderate correlation between total alkaloids yields and antioxidant activity was established. Further studies are essential to evaluate antioxidant activities in vivo and elucidate the antioxidant mechanism.

Acknowledgments

The authors are grateful to the Natural Science Foundation of China (NSFC, Project No. 30470334), and Department of Science and Technology of Ningbo (DSTNB, Project No. 2014C10021) for the financial support to this work.

Author Contributions

Q.W. and L.Y. conceived and designed the experiments; X.R. and W.X.C. performed the experiments; W.X.C. and B.L. analyzed the data; M.X.Z. and Z.H.L. contributed reagents/materials/analysis tools; and W.X.C. and Q.W. wrote the paper.

Conflicts of Interest

The authors declare no conflict of interest.

Abbreviations

The following abbreviations are used in this manuscript:
SFESupercritical fluid extraction
SC-CO2Supercritical carbon dioxide
DPPH-RSADPPH radical scavenging activity
ABTS-RSAABTS radical scavenging activity
FRAPFerric reducing capacity
CCDCentral composite design

References

  1. Rix, E.M. Fritillaria: A Revised Classification; The Fritillaria Group of the Alpine Garden Society: Edinburgh, UK, 2001. [Google Scholar]
  2. Xiao, P.G.; Jiang, Y.; Li, P.; Luo, Y.B.; Liu, Y. The botanical origin and pharmacophylogenetic treatment of Chinese material medica Beimu. Acta Phytotaxon. Sin. 2007, 45, 473–487. [Google Scholar] [CrossRef]
  3. Hao, D.C.; Gu, X.J.; Xiao, P.G.; Peng, Y. Phytochemical and biological research of Fritillaria medicinal resources. Chin. J. Nat. Med. 2013, 11, 330–344. [Google Scholar] [CrossRef] [PubMed]
  4. Li, H.J.; Jiang, Y.; Li, P. Chemistry, bioactivity and geographical diversity of steroidal alkaloids from the Liliaceae family. Nat. Prod. Rep. 2006, 23, 735–752. [Google Scholar] [CrossRef] [PubMed]
  5. Stermitz, F.R.; Tawara, J.N.; Boeckl, M.; Pomeroy, M.; Foderaro, T.A.; Todd, F.G. Piperidine alkaloid content of Picea (spruce) and Pinus (pine). Phytochemistry 1994, 35, 951–953. [Google Scholar] [CrossRef]
  6. Gerson, E.A.; Kelsey, R.G. Foliar storage and extraction methods for quantitative analysis of piperidine alkaloids from ponderosa pine (Pinus ponderosa). Phytochem. Anal. 1999, 10, 322–327. [Google Scholar] [CrossRef]
  7. Pharmacopoeia Commission of the People’s Republic of China. Pharmacopoeia of the People’s Republic of China; Chemistry Industry Publishing House: Beijing, China, 2010. [Google Scholar]
  8. Mitra, P.; Ramaswamy, H.S.; Chang, K.S. Pumpkin (Cucurbita maxima) seed oil extraction using supercritical carbon and physicochemical properties of the oil. J. Food Eng. 2009, 95, 208–213. [Google Scholar] [CrossRef]
  9. Zarena, A.S.; Sachindra, N.M.; Sankar, K.U. Optimisation of ethanol modified supercritical carbon dioxide on the extract yield and antioxidant activity from Garcinia mangostana L. Food Chem. 2012, 130, 203–208. [Google Scholar] [CrossRef]
  10. Liu, B.; Jiang, H.L.; Shen, B.; Chang, Y.L. Supercritical fluid extraction of sinomenine from Sinomenium acutum (Thumb) Rehd et Wils. J. Chromatogr. A 2005, 1075, 213–215. [Google Scholar] [CrossRef] [PubMed]
  11. Ling, J.Y.; Zhang, G.Y.; Cui, Z.J.; Zhang, C.K. Supercritical fluid extraction of quinolizidine alkaloids from Sophora flavescens Ait. and purification by high-speed counter-current chromatography. J. Chromatogr. A 2007, 1145, 123–127. [Google Scholar] [CrossRef] [PubMed]
  12. Liu, B.; Guo, F.; Chang, Y.L.; Jiang, H.L.; Wang, Q. Optimization of extraction of evodiamine and rutaecarpine from fruit of Evodia rutaecarpa using modified supercritical CO2. J. Chromatogr. A 2010, 1217, 7833–7839. [Google Scholar] [CrossRef] [PubMed]
  13. Arshadi, M.; Hunt, A.J.; Clark, J.H. Supercritical fluid extraction (SFE) as an effective tool in reducing auto-oxidation of dried pine sawdust for power generation. RSC Adv. 2012, 2, 1806–1809. [Google Scholar] [CrossRef]
  14. Herreroa, M.; Mendiolaa, J.A.; Cifuentesa, A.; Ibáneza, E. Supercritical fluid extraction: Recent advances and applications. J. Chromatogr. A 2010, 1217, 2495–2511. [Google Scholar] [CrossRef] [PubMed]
  15. Rashid, J.I.A.; Yusof, N.A.; Abdullah, J.; Hashim, U.; Hajian, R. Surface modifications to boost sensitivities of electrochemical biosensors using gold nanoparticles/silicon nanowires and response surface methodology approach. J. Mater. Sci. 2015, 51, 1083–1097. [Google Scholar] [CrossRef]
  16. Kou, X.H.; Chen, Q.; Li, X.H.; Li, M.F.; Kan, C.; Chen, B.R.; Zhang, Y.; Xue, Z.H. Quantitative assessment of bioactive compounds and the antioxidant activity of 15 jujube cultivars. Food Chem. 2015, 173, 1037–1044. [Google Scholar] [CrossRef] [PubMed]
  17. Zhang, B.; Deng, Z.Y.; Ramdath, D.D.; Tang, Y.; Chen, P.X.; Liu, R.H.; Liu, Q.; Tsao, R. Phenolic profiles of 20 Canadian lentil cultivars and their contribution to antioxidant activity and inhibitory effects on a-glucosidase and pancreatic lipase. Food Chem. 2015, 172, 862–872. [Google Scholar] [CrossRef] [PubMed]
  18. Smolskait, L.; Venskutonis, P.R.; Talou, T. Comprehensive evaluation of antioxidant and antimicrobial properties of different mushroom species. LWT-Food Sci. Technol. 2015, 60, 462–471. [Google Scholar] [CrossRef]
  19. Raudonis, R.; Raudone, L.; Jakstas, V.; Janulis, V. Comparative evaluation of post-column free radical scavenging and ferric reducing antioxidant power assays for screening of antioxidants in strawberries. J. Chromatogr. A 2012, 1233, 8–15. [Google Scholar] [CrossRef] [PubMed]
  20. Lia, D.Q.; Zhao, J.; Lia, S.P. High-performance liquid chromatography coupled with post-columndual-bioactivity assay for simultaneous screening of xanthine oxidaseinhibitors and free radical scavengers from complex mixture. J. Chromatogr. A 2014, 1345, 50–56. [Google Scholar] [CrossRef] [PubMed]
  21. Helmja, K.; Vahera, M.; Püssa, T.; Kaljurand, M. Analysis of the stable free radical scavenging capability of artificial polyphenol mixtures and plant extracts by capillary electrophoresis and liquid chromatography-diode array detection-tandem mass spectrometry. J. Chromatogr. A 2009, 1216, 2417–2423. [Google Scholar] [CrossRef] [PubMed]
  22. Xu, Q.; Shen, Y.Y.; Wang, H.F.; Zhang, N.P.; Xu, S.; Zhang, L. Application of response surface methodology to optimise extraction of flavonoids from Fructus sophorae. Food Chem. 2013, 138, 2122–2129. [Google Scholar] [CrossRef] [PubMed]
  23. Zheng, Y.; Liu, B.; Chen, M.; Chen, T. Supercritical fluid extraction of ecdysterone from the roots of Achyranthes bidentata BL. J. Sep. Sci. 2008, 31, 1393–1398. [Google Scholar] [CrossRef] [PubMed]
  24. Liu, B.; Wu, Y.; Qian, G.; Chang, Y. Optimum extraction of osthole and imperatorin from the fruits of Cnidium monnieri (L.) cusson by supercritical fluid. Sep. Sci. Technol. 2013, 48, 652–658. [Google Scholar] [CrossRef]
  25. Xiao, J.; Tian, B.; Xie, B.; Yang, E.; Shi, J.; Sun, Z. Supercritical fluid extraction and identification of isoquinoline alkaloids from leaves of Nelumbo nucifera Gaertn. Eur. Food Res. Technol. 2010, 231, 407–414. [Google Scholar] [CrossRef]
  26. Choi, Y.H.; Chin, Y.W.; Kim, J.; Jeon, S.H.; Yoo, K.P. Strategies for supercritical fluid extraction of hyoscyamine and scopolamine salts using basified modifiers. J. Chromatogr. A 1999, 863, 47–55. [Google Scholar] [CrossRef]
  27. Korkmaz, A.; Reiter, R.J.; Tan, D.X.; Manchester, L.C. Melatonin: From pineal gland to healthy foods. Food Chem. 2011, 123, 33–36. [Google Scholar] [CrossRef]
  28. Reiter, R.J.; Tan, D.X.; Fuentes-Broto, L. Melatonin: A multitasking molecule. Prog. Brain Res. 2010, 181, 127–151. [Google Scholar] [PubMed]
  29. Herraiz, T.; Galisteo, J. Hydroxyl radical reactions and the radical scavenging activity of β-carboline alkaloids. Food Chem. 2015, 172, 640–649. [Google Scholar] [CrossRef] [PubMed]
  30. Tsoi, B.; Yi, R.N.; Cao, L.F.; Li, S.B.; Tan, R.R.; Chen, M.; Li, X.X.; Wang, C.; Li, Y.F.; Kurihara, H.; et al. Comparing antioxidant capacity of purine alkaloids: A new, efficient trio for screening and discovering potential antioxidants in vitro and in vivo. Food Chem. 2015, 176, 411–419. [Google Scholar] [CrossRef] [PubMed]
  31. Shirwaikar, A.; Rajendran, K.; Punitha, I.S.R. In vitro antioxidant studies on the benzyl tetra isoquinoline alkaloid berberine. Biol. Pharm. Bull. 2006, 29, 1906–1910. [Google Scholar] [CrossRef] [PubMed]
  32. Huang, D.; Ou, B.; Prior, R.L. The chemistry behind antioxidant capacity assays. J. Agric. Food Chem. 2005, 53, 1841–1856. [Google Scholar] [CrossRef] [PubMed]
  33. Temel, E.; Alasalvar, C.; Gökçe, H.; Güder, A.; Albayrak, Ç.; Alpaslan, Y.B.; Alpaslan, G.; Dilek, N. DFT calculations, spectroscopy and antioxidant activity studies on (E)-2-nitro-4-[(phenylimino)methyl]phenol. Spectrochim. Acta A 2015, 136, 534–546. [Google Scholar] [CrossRef] [PubMed]
  34. Majo, D.D.; Neve, L.L.; Guardia, M.L.; Casuccio, A.; Giammanco, M. The influence of two different pH levels on the antioxidant properties of flavonols, flavan-3-ols, phenolic acids and aldehyde compounds analysed in synthetic wine and in a phosphate buffer. J. Food Compos. Anal. 2011, 24, 265–269. [Google Scholar] [CrossRef]
  35. Dapkevicius, A.; Vau Beek, T.A.; Niederlander, H.A.G. Evalution and comparison of two improved techniques for the on-line detection of antioxidants in liquid chromatography eluates. J. Chromatogr. A 2001, 912, 73–82. [Google Scholar] [CrossRef]
  36. Lemanska, K.; Szymusiak, H.; Tyrakowska, B.; Zielinski, R.; Soffers, A.E.M.F.; Rietjens, I.M.C.M. The influence of pH on antioxidant action of hydroxyflavones. Free Radic. Biol. Med. 2001, 31, 869–881. [Google Scholar] [CrossRef]
  37. Li, Y.; Chen, J.; Li, Y.; Li, Q.; Zheng, Y.F.; Fu, Y.; Li, P. Screening and characterization of natural antioxidants in four Glycyrrhiza species by liquid chromatography coupled with electrospray ionization quadrupole time-of-flight tandem mass spectrometry. J. Chromatogr. A 2011, 1218, 8181–8191. [Google Scholar] [CrossRef] [PubMed]
  38. Paz, M.; Gúllon, P.; Barroso, M.F.; Carvalho, A.P.; Domingues, V.F.; Gomes, A.M.; Becker, H.; Longhinotti, E.; Delerue-Matos, C. Brazilian fruit pulps as functional foods and additives: Evaluation of bioactive compounds. Food Chem. 2015, 172, 462–468. [Google Scholar] [CrossRef] [PubMed]
Figure 1. Chemical structure of peimisine, peimine and peiminine.
Materials 09 00524 g001
Figure 2. UPLC chromatogram obtained by supercritical CO2, 90% ethanol + 10% H2O (v/v) from a fix amount of cosolvent of 0.4 mL/min, at 25 MPa, 60 °C and an extraction time of 2 h: (A) standards; and (B) the extract of the bulb (1: peimisine (MW,427.3); 2: peimine (MW, 431.6); and 3: peiminine (MW, 429.6)).
Materials 09 00524 g002
Figure 3. Response surface plots of total alkaloids yields showing: (a) the effect of time and temperature at constant pressure (20 MPa) and ethanol concentration (90%); (b) the effect of time and pressure at constant temperature (55 °C) and ethanol concentration (90%); (c) the effect of time and ethanol concentration at constant temperature (55 °C) and pressure (20 MPa); (d) the effect of temperature and pressure at constant time (2.5 h) and ethanol concentration (90%); (e) the effect of temperature and ethanol concentration at constant time (2.5 h) and pressure (20 MPa); and (f) the effect of pressure and ethanol concentration at constant time (2.5 h) and temperature (55 °C).
Materials 09 00524 g003
Figure 4. Response surface plots of peimisine yields showing: (a) the effect of time and temperature at constant pressure (20 MPa) and ethanol concentration (90%); (b) the effect of time and pressure at constant temperature (55 °C) and ethanol concentration (90%); (c) the effect of time and ethanol concentration at constant temperature (55 °C) and pressure (20 MPa); (d) the effect of temperature and pressure at constant time (2.5 h) and ethanol concentration (90%); (e) the effect of temperature and ethanol concentration at constant time (2.5 h) and pressure (20 MPa); and (f) the effect of pressure and ethanol concentration at constant time (2.5 h) and temperature (55 °C).
Materials 09 00524 g004
Figure 5. Response surface plots of peimine yields showing: (a) the effect of time and temperature at constant pressure (20 MPa) and ethanol concentration (90%); (b) the effect of time and pressure at constant temperature (55 °C) and ethanol concentration (90%); (c) the effect of time and ethanol concentration at constant temperature (55 °C) and pressure (20 MPa); (d) the effect of temperature and pressure at constant time (2.5 h) and ethanol concentration (90%); (e) the effect of temperature and ethanol concentration at constant time (2.5 h) and pressure (20 MPa); and (f) the effect of pressure and ethanol concentration at constant time (2.5 h) and temperature (55 °C).
Materials 09 00524 g005
Figure 6. Response surface plots of peiminine yields showing: (a) the effect of time and temperature at constant pressure (20 MPa) and ethanol concentration (90%); (b) the effect of time and pressure at constant temperature (55 °C) and ethanol concentration (90%); (c) the effect of time and ethanol concentration at constant temperature (55 °C) and pressure (20 MPa); (d) the effect of temperature and pressure at constant time (2.5 h) and ethanol concentration (90%); (e) the effect of temperature and ethanol concentration at constant time (2.5 h) and pressure (20 MPa); and (f) the effect of pressure and ethanol concentration at constant time (2.5 h) and temperature (55 °C).
Materials 09 00524 g006
Figure 7. Antioxidant activities and correlation with the extracts of SFE: (A) DPPH-RSA; (B) ABTS-RSA; and (C) FRAP.
Materials 09 00524 g007
Table 1. CCD experimental design for the yields of total alkaloids, Peimisine, peimine and eiminine, as well as their antioxidant power.
Trial No.X1X2X3X4Total AlkaloidsPeimisinePeiminePeiminineDPPHABTSFRAP
mg/gmg/gmg/gmg/gEC50, mg/mLEC50, mg/mL(mg AAE/100 g)
11−11−13.10.51.00.716.21.187.5
200003.40.41.21.211.61.398.2
300003.70.41.21.211.61.398.2
400021.80.10.30.333.16.152.6
500003.30.41.21.111.61.398.2
6−111−12.80.50.90.916.43.273.1
7−1−1−1−11.90.40.80.633.30.858.9
8−1−1112.60.30.80.79.32.595.9
9−1−11−12.30.50.90.734.00.951.1
1011113.20.31.11.07.50.5102.3
11111−13.40.51.11.126.41.758.4
1200003.50.41.21.111.61.398.2
13−11112.90.30.90.826.00.760.5
1411−113.00.20.90.912.11.784.6
150−2003.00.41.00.918.81.171.0
1611−1−12.70.41.00.724.98.957.2
17−11−1−11.80.40.90.625.93.556.8
181−1−112.50.20.70.822.74.177.3
1900−202.40.30.90.94.41.4113.8
2000003.40.41.21.211.61.398.2
21−1−1−112.10.20.60.718.11.180.3
221−1−1−12.60.41.00.68.50.9126.9
2320003.60.41.21.29.90.2109.0
24−11−112.30.20.70.710.31.988.4
25000−21.80.40.50.250.312.628.2
2602003.60.41.21.16.92.4120.4
271−1113.10.31.00.915.71.687.0
2800203.60.51.21.215.20.863.8
2900003.60.41.21.211.61.398.2
30−20002.10.40.90.97.52.220.4
Note: Experimental values are mean of three determinations.
Table 2. Analysis of variance for the response surface quadratic model.
SourceTotal AlkaloidsPeimisinePeiminePeiminine
Sum of SquaresF-Valuep-ValueSum of SquaresF-Valuep-ValueSum of SquaresF-Valuep-ValueSum of SquaresF-Valuep-Value
Model10.7641.50<0.010.372147.68<0.011.373398.91<0.012.0250.64<0.01
X12.67144.29<0.012.58 × 10−3211.46<0.010.155113.40<0.010.1036.53<0.01
X20.3217.51<0.011.58 × 10−3129.69<0.010.031174.37<0.010.0826.28<0.01
X31.89101.86<0.010.075561.83<0.010.134687.03<0.010.1140.33<0.01
X40.042.390.080.2318,787.21<0.010.0571998.27<0.010.025.270.04
X1X26.25 × 10−66.25 × 10−60.685.06 × 10−60.410.516.00 × 10−420.89<0.019.03 × 10−33.170.09
X1X30.021.170.266.81 × 10−55.570.321.02 × 10−335.63<0.015.63 × 10−31.980.18
X1X40.073.720.133.06 × 10−60.250.873.24 × 10−411.27<0.010.013.870.06
X2X36.01 × 10−36.01 × 10−30.427.66 × 10−56.270.161.48 × 10−351.58<0.010.028.440.01
X2X48.56 × 10−38.56 × 10−30.526.63 × 10−454.280.104.56 × 10−3158.54<0.012.03 × 10−30.710.41
X3X40.042.110.123.05 × 10−3249.87<0.010.051593.52<0.010.0414.76<0.01
X120.8847.36<0.012.05 × 10−3167.42<0.010.041501.71<0.010.0619.87<0.01
X220.094.700.033.38 × 10−427.670.936.10 × 10−3212.36<0.010.0724.49<0.01
X320.5027.02<0.013.03 × 10−3248.020.030.051578.38<0.010.0724.49<0.01
X425.19280.27<0.010.064988.22<0.010.9332,195.41<0.011.60562.62<0.01
Residual0.28 1.83 × 10⁻⁴ 4.31 × 10⁻⁴ 0.04
Lack of Fit0.191.020.521.42 × 10−41.720.291.99 × 10−40.430.880.044.410.06
Pure Error0.09R20.974.13 × 10−5R20.992.31 × 10−4R20.994.35 × 10−3R20.98
Cor total11.040.371.372.06
Table 3. Extraction yields of total alkaloids, peimisine, peimine and peiminine and antioxidant capacity of total extract from the bulb of F. thunbergii Miq. (mean ± SD, n = 4).
Extraction ConditionTotal Alkaloids Yield (mg/g)Peimisine Yields (mg/g)Peimine Yields (mg/g)Peiminine Yields (mg/g)DPPH EC50(mg/mL)ABTS EC50 (mg/mL)FRAP (mg AAE/100 g)
SFE: extraction3.8 E3.8 P0.5 E0.5 P1.3 E1.3 P1.3 E1.3 P5.50.3118.2
Soxhlet extraction3.00.31.01.08.41.858.2
Note: E, experimental; P, predicted; (SFE extraction condition, time, 3.0 h; temperature, 60.4 °C; pressure, 26.5 MPa; modifier, 89.3% ethanol; flow, 0.4 mL/L; CO2, 2 g/L. Soxhlet extraction condition: time, 7 h, solvent, 89.3% ethanol).
Table 4. Variables and experimental design levels for response surface.
Independent VariablesModelSymbol Coded Factor Level
−2−10+1+2
Extraction time (h)X11.522.533.5
Extraction temperature (°C)X24550556065
Extraction pressure (MPa)X31015202530
Ethanol concentration (%)X480859095100

