
Evaluation of Microstructure and Transport Properties of Deteriorated Cementitious Materials from Their X-ray Computed Tomography (CT) Images

 ,
, 
Abstract
:1. Introduction
2. Methodology
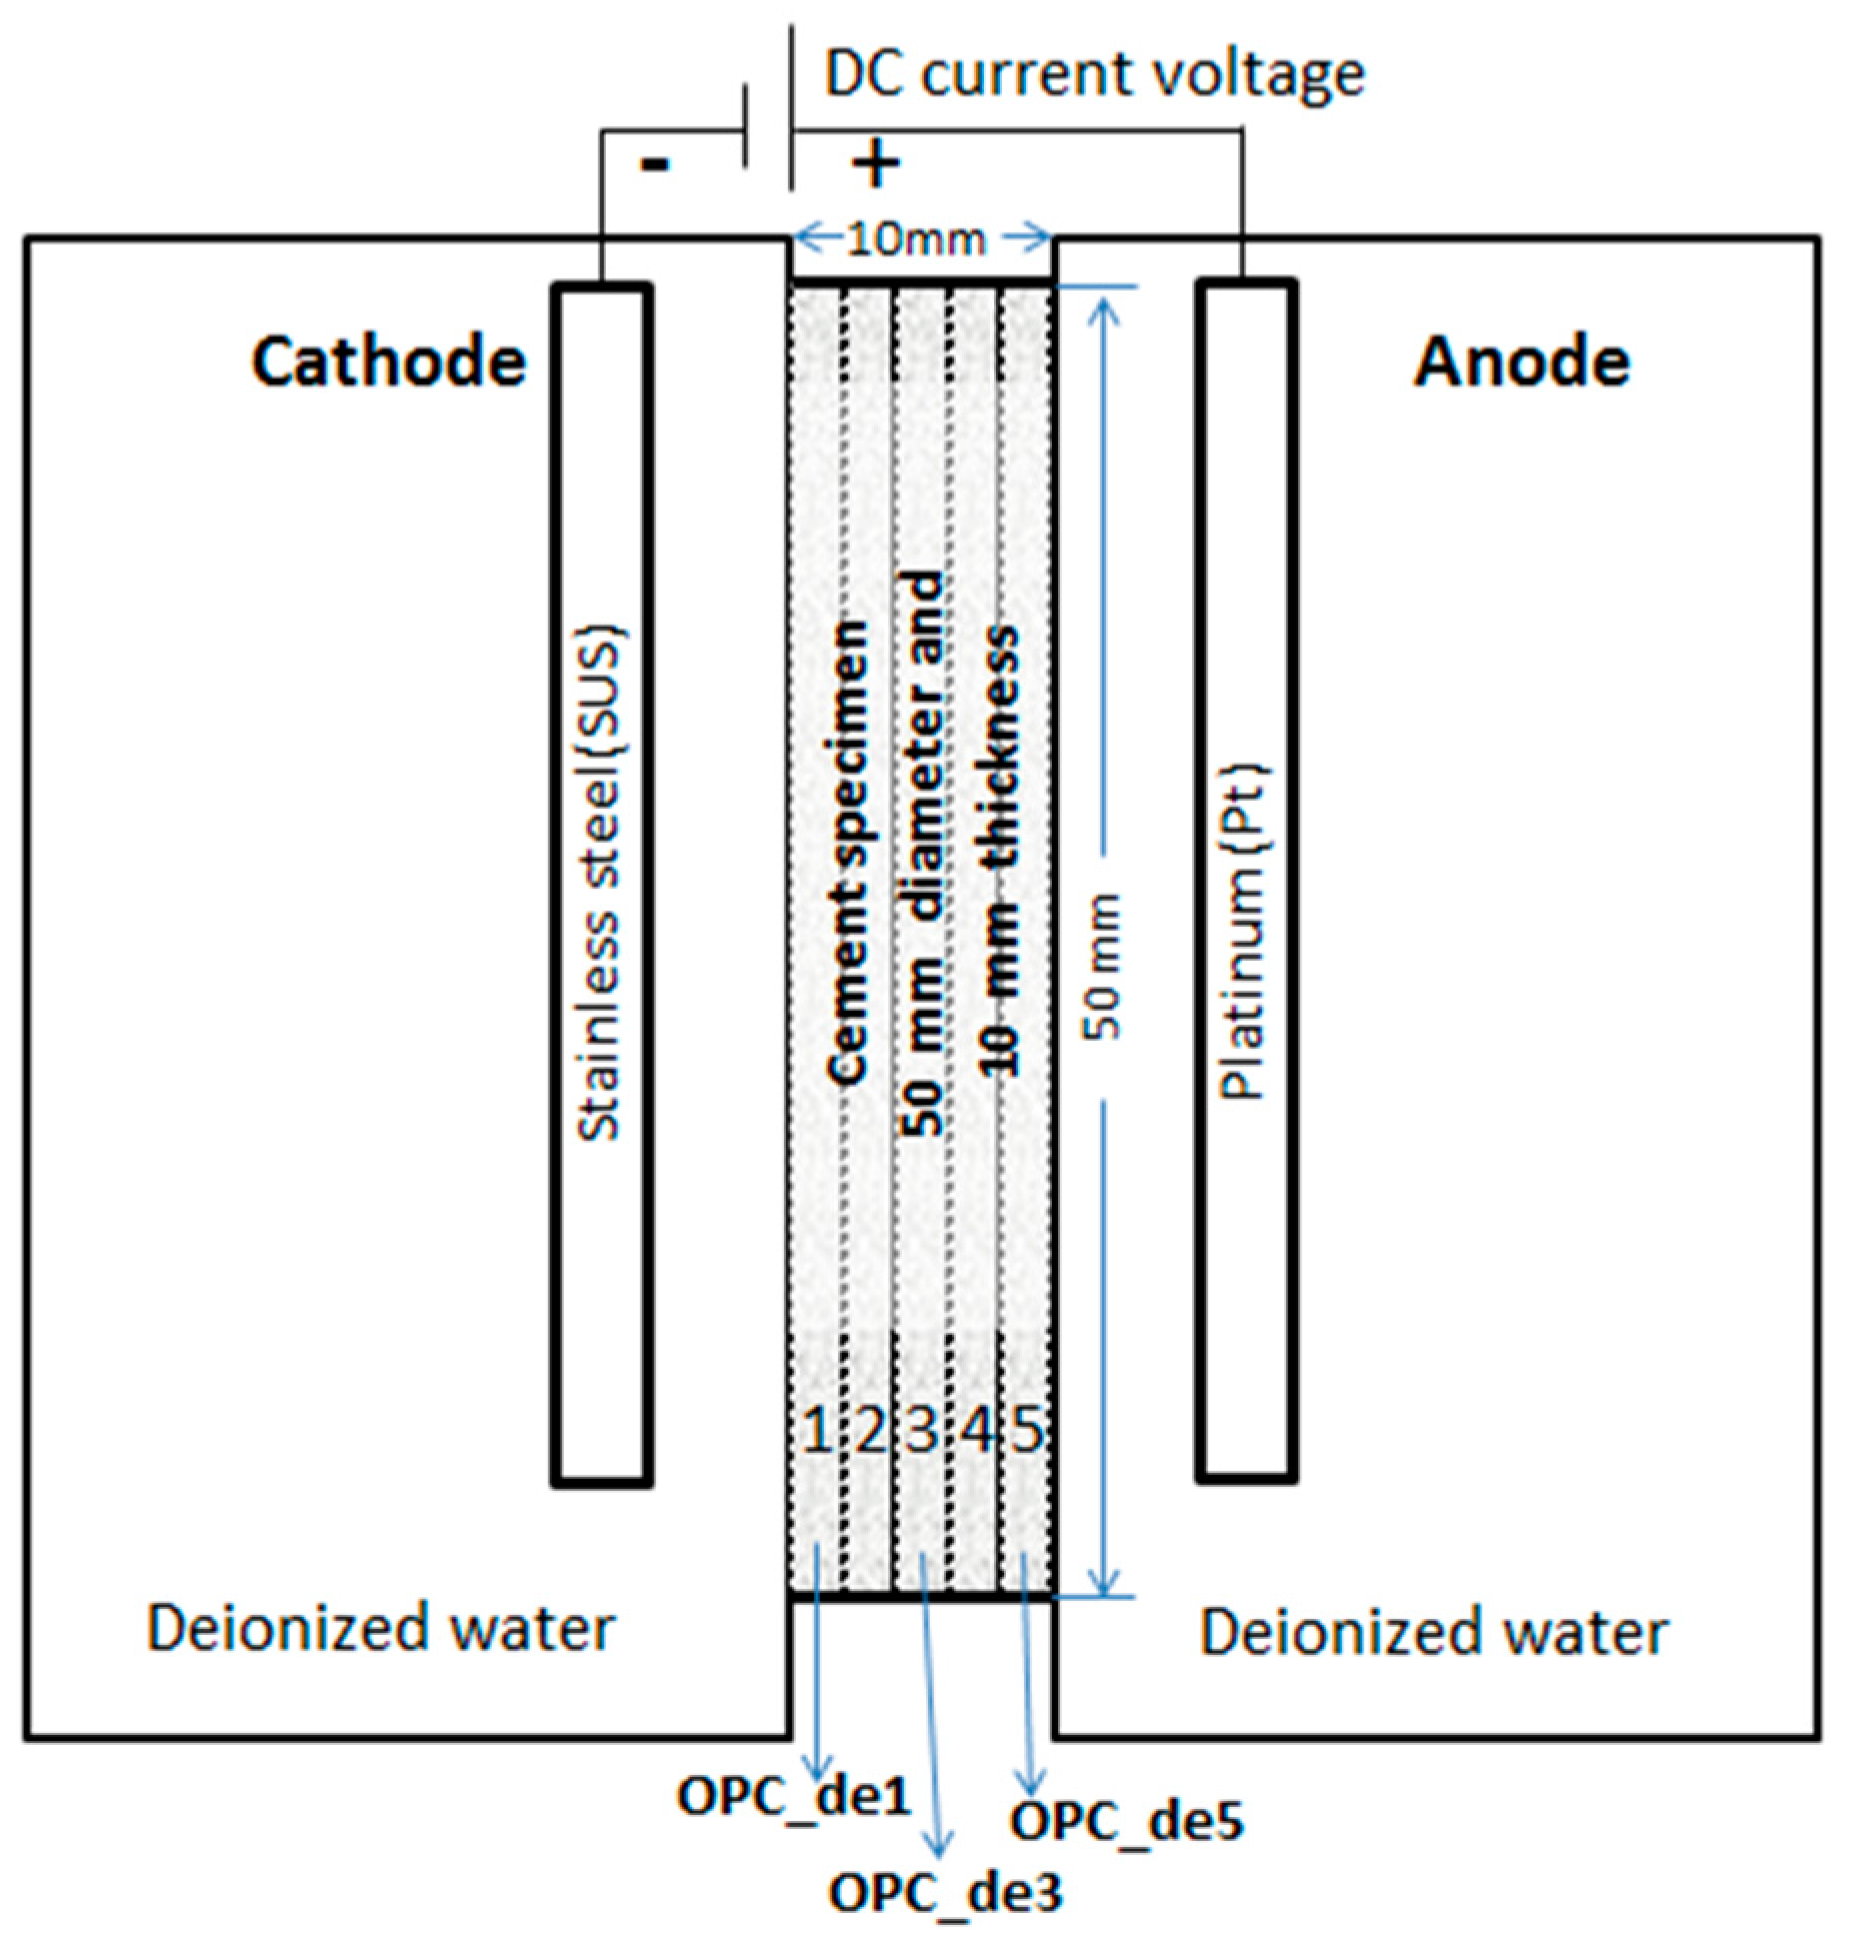
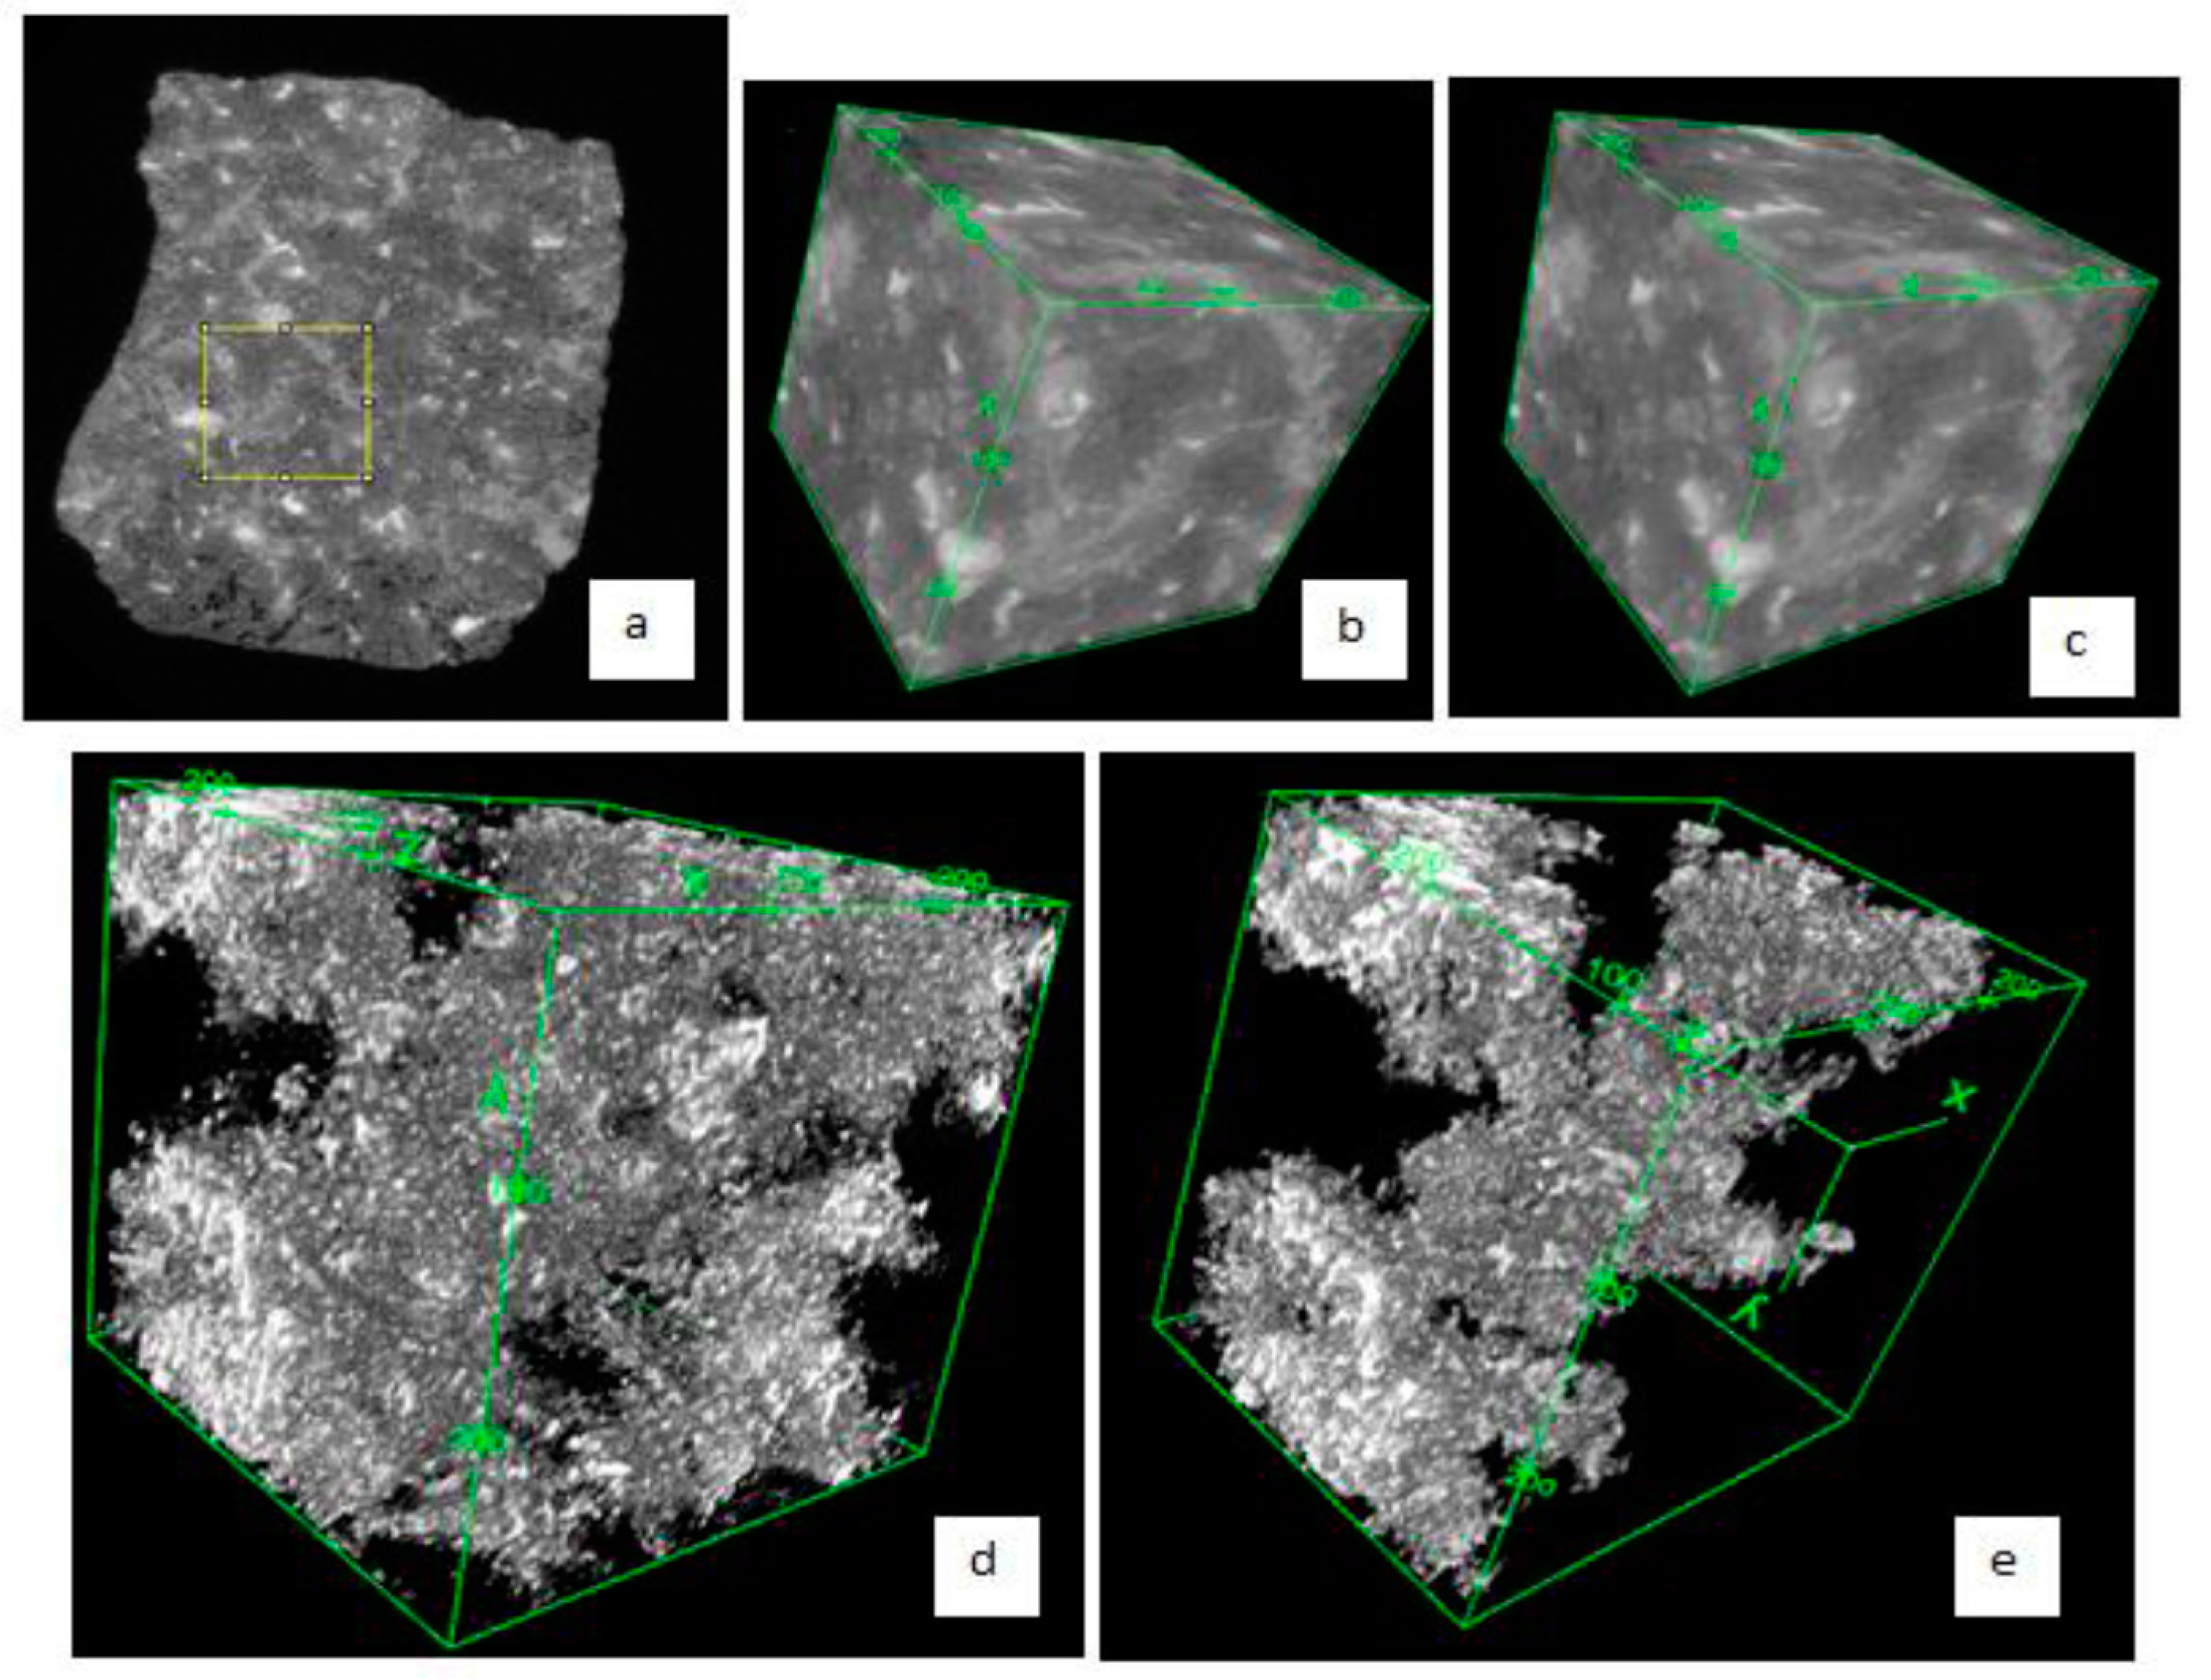
2.1. Image Acquisition of Leaching-Induced Deteriorated Cement Pastes
2.2. Evaluation of Microstructure and Transport Properties from CT Images
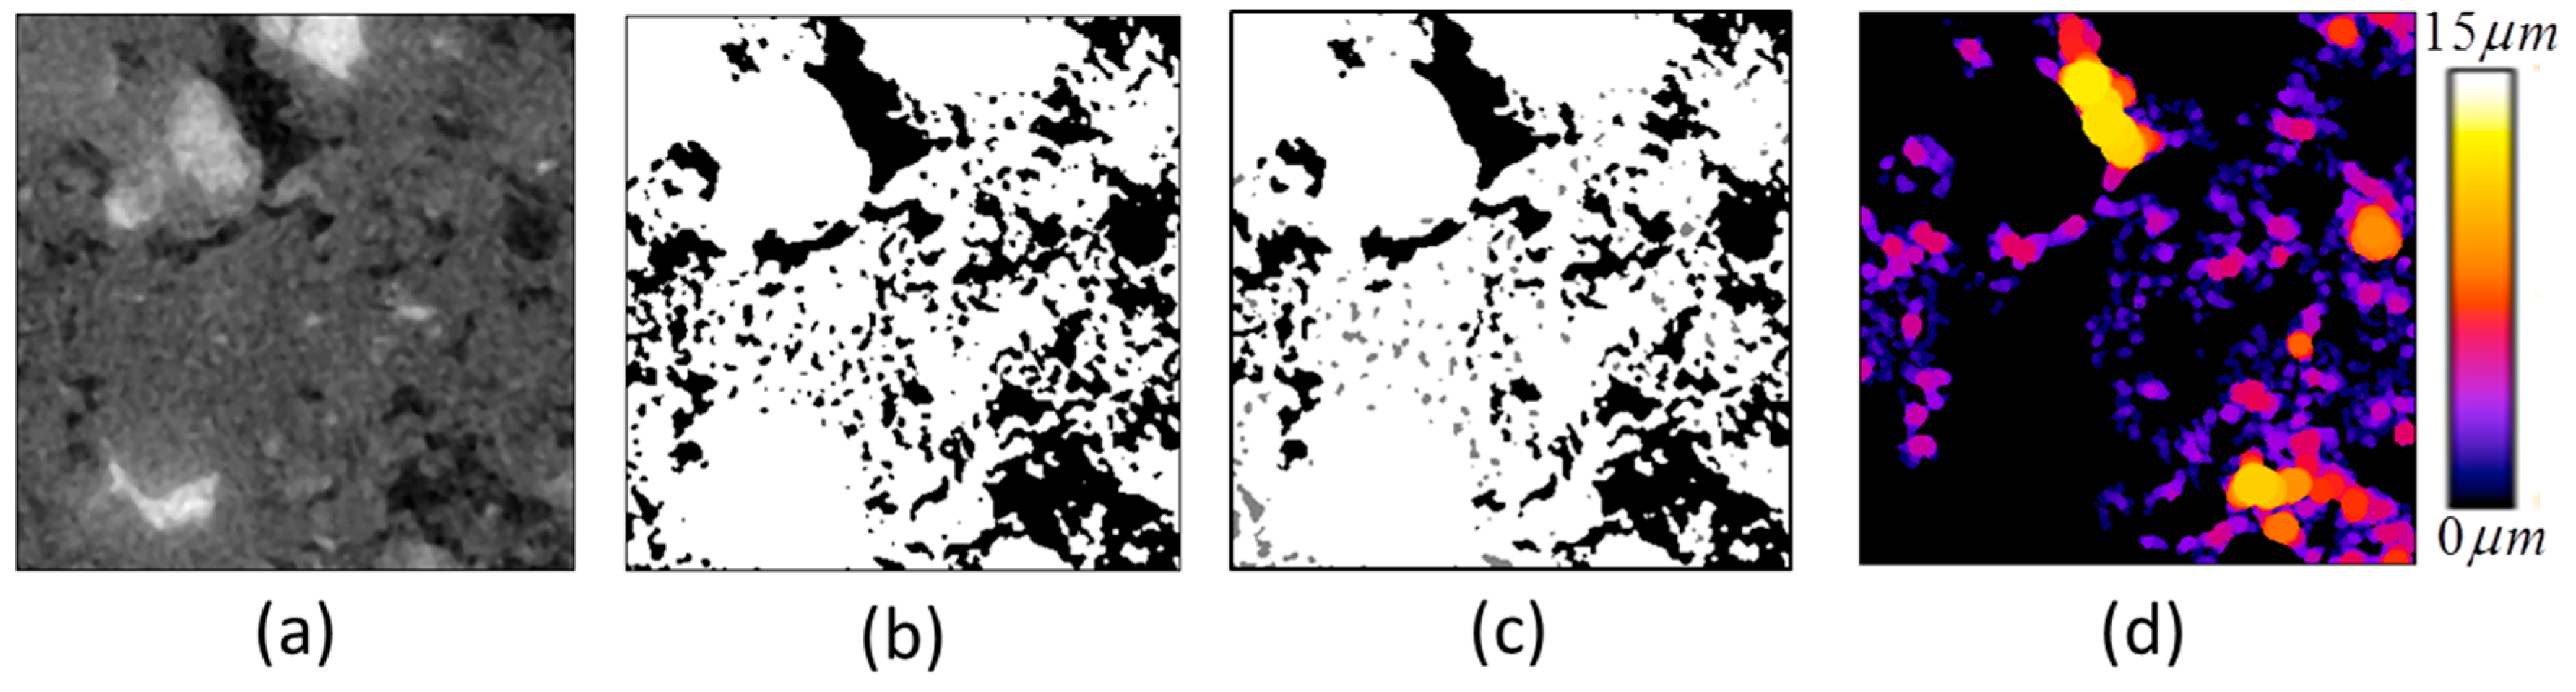
2.2.1. Porosity and Mean Pore Size
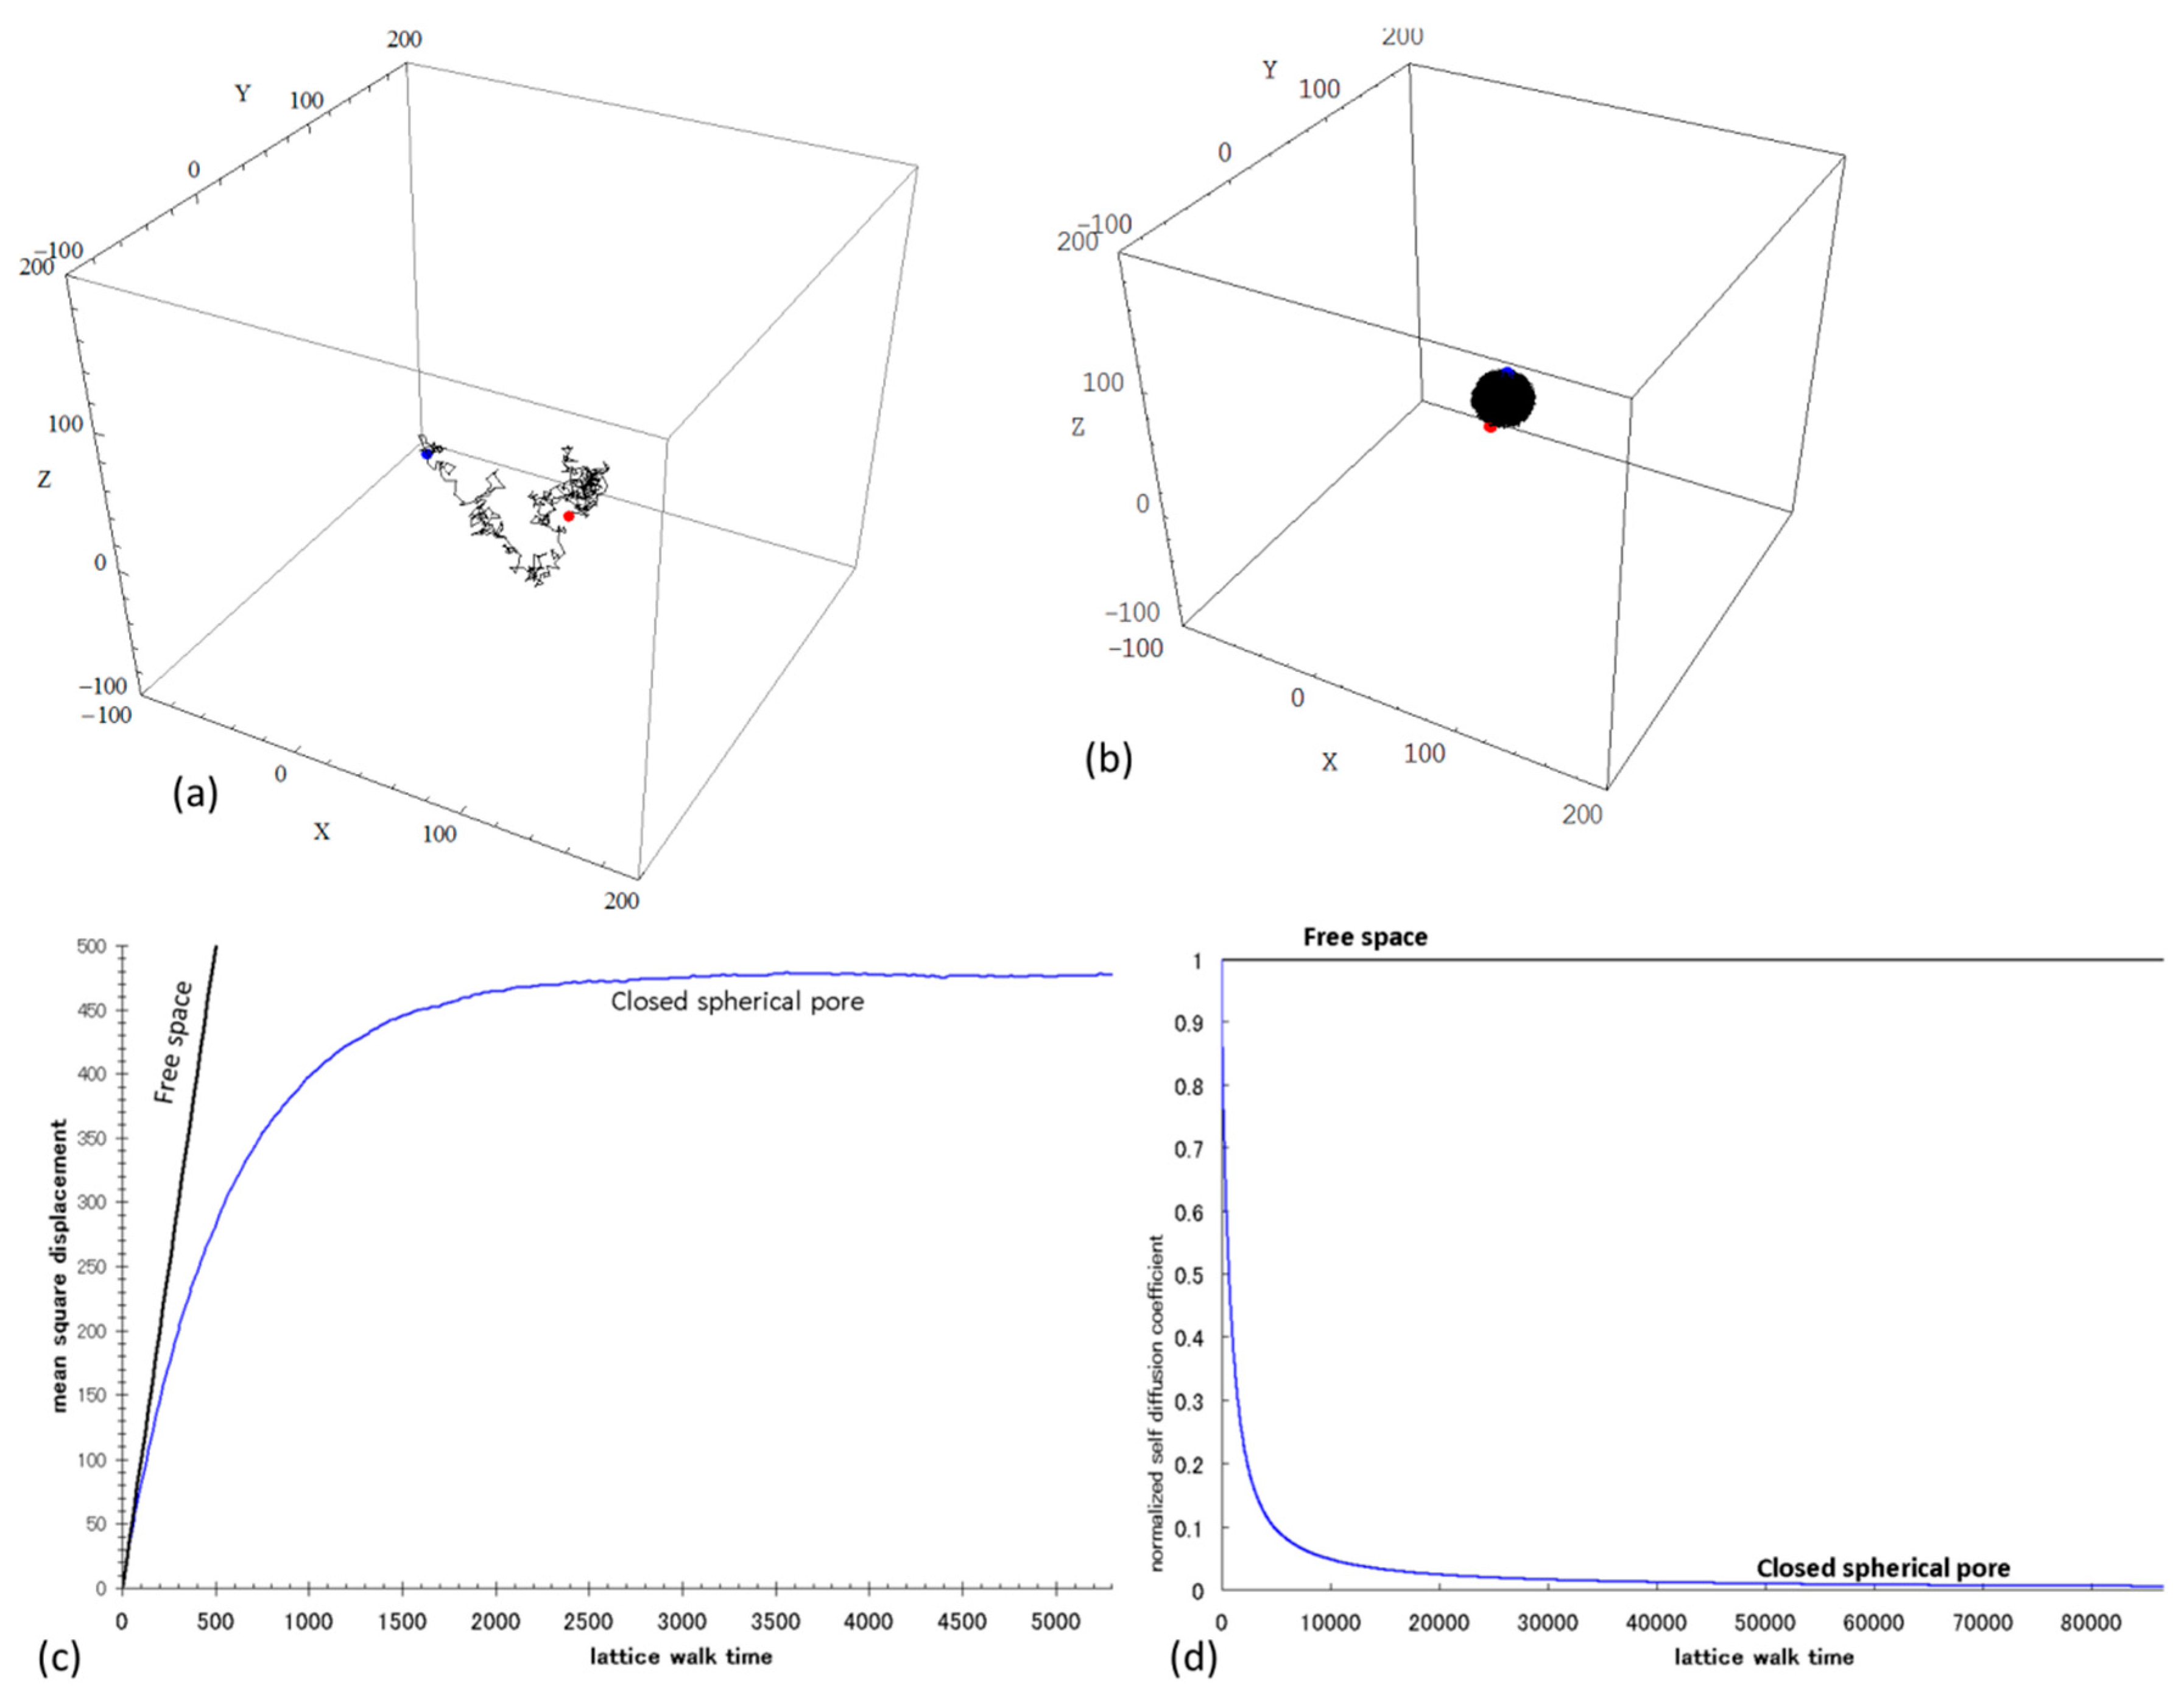
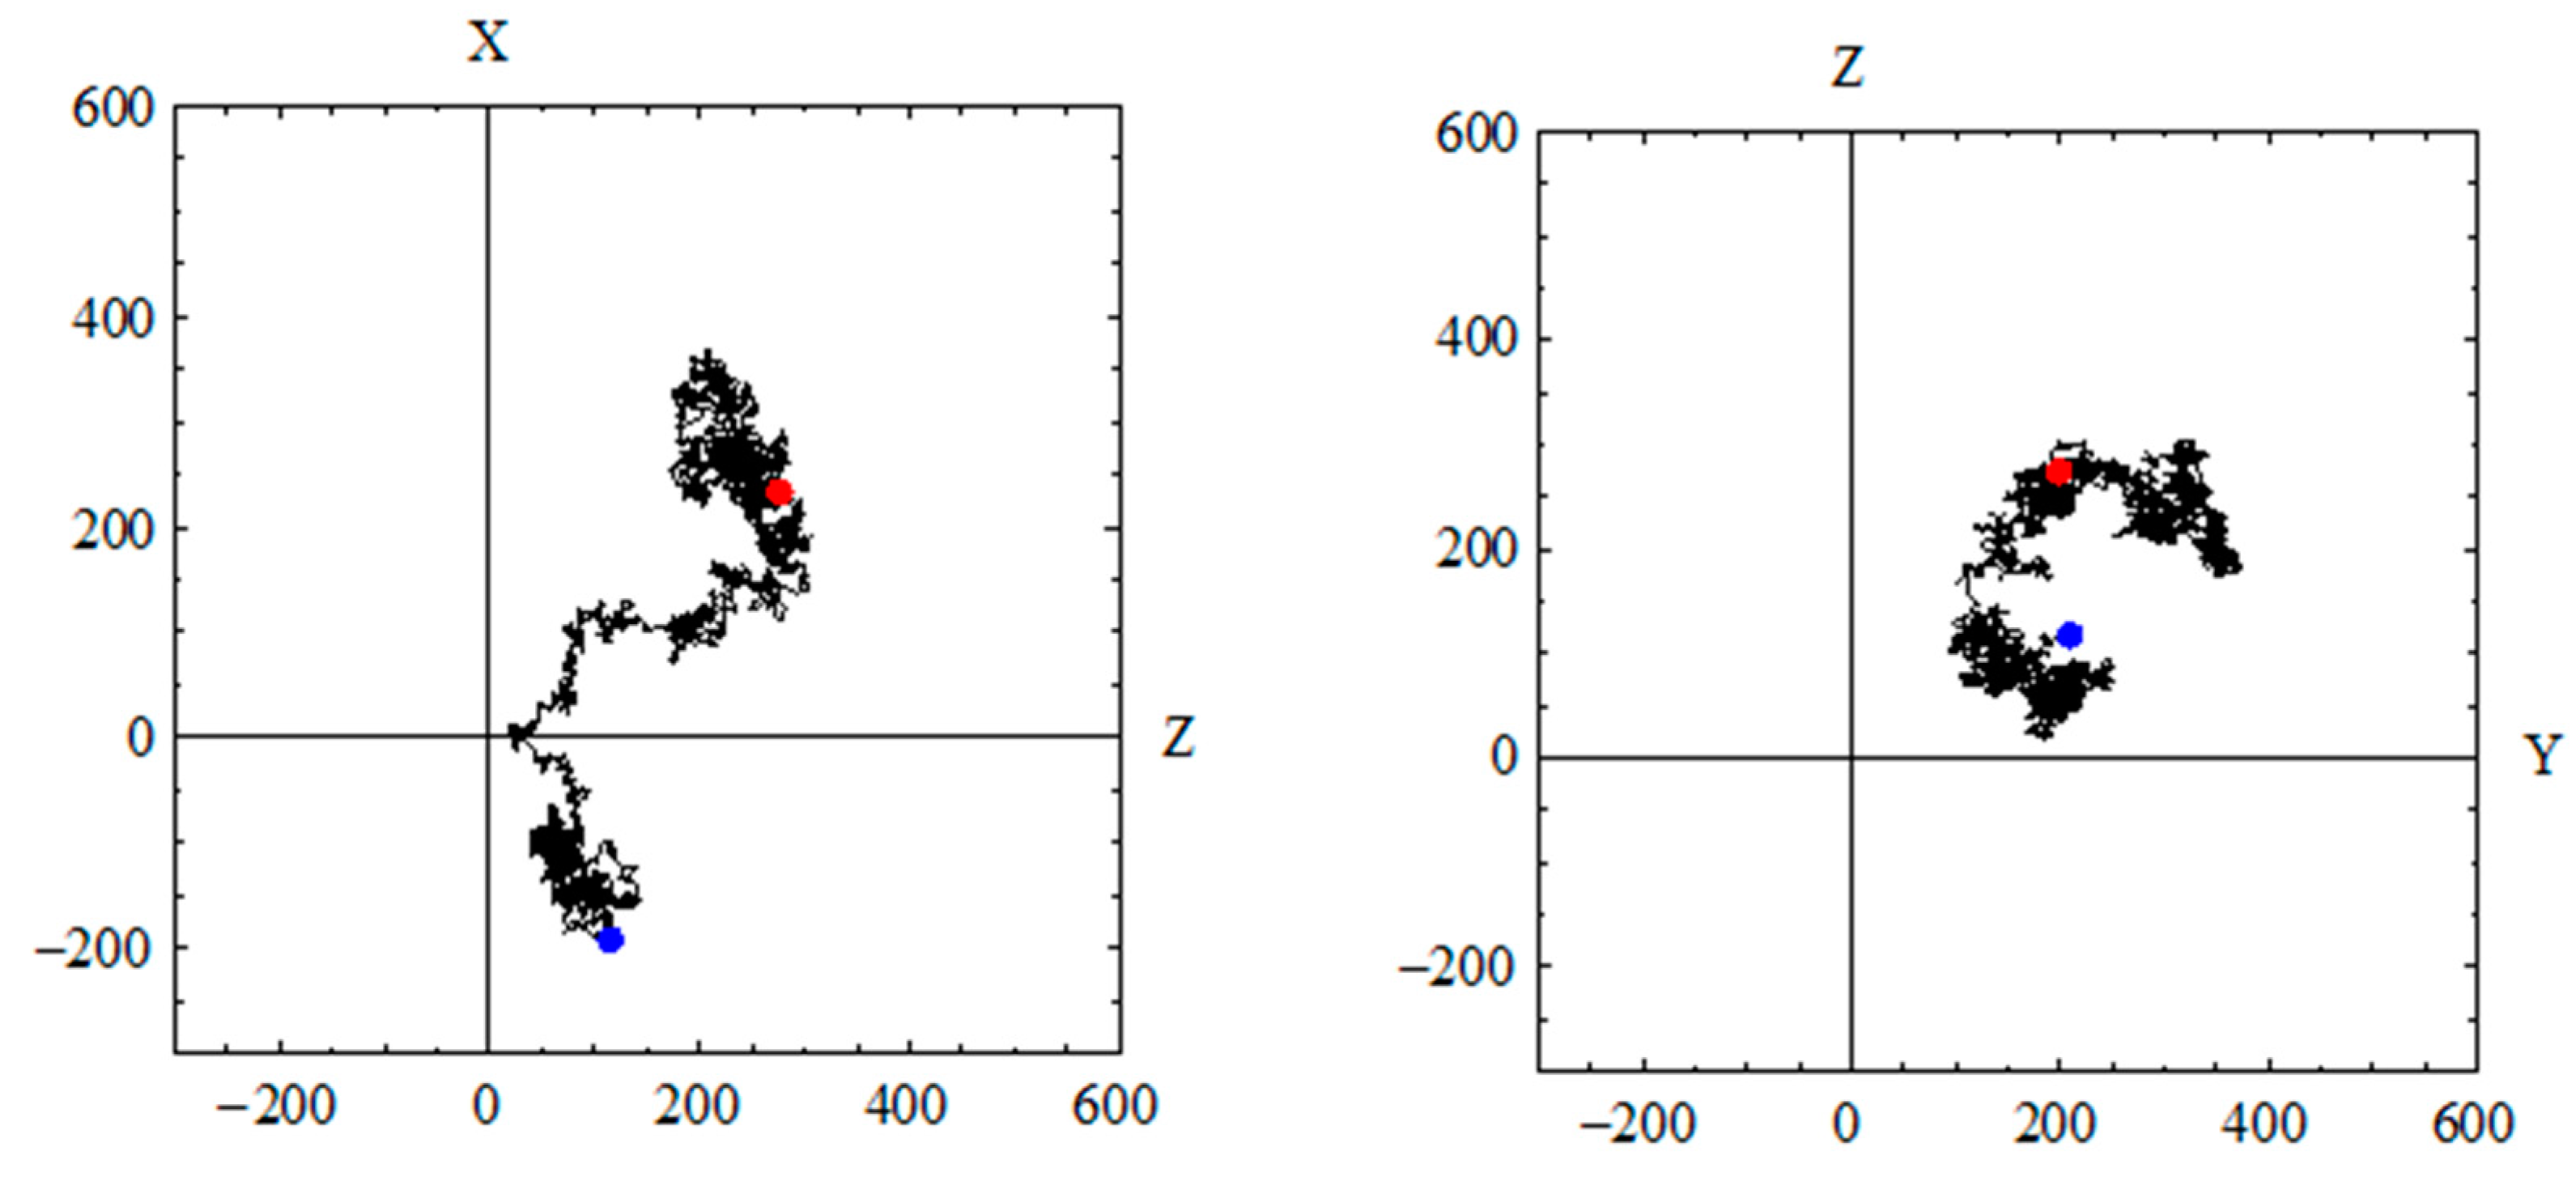
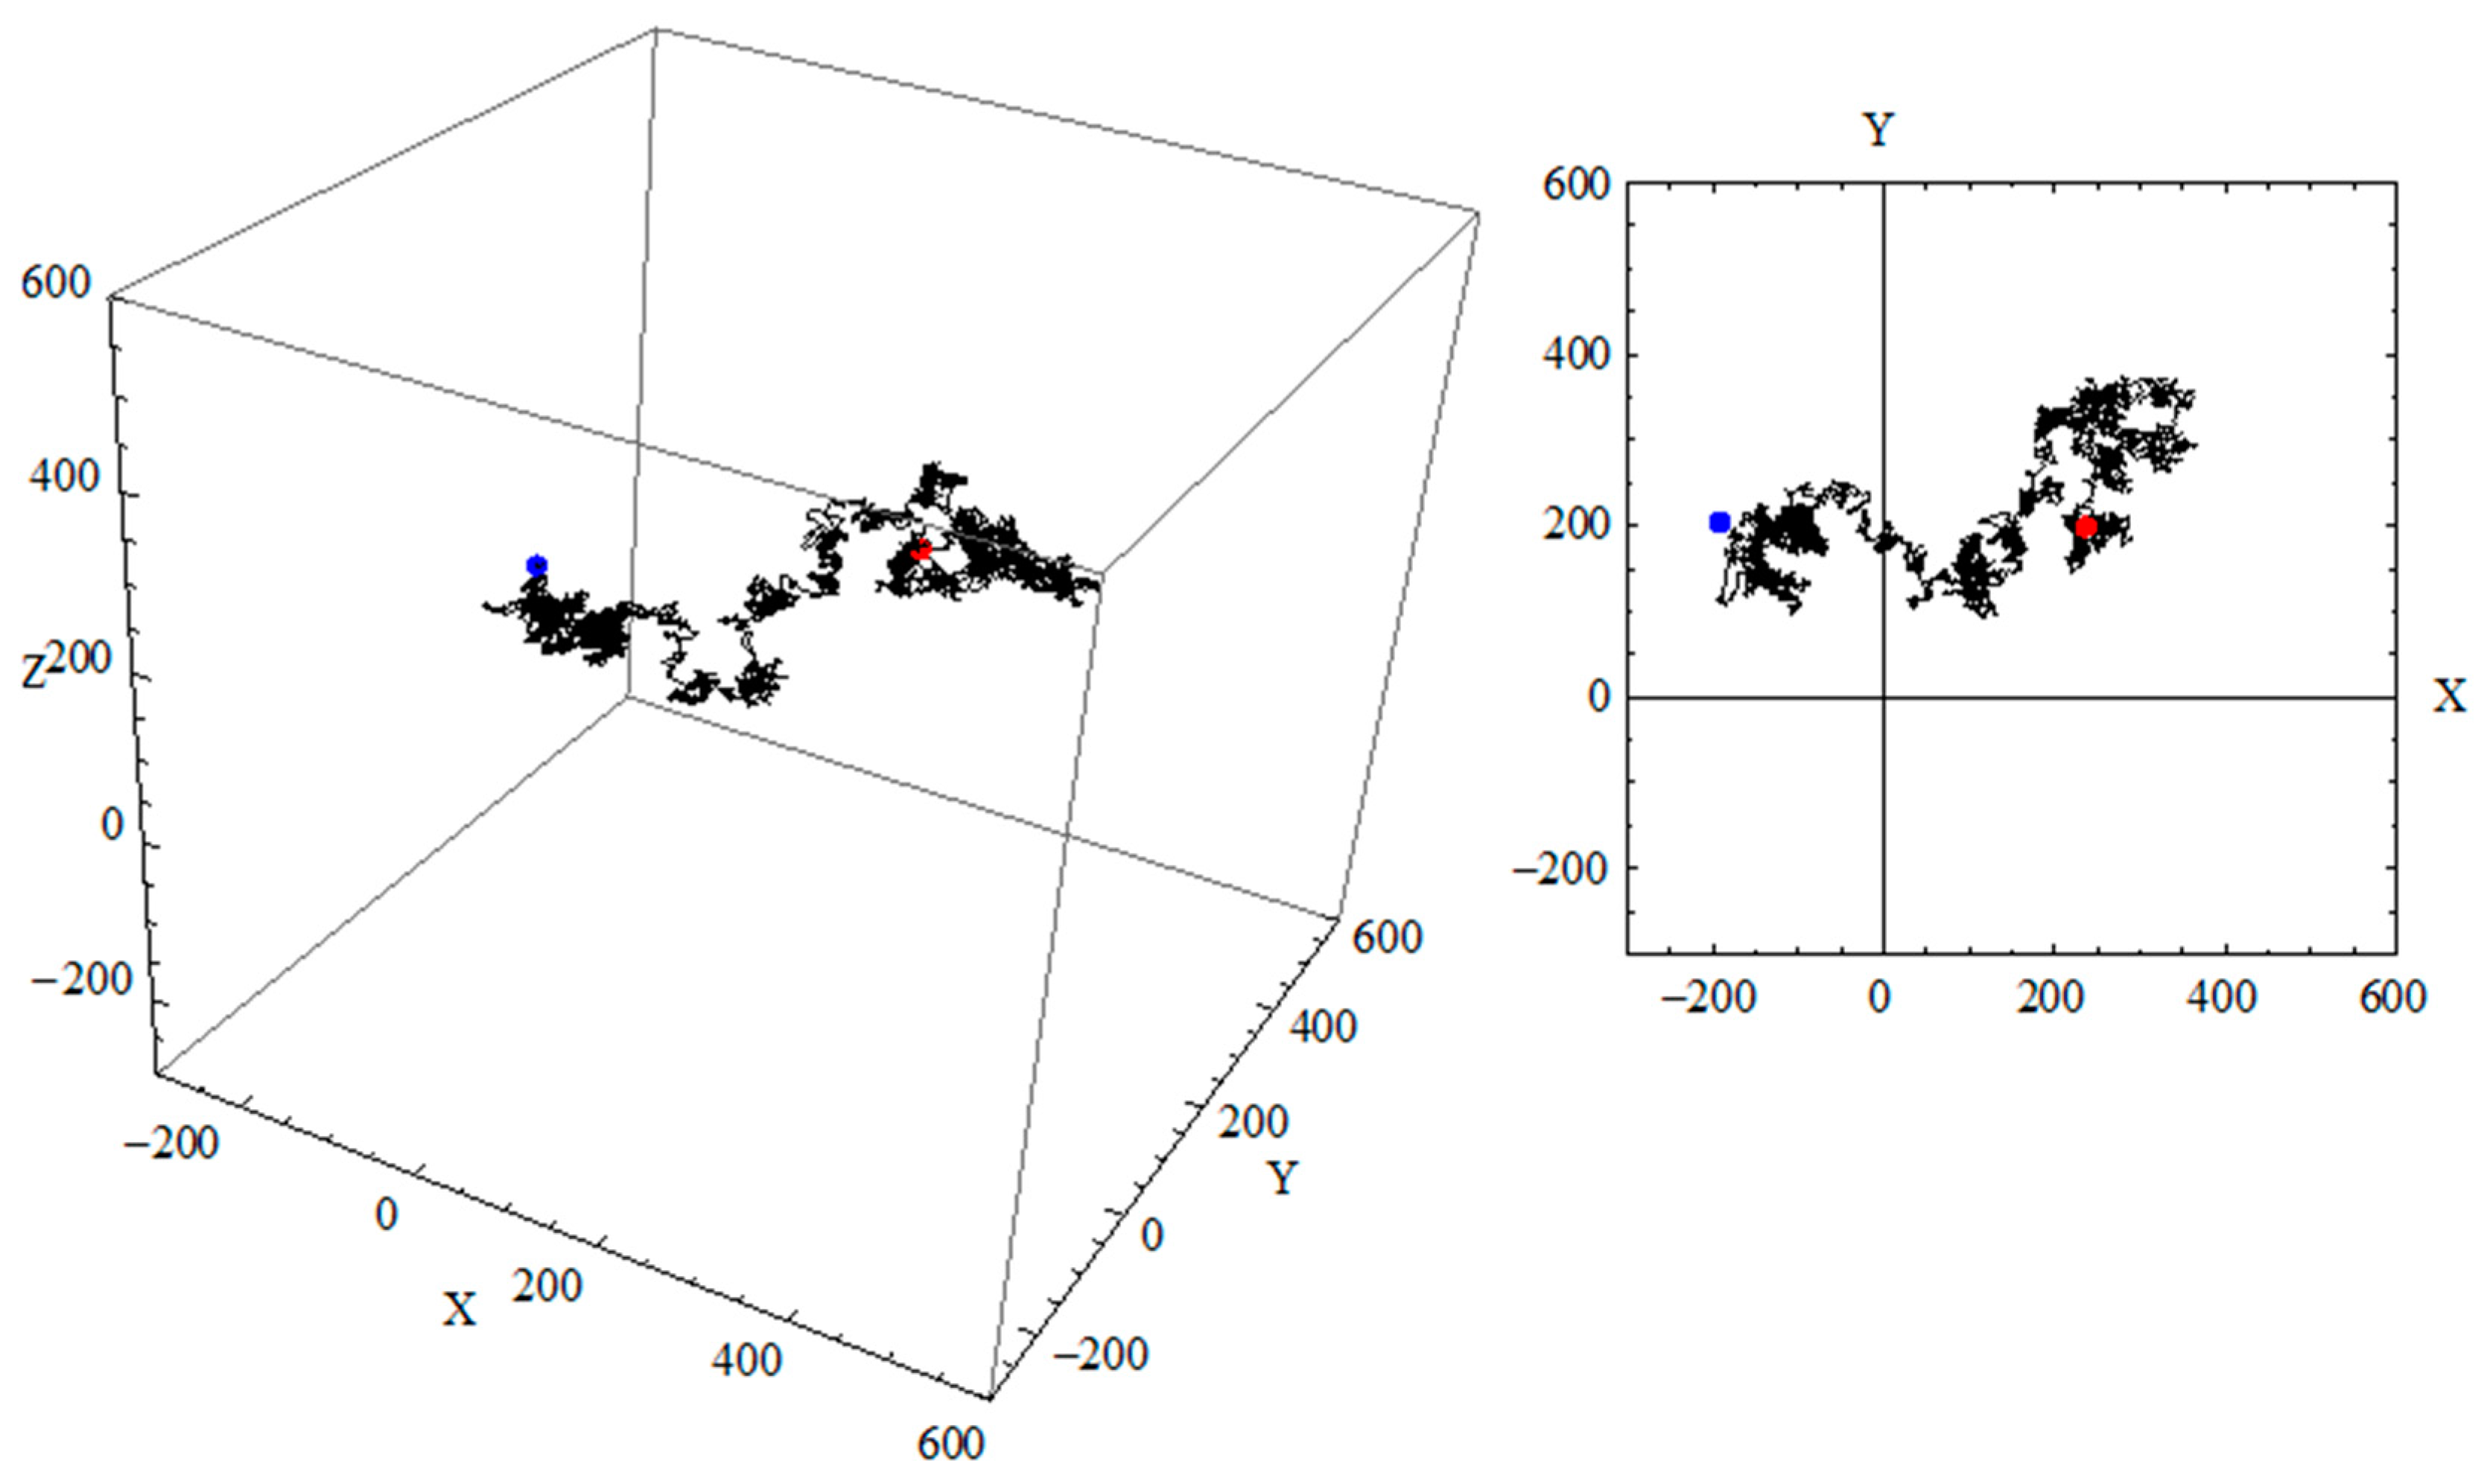
2.2.2. Tortuosity
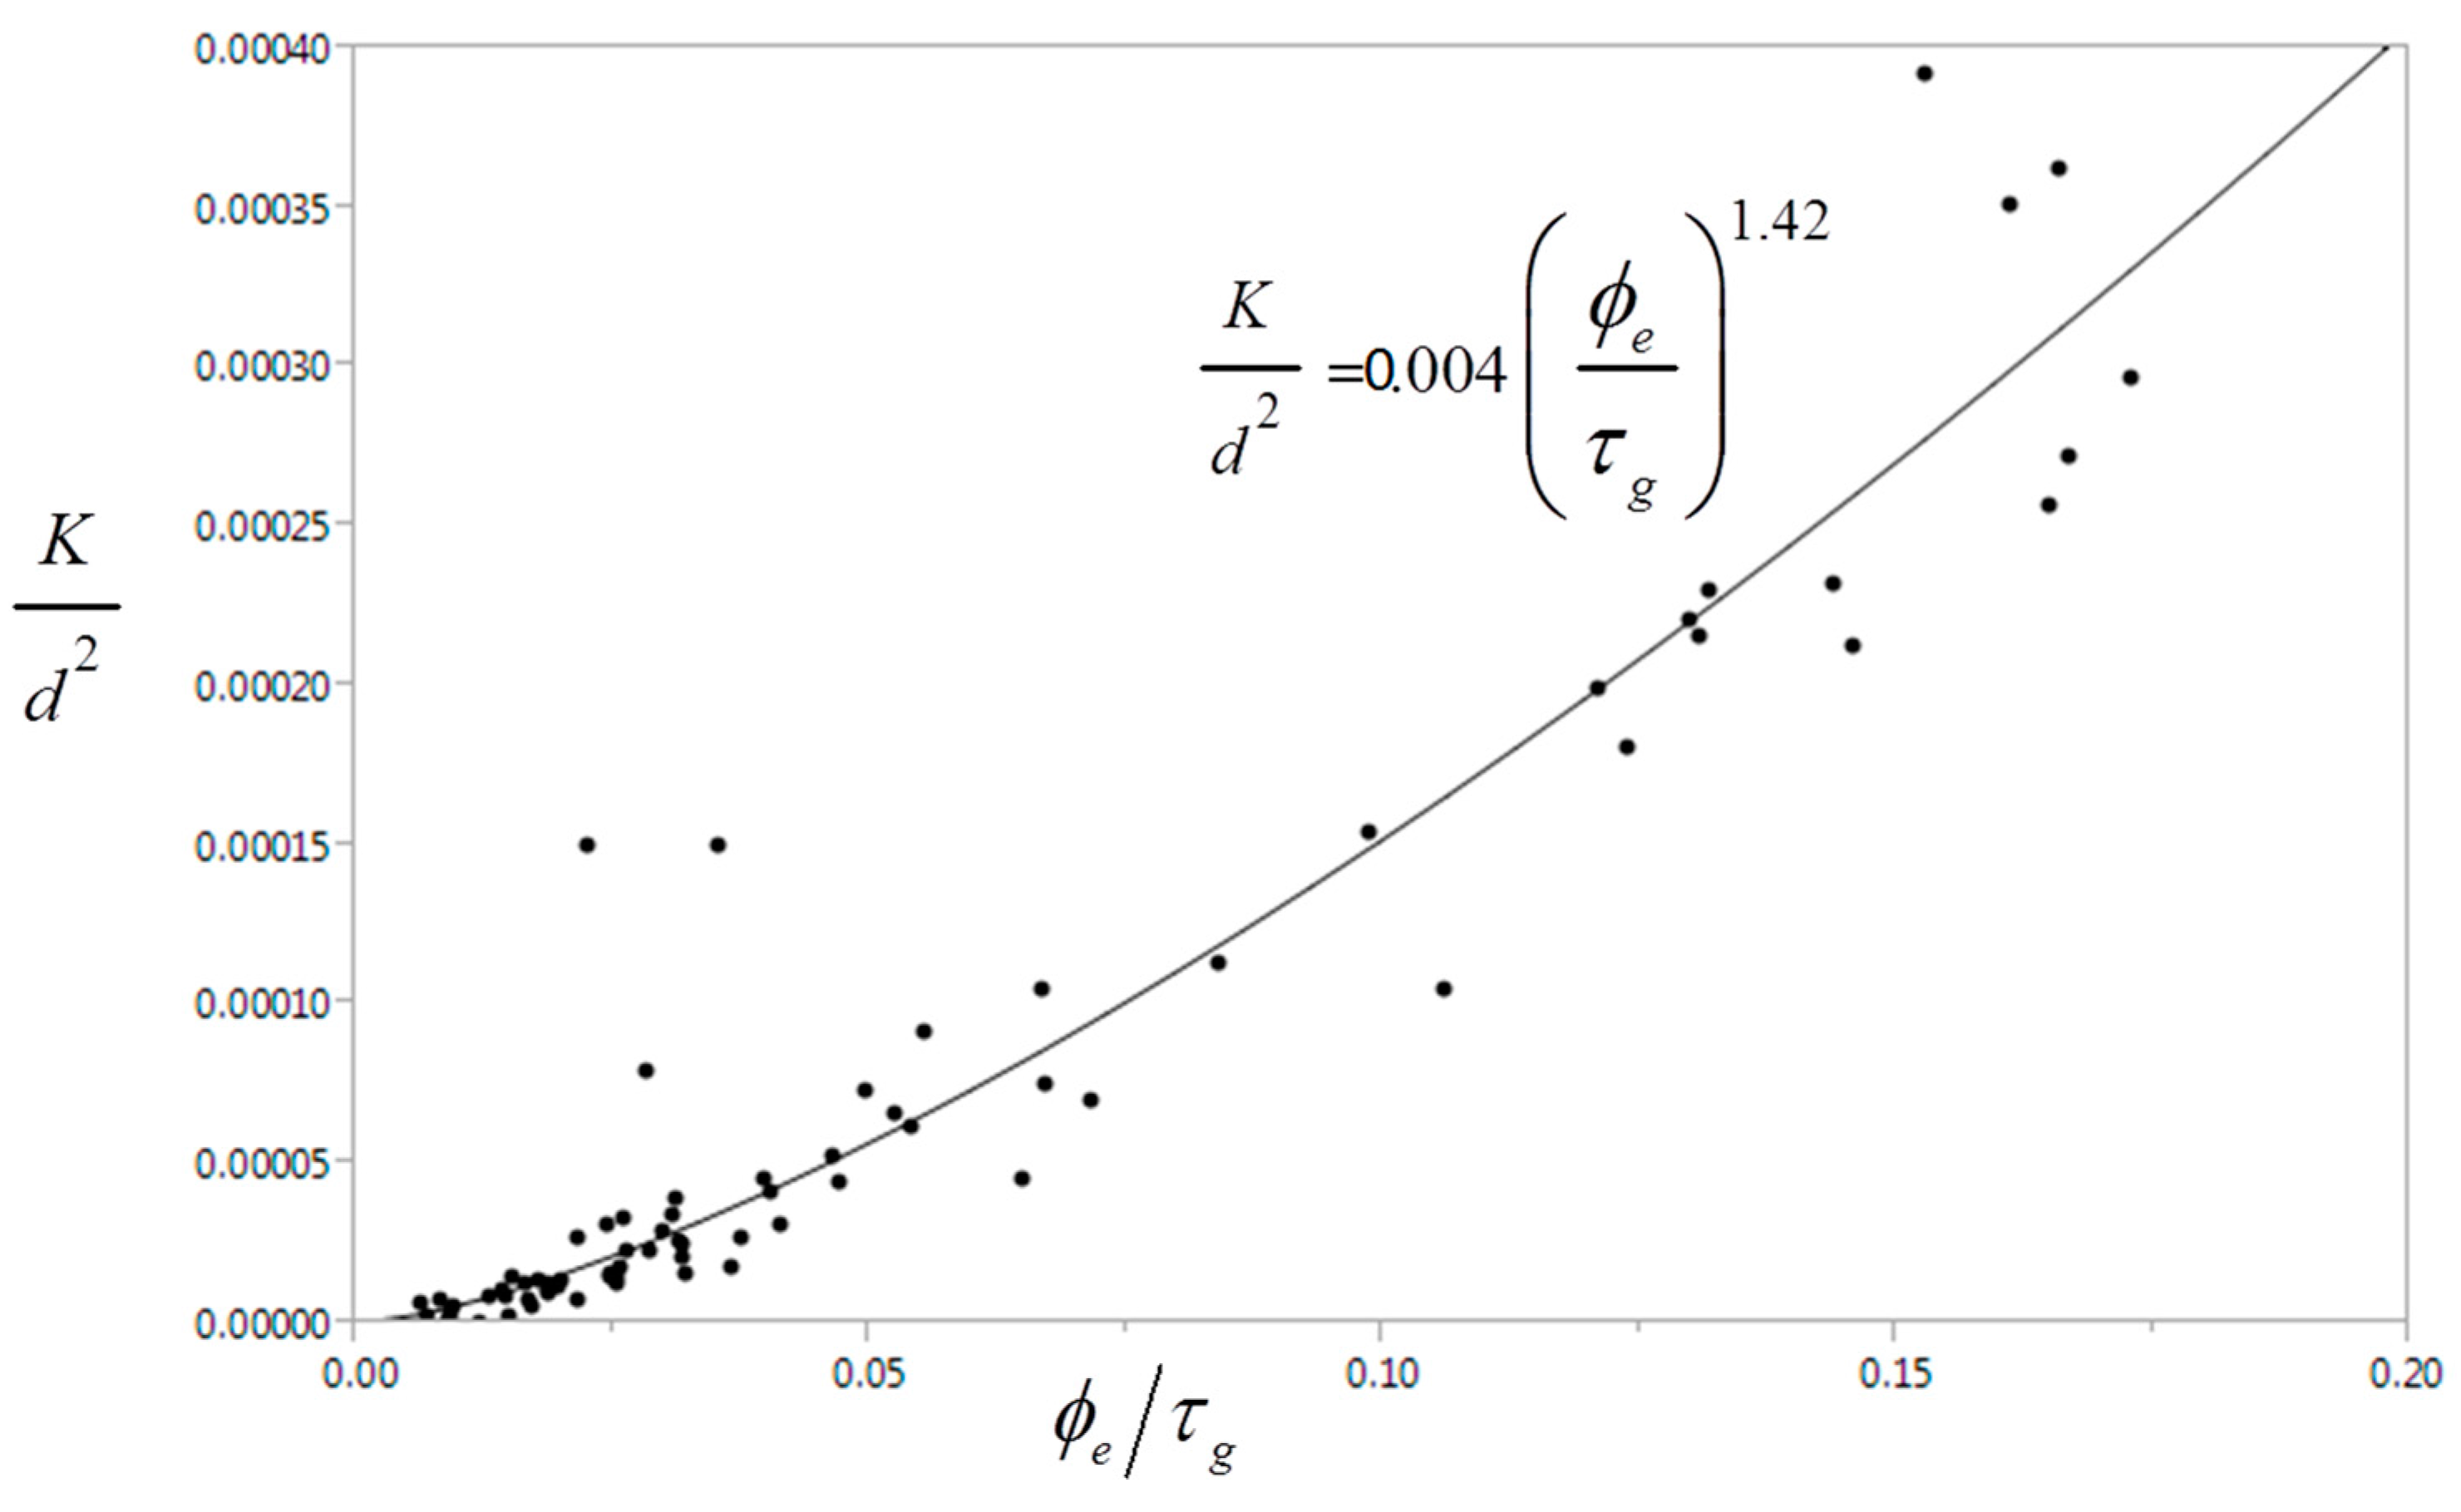
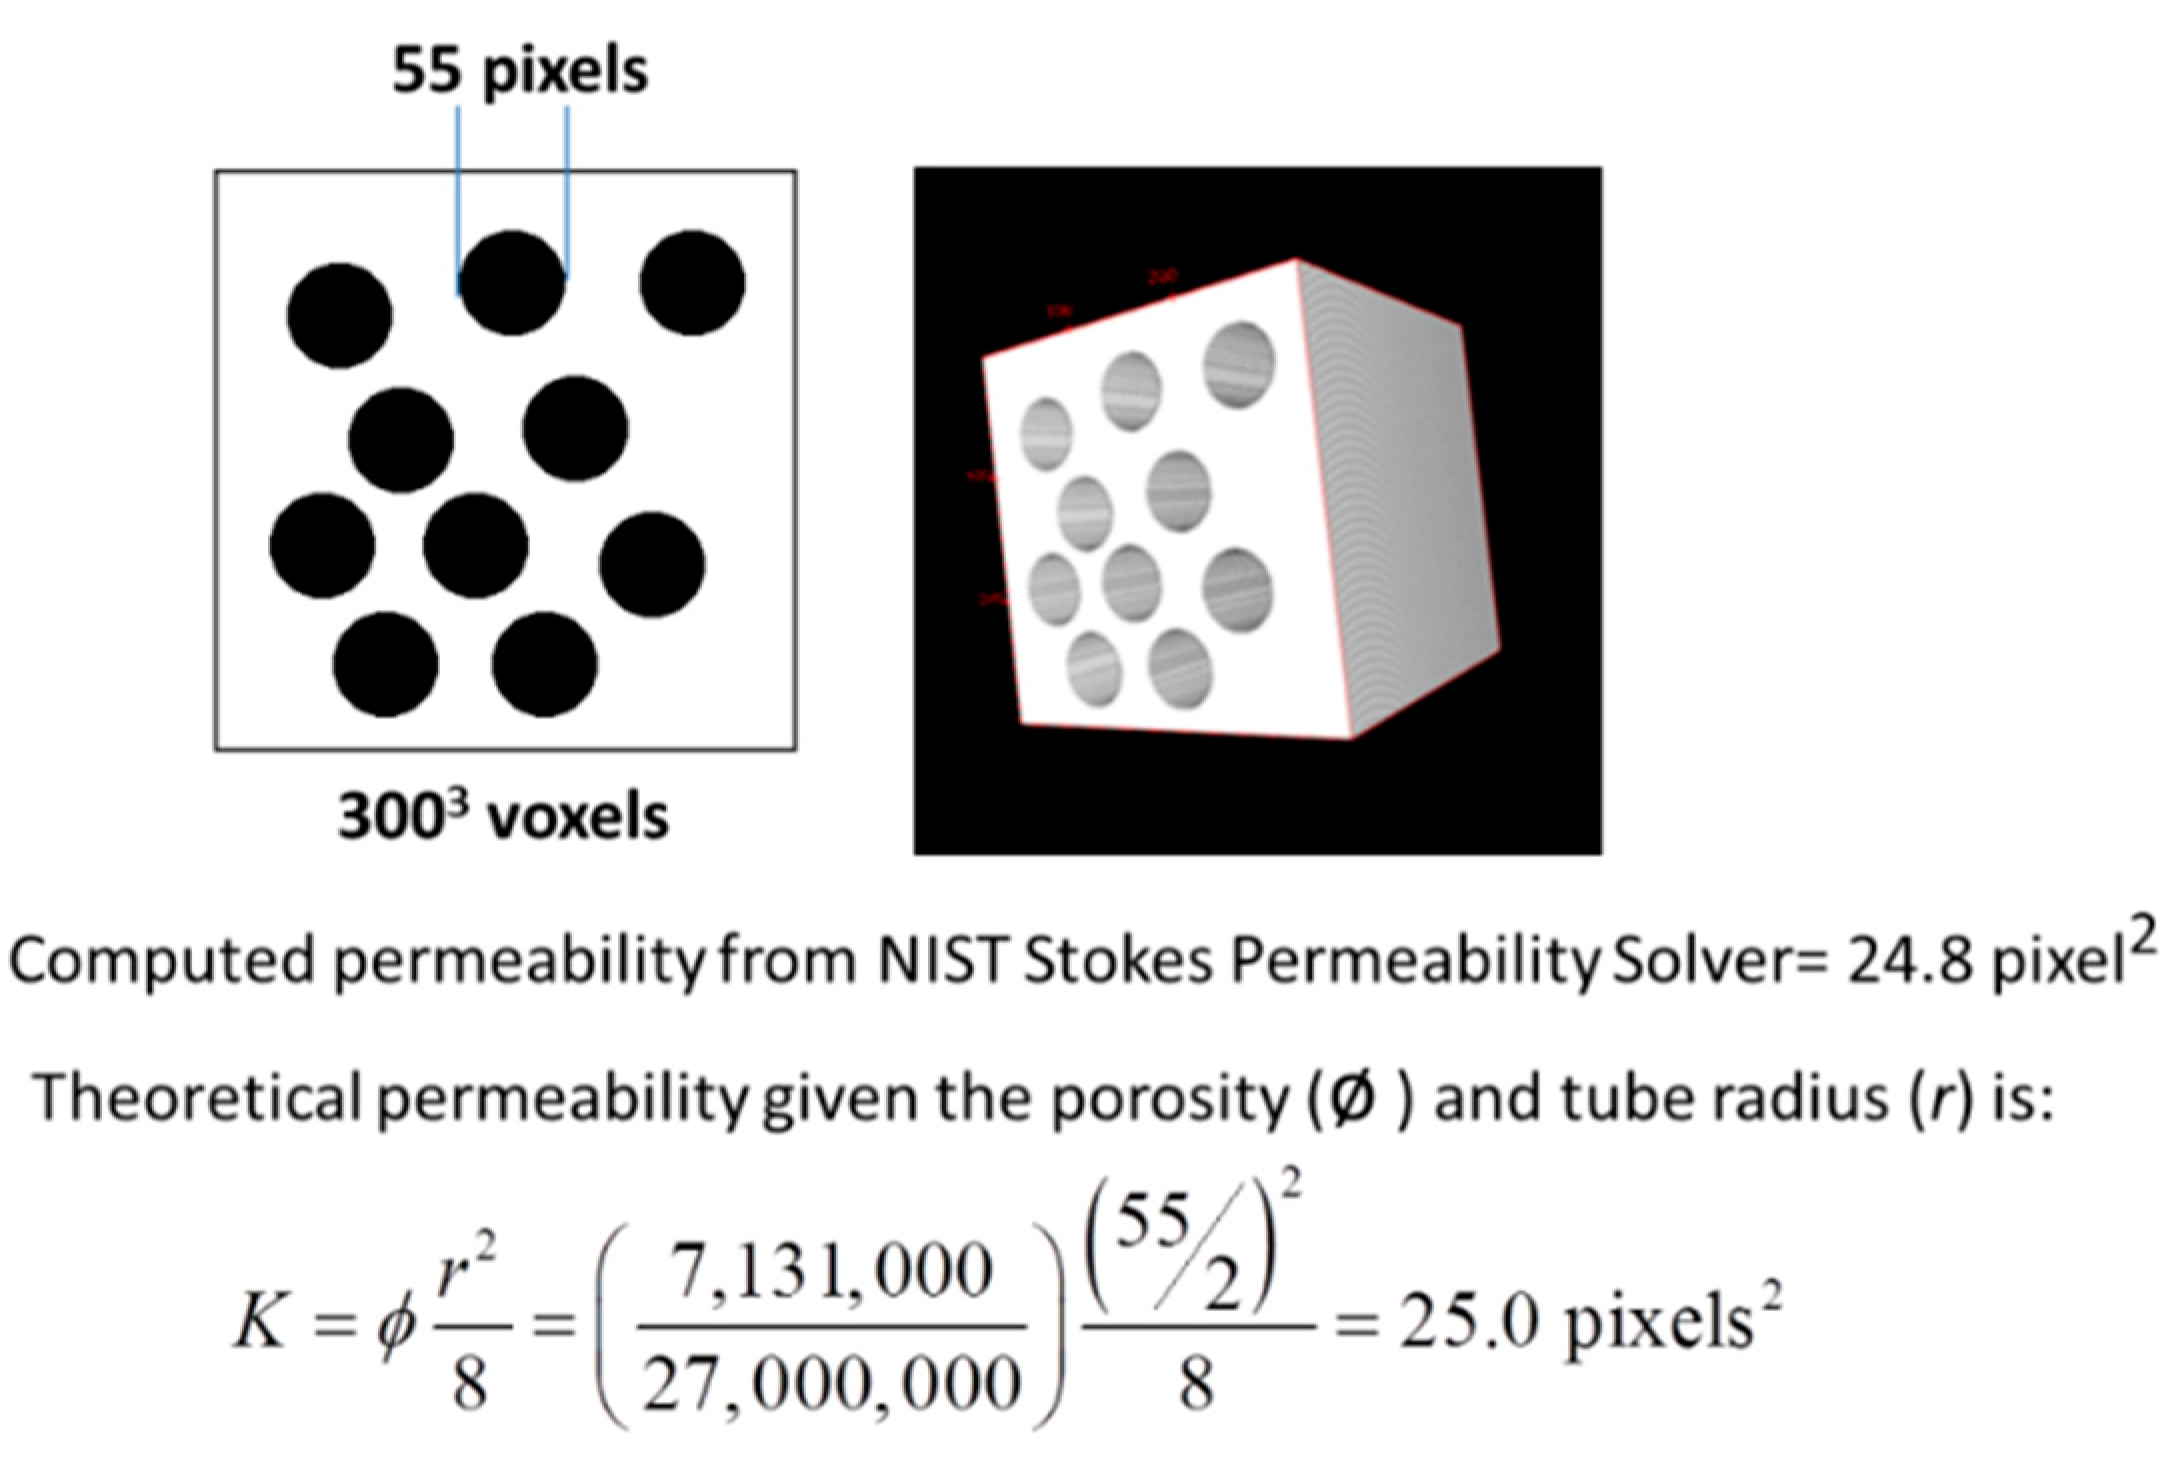
2.2.3. Permeability
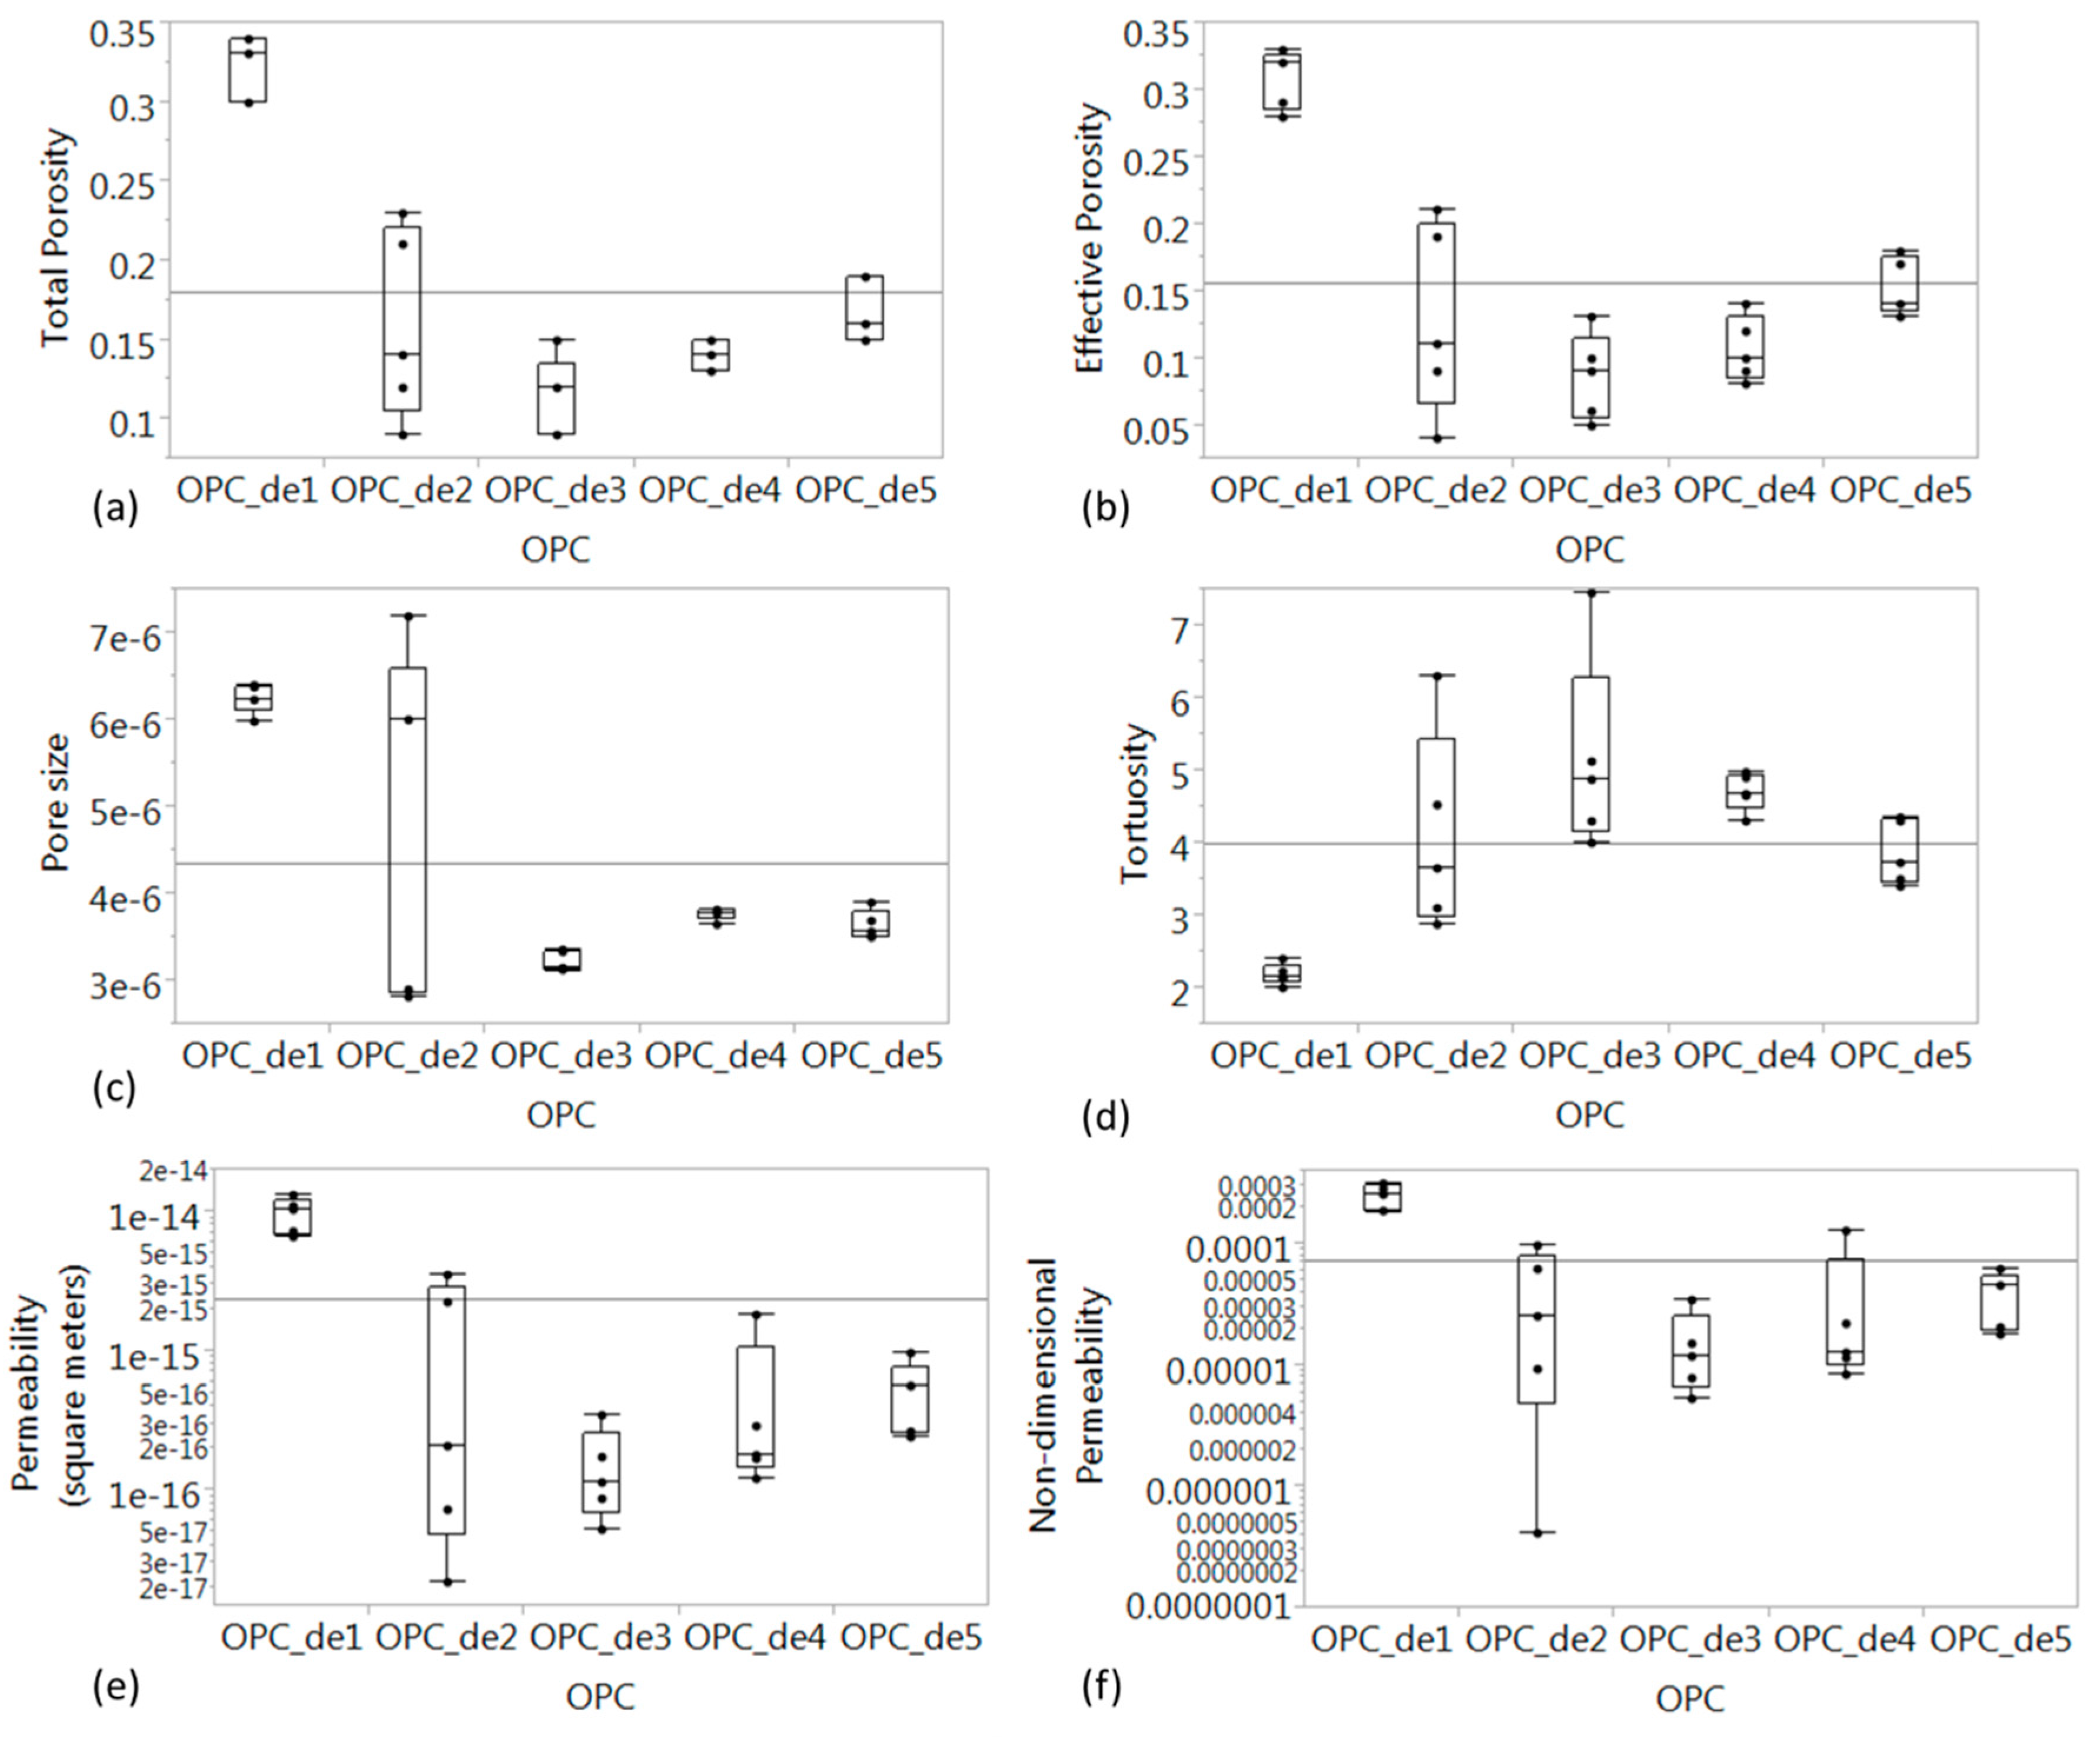
3. Results and Discussion
4. Conclusions
Acknowledgments
Author Contributions
Conflicts of Interest
References
- Bentur, A. Cementitious materials-Nine millennia and a new century: Past, present, and future. J. Mater. Civ. Eng. 2002, 14, 2–22. [Google Scholar] [CrossRef]
- Mehta, P.; Monteiro, P. Concrete: Microstructure, Properties, and Materials; McGraw-Hill Companies: New York, NY, USA, 2006. [Google Scholar]
- Basheer, L.; Kropp, J.; Cleland, D. Assessment of the durability of concrete from its permeation properties: A review. Constr. Build. Mater. 2001, 15, 93–103. [Google Scholar] [CrossRef]
- Gallé, C.; Peycelon, H.; Le Bescop, P. Effect of an accelerated chemical degradation on water permeability and pore structure of cement-based materials. Adv. Cem. Res. 2004, 16, 105–114. [Google Scholar] [CrossRef]
- Carde, C.; Francois, R. Effect of the leaching of calcium hydroxide from cement paste on mechanical and physical properties. Cem. Concr. Res. 1997, 274, 539–550. [Google Scholar] [CrossRef]
- Lin, W.; Cheng, A.; Huang, R.; Chen, C.; Zhou, X. Effect of Calcium Leaching on the Properties of Cement based Composites. J. Wuhan Univ. Technol. Mater. Sci. Ed. 2011, 26, 990–997. [Google Scholar] [CrossRef]
- Adenot, F.; Buil, M. Modelling of the corrosion of the cement paste by deionized water. Cem. Concr. Res. 1992, 22, 489–496. [Google Scholar] [CrossRef]
- Mainguy, M.; Tognazzi, C.; Torrenti, J.M.; Adenot, F. Modelling of leaching in pure cement paste and mortar. Cem. Concr. Res. 2000, 30, 83–90. [Google Scholar] [CrossRef]
- Ryu, J.S.; Otsuki, N.; Minagawa, H. Long-term forecast of Ca leaching from mortar and associated degeneration. Cem. Concr. Res. 2002, 32, 15–39. [Google Scholar] [CrossRef]
- Saito, H.; Deguchi, A. Leaching tests on different mortars using accelerated electrochemical method. Cem. Concr. Res. 2000, 30, 1815–1825. [Google Scholar] [CrossRef]
- Saito, H.; Nakane, S.; Ikari, S.; Fujiwara, A. Preliminary experimental study on the deterioration of cementations materials by an acceleration method. Nucl. Eng. Des. 1992, 138, 151–155. [Google Scholar] [CrossRef]
- Stora, E.; Bary, B.; He, Q.-C.; Deville, E.; Montarnal, P. Modelling and simulations of the chemo-mechanical behaviour of leached cement-based materials: Leaching process and induced loss of stiffness. Cem. Concr. Res. 2009, 39, 763–772. [Google Scholar] [CrossRef]
- Bernard, F.; Kamali-Bernard, S. Performance simulation and quantitative analysis of cement-based materials subjected to leaching. Comput. Mater. Sci. 2010, 50, 218–226. [Google Scholar] [CrossRef]
- Yu, Y.; Zhang, Y.X.; Khennane, A. Numerical modelling of degradation of cement-based materials under leaching and external sulfate attack. Comput. Struct. 2015, 158, 1–14. [Google Scholar] [CrossRef]
- Wan, K.; Lib, Y.; Sun, W. Experimental and modelling research of the accelerated calcium leaching of cement paste in ammonium nitrate solution. Constr. Build. Mater. 2013, 40, 832–846. [Google Scholar] [CrossRef]
- Sugiyama, T.; Promentilla, M.A.B.; Hitomi, T.; Takeda, N. Application of synchrotron microtomography for pore structure characterization of deteriorated cementitious materials due to leaching. Cem. Concr. Res. 2010, 40, 1265–1270. [Google Scholar] [CrossRef]
- Burlion, N.; Bernard, D.; Chen, D. X-ray microtomography: Application to microstructure analysis of a cementitious material during leaching process. Cem. Concr. Res. 2006, 36, 346–357. [Google Scholar] [CrossRef]
- Zhang, M.; Ye, G.; van Breugel, K. Microstructure-based modeling of permeability of cementitious materials using multiple-relaxation-time lattice Boltzmann method. Comput. Mater. Sci. 2013, 68, 142–151. [Google Scholar] [CrossRef]
- Zhang, M.; Ye, G.; van Breugel, K. Multiscale lattice Boltzmann-finite element modelling of chloride diffusivity in cementitious materials. Part II: Simulation results and validation. Mech. Res. Commun. 2014, 58, 64–72. [Google Scholar] [CrossRef]
- Wong, H.S.; Zimmerman, R.; Buenfeld, N. Estimating the permeability of cement pastes and mortars using image analysis and effective medium theory. Cem. Concr. Res. 2012, 42, 476–483. [Google Scholar] [CrossRef]
- Wong, H.S.; Buenfeld, N.R.; Head, M.K. Estimating transport properties of mortars using image analysis on backscattered electron images. Cem. Concr. Res. 2006, 36, 1556–1566. [Google Scholar] [CrossRef]
- Promentilla, M.A.B.; Sugiyama, T.; Hitomi, T.; Takeda, N. Quantification of tortuosity in hardened cement pastes using synchrotron-based X-ray computed microtomography. Cem. Concr. Res. 2009, 39, 548–557. [Google Scholar] [CrossRef]
- Promentilla, M.A.B.; Sugiyama, T.; Hitomi, T.; Takeda, N. Characterizing the 3D pore structure of hardened cement paste with synchrotron microtomography. J. Adv. Concr. Technol. 2008, 6, 273–286. [Google Scholar] [CrossRef]
- Hu, J.; Stroeven, P. Local porosity analysis of pore structure in cement paste. Cem. Concr. Res. 2005, 35, 233–242. [Google Scholar] [CrossRef]
- Bentz, D.P. Quantitative Comparison of Real and CEMHYD3D Model Microstructures Using Correlation Functions. Cem. Concr. Res. 2006, 36, 259–263. [Google Scholar] [CrossRef]
- Zhang, M.; He, Y.; Ye, G.; Lange, D.; van Breugel, K. Computational investigation on mass diffusivity in Portland cement paste based on X-ray computed microtomography (CT) image. Constr. Build. Mater. 2012, 27, 472–481. [Google Scholar] [CrossRef]
- Karim, M.; Krabbenhoft, K. Extraction of Effective Cement Paste Diffusivities from X-ray Microtomography Scans. Transp. Porous Media 2010, 84, 371–388. [Google Scholar] [CrossRef]
- Stora, E.; Bary, B.; He, Q.C.; Deville, E.; Montarna, P. Modelling and simulations of the chemo-mechanical behaviour of leached cement-based materials: Interactions between damage and leaching. Cem. Concr. Res. 2010, 40, 1226–1236. [Google Scholar] [CrossRef]
- Zhang, M.; Jivkov, A. Microstructure-informed modelling of damage evolution in cement paste. Constr. Build. Mater. 2014, 66, 731–742. [Google Scholar] [CrossRef]
- Bangert, F.; Grasberger, S.; Kuhl, D.; Meschke, G. Environmentally induced deterioration of concrete: Physical motivation and numerical modelling. Eng. Fract. Mech. 2003, 70, 891–910. [Google Scholar] [CrossRef]
- Wong, H.S.; Head, M.K.; Buenfeld, N.R. Pore segmentation of cement-based materials from backscattered electron images. Cem. Concr. Res. 2006, 36, 1083–1090. [Google Scholar] [CrossRef]
- Hoshen, J.; Kopelman, R. Percolation and cluster distribution. I. Cluster multiple labeling technique and critical concentration algorithm. Phys. Rev. B 1976, 14, 34–38. [Google Scholar] [CrossRef]
- Rasband, W. ImageJ: Image Processing and Analysis in Java, National Health Institute (NIH). Available online: http://rsb.info.nih.gov/ij/ (accessed on 16 May 2016).
- Nakano, T.; Tsuchiyama, A.; Uesugi, K.; Uesugi, M.; Shinohara, K. SLICE–Software for basic 3-D image analysis. Available online: http://www-bl20.spring8.or.jp/slice/ (accessed on 16 May 2016).
- Doube, M.; Kosowski, M.; Arganda-Carreras, I.; Cordelières, F.; Dougherty, R.P.; Jackson, J.; Schmid, B.; Hutchinson, J.R.; Shefelbine, S.J. BoneJ: Free and extensible bone image analysis in ImageJ. Bone 2010, 47, 1076–1079. [Google Scholar] [CrossRef] [PubMed]
- Promentilla, M.A.; Sugiyama, T. X-ray Microtomography of Mortars Exposed to Freezing-Thawing Action. J. Adv. Concr. Technol. 2010, 8, 97–111. [Google Scholar] [CrossRef]
- Hildebrand, T.; Ruegsegger, P. A new method for the model-independent assessment of thickness in three-dimensional images. J. Microsc. 1997, 185, 67–75. [Google Scholar] [CrossRef]
- Dougherty, R.; Kunzelmann, K. Computing local thickness of 3D structures with ImageJ. Microsc. Microanal. 2007, 13, 1678–1679. [Google Scholar] [CrossRef]
- Promentilla, M.A.; Sugiyama, T. Application of Microfocus X-ray CT to Investigate the Frost-Induced Damage Process in Cement-Based Materials. In Advances in Computed Tomography for Geomaterials: GeoX 2010; Alshibli, K.A., Reed, A.H., Eds.; John Wiley & Sons, Inc.: Hoboken, NJ, USA, 2010. [Google Scholar]
- Darma, I.S.; Sugiyama, T.; Promentilla, M.A.B. X-ray CT to study diffusivity in cracked concrete through the observation of tracer transport. J. Adv. Concr. Technol. 2013, 11, 266–281. [Google Scholar] [CrossRef]
- Nakashima, Y.; Kamiya, S. Mathematica programs for the analysis of three-dimensional pore connectivity and anisotropic tortuosity of porous rocks using X-ray microtomography. J. Nucl. Sci. Technol. 2007, 44, 1233–1247. [Google Scholar] [CrossRef]
- Ma, H.; Hou, D.; Li, Z. Two-scale modeling of transport properties of cement paste: Formation factor, electrical conductivity and chloride diffusivity. Comput. Mater. Sci. 2015, 110, 270–280. [Google Scholar] [CrossRef]
- Stauffer, D.; Aharony, A. Introduction to Percolation Theory, Revised; Taylor and Francis: London, UK, 1994. [Google Scholar]
- Bentz, D.; Martys, N. A Stokes Permeability Solver for Three Dimensional Porous Media. Available online: http://concrete.nist.gov/~bentz/NISTIR7416.pdf (accessed on 16 May 2016).
- Sun, X.; Daia, Q.; Ng, K. Computational investigation of pore permeability and connectivity from transmission X-ray microscope images of a cement paste specimen. Constr. Build. Mater. 2014, 68, 240–251. [Google Scholar] [CrossRef]
- Bentz, D.P. Virtual pervious concrete: Microstructure, percolation, and permeability. ACI Mater. J. 2008, 105, 297–301. [Google Scholar]
- Ahmad, S.; Azad, A.K. An exploratory study on correlating the permeability of concrete with its porosity and tortuosity. Adv. Cem. Res. 2013, 25, 288–294. [Google Scholar] [CrossRef]
- Ma, H.; Xu, B.; Liu, J.; Pei, H.; Li, Z. Effects of water content, magnesia-to-phosphate molar ratio and age on pore structure, strength and permeability of magnesium potassium phosphate cement paste. Mater. Des. 2014, 64, 497–502. [Google Scholar] [CrossRef]
- Koster, M.; Hannawald, J.; Brameshuber, W. Simulation of water permeability and water vapor diffusion through hardened cement paste. Comput. Mech. 2006, 37, 163–172. [Google Scholar] [CrossRef]
- Ma, H.; Li, Z. Realistic pore structure of Portland cement paste: Experimental study and numerical simulation. Comput. Concr. 2013, 11, 317–336. [Google Scholar] [CrossRef]
- Ma, H.; Hou, D.; Lu, Y.; Li, Z. Two-scale modeling of the capillary network in hydrated cement paste. Constr. Build. Mater. 2014, 64, 11–21. [Google Scholar] [CrossRef]


| Model | a | b | c | r 1 | RMSE 1 | Fitting Parameter |
|---|---|---|---|---|---|---|
| 0.0017 | 1 | −1 | 0.929 | 3.61 × 10⁻⁵ | a | |
| 0.0044 | 2.44 | 0 | 0.933 | 3.54 × 10⁻⁵ | a,b | |
| 0.0026 | 0 | −3.17 | 0.917 | 3.92 × 10⁻⁵ | a,c | |
| 0.0040 | 1.71 | −1 | 0.950 | 3.05 × 10⁻⁵ | a,b | |
| 0.0033 | 1 | −1.81 | 0.949 | 3.09 × 10⁻⁵ | a,c | |
| 0.0040 | 1.42 | (−b) | 0.952 | 3.01 × 10⁻⁵ | a,b | |
| 0.0040 | 1.43 | −1.36 | 0.952 | 3.03 × 10⁻⁵ | a,b,c |
© 2016 by the authors; licensee MDPI, Basel, Switzerland. This article is an open access article distributed under the terms and conditions of the Creative Commons Attribution (CC-BY) license (http://creativecommons.org/licenses/by/4.0/).
Share and Cite
Promentilla, M.A.B.; Cortez, S.M.; Papel, R.A.D.; Tablada, B.M.; Sugiyama, T. Evaluation of Microstructure and Transport Properties of Deteriorated Cementitious Materials from Their X-ray Computed Tomography (CT) Images. Materials 2016, 9, 388. https://doi.org/10.3390/ma9050388
Promentilla MAB, Cortez SM, Papel RAD, Tablada BM, Sugiyama T. Evaluation of Microstructure and Transport Properties of Deteriorated Cementitious Materials from Their X-ray Computed Tomography (CT) Images. Materials. 2016; 9(5):388. https://doi.org/10.3390/ma9050388
Chicago/Turabian StylePromentilla, Michael Angelo B., Shermaine M. Cortez, Regina Anne DC. Papel, Bernadette M. Tablada, and Takafumi Sugiyama. 2016. "Evaluation of Microstructure and Transport Properties of Deteriorated Cementitious Materials from Their X-ray Computed Tomography (CT) Images" Materials 9, no. 5: 388. https://doi.org/10.3390/ma9050388