
Synthesis and Characterization of Gd2O3 Hollow Microspheres Using a Template-Directed Method


Abstract
:1. Introduction
2. Experimental Section
2.1. Materials
2.2. Preparation of Monodisperse Carbon Spheres
2.3. Synthesis of Gd2O3 Hollow Microspheres
2.4. Characterization of Gd2O3 Hollow Microspheres
2.5. Photocatalytic Activity Measurement
3. Results and Discussion
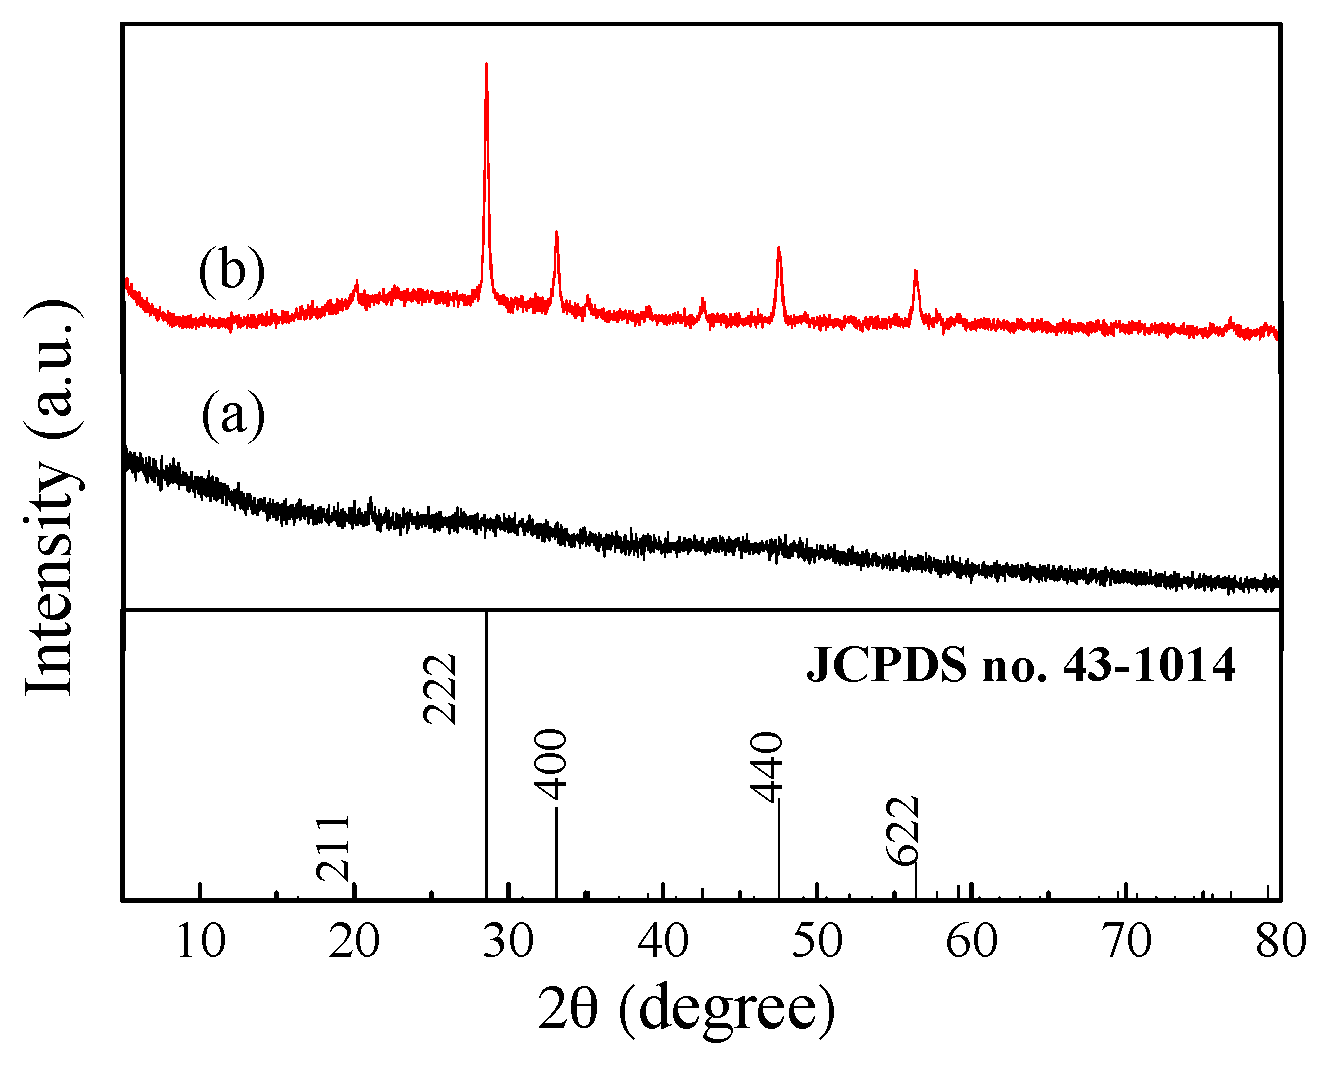
3.1. XRD Analysis
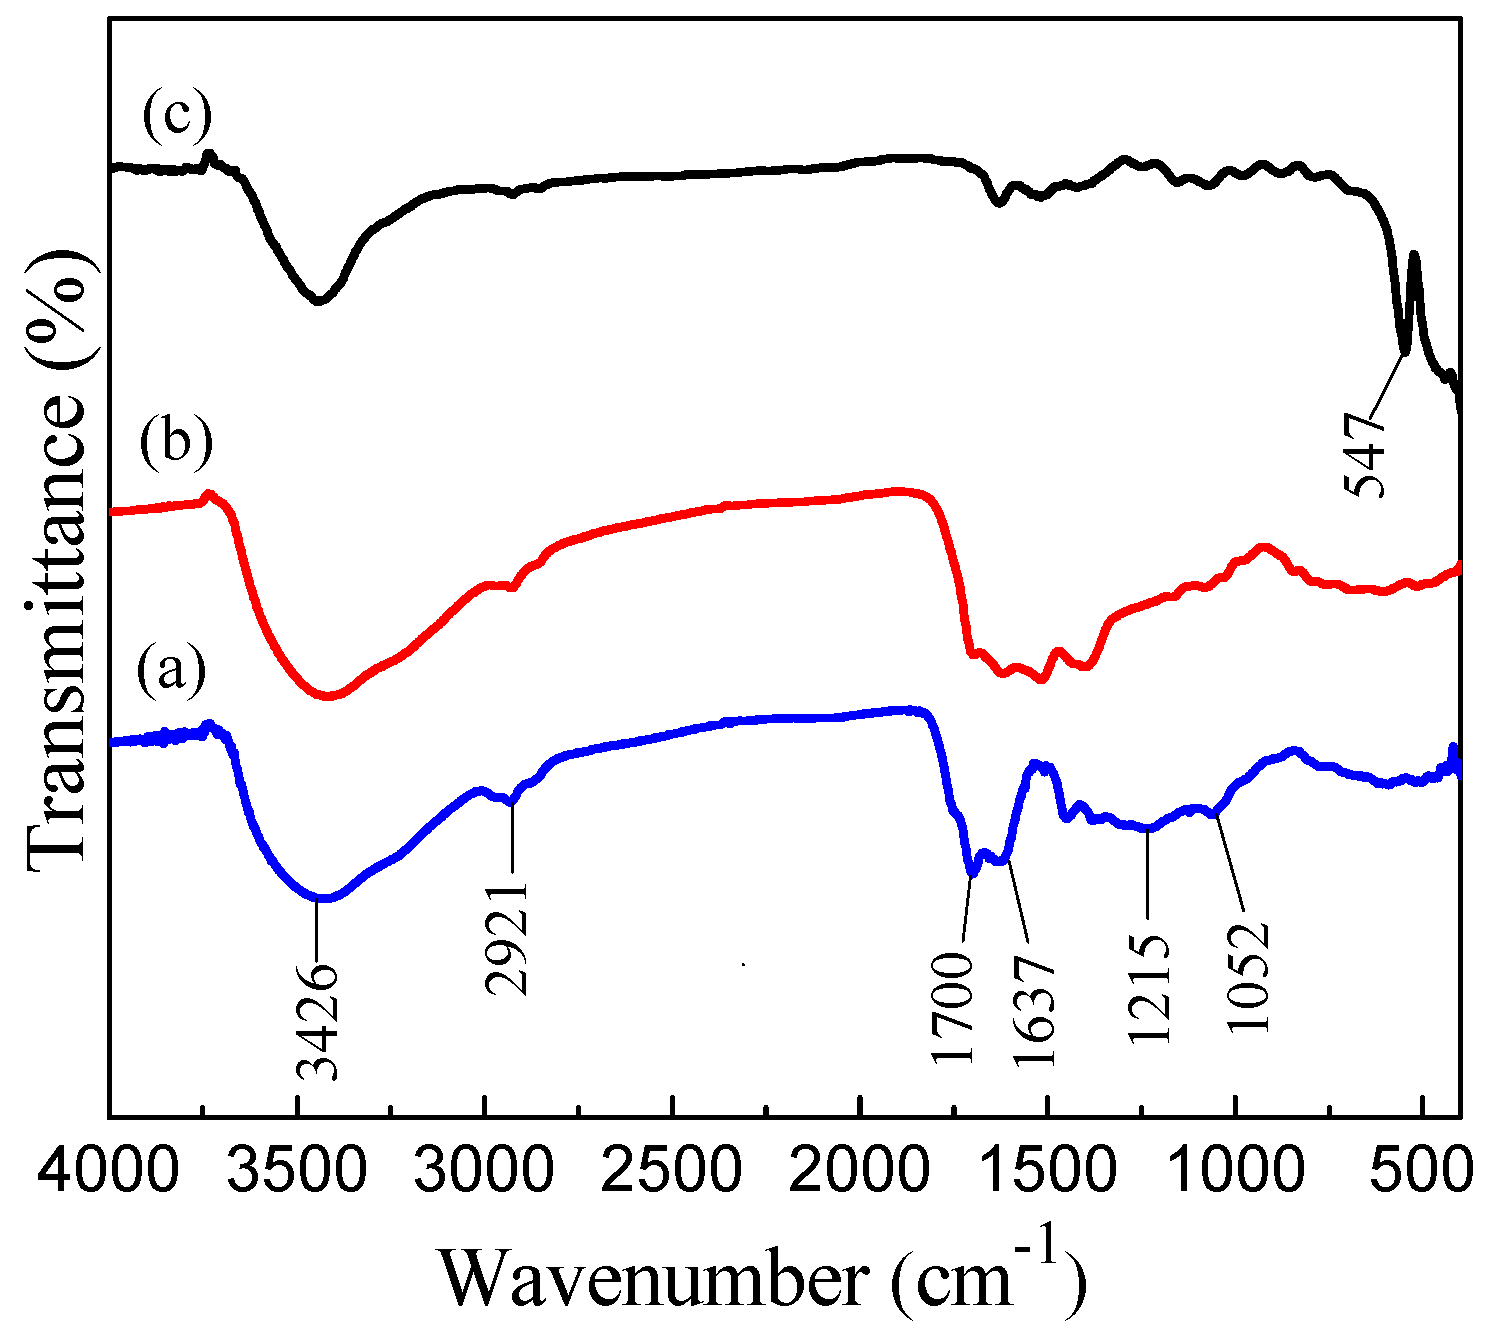
3.2. FT-IR Analysis
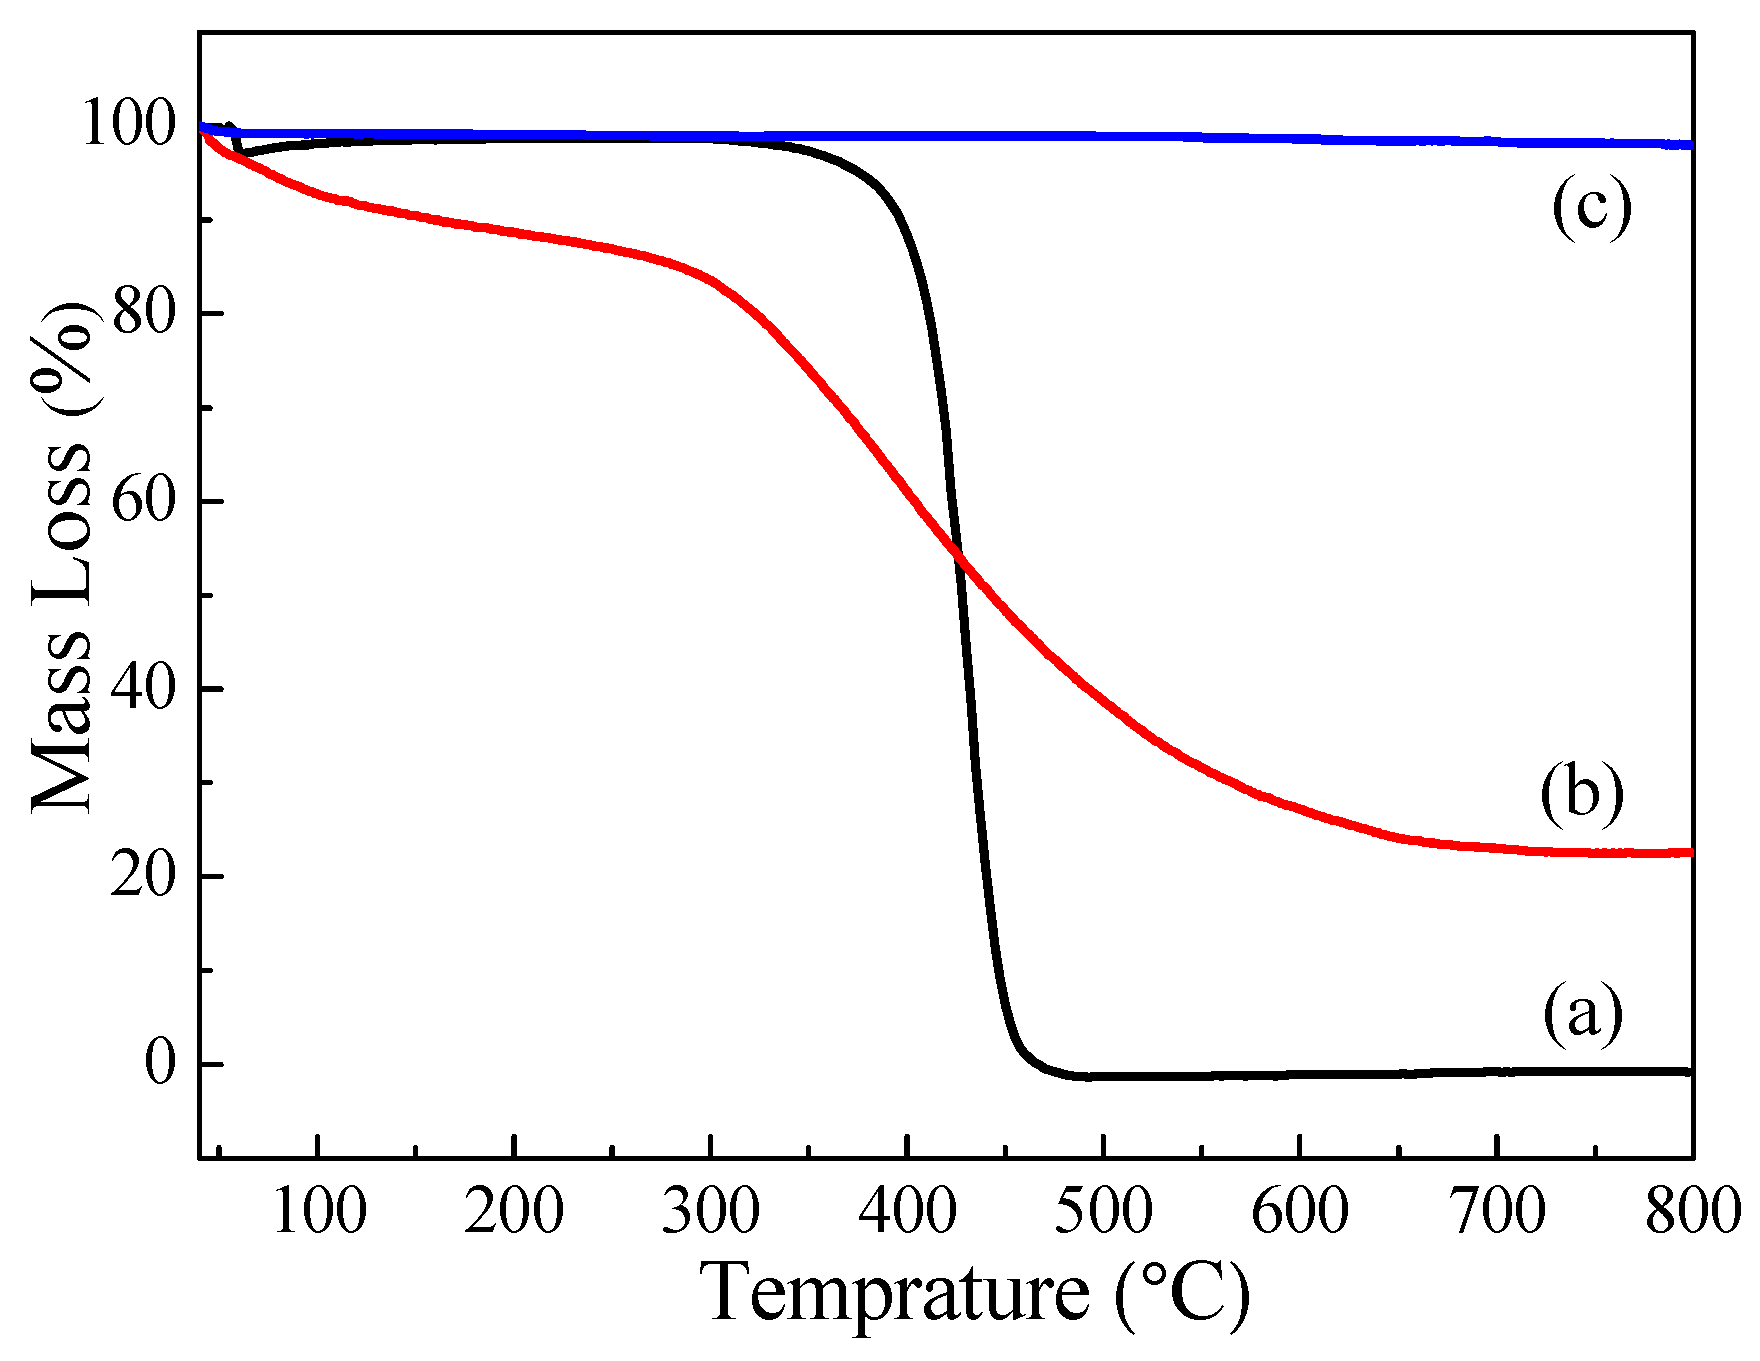
3.3. TG Analysis
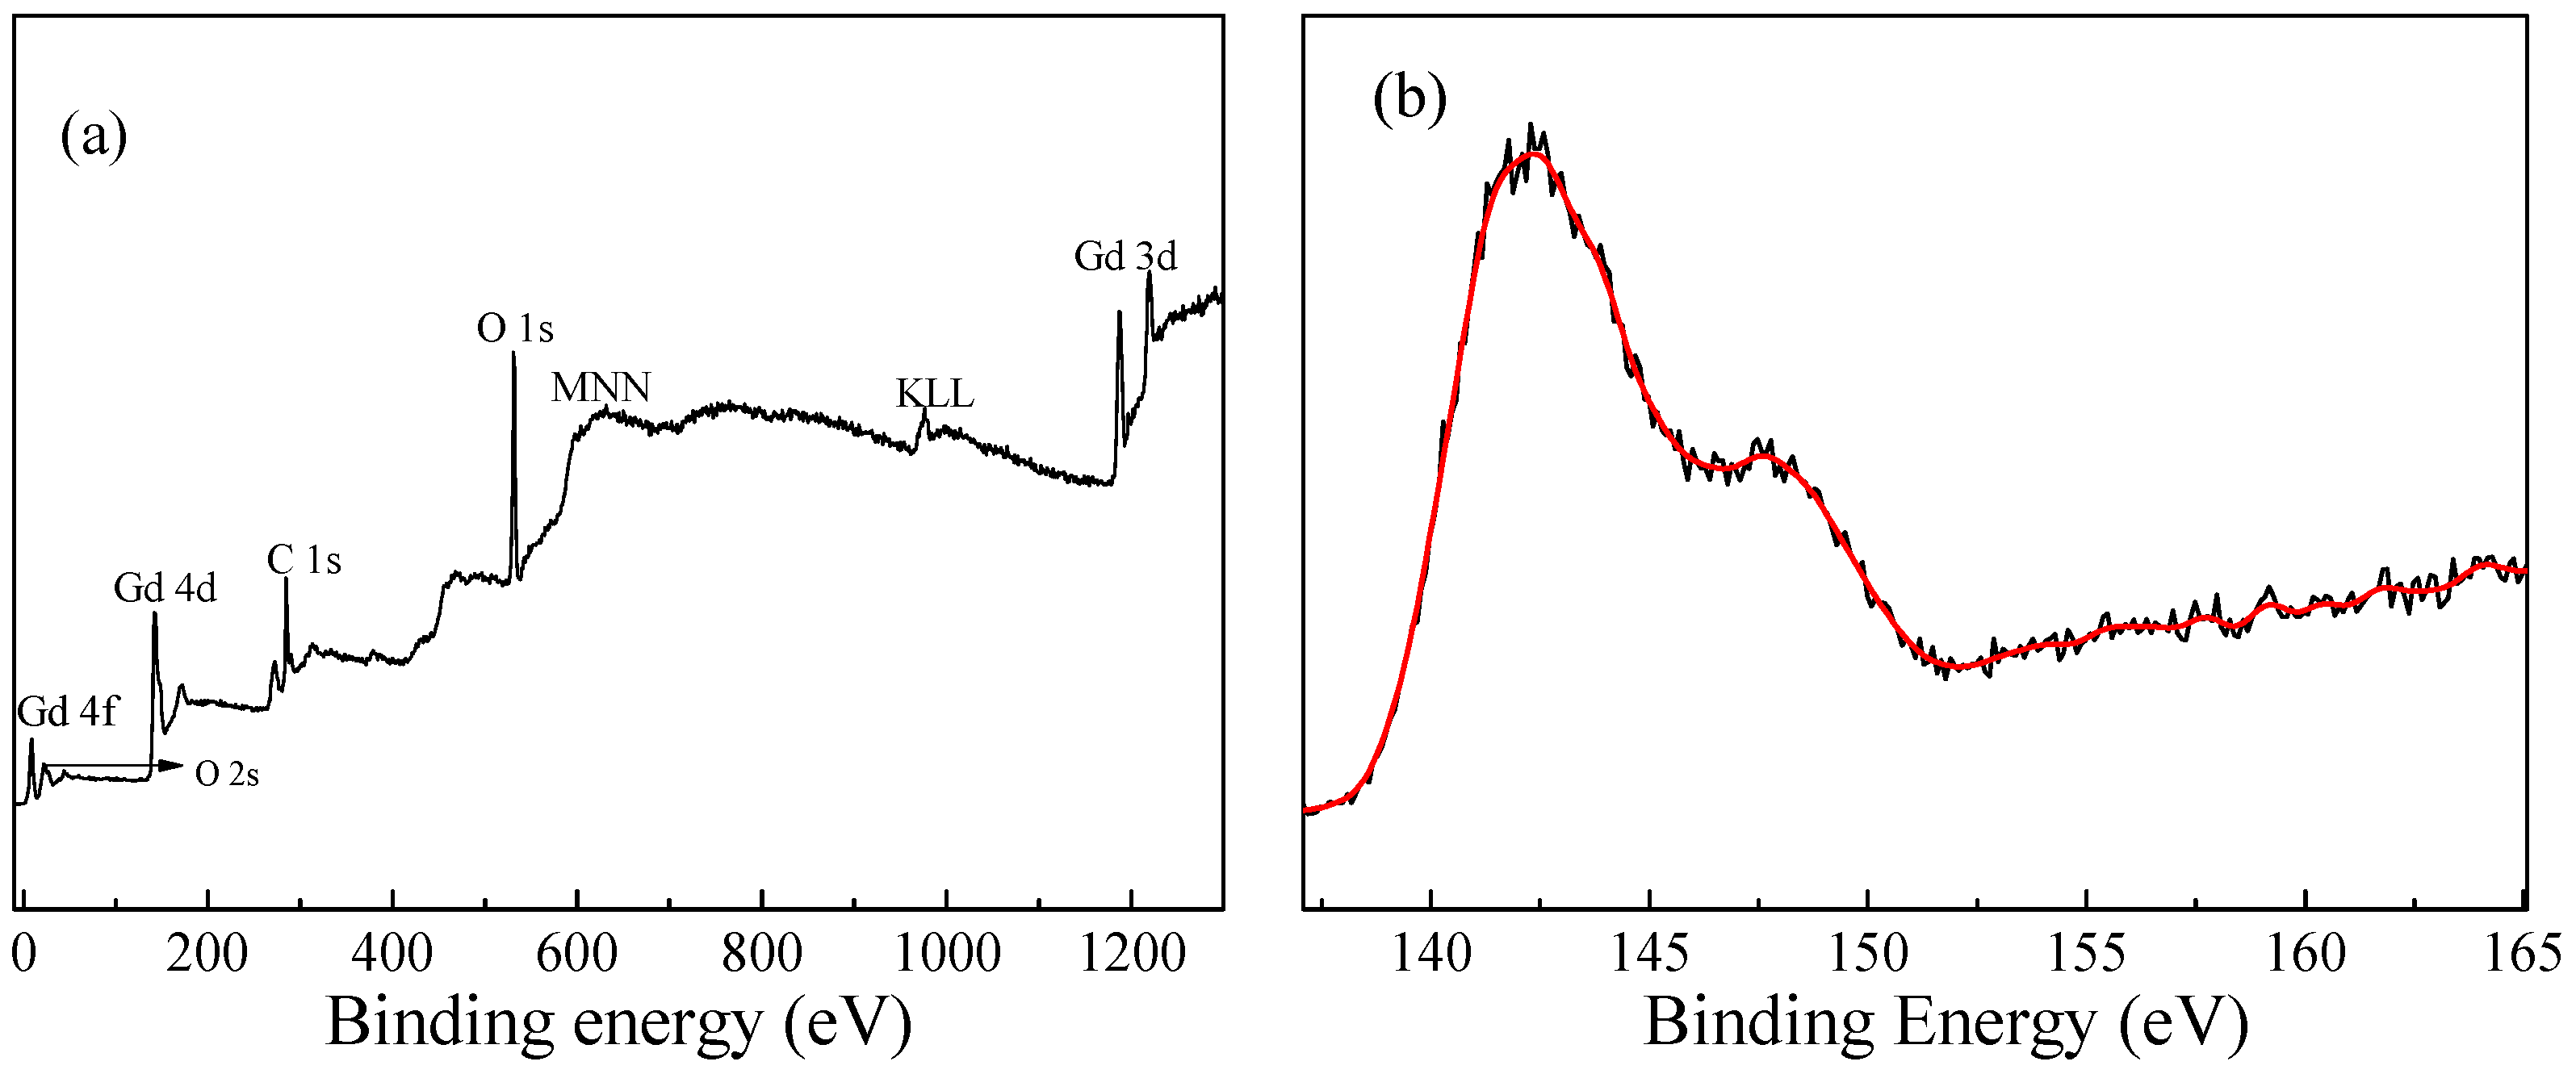
3.4. XPS Analysis
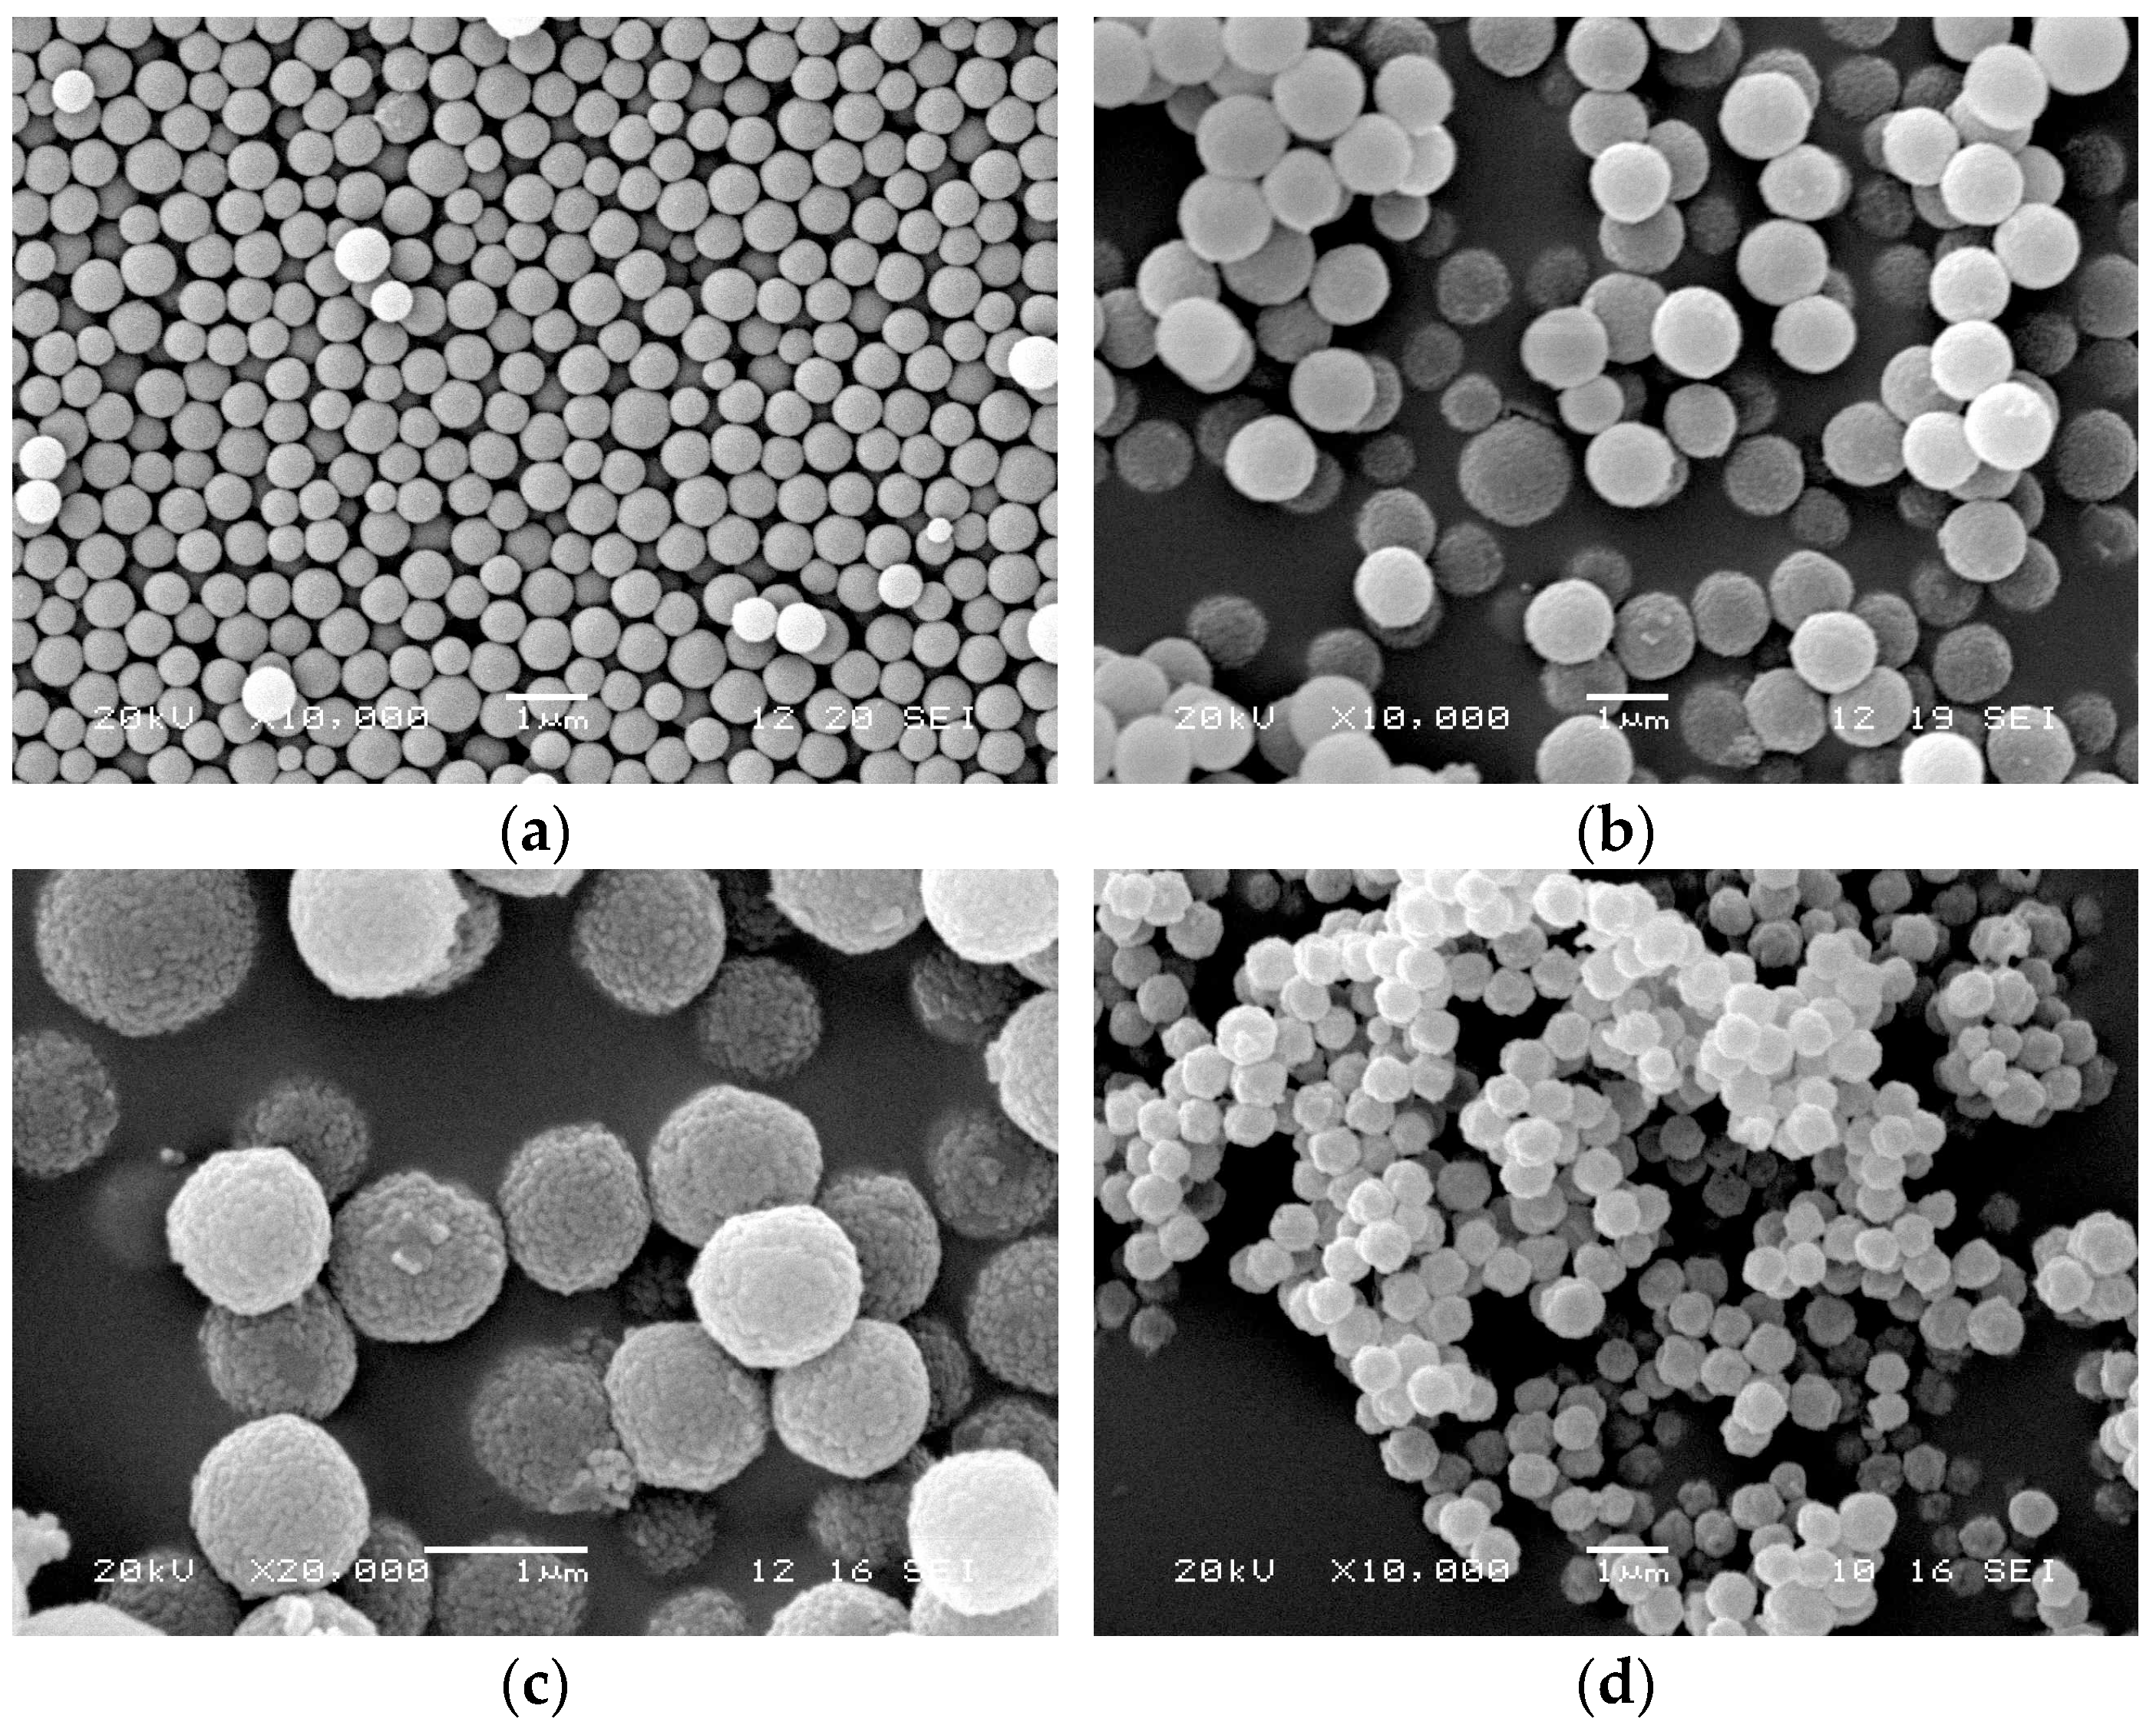
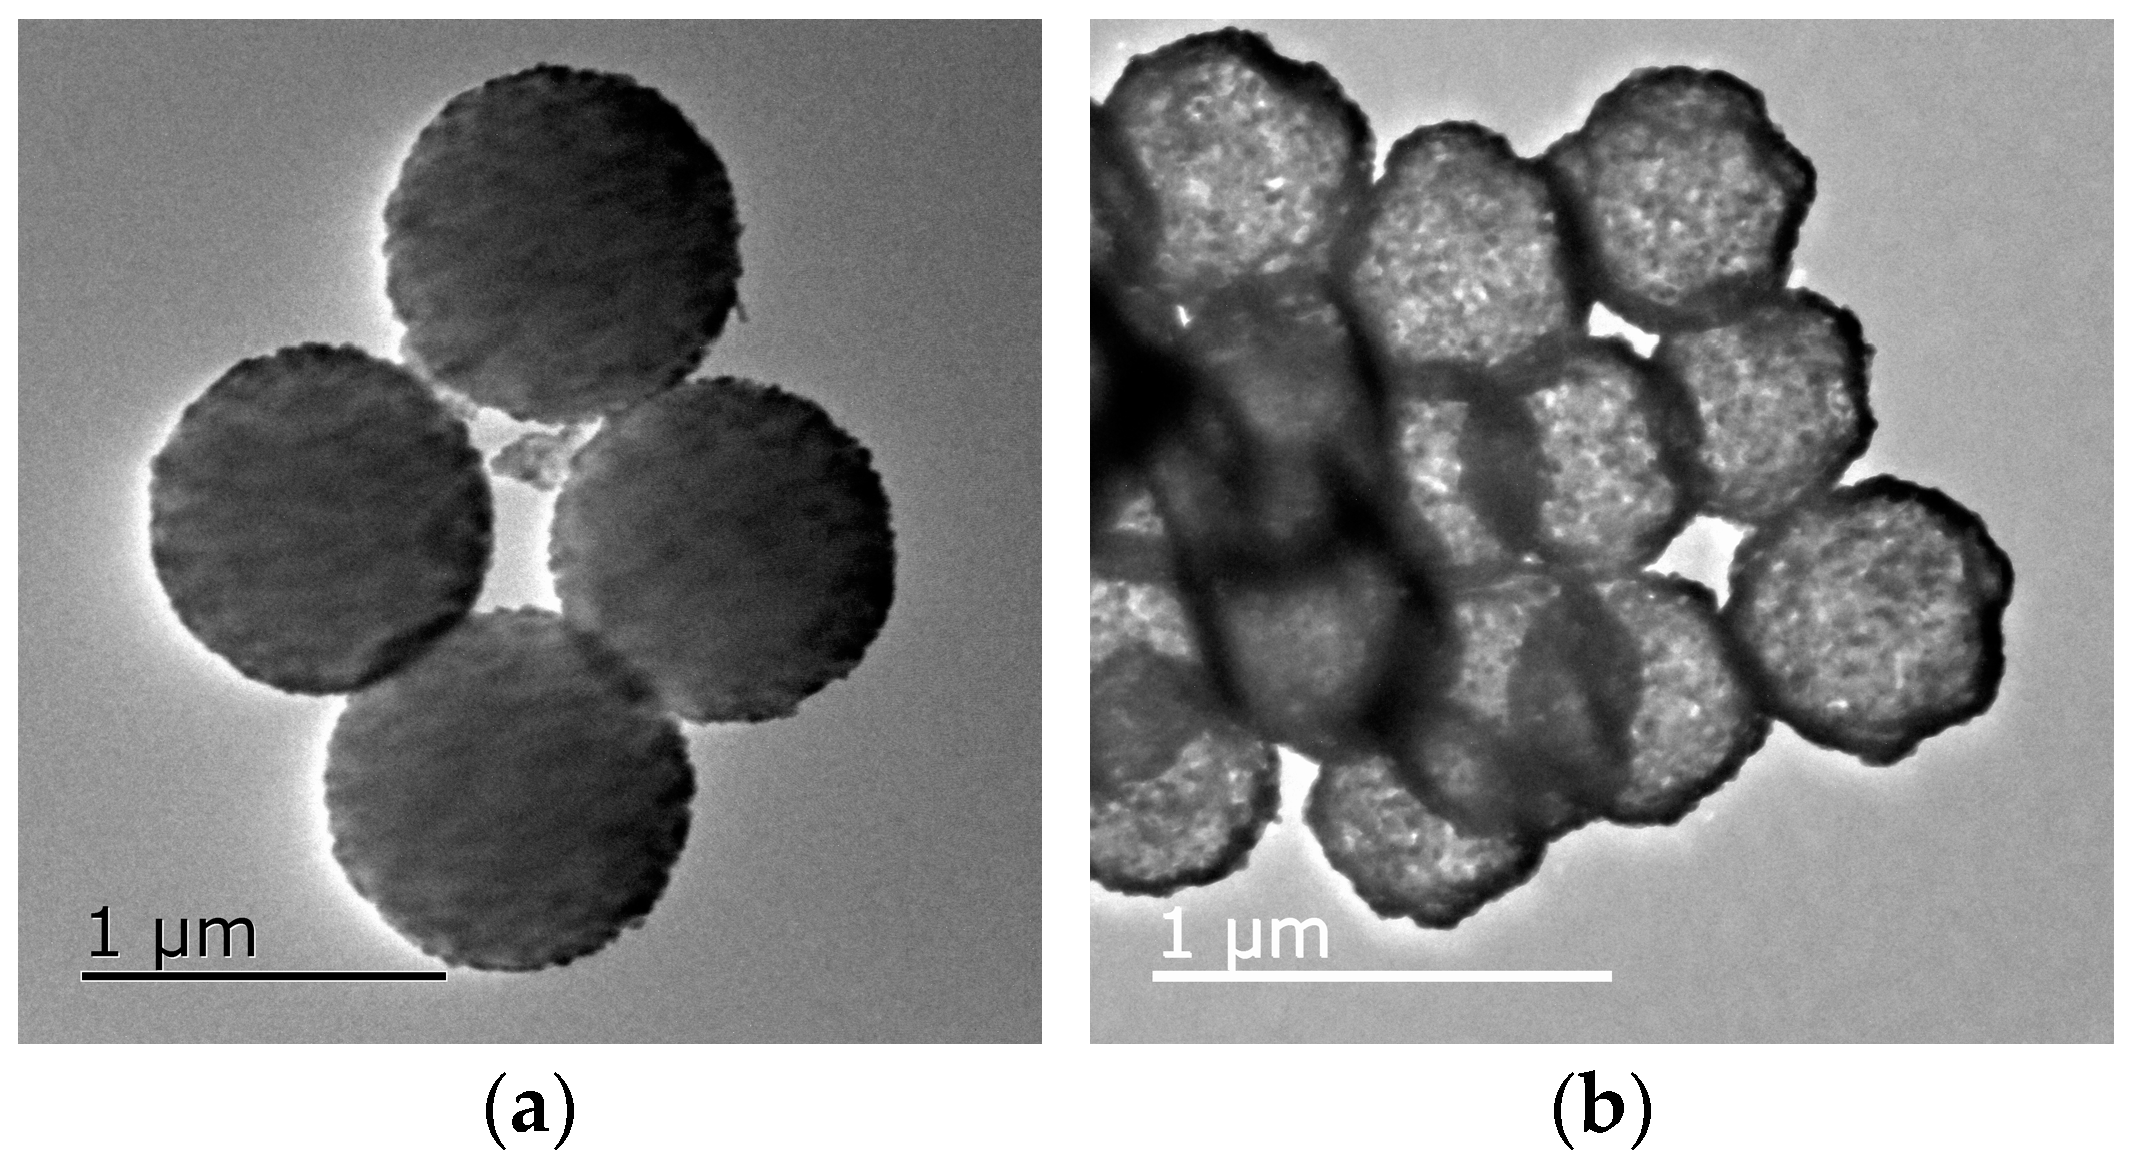
3.5. Morphology and Microstructure
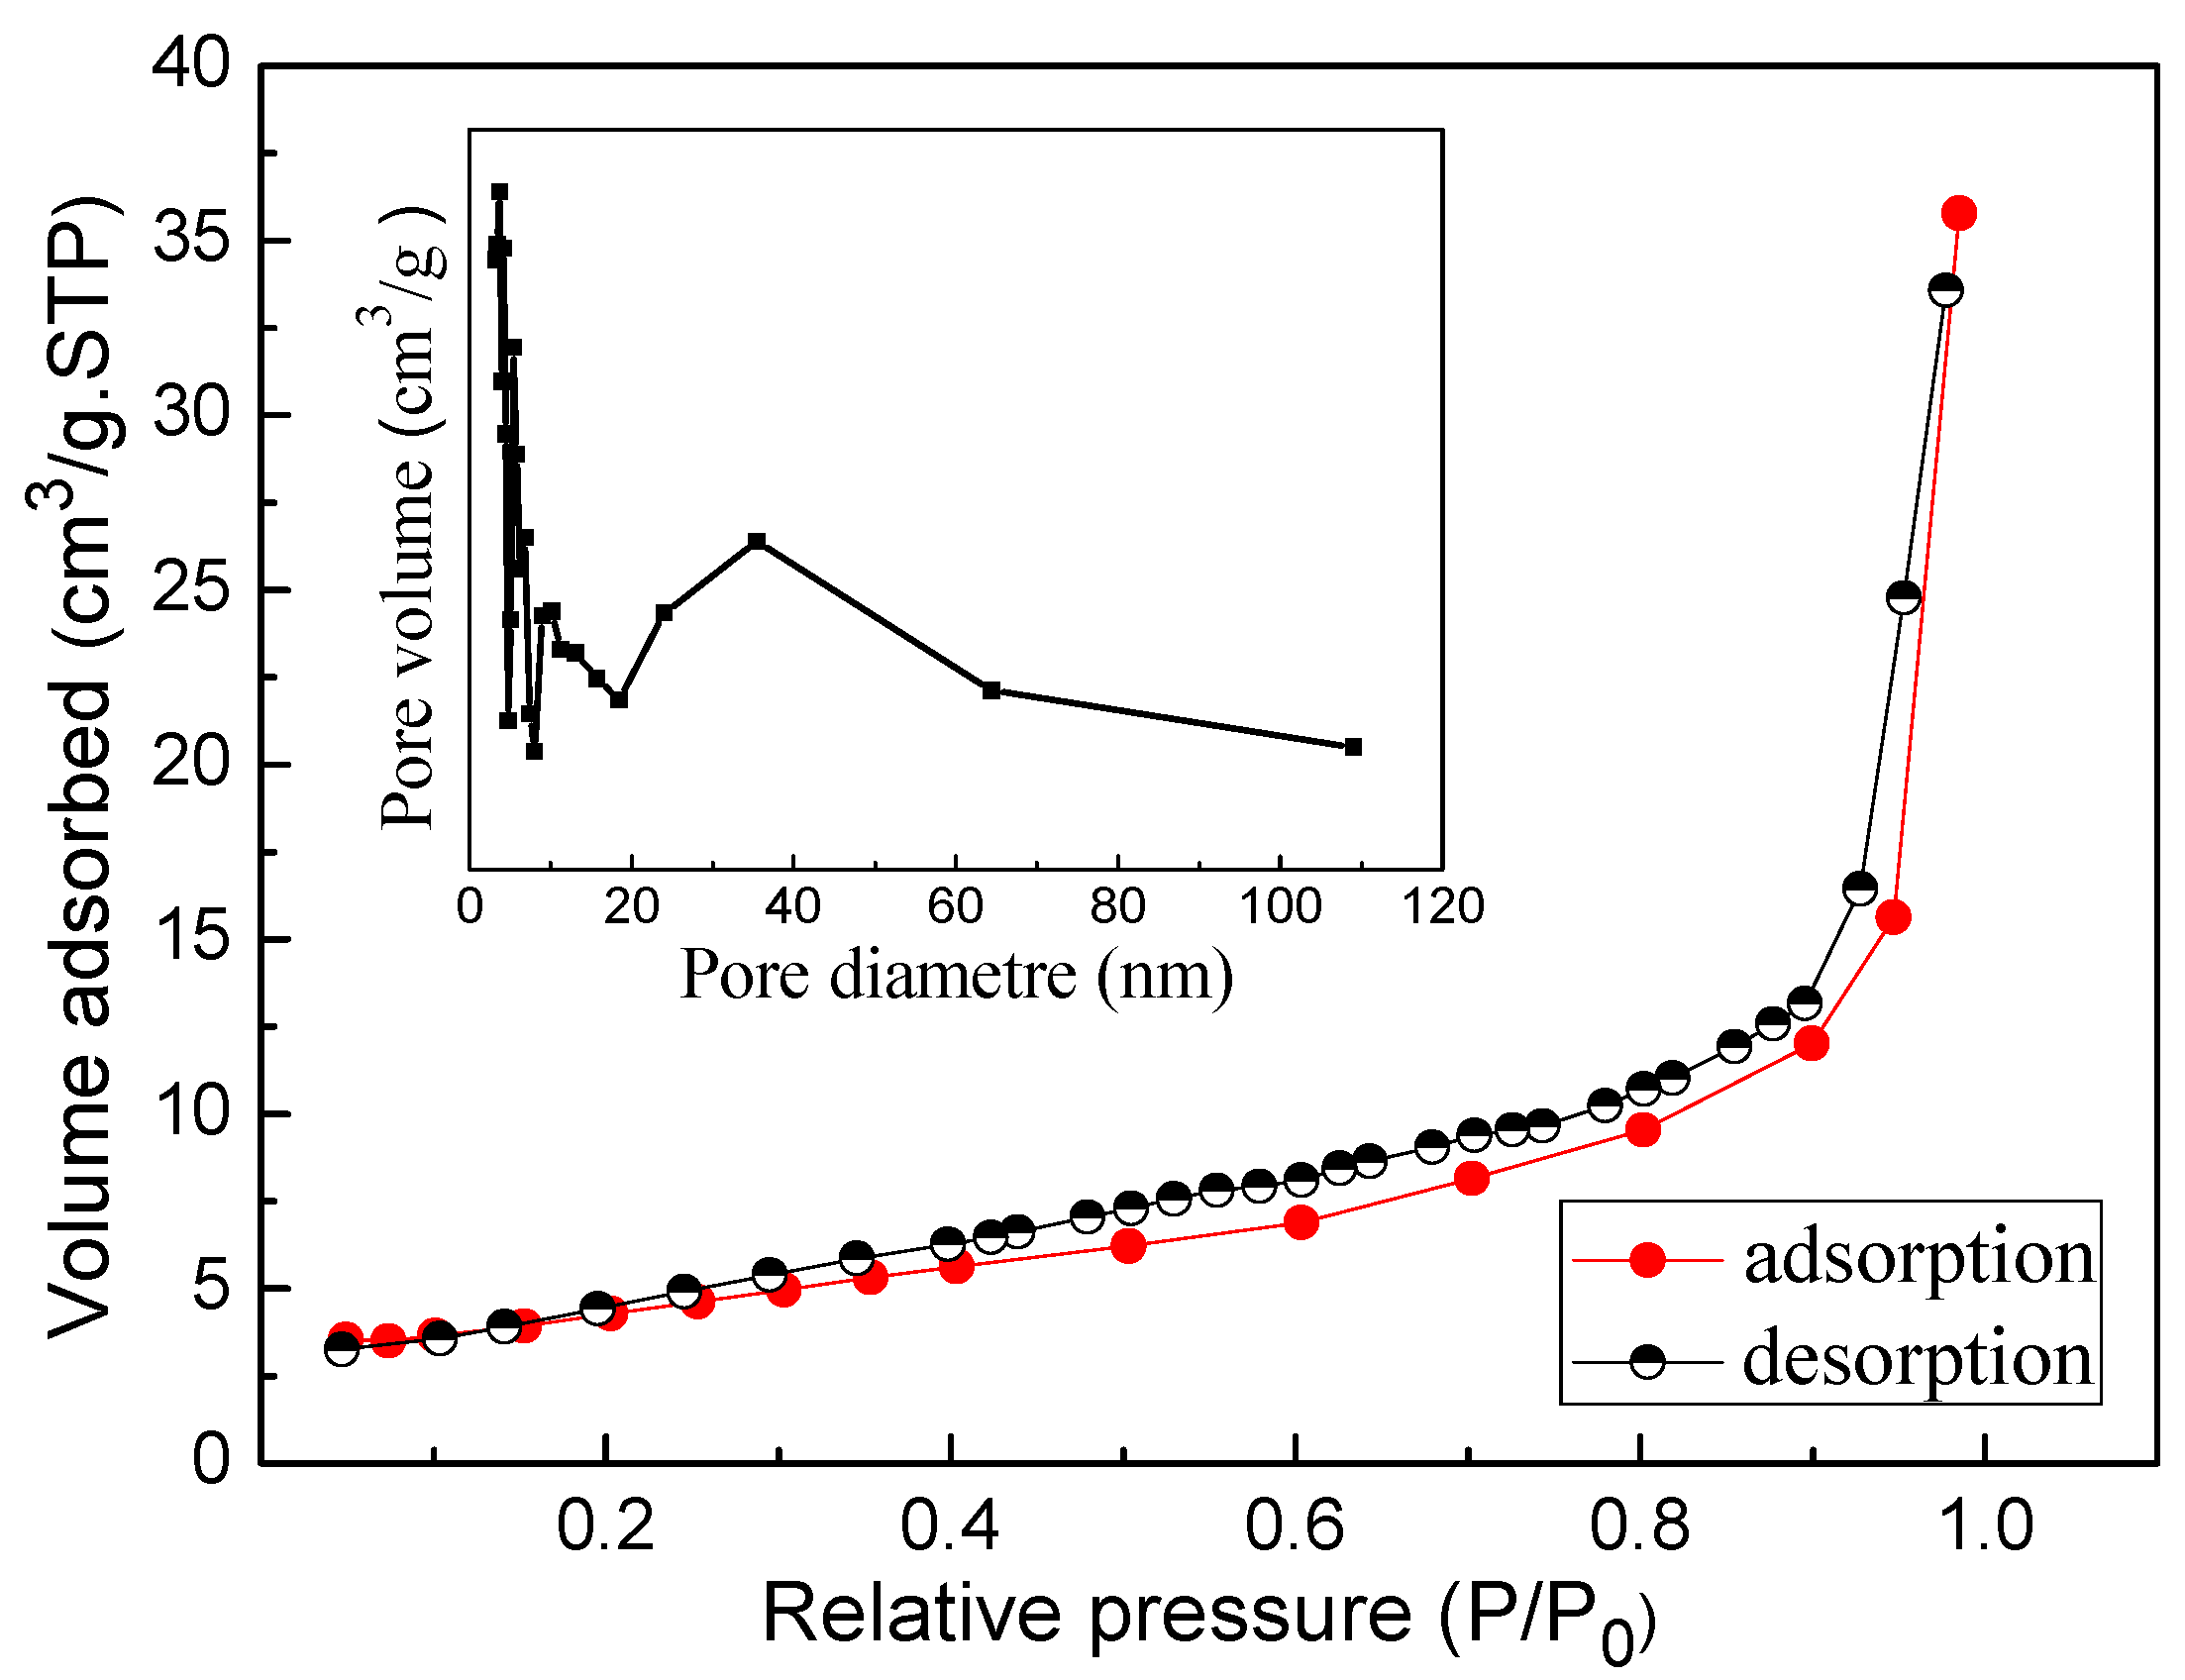
3.6. BET Surface Area Analysis
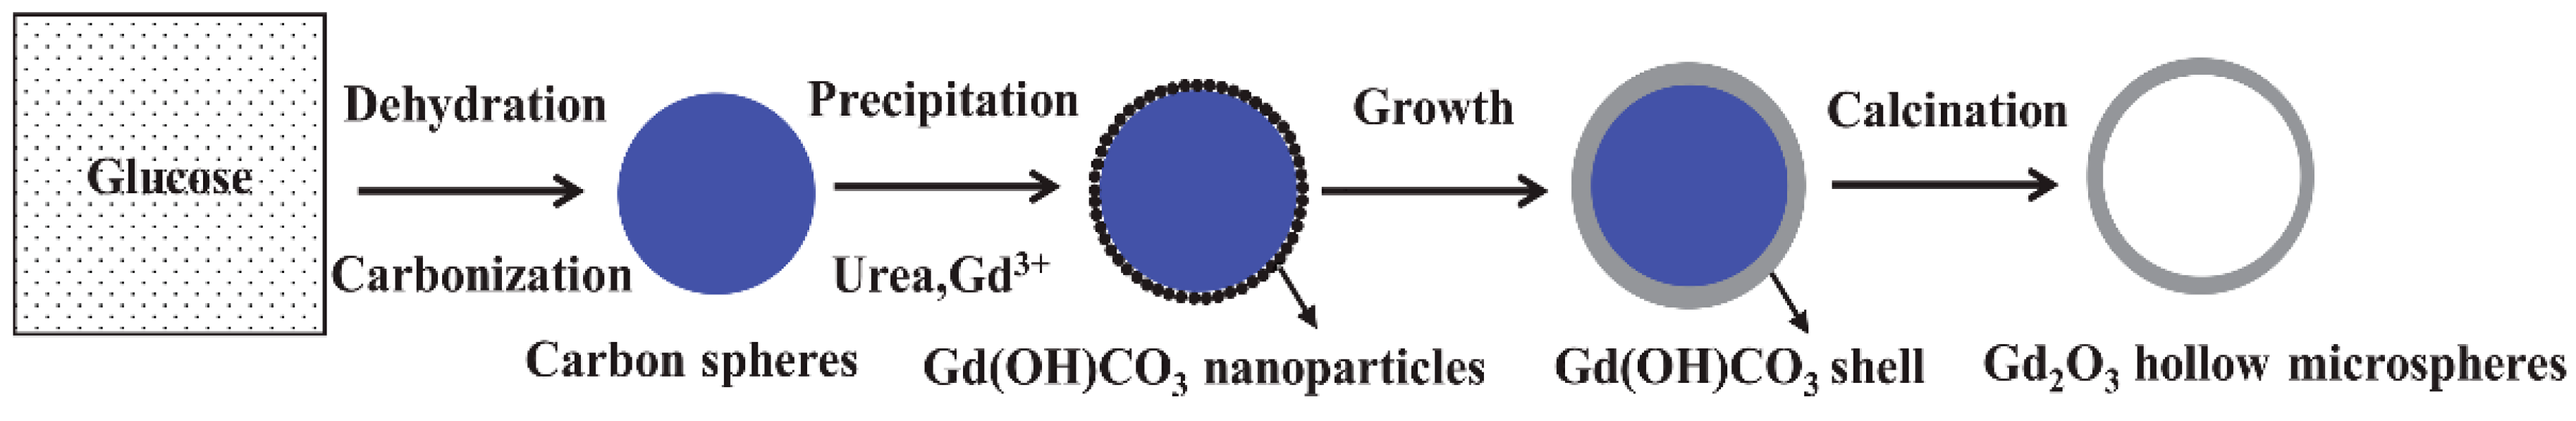
3.7. Proposed Formation Process
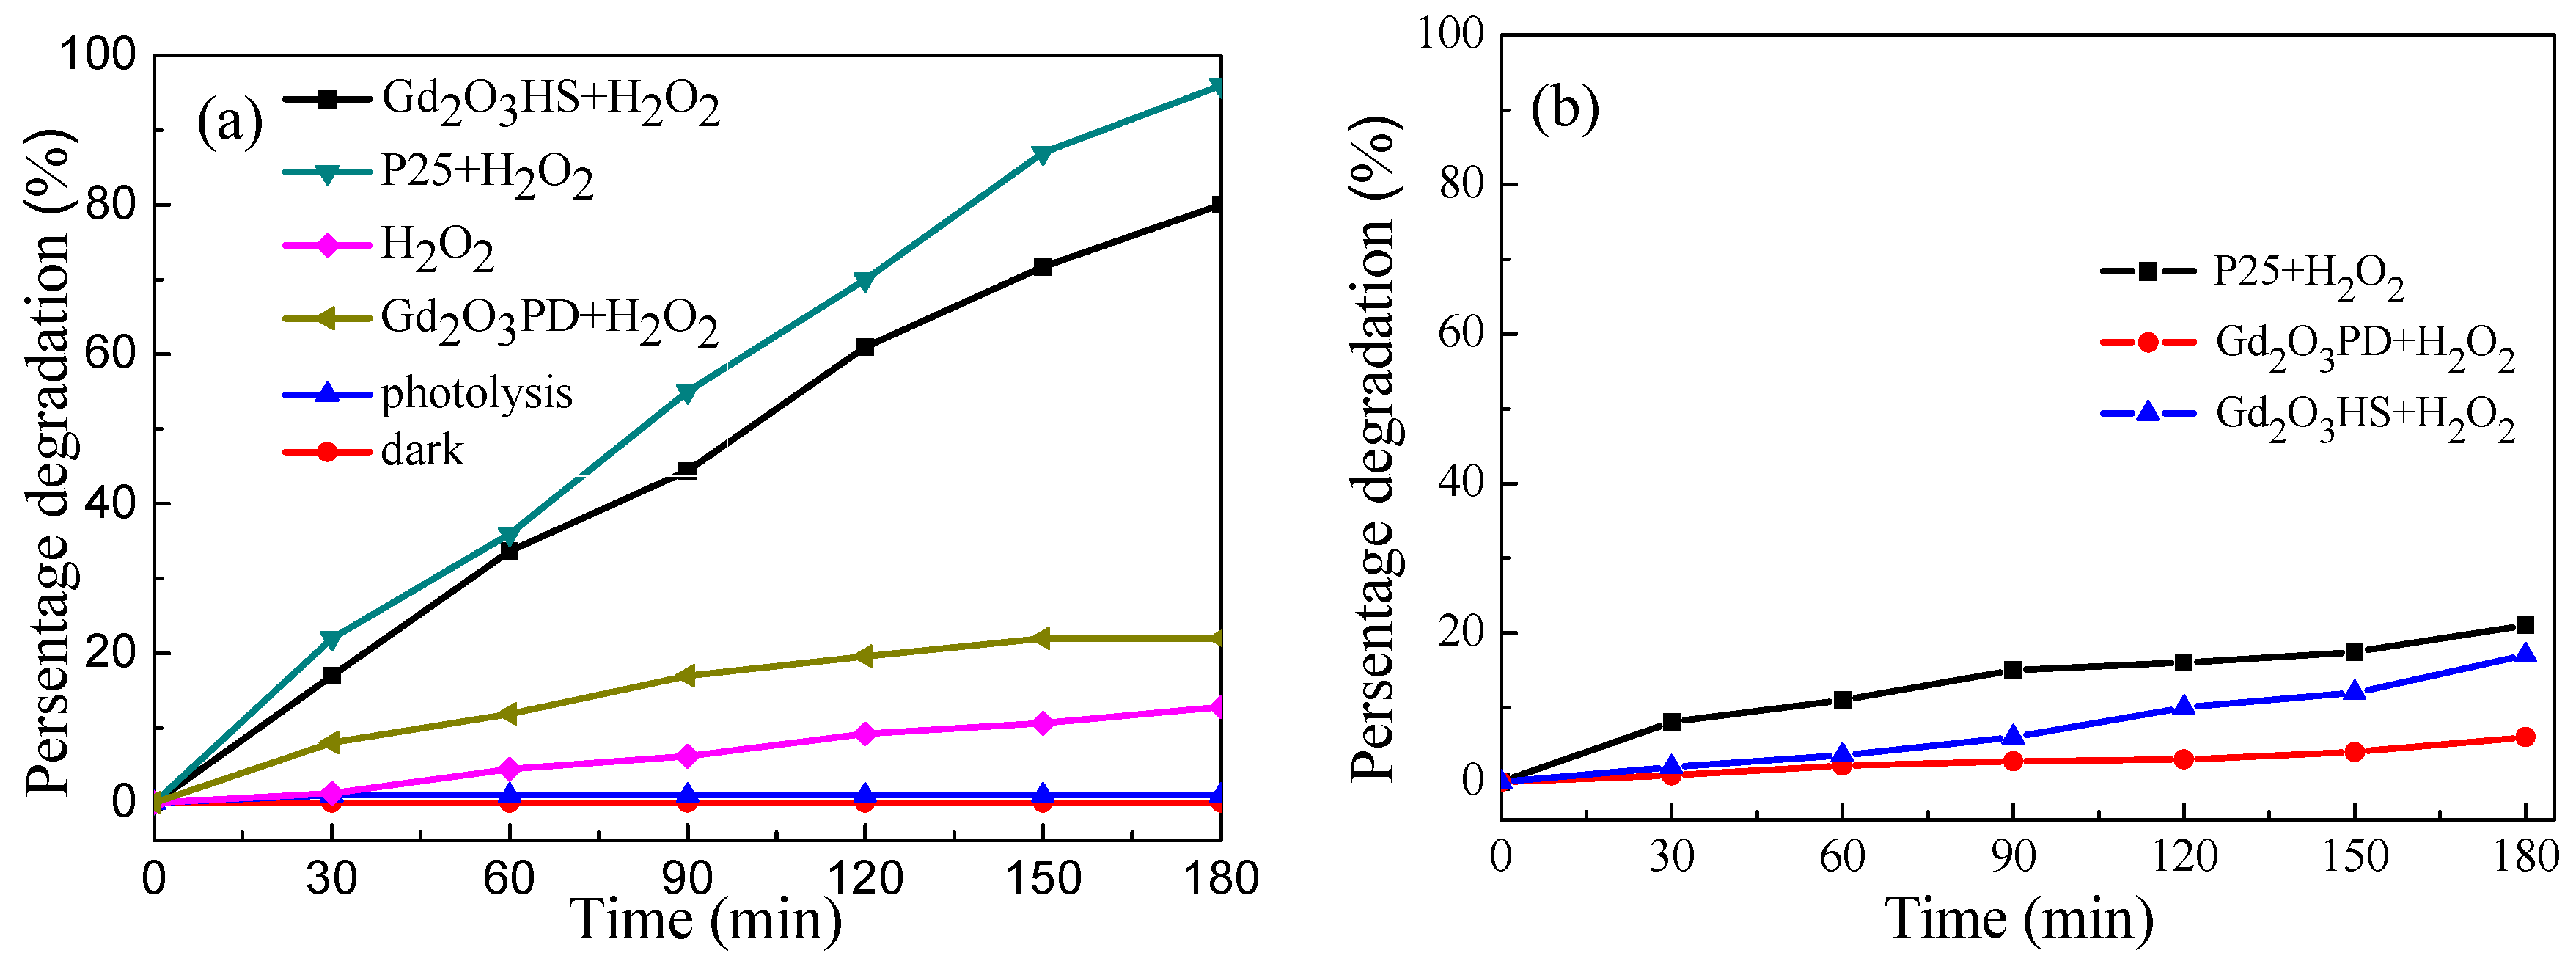
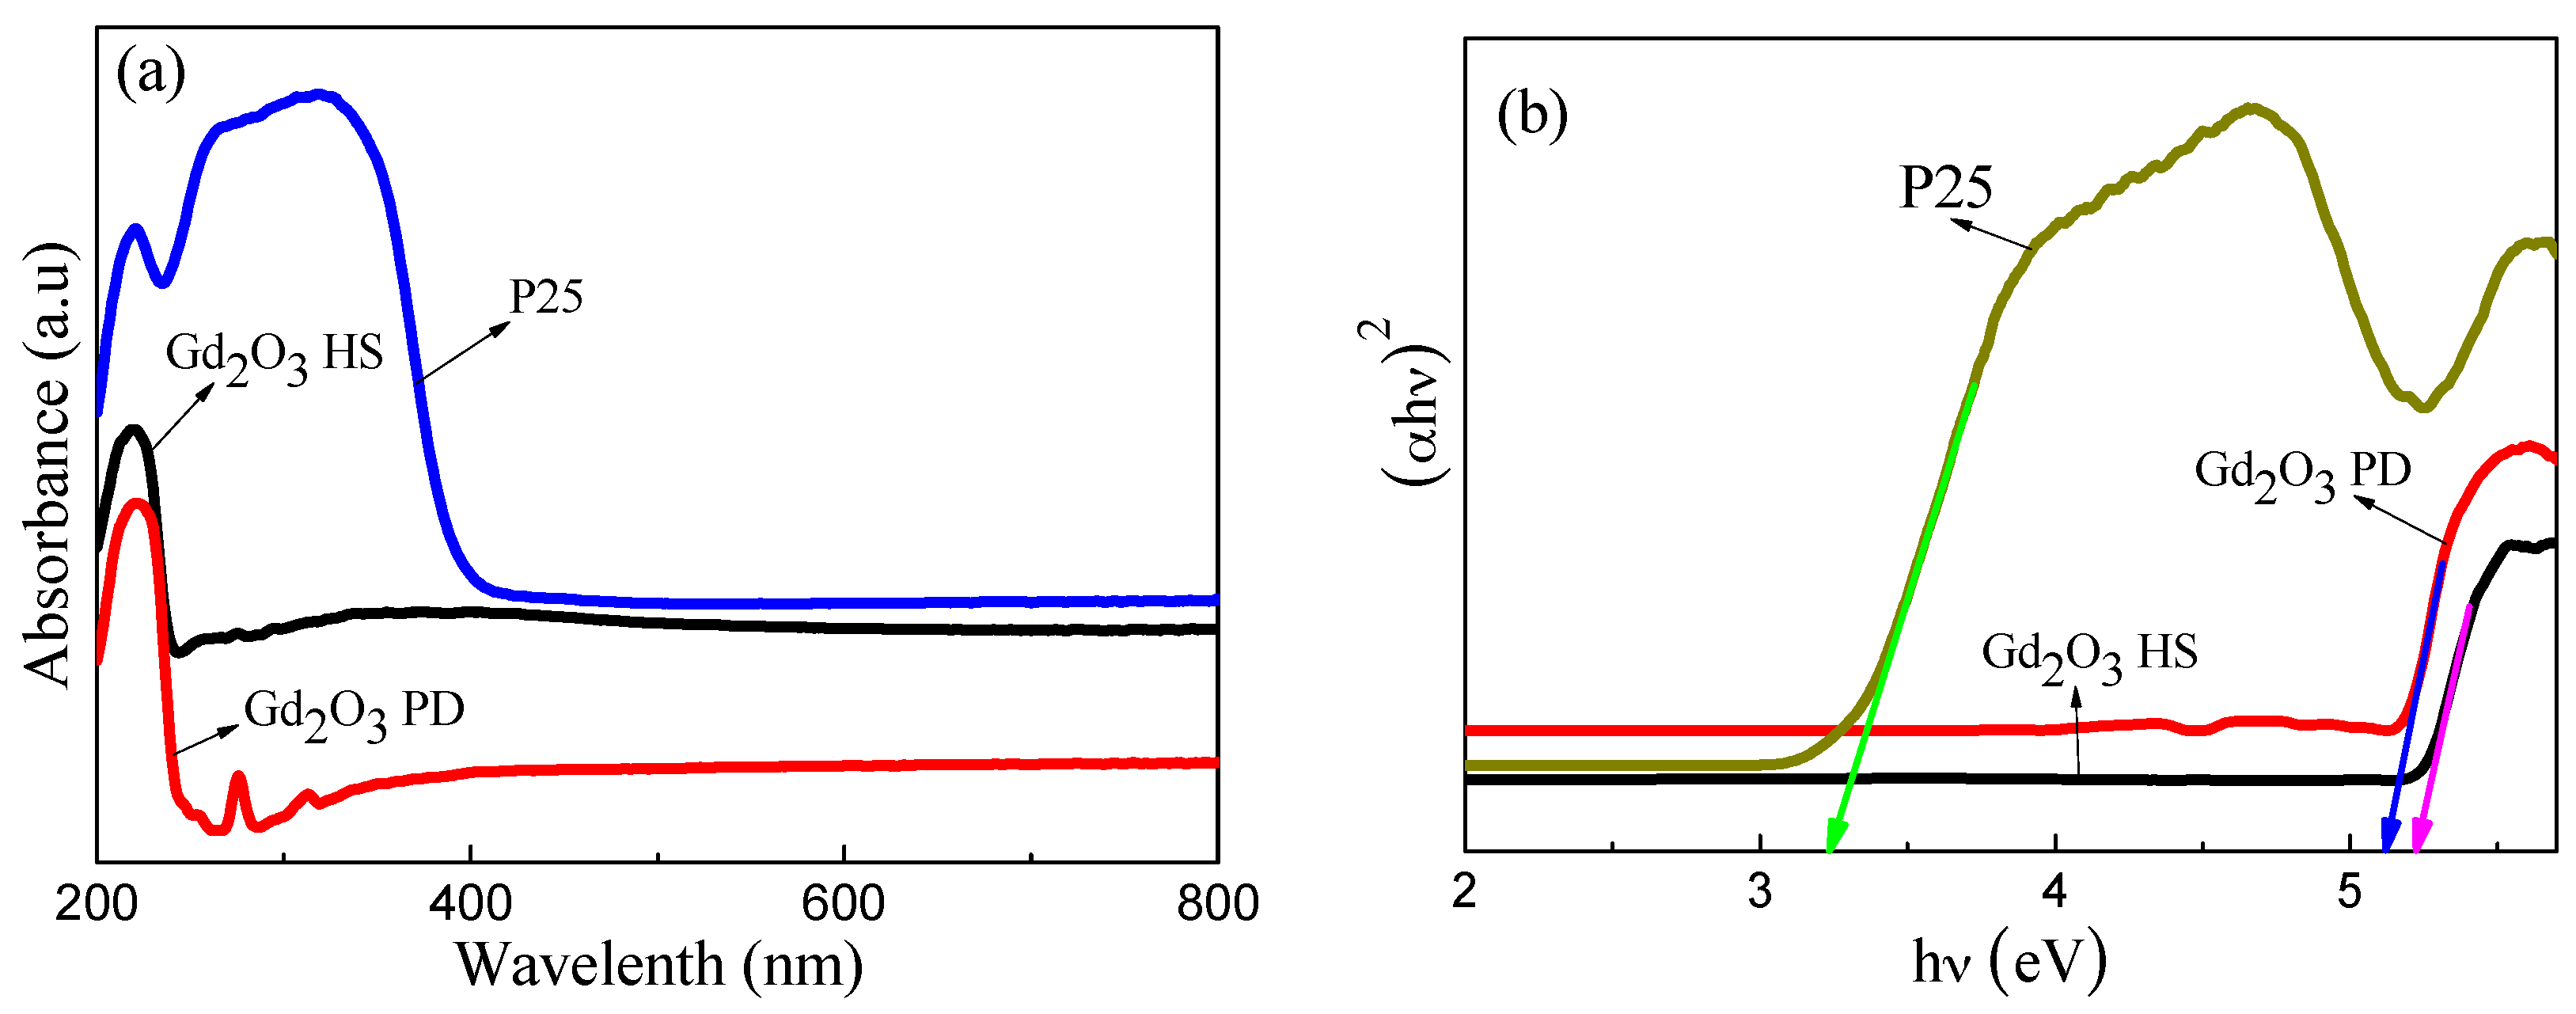
3.8. Photooxidation Activity of Gd2O3 Hollow Microspheres
4. Conclusions
Acknowledgments
Author Contributions
Conflicts of Interest
References
- Kang, X.; Yang, D.; Ma, P.; Dai, Y.; Shang, M.; Geng, D.; Cheng, Z.; Lin, J. Fabrication of hollow and porous structured GdVO4: Dy3+ nanospheres as anticancer drug carrier and MRI contrast agent. Langmuir 2013, 29, 1286–1294. [Google Scholar] [CrossRef] [PubMed]
- Ren, H.; Zhang, L.; Wang, T.; Li, L.; Su, Z.; Wang, C. Universal and facile synthesis of multicolored upconversion hollow nanospheres using novel poly(acrylic acid sodium salt) microspheres as templates. Chem. Commun. 2013, 49, 6036–6038. [Google Scholar]
- Zhang, L.; Yin, M.; You, H.; Yang, M.; Song, Y.; Huang, Y. Mutifuntional GdPO4: Eu3+ Hollow Spheres: Synthesis and Magnetic and Luminescent Properties. Inorg. Chem. 2011, 50, 10608–10613. [Google Scholar] [CrossRef] [PubMed]
- Li, W.; Zheng, X.; Li, F.; Wang, J. Facile synthetic route to hollow gadolinium oxide spheres with tunable thickness. Micro Nano Lett. 2012, 7, 1267–1269. [Google Scholar] [CrossRef]
- Zhang, L.; Sun, Y.; Jiu, H.; Wang, Y.; Fu, Y.; Zhang, J. Facile synthesis and luminescence properties of Gd2O3: Tb hollow microspheres. Micro Nano Lett. 2011, 6, 927–931. [Google Scholar] [CrossRef]
- Chen, Y.; Chen, H.; Zeng, D.; Tian, Y.; Chen, F.; Feng, J.; Shi, J. Core/shell structured hollow mesoporous nanocapsules: A potential platform for simultaneous cell imaging and anticancer drug delivery. ACS Nano 2010, 4, 6001–6013. [Google Scholar] [PubMed]
- Wang, B.; Chen, J.S.; Wu, H.B.; Wang, Z.; Lou, X.W. Quasiemulsion-templated formation of α-Fe2O3 hollow spheres with enhanced lithium storage properties. J. Am. Chem. Soc. 2011, 133, 17146–17148. [Google Scholar] [PubMed]
- Tan, C.; Liu, Y.; Li, W.; Zhang, Y.; Han, Y. Uniform lanthanide-doped Y2O3 hollow microspheres: Controlled synthesis and luminescence properties. Mater. Sci. Eng. B 2011, 176, 1251–1256. [Google Scholar] [CrossRef]
- Yang, Z.-C.; Tang, C.-H.; Gong, H.; Li, X.; Wang, J. Hollow spheres of nanocarbon and their manganese dioxide hybrids derived from soft template for supercapacitor application. J. Power Sources 2013, 240, 713–720. [Google Scholar] [CrossRef]
- Tomioka, T.; Fuji, M.; Takahashi, M.; Takai, C.; Utsuno, M. Hollow Structure Formation Mechanism of Calcium Carbonate Particles Synthesized by the CO2 Bubbling Method. Cryst. Growth Des. 2012, 12, 771–776. [Google Scholar] [CrossRef]
- Shi, X.; Pan, L.; Chen, S.; Xiao, Y.; Liu, Q.; Yuan, L.; Sun, J.; Cai, L. Zn(II)-PEG 300 globules as soft template for the synthesis of hexagonal ZnO micronuts by the hydrothermal reaction method. Langmuir 2009, 25, 5940–5948. [Google Scholar] [CrossRef] [PubMed]
- Liu, Y.; Yang, P.; Wang, W.; Dong, H.; Lin, J. Fabrication and photoluminescence properties of hollow Gd2O3: Ln (Ln = Eu3+, Sm3+) spheres via a sacrificial template method. CrystEngComm 2010, 12, 3717–3723. [Google Scholar] [CrossRef]
- Xiao, Y.; Gao, Z.-Y.; Wu, D.-P.; Jiang, Y.; Liu, N.; Jiang, K. Synthesis and Photoluminescence Properties of Uniform Y2O3: Eu3+ Hollow Spheres with Tunable Shell Thickness. Chem. Res. Chin. Univ. 2011, 27, 919–923. [Google Scholar]
- Xiao, H.; Li, P.; Jia, F.; Zhang, L. Nonaqueous Sol-Gel Synthesis of Nanostructured Sm2O3, Gd2O3, Dy2O3, and Gd2O3: Eu3+ Phosphor. J. Phys. Chem. C 2009, 113, 21034–21041. [Google Scholar] [CrossRef]
- Huang, C.-C.; Liu, T.-Y.; Su, C.-H.; Lo, Y.-W.; Chen, J.-H.; Yeh, C.-S. Superparamagnetic hollow and paramagnetic porous Gd2O3 particles. Chem. Mater. 2008, 20, 3840–3848. [Google Scholar] [CrossRef]
- Balestrieri, D.; Philipponneau, Y.; Decroix, G.; Jorand, Y.; Fantozzi, G. Pseudo-plasticity of monoclinic Gd2O3. J. Eur. Ceram. Soc. 1998, 18, 1073–1077. [Google Scholar] [CrossRef]
- Majeed, S.; Shivashankar, S. Rapid, microwave-assisted synthesis of Gd2O3 and Eu: Gd2O3 nanocrystals: Characterization, magnetic, optical and biological studies. J. Mater. Chem. B 2014, 2, 5585–5593. [Google Scholar] [CrossRef]
- Boopathi, G.; Raj, S.G.; Kumar, G.R.; Mohan, R. A co-precipitation preparation, crystal structure and photoluminescent properties of Er5%: Gd2O3 nanorods. Solid State Phys. 2015, 1667, 050085. [Google Scholar]
- Jia, G.; Liu, K.; Zheng, Y.; Song, Y.; Yang, M.; You, H. Highly Uniform Gd(OH)3 and Gd2O3: Eu3+ Nanotubes: Facile Synthesis and Luminescence Properties. J. Phys. Chem. C 2009, 113, 6050–6055. [Google Scholar] [CrossRef]
- Ahren, M.; Selegard, L.; Klasson, A.; Soderlind, F.; Abrikossova, N.; Skoglund, C.; Bengtsson, T.; Engstrom, M.; Kall, P.O.; Uvdal, K. Synthesis and characterization of PEGylated Gd2O3 nanoparticles for MRI contrast enhancement. Langmuir 2010, 26, 5753–5762. [Google Scholar] [CrossRef] [PubMed]
- Cui, Y.; Fan, S.; Zhang, Y. Study on Photocatalytic Degradation of Methyl Orange by Cerium-Doped TiO2. Chin. J. Rare Met. 2006, 30, 469–474. [Google Scholar]
- Kumar, R.; Kumar, G.; Akhtar, M.S.; Umar, A. Sonophotocatalytic degradation of methyl orange using ZnO nano-aggregates. J. Alloy. Compd. 2015, 629, 167–172. [Google Scholar] [CrossRef]
- Sakaki, T.; Shibata, M.; Miki, T.; Hirosue, H.; Hayashi, N. Reaction model of cellulose decomposition in near-critical water and fermentation of products. Bioresour. Technol. 1996, 58, 197–202. [Google Scholar] [CrossRef]
- Ni, D.; Wang, L.; Sun, Y.; Guan, Z.; Yang, S.; Zhou, K. Amphiphilic hollow carbonaceous microspheres with permeable shells. Angew. Chem. Int. Ed. 2010, 49, 4223–4227. [Google Scholar] [CrossRef] [PubMed]
- Dhananjaya, N.; Nagabhushana, H.; Sharma, S.; Rudraswamy, B.; Shivakumara, C.; Nagabhushana, B. Hydrothermal synthesis of Gd2O3: Eu3+ nanophosphors: Effect of surfactant on structural and luminescence properties. J. Alloy. Compd. 2014, 587, 755–762. [Google Scholar] [CrossRef]
- Tamrakar, R.K.; Bisen, D. Thermoluminescence studies of ultraviolet and gamma irradiated erbium (III)-and ytterbium (III)-doped gadolinium oxide phosphors. Mater. Sci. Semicond. Process. 2015, 33, 169–188. [Google Scholar] [CrossRef]
- Liu, J.; Tian, X.; Chen, H.; Shao, Y.; Yang, G.; Chen, D. Near-infrared to visible and near-infrared upconversion of monoclinic Gd2O3: Yb3+/Tm3+ nanoparticles prepared by laser ablation in liquid for fluorescence imaging. Appl. Surf. Sci. 2015, 348, 60–65. [Google Scholar] [CrossRef]
- Raiser, D.; Deville, J. Study of XPS photoemission of some gadolinium compounds. J. Electron Spectrosc. Relat. Phenom. 1991, 57, 91–97. [Google Scholar] [CrossRef]
- Yu, J.; Yu, H.; Cheng, B.; Zhou, M.; Zhao, X. Enhanced photocatalytic activity of TiO2 powder (P25) by hydrothermal treatment. J. Mol. Catal. A Chem. 2006, 253, 112–118. [Google Scholar] [CrossRef]
- Yin, M.; Li, Z.; Kou, J.; Zou, Z. Mechanism investigation of visible light-induced degradation in a heterogeneous TiO2/Eosin Y/Rhodamine B system. Environ. Sci. Technol. 2009, 43, 8361–8366. [Google Scholar] [CrossRef] [PubMed]
- Palominos, R.; Freer, J.; Mondaca, M.; Mansilla, H. Evidence for hole participation during the photocatalytic oxidation of the antibiotic flumequine. J. Photochem. Photobiol. A Chem. 2008, 193, 139–145. [Google Scholar] [CrossRef]
- Lousada, C.M.; Yang, M.; Nilsson, K.; Jonsson, M. Catalytic decomposition of hydrogen peroxide on transition metal and lanthanide oxides. J. Mol. Catal. A Chem. 2013, 379, 178–184. [Google Scholar] [CrossRef]


| Samples | BET Surface Area (m2/g) | Pore Volume (cm3/g) |
|---|---|---|
| Gd2O3 hollow microspheres | 15.211 | 0.051 |
| Gd2O3 powder | 1.342 | 0.004 |
© 2016 by the authors; licensee MDPI, Basel, Switzerland. This article is an open access article distributed under the terms and conditions of the Creative Commons Attribution (CC-BY) license (http://creativecommons.org/licenses/by/4.0/).
Share and Cite
Jiang, X.; Yu, L.; Yao, C.; Zhang, F.; Zhang, J.; Li, C. Synthesis and Characterization of Gd2O3 Hollow Microspheres Using a Template-Directed Method. Materials 2016, 9, 323. https://doi.org/10.3390/ma9050323
Jiang X, Yu L, Yao C, Zhang F, Zhang J, Li C. Synthesis and Characterization of Gd2O3 Hollow Microspheres Using a Template-Directed Method. Materials. 2016; 9(5):323. https://doi.org/10.3390/ma9050323
Chicago/Turabian StyleJiang, Xueliang, Lu Yu, Chu Yao, Fuqing Zhang, Jiao Zhang, and Chenjian Li. 2016. "Synthesis and Characterization of Gd2O3 Hollow Microspheres Using a Template-Directed Method" Materials 9, no. 5: 323. https://doi.org/10.3390/ma9050323
APA StyleJiang, X., Yu, L., Yao, C., Zhang, F., Zhang, J., & Li, C. (2016). Synthesis and Characterization of Gd2O3 Hollow Microspheres Using a Template-Directed Method. Materials, 9(5), 323. https://doi.org/10.3390/ma9050323