3.1. SEM Surface Morphology of Ni/Nano-TiC Hybrid Nanocomposite Layers
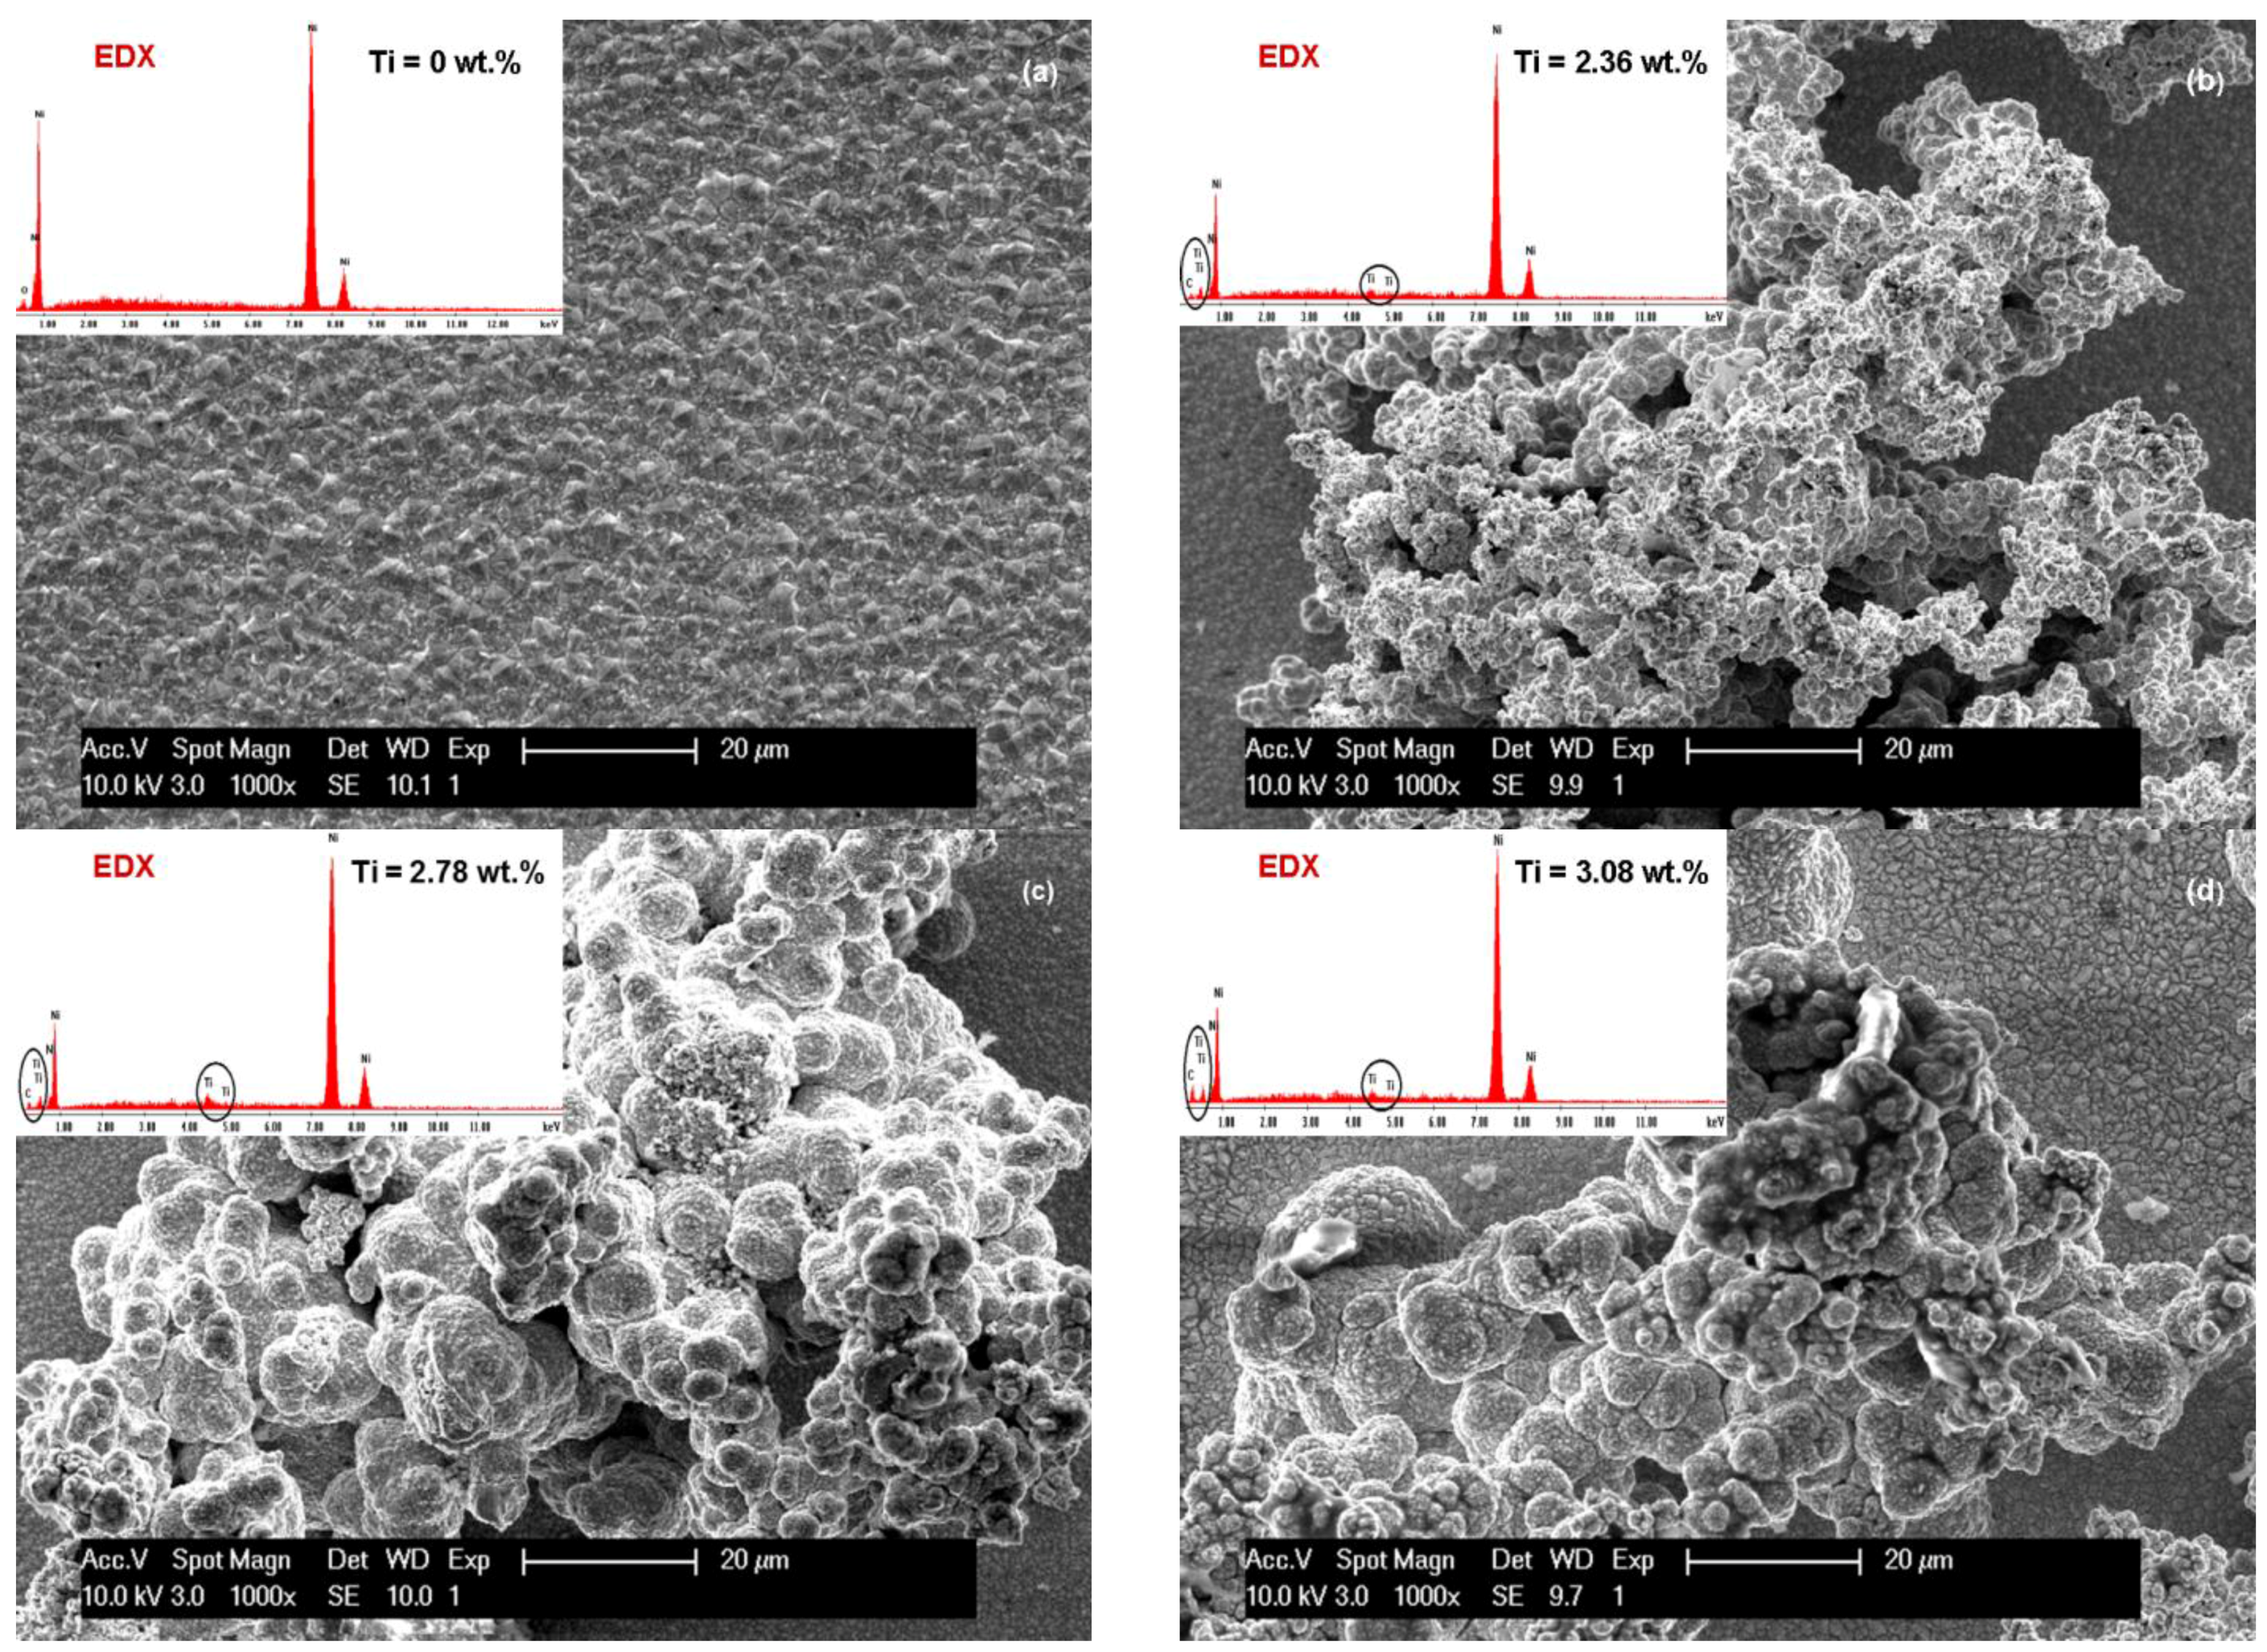
Analysis of electrodeposited layers by scanning electron microscopy revealed differences in surface morphology of Ni/TiC nanostructured layers compared to pure Ni electrodeposited layer obtained at same parameters. The surface morphologies of the obtained layers are significantly different and depend on the current density used, electrodeposition time and the amount of TiC dispersed nanoparticles added to the plating bath.
The influence of current density (40 mA/cm
2 and 72 mA/cm
2) on the SEM surface morphology of the pure Ni and Ni/TiC layers containing different concentrations of TiC nanoparticles is depicted in
Figure 3a–d and
Figure 4a–d. It is evident that embedding TiC nanoparticles into the nickel matrix provokes changes in the morphology of pure nickel matrix. A regular pyramidal structure, as shown in
Figure 3a and
Figure 4a, is observed on the surface of the pure nickel layers, with clear edges of the grains. The SEM surface micrographs of pure Ni deposits (
Figure 3a and
Figure 4a) showed also that by increasing the current density, the crystallite size of the pure nickel layer becomes bigger, this behavior being confirmed further by XRD analysis. This observation is consistent with the results reported by Thiemig
et al. [
19] and Ebrahimi
et al. [
20] for pure Ni electrodeposited layers. Ebrahimi
et al. [
20] have suggested that this behavior is associated with a drop in the electrodeposition efficiency and the evolution of more hydrogen at the cathode/electrolyte interface. According to them [
20], the changes in the surface energy and growth mechanisms in the presence of hydrogen are suggested as being responsible for the increase in the crystallite size.
With the first addition of TiC nanoparticles (10 g·L
−1) in the nickel plating bath (
Figure 3b and
Figure 4b), the boarders of the grains become blurred and the mean grain size is diminished compared to pure Ni layers at the same current density. Further increase in nanoparticles amount to 15 g·L
−1 in the electrolyte (
Figure 3c and
Figure 4c) leads to a characteristic cauliflower surface morphology. This observation was also reported earlier by Spanou
et al. [
21] for Ni/nano-TiO
2 composite electrodeposits. TiC nanoparticles show a distinct tendency to form spherical agglomerates uniformly distributed over the whole surface of the coating. This agglomeration tendency increases with increasing the concentration of the TiC dispersed phase added to the nickel electrolyte and also with increasing the current density.
The effect of electrodeposition time on the SEM surface morphology of the Ni/nano-TiC (20 g·L
−1) layers is shown in
Figure 3d and
Figure 4d. From these figures, it can be seen that the agglomeration effect is more pronounced for a higher deposition time, and, therefore, the cauliflower surface morphology is more obvious.
It can be seen that, with the addition of TiC nanoparticles, the nanocomposite layer surface changes and the grains become smaller compared with the pure Ni layer surface.
From
Figure 3b, it can also be seen that the surface layer of Ni/TiC nanocomposite (10 g·L
−1) is more homogeneous compared to the surfaces of other nanocomposites with 15 g·L
−1 and 20 g·L
−1 TiC obtained at electrochemical current density of 40 mA/cm
2 over 15 min according to the SEM images.
From the same SEM images (
Figure 3), the reduction of the grain size of crystallites due to the presence of TiC nanoparticles is also observed. On the nanocomposite layer surfaces, a nodular surface structure is formed, with observation confirmed by other researchers [
22] for cerium oxide codeposited with nickel matrix.
By increasing the time for electrodeposition (
Figure 4) and concentration of TiC nanoparticles an agglomerated cluster was formed on the surface of the nano-composite layers, but the presence of nanoparticles in the EDX spectra can be noticed.
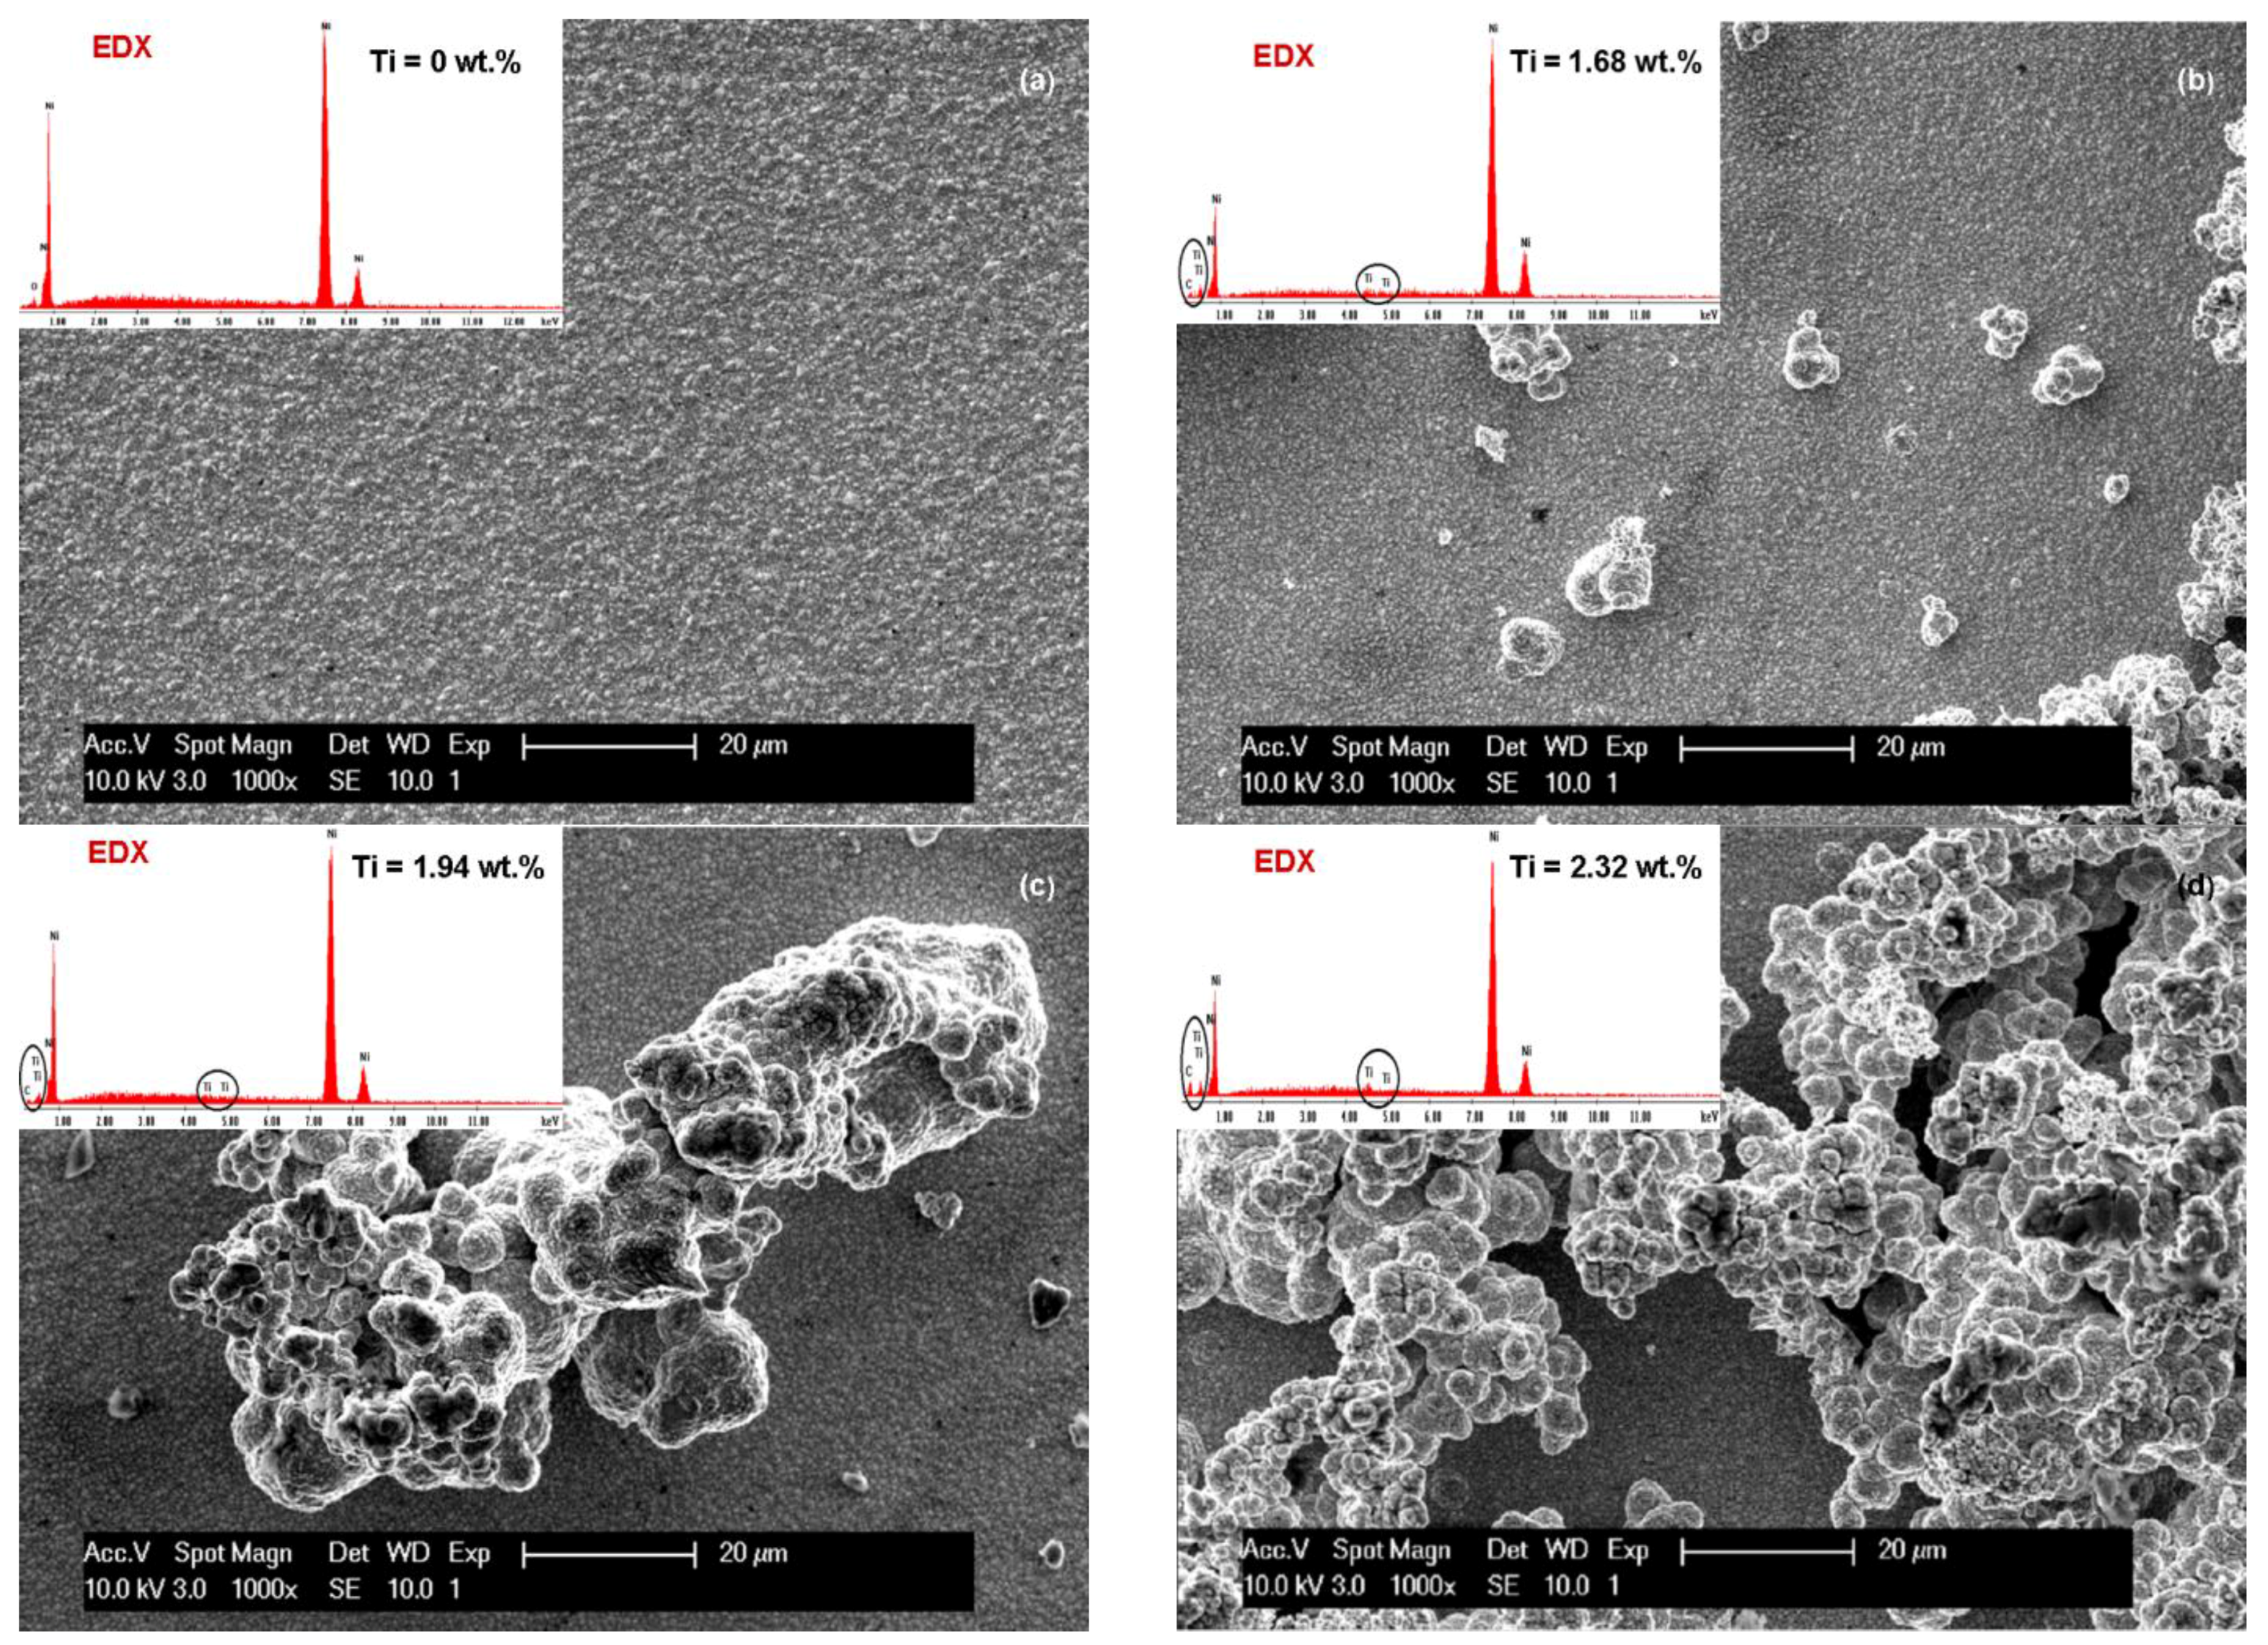
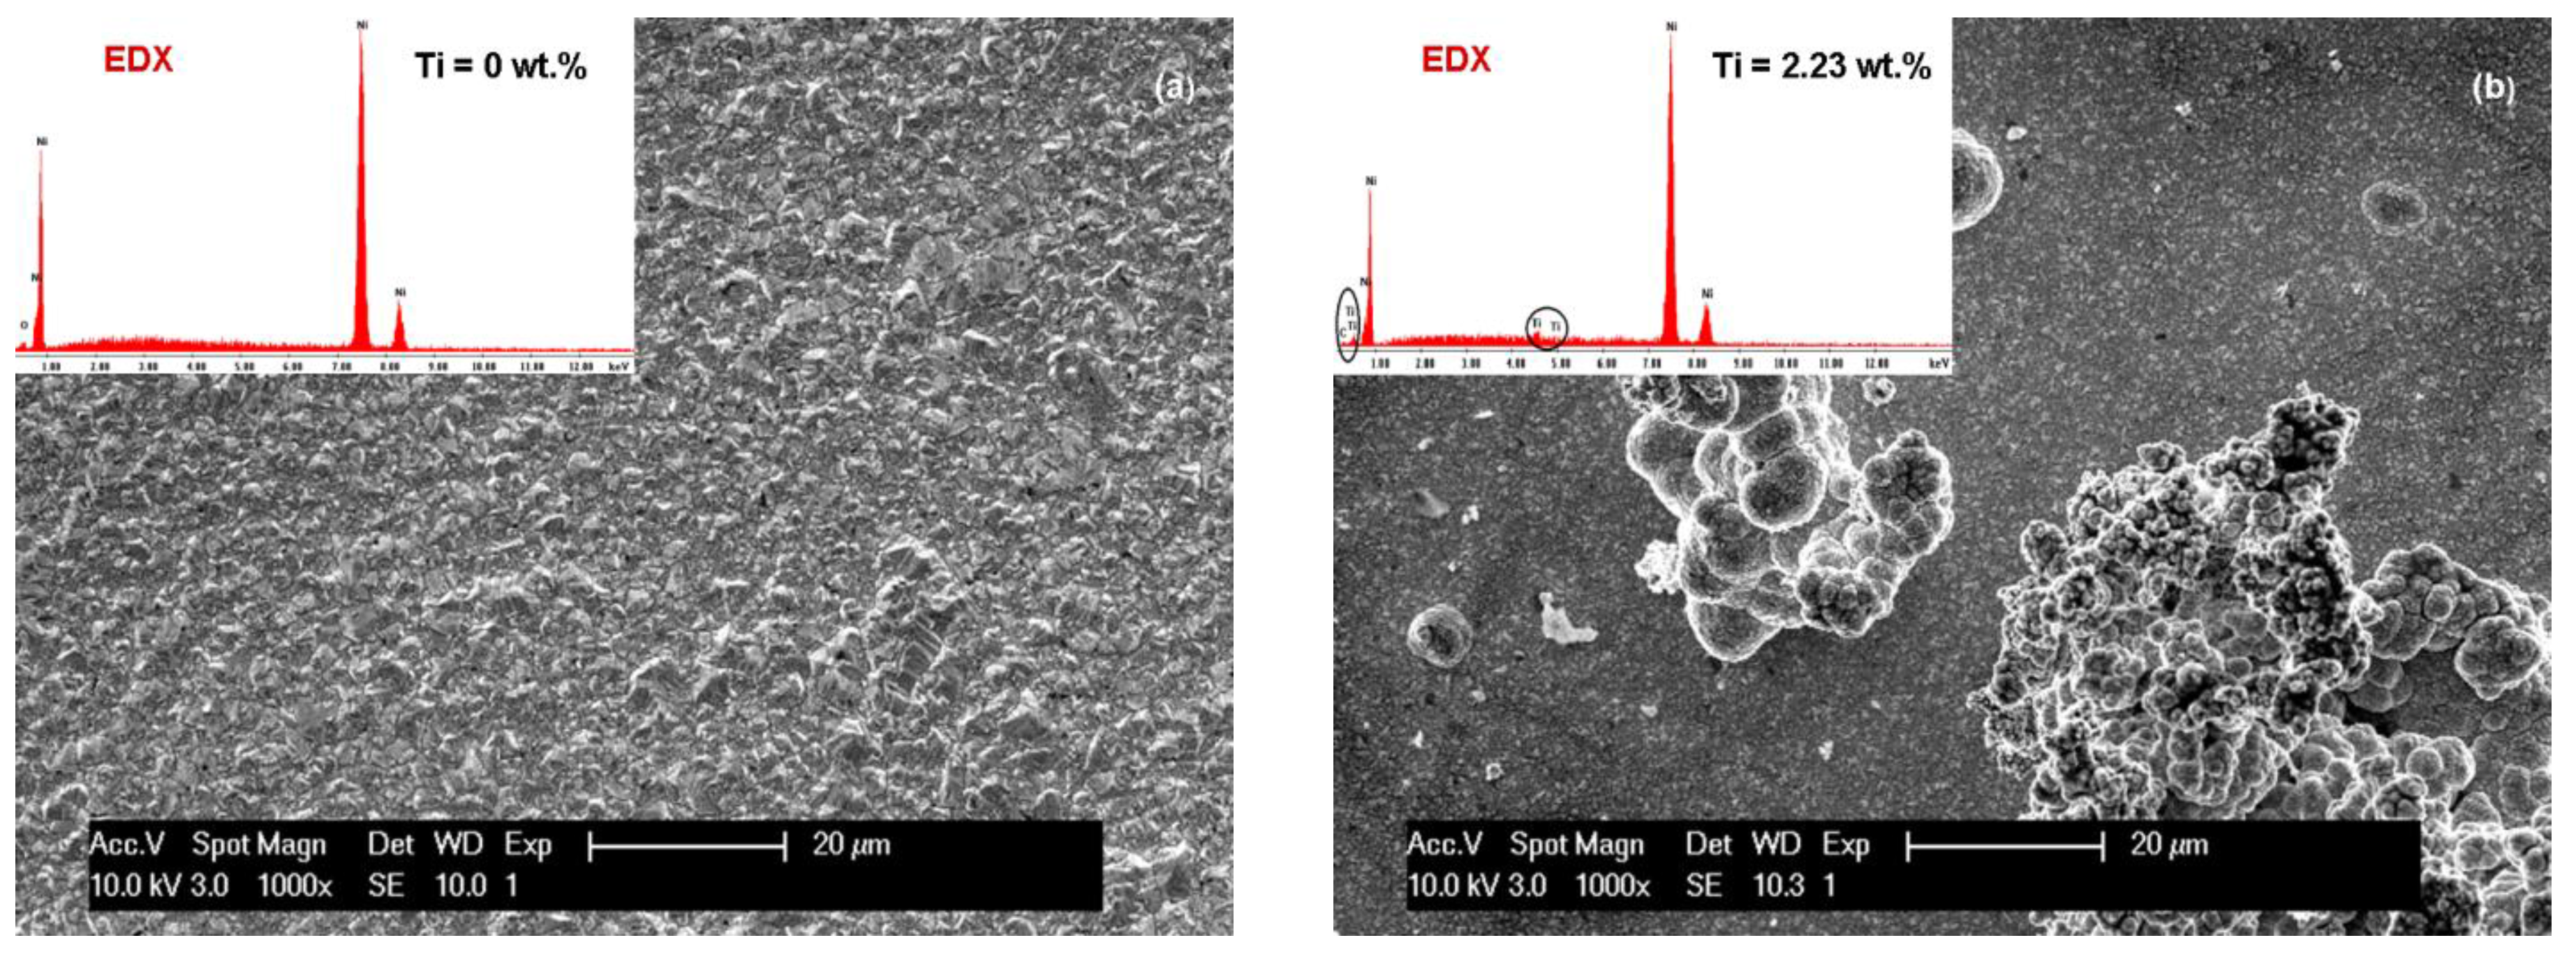
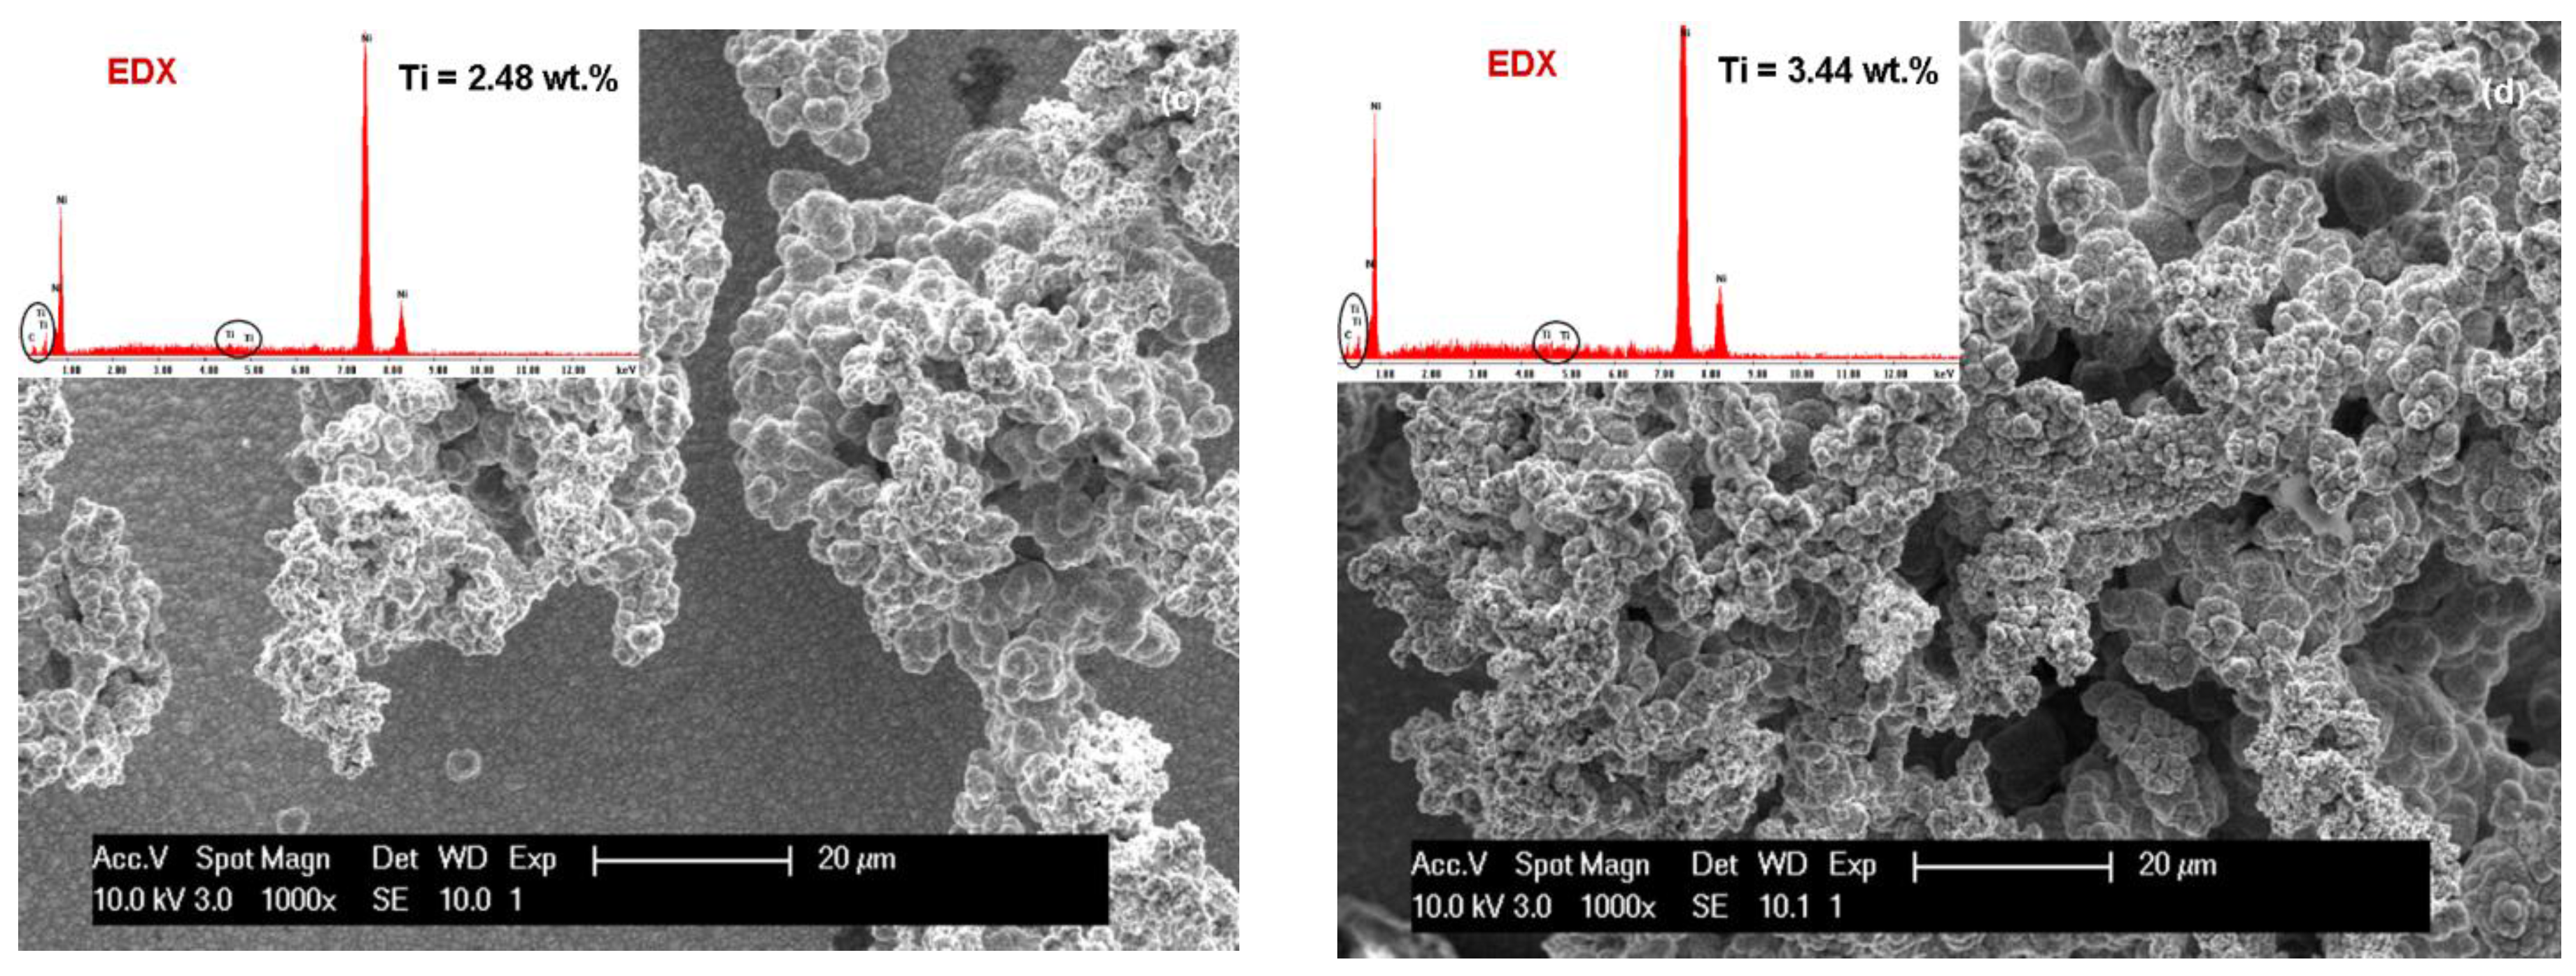
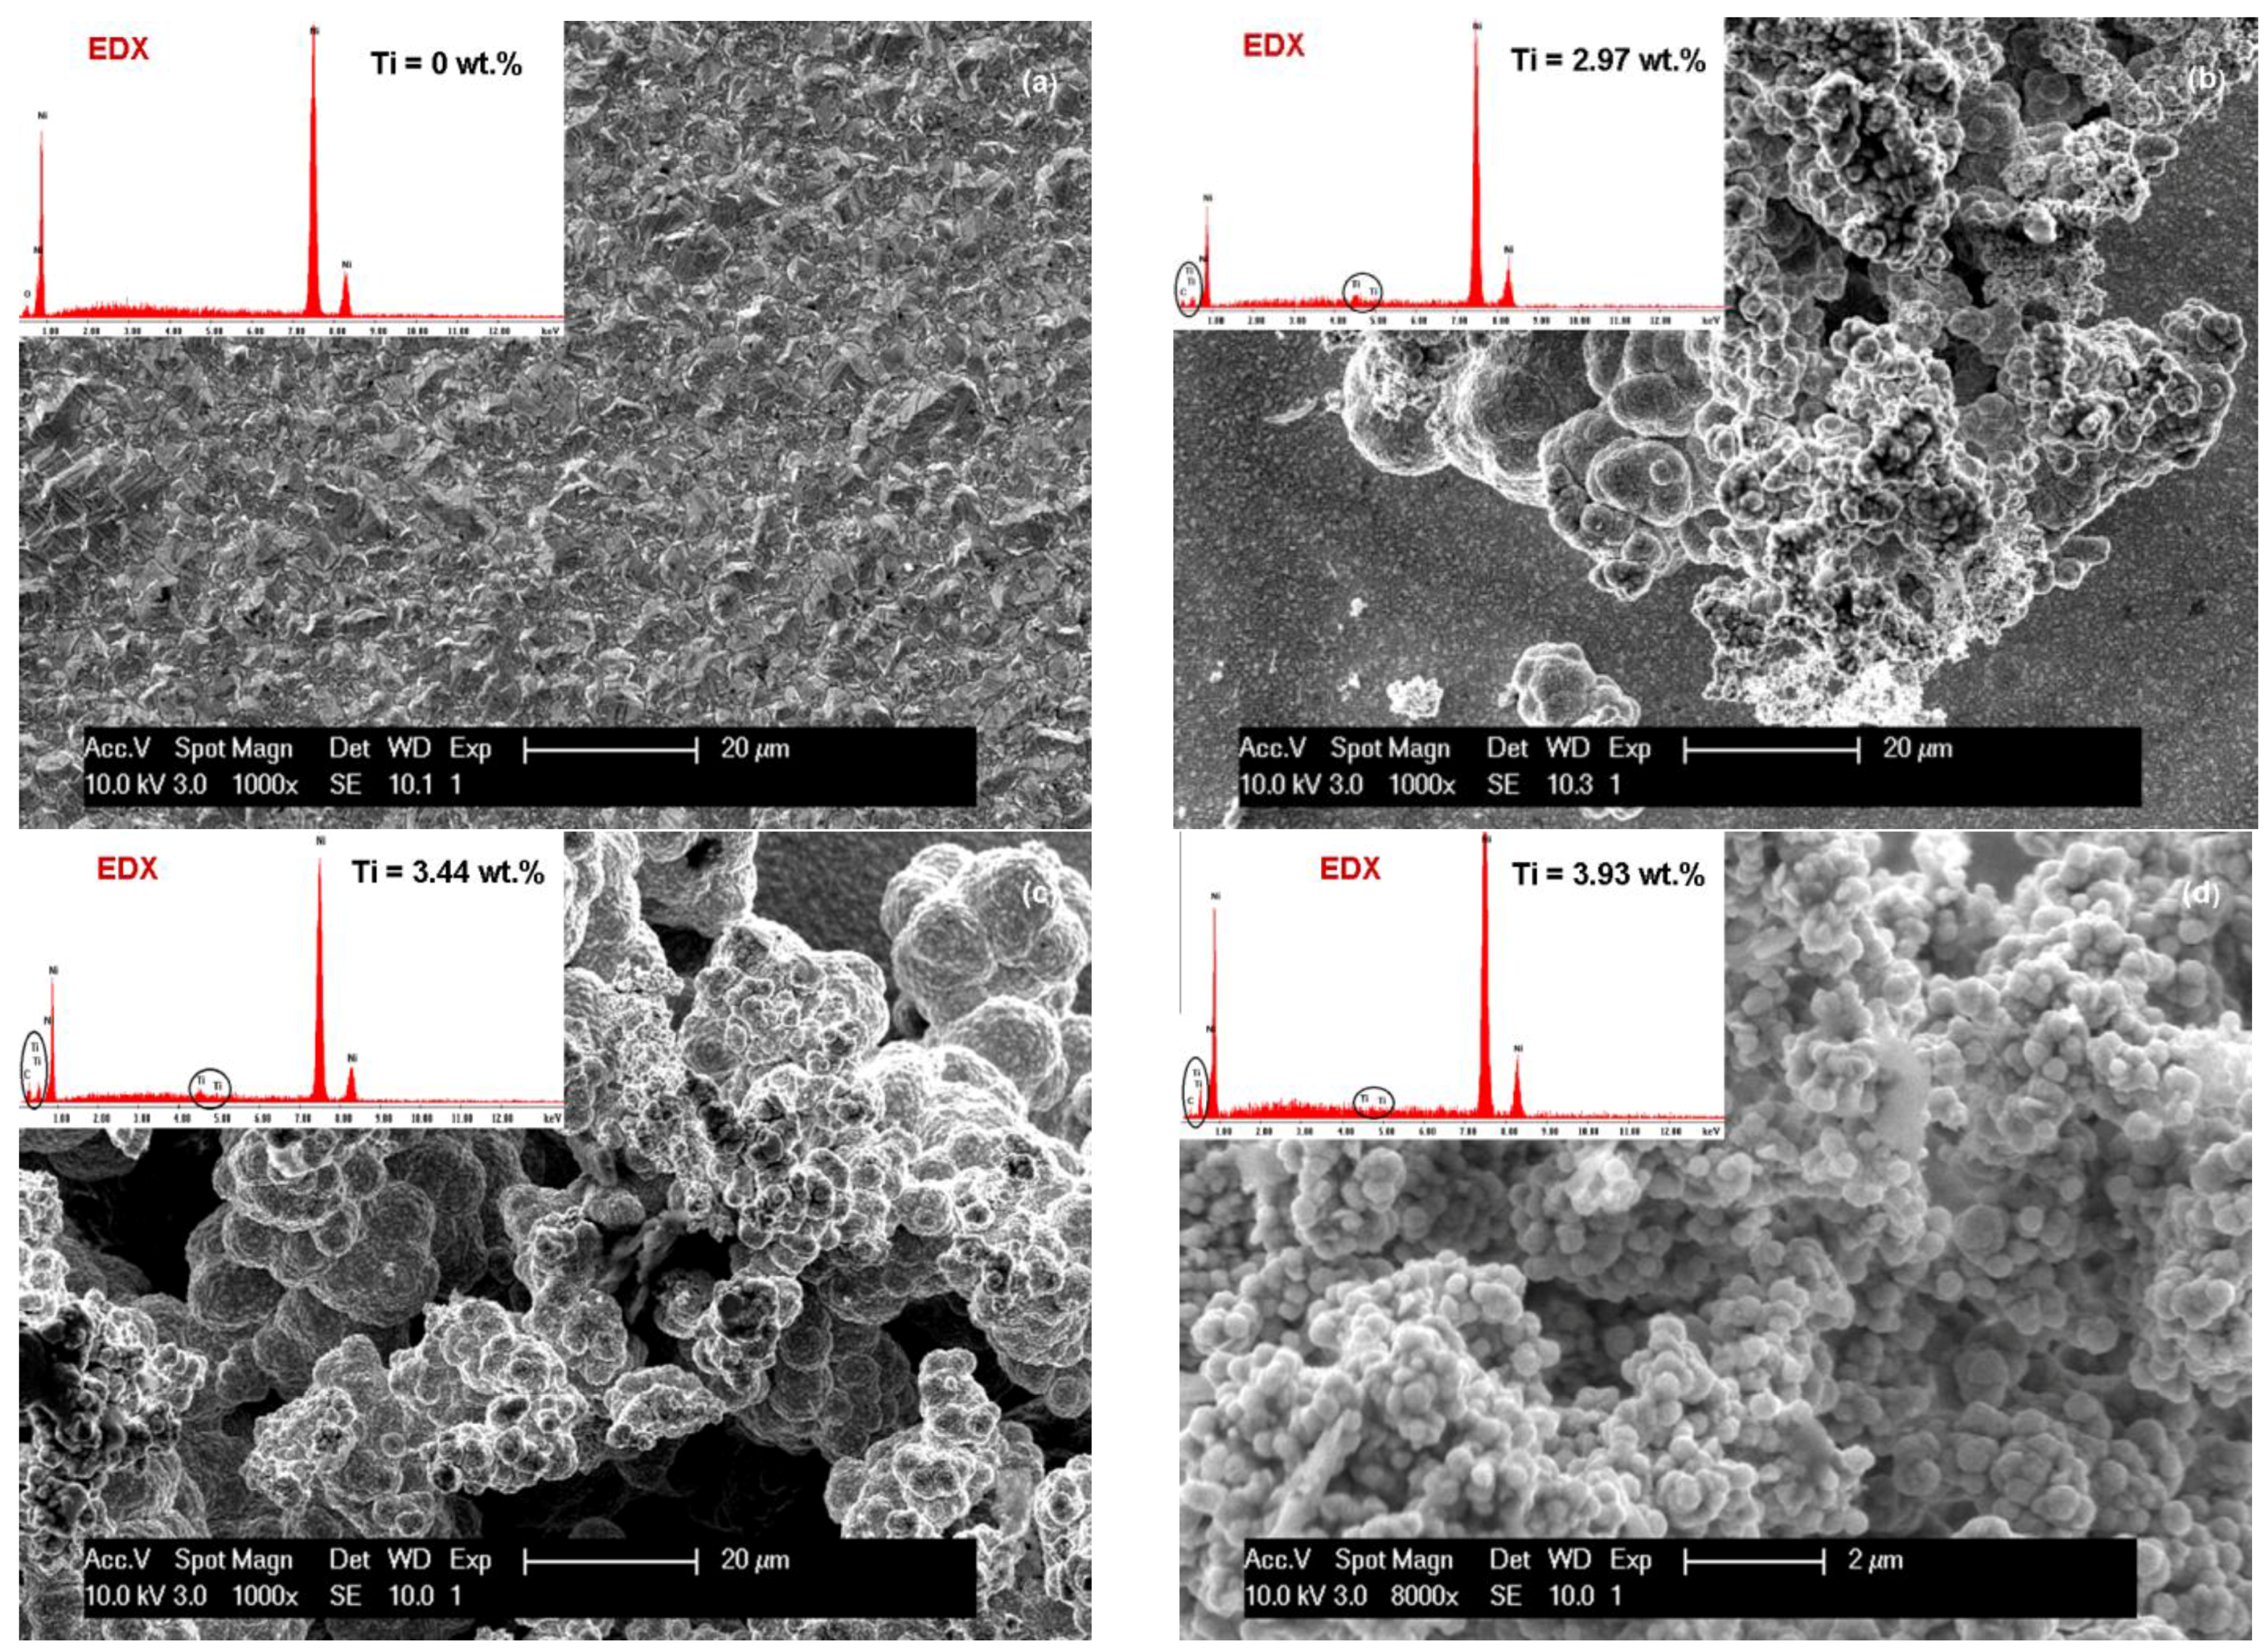
Figure 5 and
Figure 6 show the SEM surface morphologies and compositional analysis by EDX spectra of the pure nickel layers (Ni/nano-TiC (0 g·L
−1) and the Ni/nano-TiC composite layers at three concentrations (10, 15, 20 g·L
−1) obtained at the electrochemical current density of 72 mA/cm
2 during the co-deposition time of 15 min (
Figure 5) and 30 min (
Figure 6).
By using a higher current density of 72 mA/cm
2, an increased amount of nickel crystallites are formed on the surface layer of nickel matrix. These morphological changes of the layers of pure Ni at about the same current density have been reported by other authors [
23] for electro-codeposition of alumina into nickel matrix.
By increasing the current density to 72 mA/cm
2, and thus the time of codeposition, the surface morphologies’ nano-composite layers become more like clusters and agglomeration nano-composite layers as shown in
Figure 5 and
Figure 6. The reason could be that the TiC nanoparticles are good conductors, and the resulting electric field is stronger around clusters than elsewhere due to increased current density. This observation has been reported by other authors but by using other composites such as Ni-carbon black (CB) and Ni-carbon nanotubes (CNT) [
24,
25].
3.2. Nano TiC Particles Incorporation into Nickel Matrix
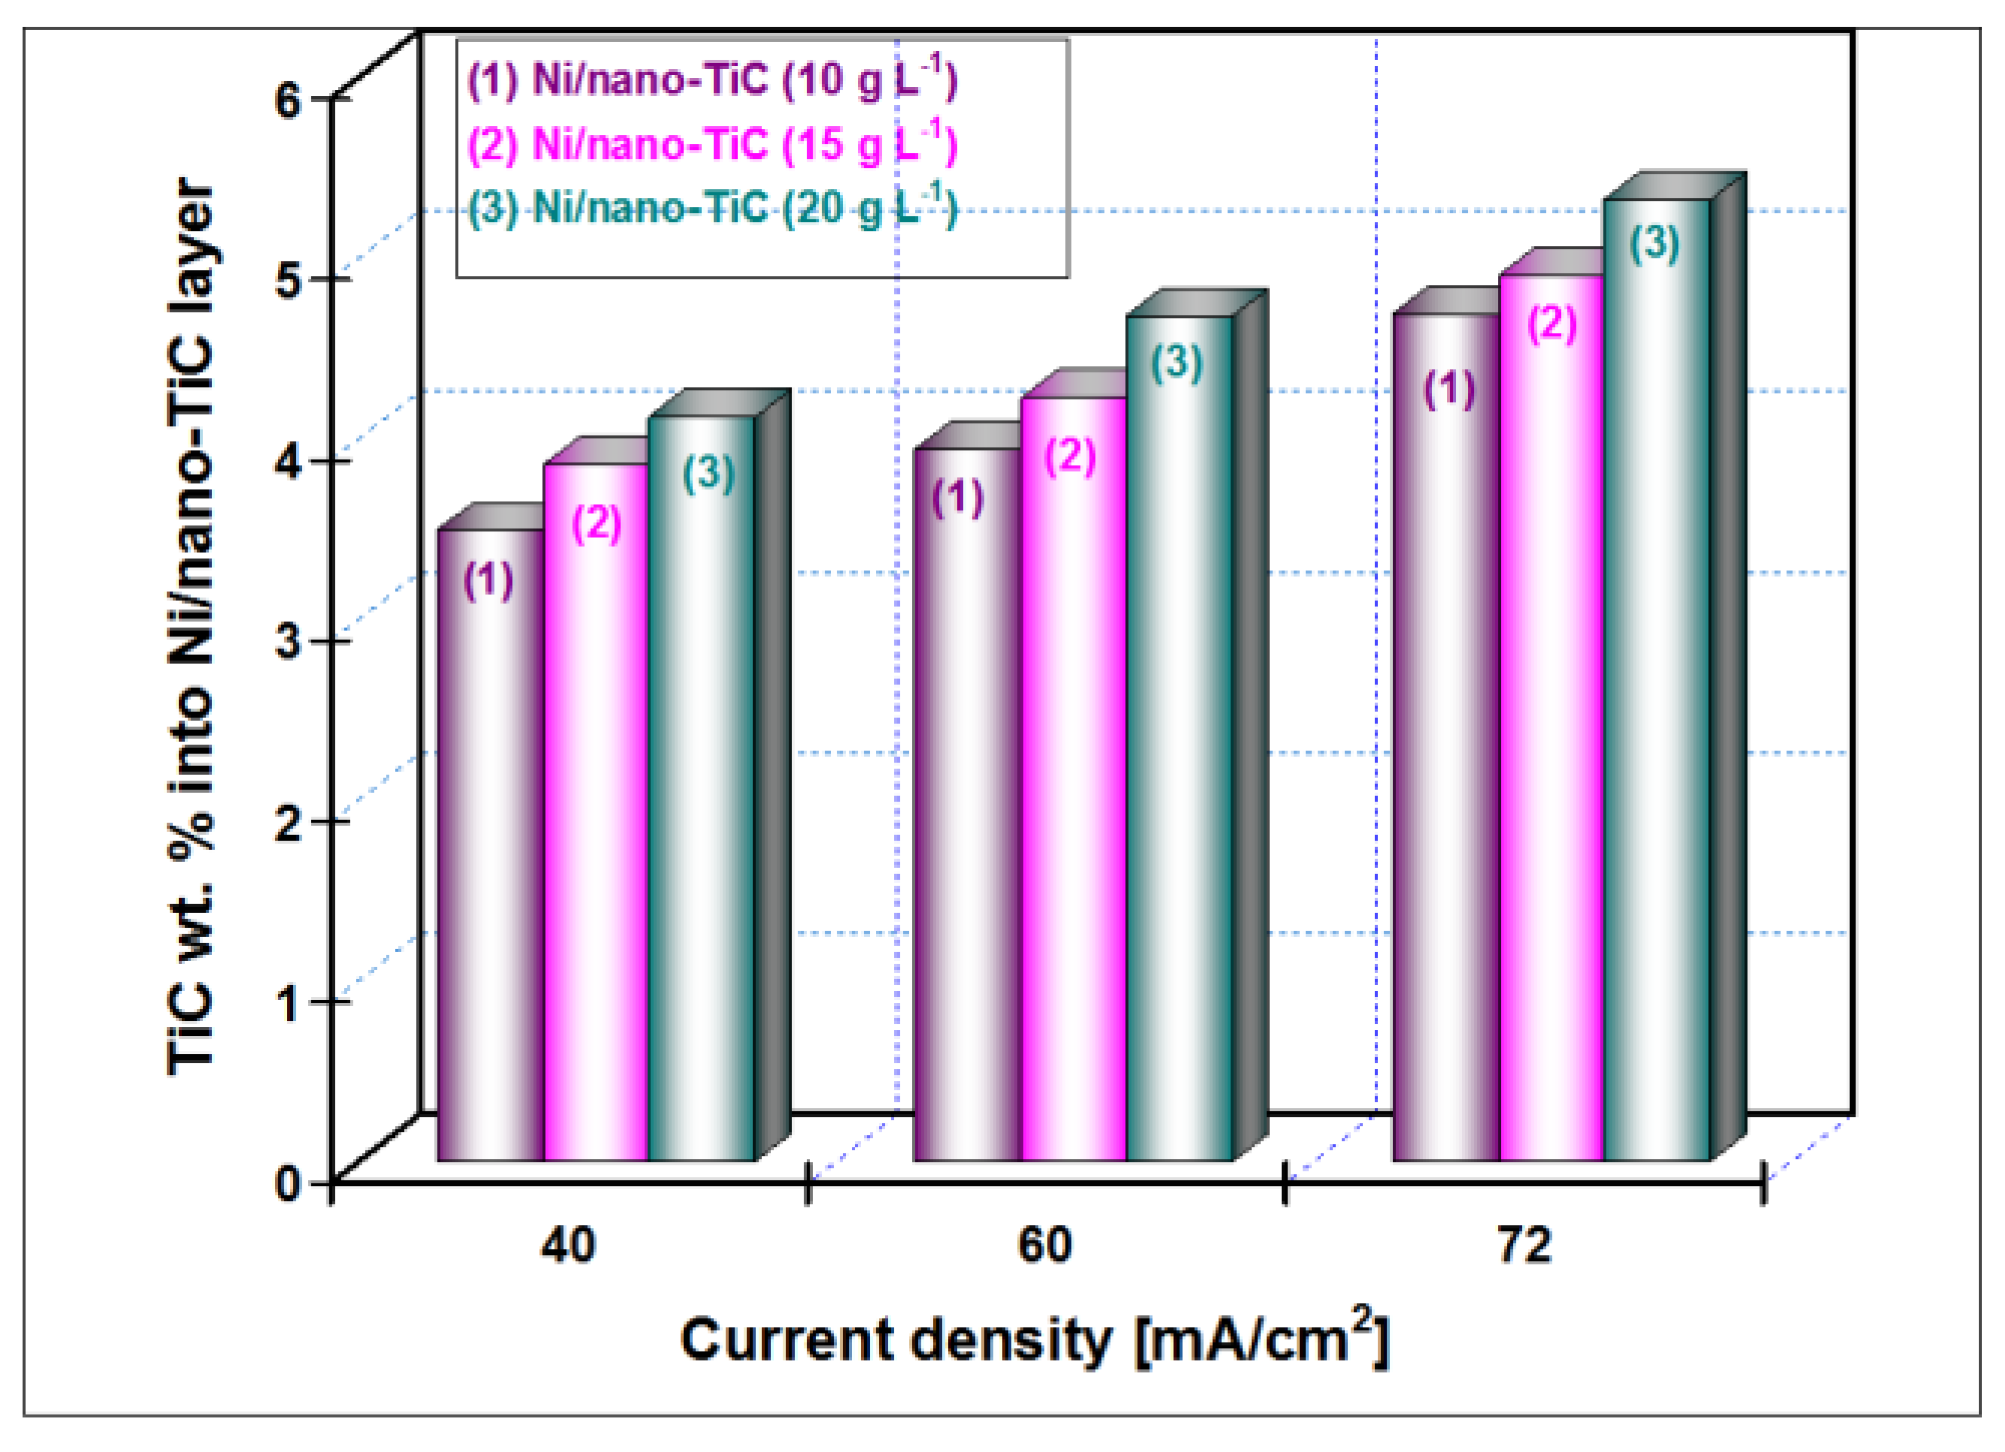
The EDX analyses were collected from the entire scan area of the samples in order to examine their elemental composition. The incorporation percentage of TiC into Ni matrix was determined by transformation of Ti weight percentage (wt. %) in molecular mass of titanium carbide. In the TiC compound, the Ti element has a value of 79.941 wt. %. The weight percentage for Ti element included in the Ni matrix (
Figure 3,
Figure 4,
Figure 5 and
Figure 6) as determined by EDX analysis is presented in
Figure 7 for the current densities of 40 mA/cm
2, 60 mA/cm
2 and 72 mA/cm
2 at a codeposition time of 15 min.
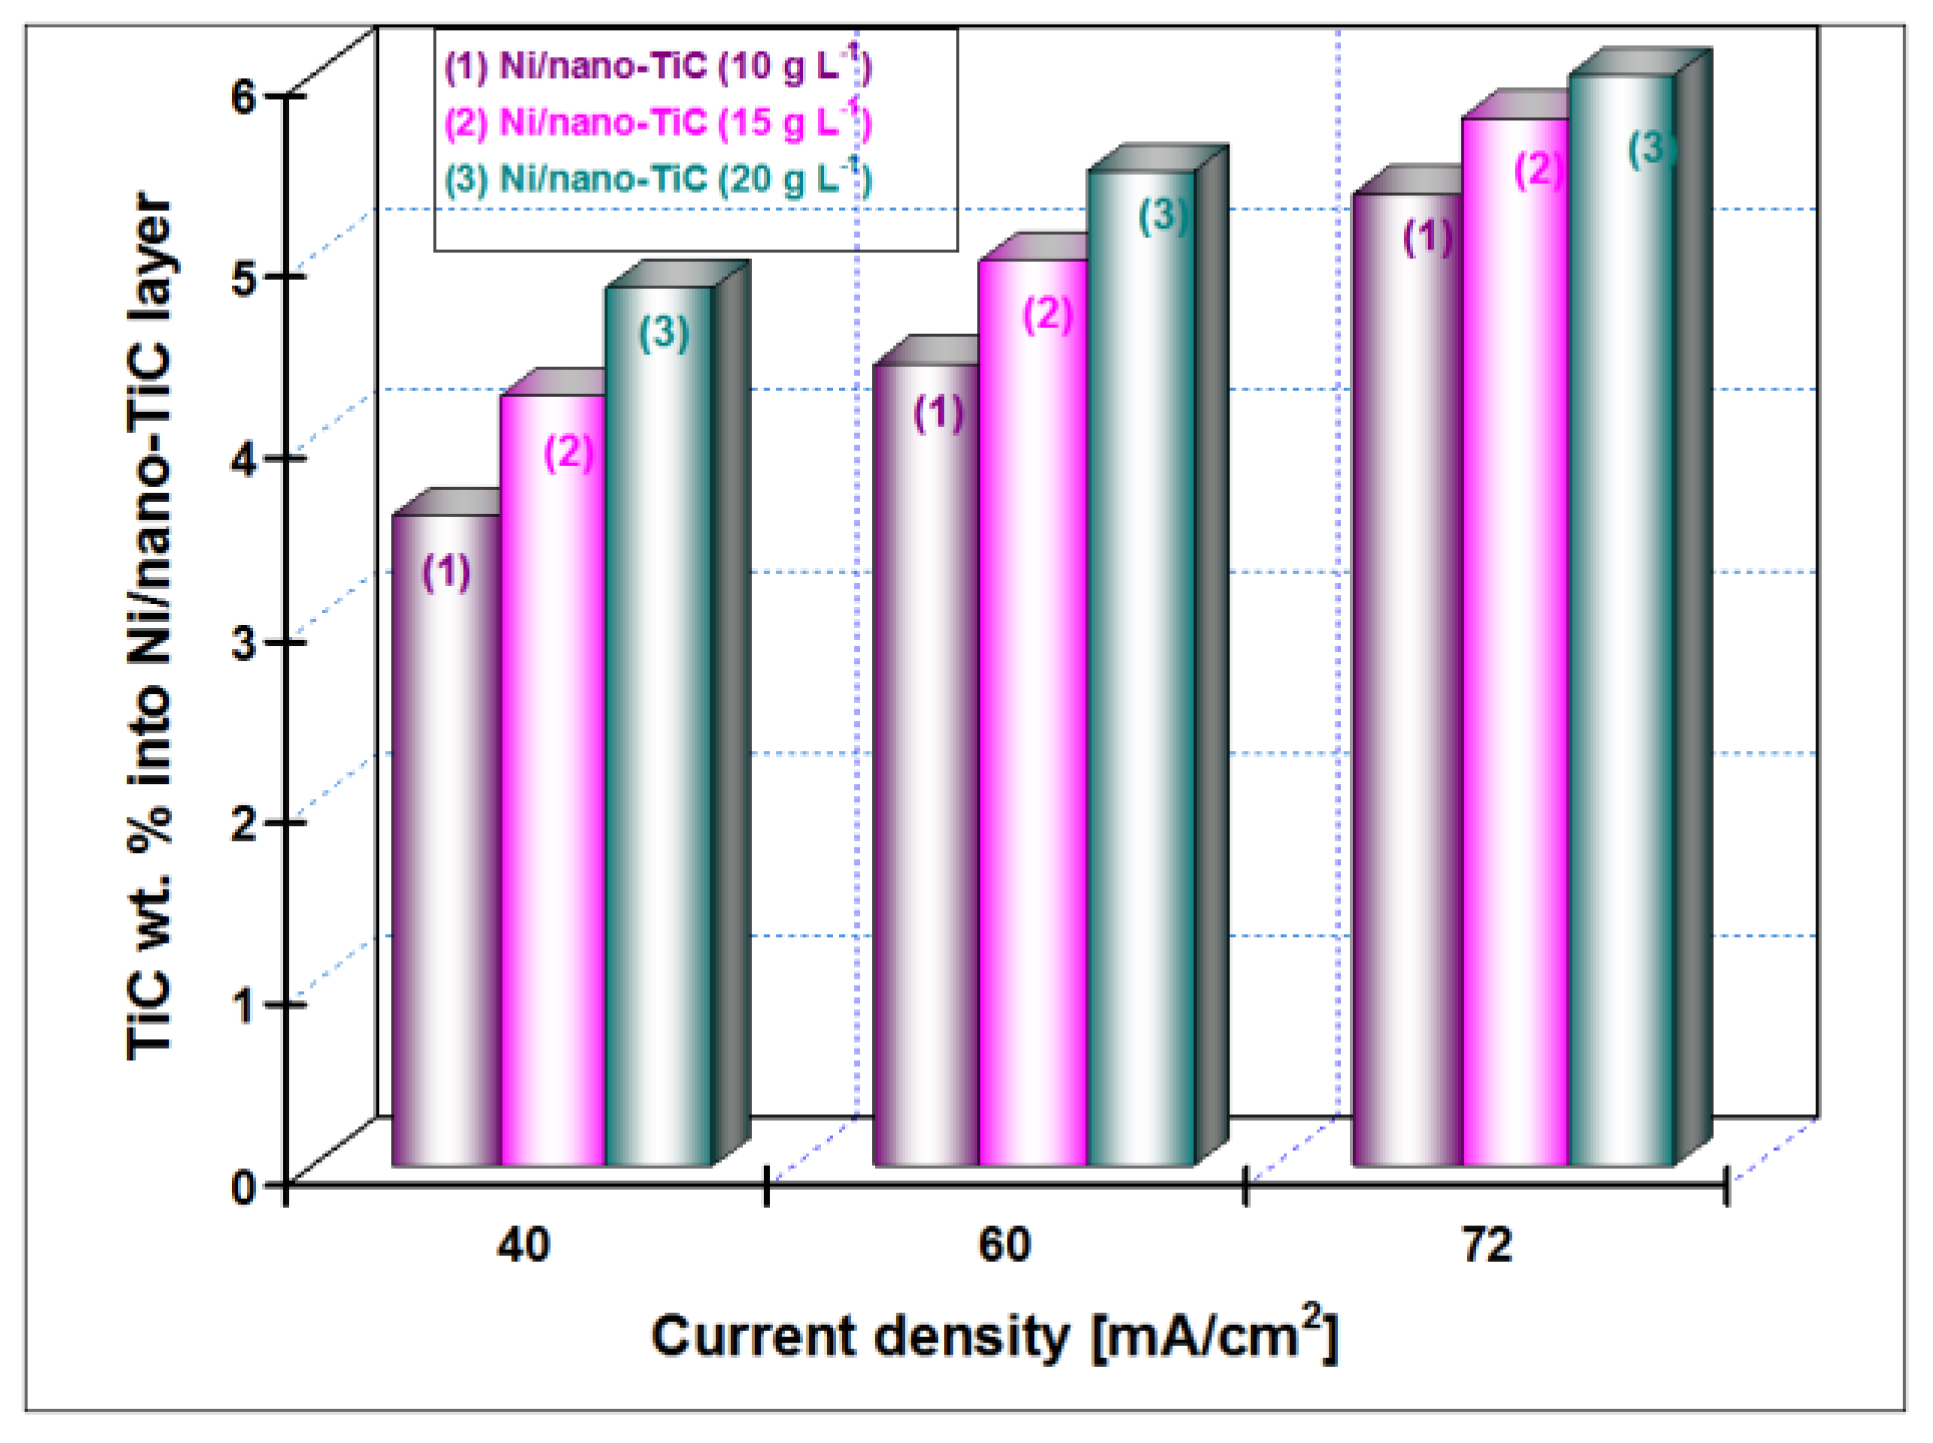
The weight percentage (wt. %) of the TiC nanoparticles incorporation into nickel matrix for all examined nanostructured layers (10, 15 and 20 g·L
−1 concentrations of TiC), with the current density (40 mA/cm
2, 60 mA/cm
2 and 72 mA/cm
2) at a codeposition time of 30 min., as was calculated from compositional EDX analysis is shown in
Figure 8.
It is indicated that the wt. % of TiC nanoparticles embedded into Ni/TiC nanostructured layers is dependent on the TiC dispersed nanoparticles concentration in the nickel plating bath and the applied current density. The wt. % of TiC into Ni/nano-TiC layer increases with increasing of TiC nanoparticles concentration in the electrolyte at the same current density. A similar behavior was reported by studies related to the electro-codeposition of TiO
2 nanoparticles with different concentrations into nickel matrix [
26]. It may also be noted that the wt. % of TiC into nanostructured Ni/TiC electrodeposited layer increases with increasing the current density for each system separately—see
Figure 7 and
Figure 8.
The variation of wt. % of the TiC nanoparticles incorporation into the nickel matrix for all examined Ni/TiC nanostructured composite layers (10, 15 and 20 g·L
−1 concentration of TiC in the electrolyte), as a function of codeposition time (15 min and 30 min) and a constant current density of 40 mA/cm
2, as a result of EDX analysis and shown in
Figure 7 and
Figure 8, conclude that an increase of the codeposition TiC wt. % nanoparticles into hybrid nanostructured composite layer is possible by increasing their concentration added to the nickel electrolyte and by increasing the codeposition time.
3.3. Current Efficiency During Electro-Codeposition
The electrodeposition process is frequently been evaluated by using one parameter to achieve an overall understanding of the three-dimensional electrodes that is current efficiency. Current efficiency (η) is the ratio of the mass of metal deposited at a given time to the mass that would be deposited if all of electric current were used in the electrolytic process (Equation (2)):
where
z is the number of electrons involved in the electrochemical reaction (for nickel,
z = 2);
F is the Faraday constant (96,487 Coulomb/mol);
M is atomic weight (58.69 g·mol
−1 for the nickel);
m is the mass electroprocessed during the time interval Δ
t (g); and
I is the electric current (A).
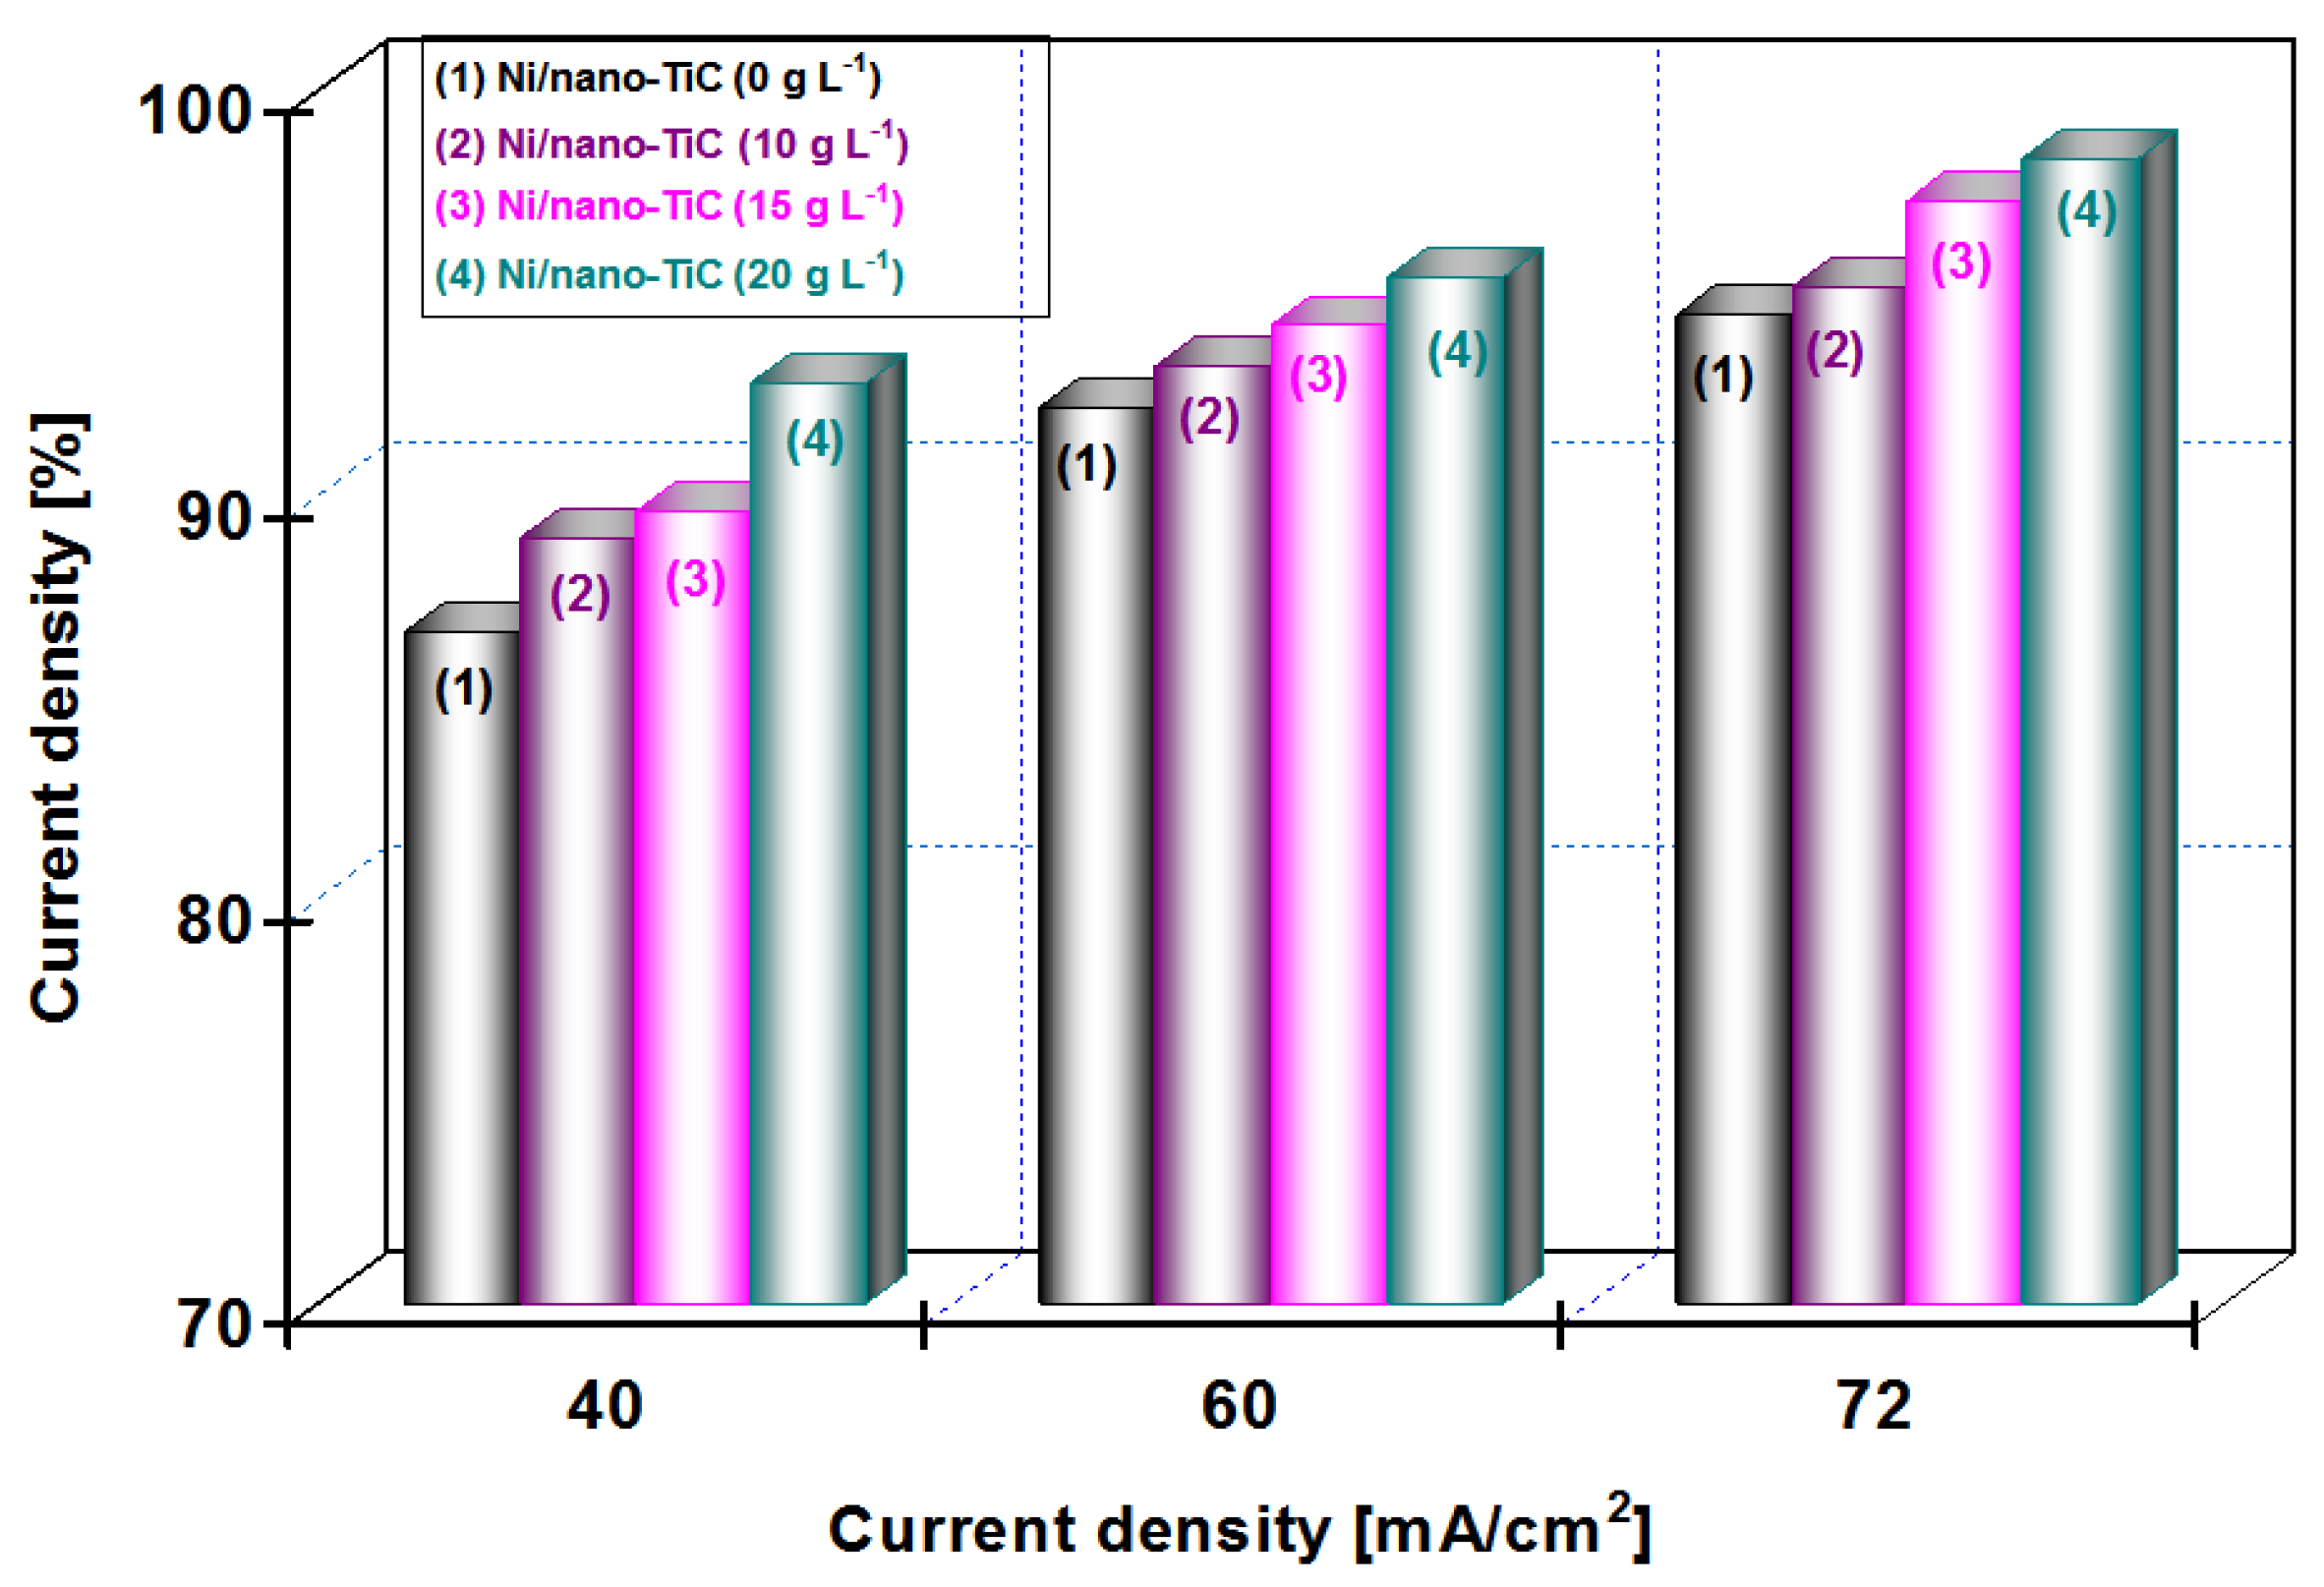
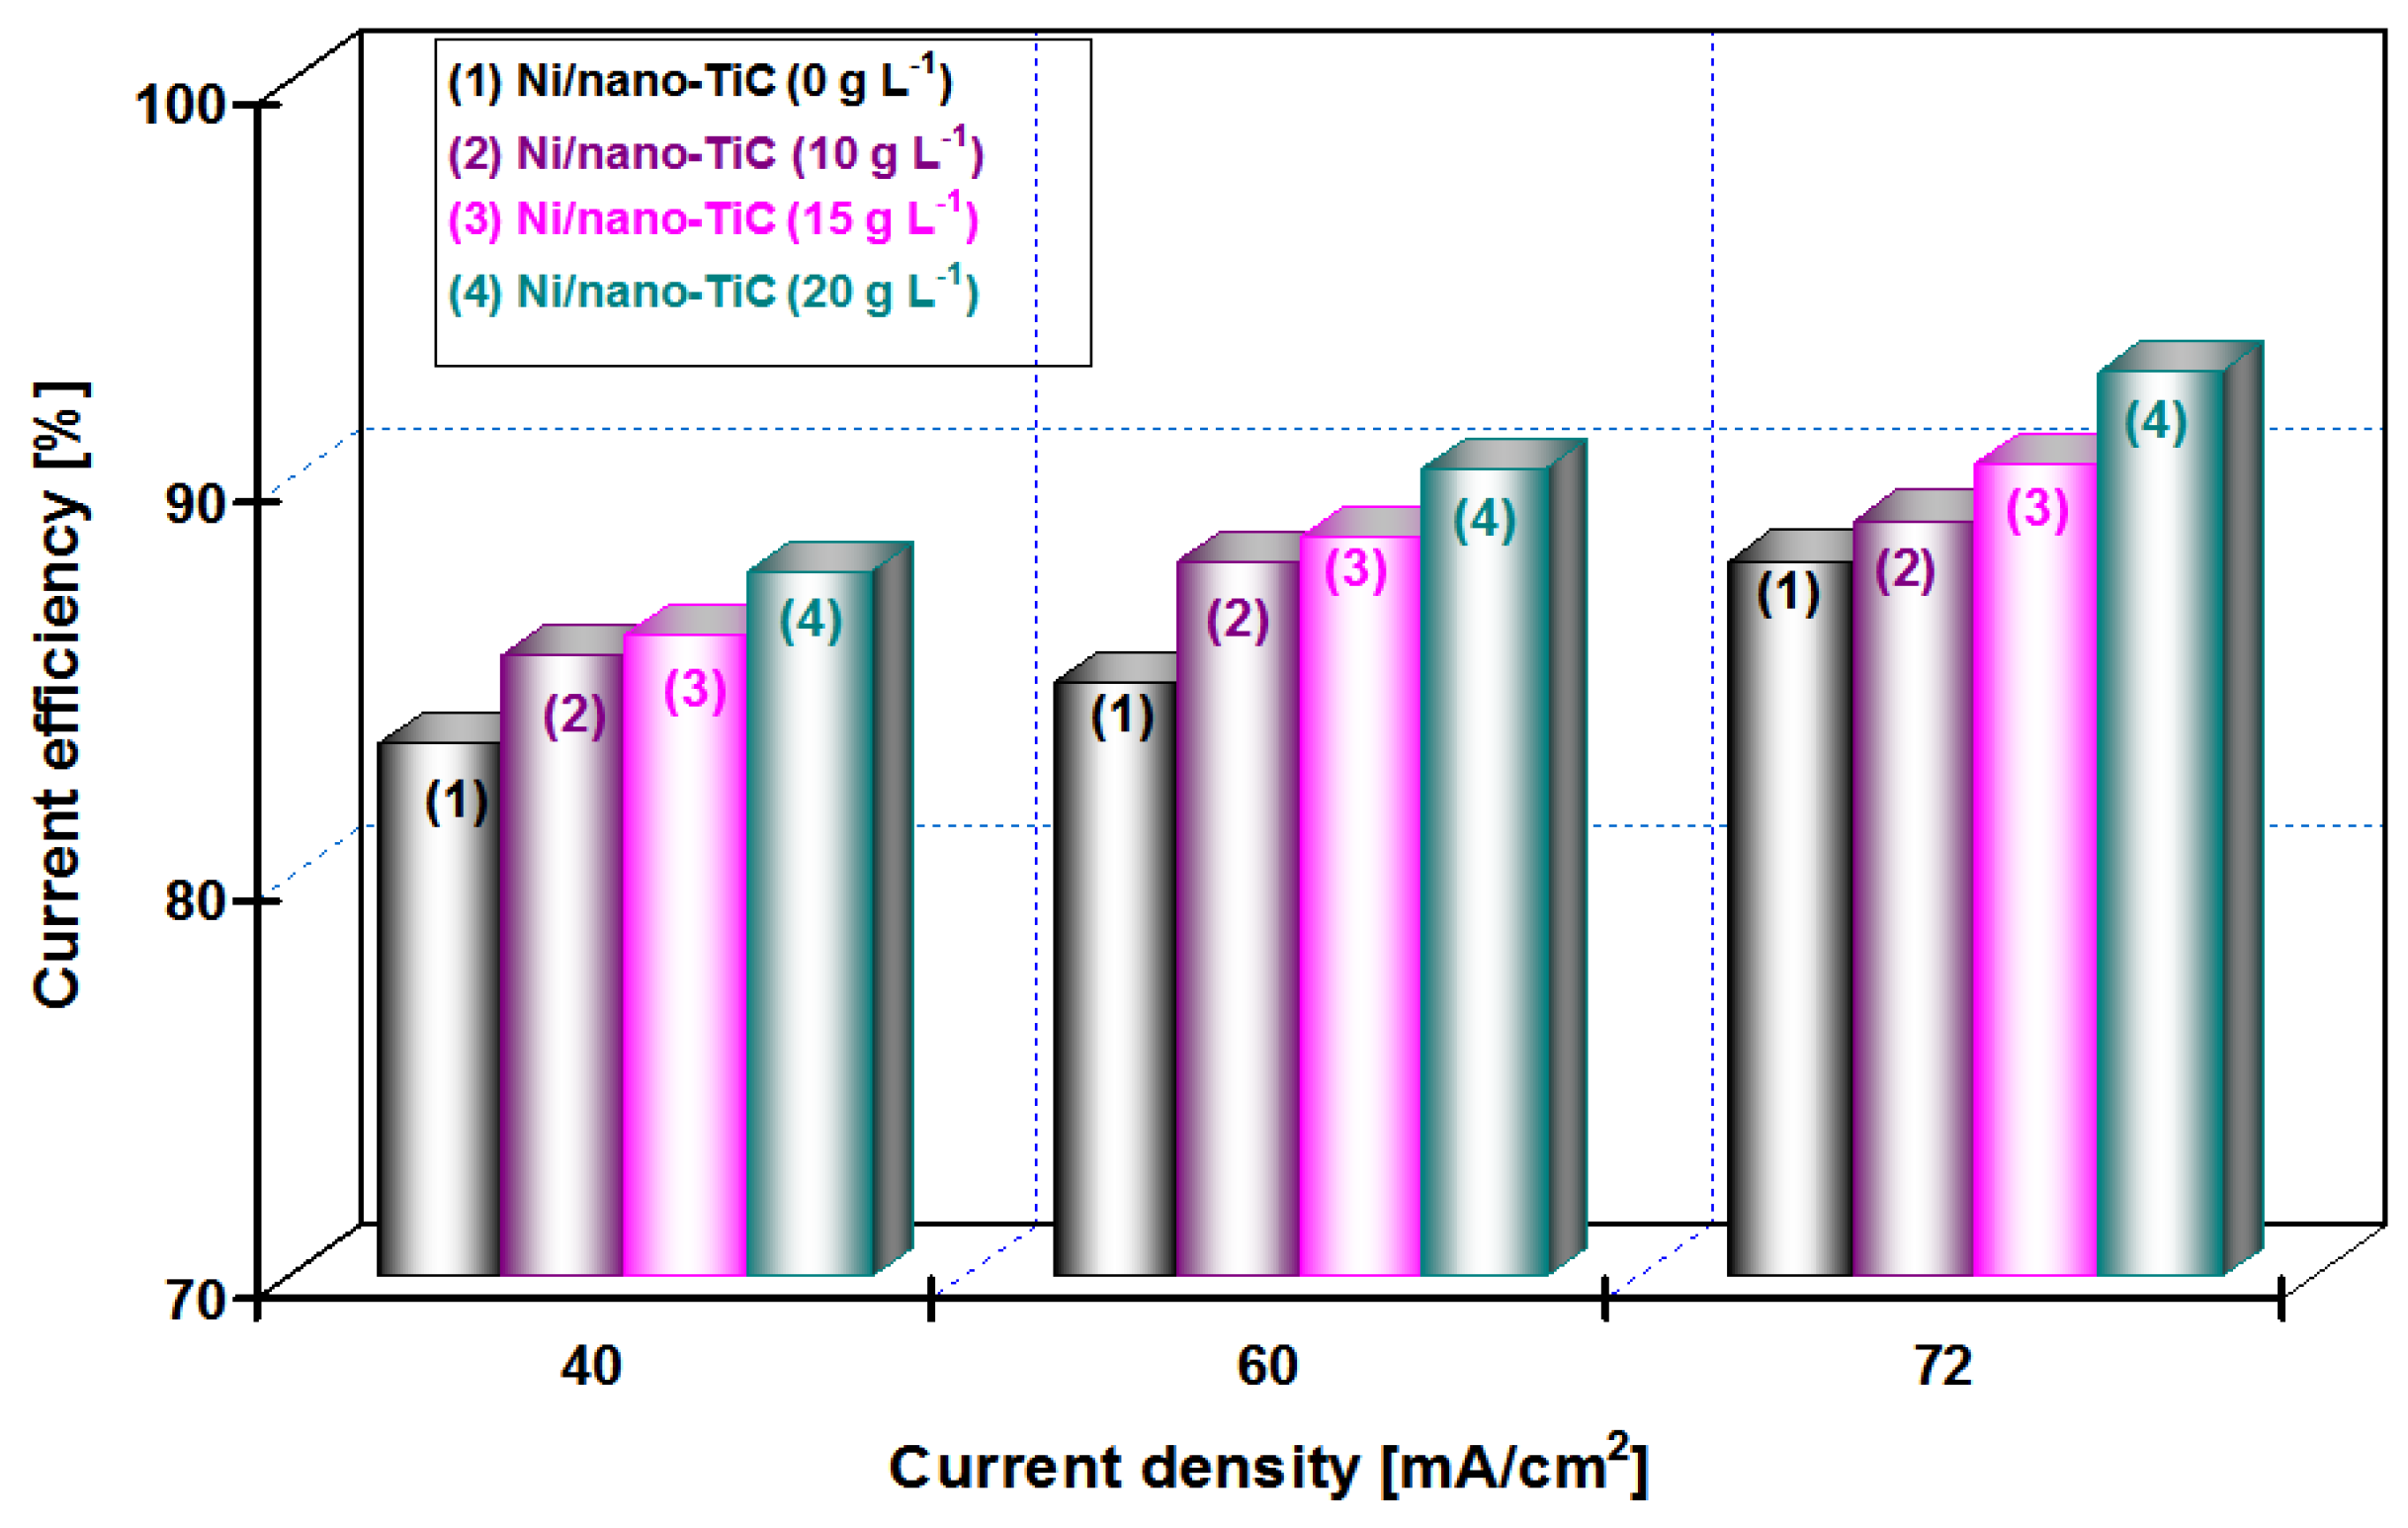
The influence of applied current densities of 40, 60 and 72 mA/cm
2 on the efficiency of the deposited layers (current efficiency), η (%) for the pure Ni and the nanocomposite Ni/nano-TiC layers obtained at different concentrations of nanoparticles (10, 15 and 20 g·L
−1) and the co-deposition time (15 min and 30 min), is shown in
Figure 9 and
Figure 10.
From
Figure 9 at a codeposition time of 15 min, it can be seen that the current efficiency of Ni/nano-TiC hybrid nanocomposite layer is about 92% at a current density of 72 mA/cm
2. From
Figure 10, at a codeposition time of 30 min, the current efficiency of Ni/nano-TiC nanocomposite layer reached about 98% at the same current density.
The higher current efficiency obtained during electro-codeposition of nano-TiC particles with nickel could be explained by embedding these nanoparticles into a nickel matrix during the electroplating process.
The results presented in this chapter concludes the beneficial effect of TiC nanoparticles in increasing the current efficiency at electro-codeposition of Ni/TiC hybrid nanocomposites compared with pure nickel layers.
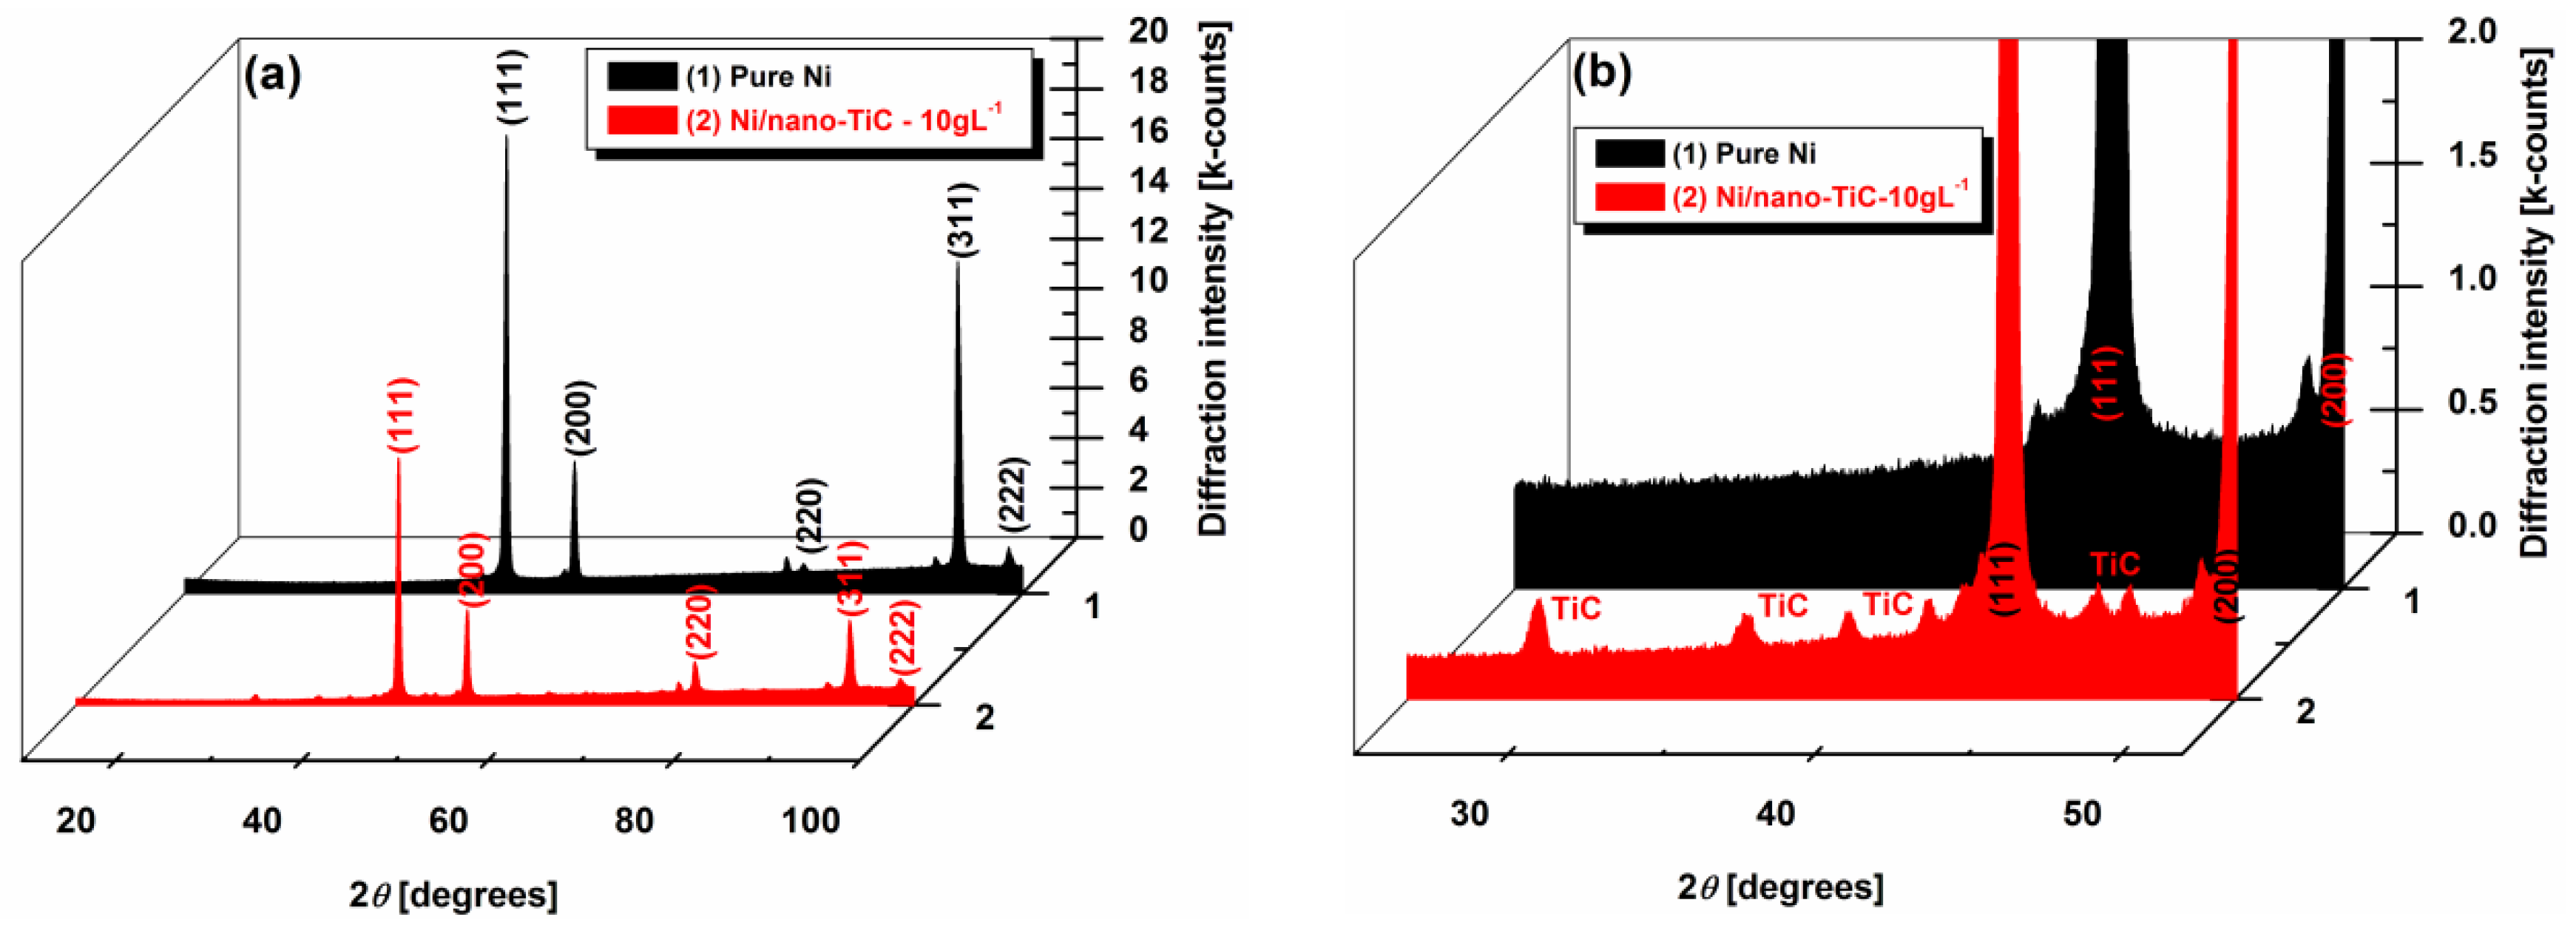
3.4. X-ray Diffraction Patterns of Ni/TiC Hybrid Nanocomposite Layers
Figure 11a,b show the X-ray diffraction analysis at different scale ranges of the pure Ni and the Ni/nano-TiC functional nanocomposite coatings with a concentration of 10 g·L
−1. The diffractograms presented in
Figure 5a are characterized by the (111), (200), (220), (311) and (222) diffraction peaks. The same X-ray diffraction patterns of the electrodeposited nanocrystalline nickel coatings were also obtained by other researchers [
19,
27]. The presence of TiC nanoparticles in the composite is also noticed in XRD analysis, as can be seen in
Figure 11b, which represents the enlarged region of
Figure 11a, with diffraction peaks of TiC particles embedded into the nickel matrix.
It can be seen that the pure Ni coating has the most intense peaks with 2θ angles of 44.6°, 51.9° and 93°. These peaks are attributed to the crystalline planes (111), (200) and (311), respectively, as was also reported by other researchers [
19,
28].
The maximum values of intensities corresponding to the planes (111), (200) and (311) for pure nickel and Ni/nano-TiC coatings deposited from electrolytes containing 10 g·L
−1 TiC are given in
Table 1, as they resulted from
Figure 11a.
The intensity of the diffraction peaks of the nickel in the Ni/nano-TiC nanocomposite functional coating is observed to be lower (
Table 1), and the peak width is broader compared with that of the pure nickel coating (
Figure 11a). This is attributed to the decrease in the crystallite size of the Ni/nano-TiC coating by the addition of TiC particles into the plating bath. A similar effect of particle addition on grain size has also been reported earlier by Arghavanian
et al. [
29] for Ni-ZrO
2 composite coating (ZrO
2 powder with a particle size of 1–5 μm) compared with pure nickel coating, and by Vaezi
et al. [
30] for Ni-SiC nano-composite (SiC nano-particulates of 50 nm mean diameter) as compared with nickel coating.
The relative texture coefficients, RTC
111, RTC
200 and RTC
311, corresponding to (111), (200) and (311) crystallographic planes, were calculated according to Equation (3) and are given in
Table 2.
where
Ihkl are the relative intensities of the (
hkl) reflections, Ʃ
Ihkl is the sum of all intensities, in our case (111), (200), (220), (311) and (222).
are the relative intensities of a randomly oriented nickel powder sample, from JCPDS No. 4-850 (Joint Committee on Powder Diffraction Standards) [
19,
28].
From the relative texture coefficient (
RTC) value given in
Table 2, it has been observed that the pure Ni coating from the particle free bath shows more texturing along the (311) plane, resulting in preferred orientation along the (311) plane. The addition of TiC nanoparticles into the bath modifies the preferred orientation of the pure Ni coating along the (311) crystallographic plane, reducing the
RTC value at 28.73 (about half), compared with that of the pure Ni coating. The TiC nanoparticle incorporation caused a loss of texture, indicated by the decreasing of
RTC311 and the increasing of
RTC111 and
RTC200 values (
Table 2).
These observed changes in
RTC are sufficient to prove that the wear properties of the Ni/TiC nanocomposite coatings will be improved, because is know that, in the crystallographic plane (111), adjacent atomic layers can slide over each other with minimum friction. This last statement is supported by the fact that an (111) oriented deposit exhibits superior wear performance, and an increasing of the relative texture coefficient from the (111) plane means that the coating becomes stronger [
31,
32].
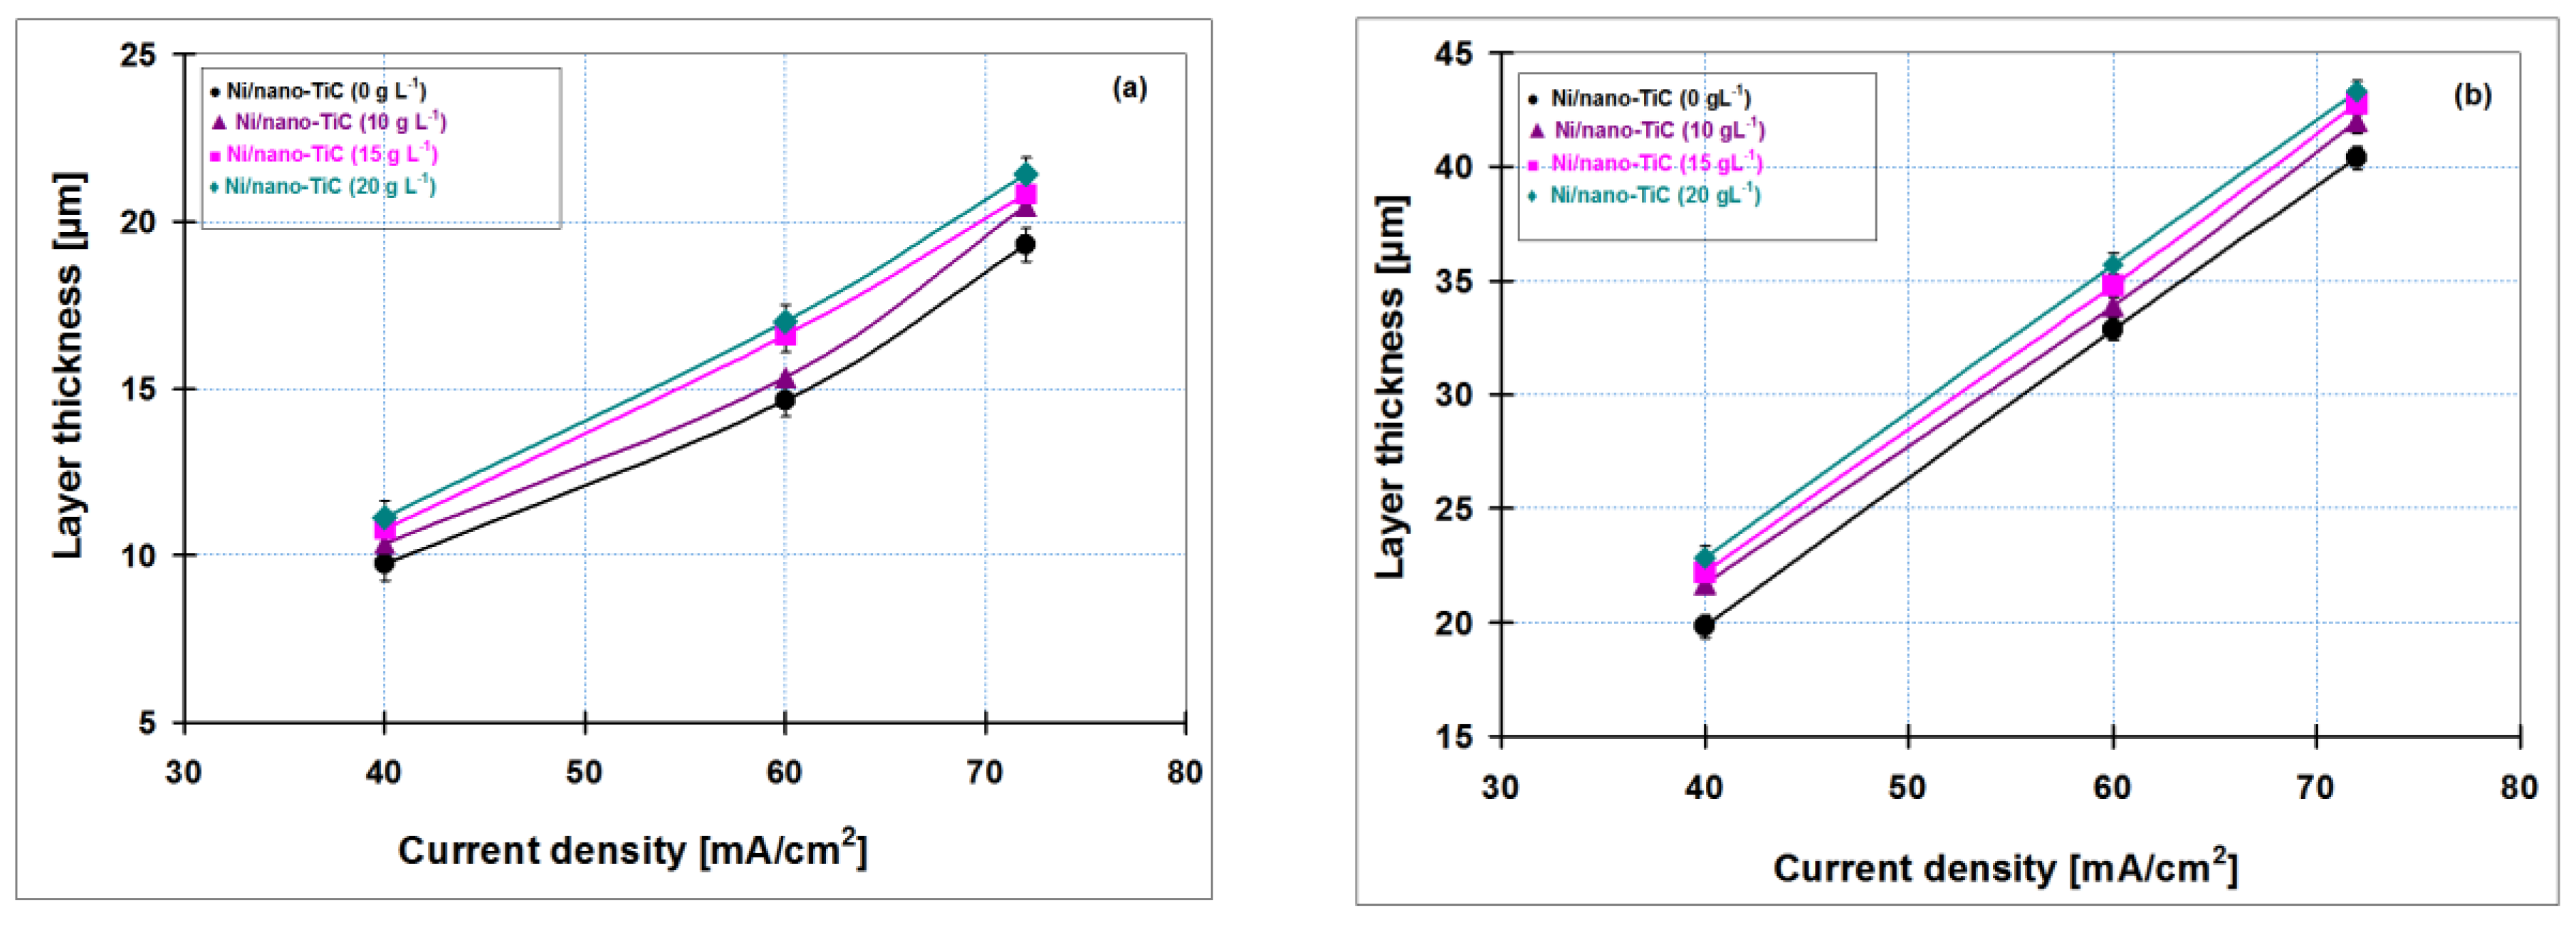
3.5. Thicknesses of Ni/Nano-TiC Hybrid Nanostructured Layers
Figure 12 shows the correlation between the thickness obtained by weighting and SEM cross section as the average of three measurements
versus current density of codeposited layers for all nanoparticle concentrations of titanium carbide added to nickel electrolyte (10, 15 and 20 g·L
−1) compared to pure nickel layer obtained at 15 min (
Figure 12a) and 30 min (
Figure 12b).
Figure 12a,b indicate that the thickness of electrodeposited layers increases with increasing current densities; this upward trend was obtained for all types of codeposited layers. In addition, the layer thickness increases with increasing concentration of TiC nanoparticles in the nickel electrolyte solution. By adding 20 g·L
−1 TiC nanoparticles in the nickel plating bath, the Ni/nano-TiC layer thicknesses are higher as compared with pure nickel layer and the others composite systems, confirming the incorporation of titanium carbide nanoparticles into metallic matrix. Due to increasing of electrodeposition time, an increase in coating thickness has also been observed.
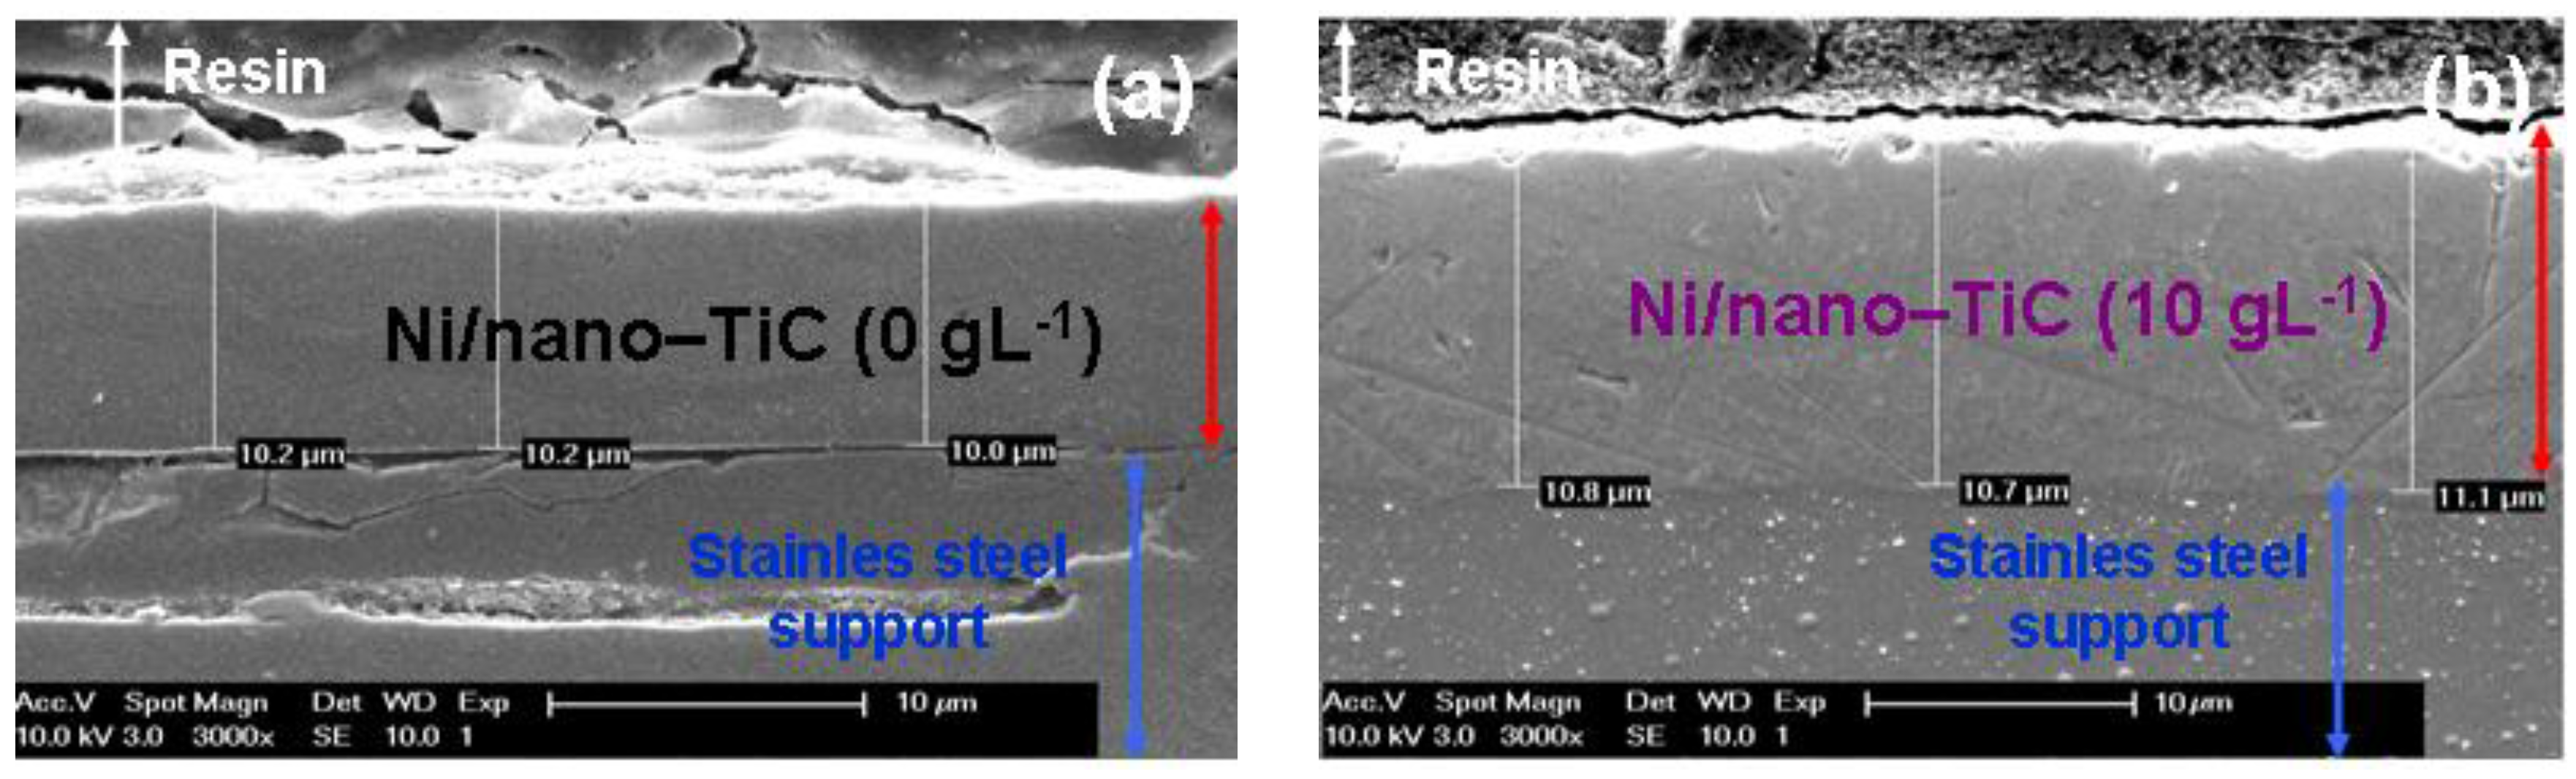
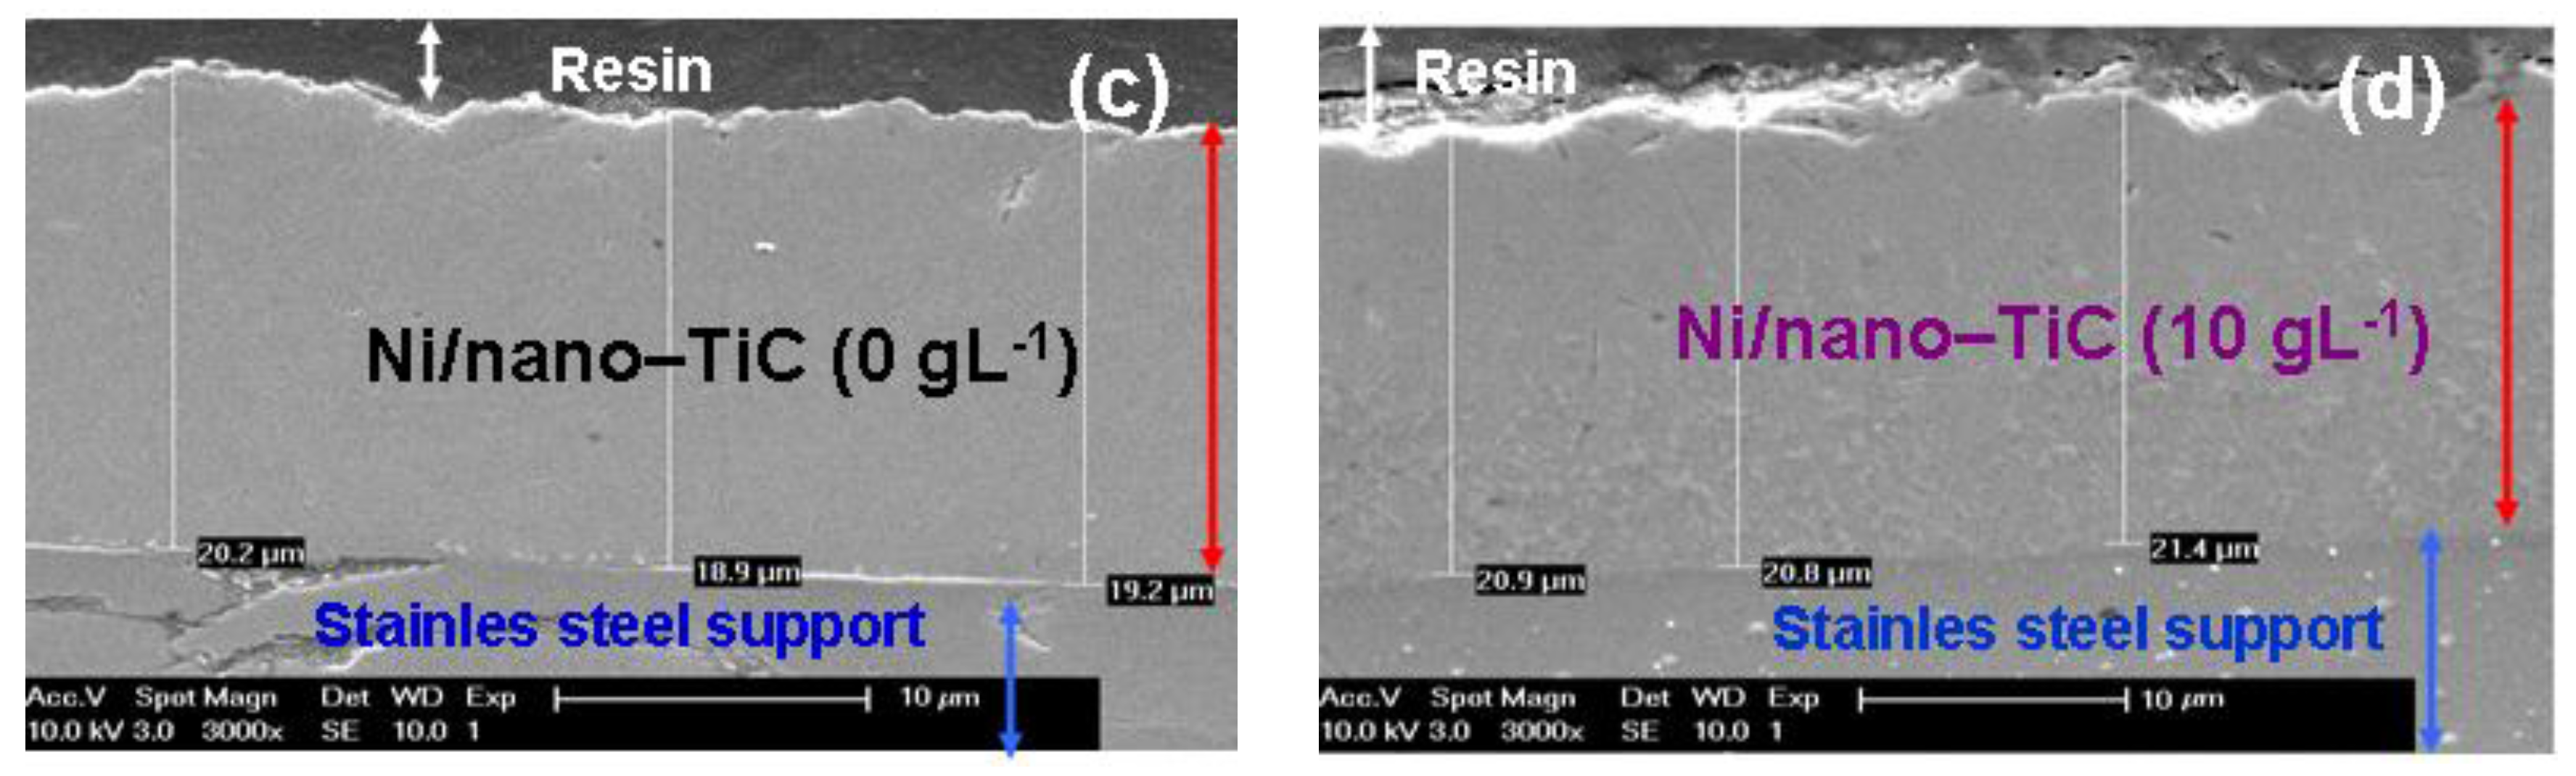
In order to confirm the layer thickness calculated by weighting, the real thicknesses were also analyzed by SEM on cross section of the samples (
Figure 13).
Figure 13 reveals the thicknesses measured by SEM in cross sections on for pure Ni layer and Ni/nano-TiC (10 g·L
−1) obtained at a current density of 40 mA/cm
2 and at codeposition time of 15 min. (
Figure 13a,b) and at codeposition time of 30 min. (
Figure 13c,d).
The coating thicknesses determined with SEM on cross section (
Figure 13) are in full accordance with those calculated by weighting before and after electrodeposition and keep the same increasing trend with increasing concentration of TiC nanoparticles and time of electrodeposition. This increasing trend is achieved with all types of electrodeposited layers.
The scanning electron micrographs of electroplated layers performed in cross section confirm also a good adhesion of the layers to the stainless steel support.
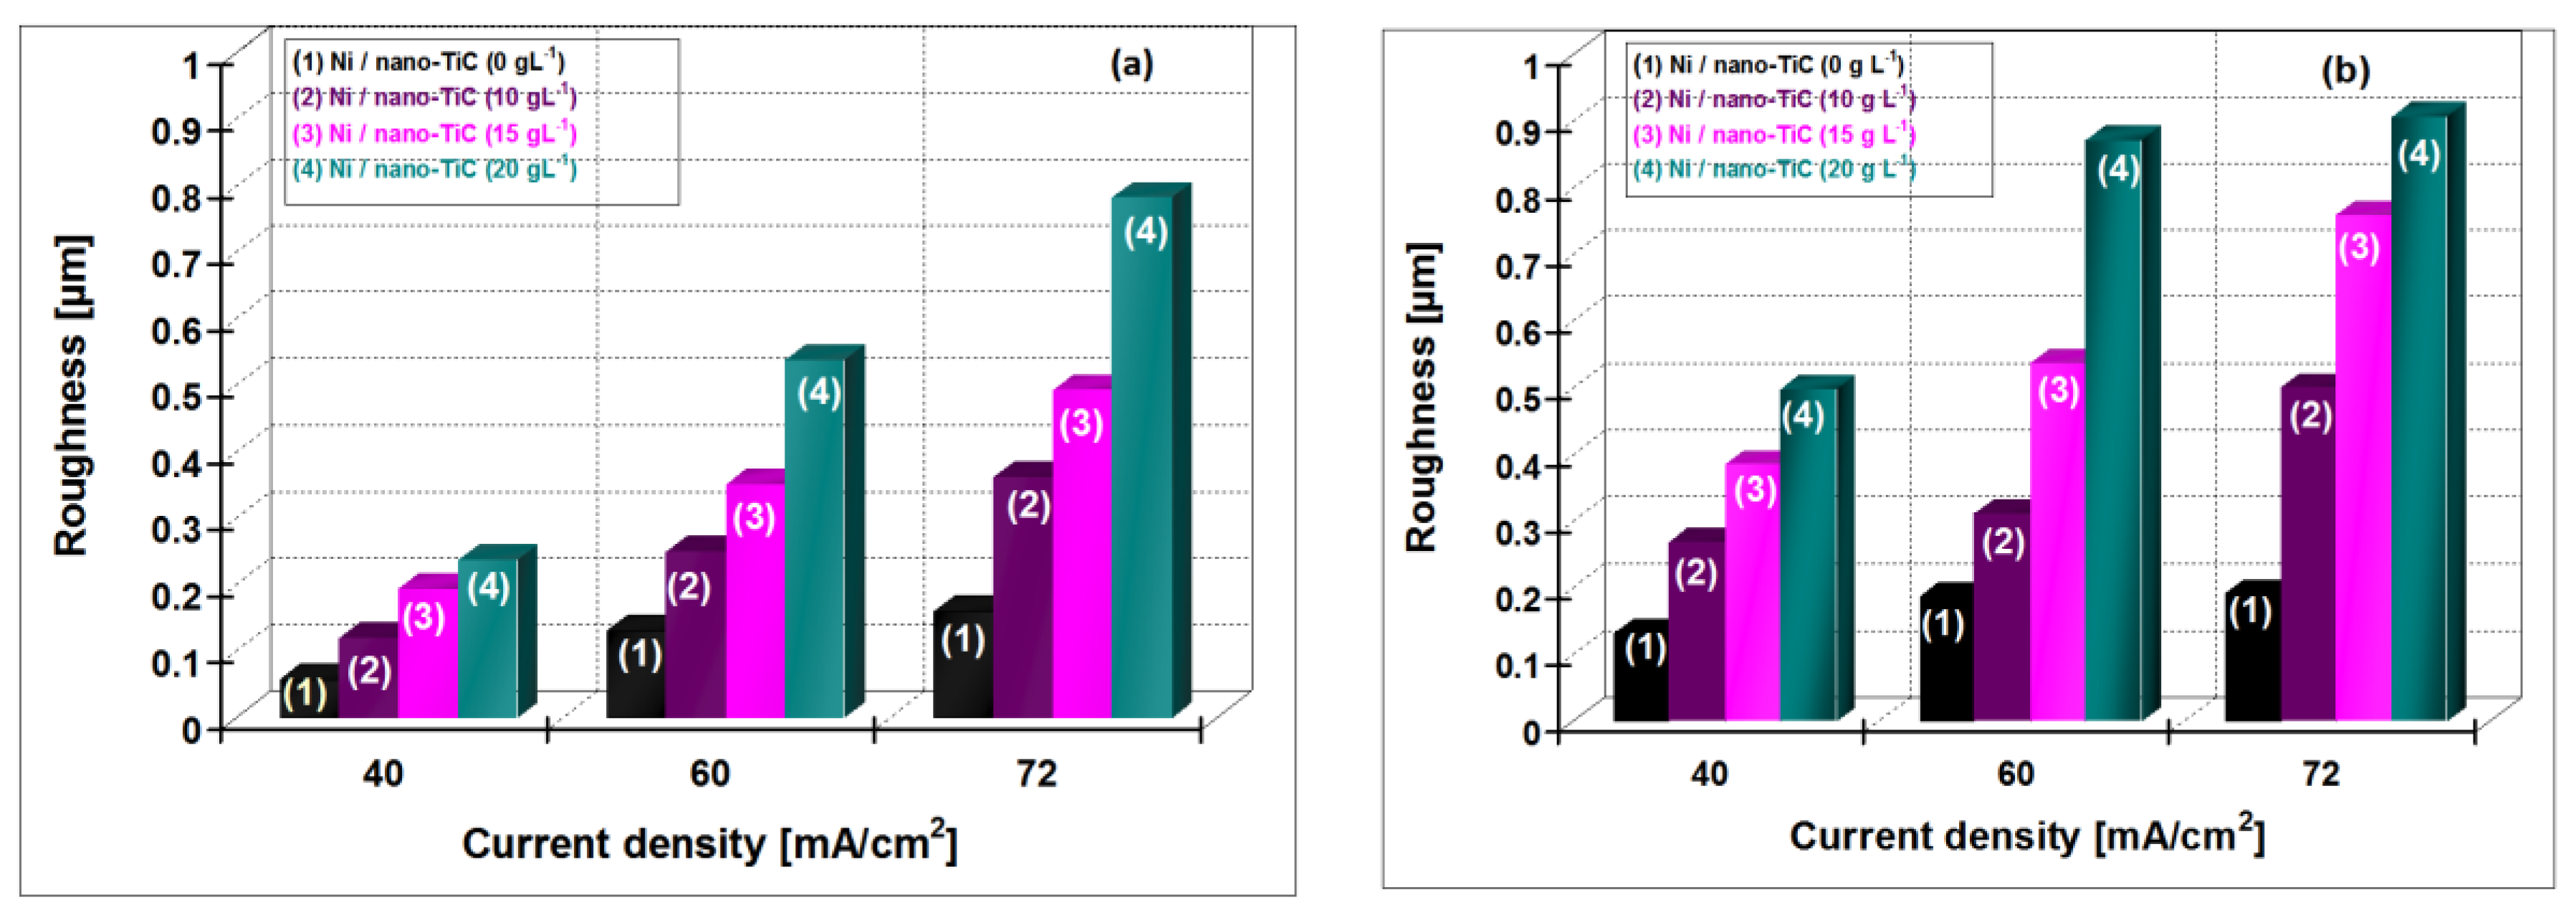
3.6. Roughness of Electrodeposited Surfaces
In
Figure 14, the variation of the roughness for hybrid nanocomposite layers of Ni/nano-TiC (10, 15, 20 g·L
−1) is shown compared with pure Ni layer obtained at current densities of 40 ,60 and 72 mA/cm
2 at the electroplating times of 15 min and 30 min.
An increase of roughness with increasing current density and with the time of electroplating process for all the electroplated layers is observed. It is also evident that the roughnesses of Ni/nano-TiC hybrid nanocomposite layers are larger than pure nickel layers at all current densities applied.
Electrodeposition is considered a useful method to obtain superhydrophobic surfaces with special properies [
19]. Superhydrophobicity of surfaces by electrodeposition could be achieved by: (a) surface roughness alone; (b) surface roughness and surface chemical modification with low surface energy material; and (c) by co-deposition of hydrophobic particles with a metal matrix [
19].
The hybrid Ni/nano-TiC composite layers obtained revealed a higher roughness having included also TiC nanoparticles, which are considered as being hydrophobic; therefore, these layers are promising superhydrophobic surfaces for special application. Natural superhydrophobic surfaces, such as the lotus leaf or the legs of the water strider, have hierarchical nanoscale and microscale roughness [
19]. The similarity with natural superhydrophobic surfaces is connected with roughness of the surface.
3.7. Nanoidentation of Surface Layers
The values of the nanoidentation results (indentation hardness (H), Vickers nanohardness (Hv), Elastic modulus (E) and H/E ratio) for the Ni/nano-TiC functional nanocomposite and the pure Ni coatings obtained under the same experimental conditions are indicated in
Table 3 as a statistical average of three indentations.
Table 3 shows that the higher nanohardness values have been obtained for hybrid nanocomposite layers of Ni/nano-TiC (10 g·L
−1), compared with that of the pure Ni layers. The higher hardness of Ni/nano-TiC composite coating in comparison with pure Ni layer can be accounted by the incorporation of hard TiC nanoparticles and in the Ni matrix, which limits the growth of the Ni grains. These results are in accordance with the observation on XRD analysis.
The hardness of Ni/nano-TiC hybrid composite layers obtained by electrodeposition is noticeably higher than those of pure nickel layers. This could be explained by the fact that TiC nanoparticles generate new locations of nucleation on the surface, resulting in grain refinement. Thus, the grain boundaries expand and hinder the motion of dislocations; as a result, hardness increases. This demonstrates once again that the Ni/nano-TiC hybrid nanocomposite layers have a higher hardness and could be more resistant to wear than the pure Ni layers.


