Article

Experimental and Statistical Evaluation of the Size Effect on the Bending Strength of Dimension Lumber of Northeast China Larch

1
Research Institute of Wood Industry, Chinese Academy of Forestry, Beijing 100091, China
2
International Center for Bamboo and Rattan, Beijing 100102, China
*
Author to whom correspondence should be addressed.
Materials 2016, 9(2), 89; https://doi.org/10.3390/ma9020089
Submission received: 8 December 2015 / Revised: 13 January 2016 / Accepted: 20 January 2016 / Published: 30 January 2016
(This article belongs to the Special Issue Bio- and Natural-Fiber Composites)

Abstract

:
This study investigated the size effect on the bending strength (modulus of rupture—MOR) of dimension lumber of Northeast China larch (Larix gmelinii); providing a basis for the further application in light wood frame construction. Experimental and statistical evaluations were conducted on the bending strength. A total of 2409 full-size dimension lumber samples were tested by static bending tests; which included three different sizes: 2 × 3; 2 × 4; and 2 × 6. Results indicate that the size has a significant effect on the MOR. Both the chi-square (χ2) and Kolmogorov-Smirnov (K-S) test results show that the lognormal distribution generally fits to the MOR better than to the normal distribution. Additionally; the effects of partial safety factor (γR) and live-to-dead load ratio (ρ) were studied by reliability analysis. Reliability analysis results indicate that the reliability index increases nonlinearly with the decrease of γR and the rise of ρ. Finally; the design value of bending strength and its adjusting factor of size effect of 2 × 3; 2 × 4; and 2 × 6 larch dimension lumber were obtained according to the Chinese National Standards’ requirements of the reliability index.

1. Introduction

Chinese larch (Larix gmelinii), an abundant wood resource, comprises 55% of the wooded areas and 75% of forest stocks in China’s frigid temperate zone, and can be used quite extensively to fabricate dimension lumber, glued lumber, and wood-based composites due to its favorable mechanical properties [1]. Due to the general lack of research regarding product fabrication processes and technologies, however, dimension lumber products manufactured from China’s own tree species remain limited.
The mechanical performance of dimension lumber is generally determined by one of two common methods: full-size testing, or small clear wood specimen testing. Considering the acute necessity of accurate test results and the structural safety requirements in practice, the full-size test method substituting the small clear wood specimens test method, has been adopted widely in most developed countries, such as the United States, Canada, and Japan [2,3]. However, the design value of structural wooden materials, fabricated from China’s native tree species, is still determined by the traditional small clear wood specimens test method.
Thus in an effort to ensure the safe use of dimension lumber and to promote the development of light wood frame construction, the mechanical performance of dimension lumber using China’s own Larch forestry resources was studied by the full-size test method during the 11th Five-Year Plan of China. The Chinese government and a handful of research institutions also began promoting the use of larch in light wood frame construction around this time. Several works [4,5,6,7] have shown that mechanical strength is reduced with the increase of the size and the decrease of strength grade. In addition, the effects of various testing methods on the mechanical properties of dimension lumber have been investigated [8] as well as the relationships between the visual defects, such as knots, slope of grain, checks, and splits, and the mechanical strength of larch dimension lumber [9,10,11]. Research has shown that analysis via the lognormal distribution can provide a good fit for strength properties [12]. Based on reliability analysis, the design value of the compression strength parallel to grain and of the bending strength for larch 2 × 4 lumber has been effectively determined [13,14]. Both the design value and its adjusting factor, as far as mechanical performance, are crucial considerations for the application of wood material in building construction; unfortunately, these have yet to be fully realized for China’s lumber resources. To this effect, it remains necessary to determine the adjusting factor of the mechanical properties and the related design value based on full-size test results.
Therefore, the objective of this study was to investigate the size effects on the bending strength (MOR) of dimension lumber of Northeast China larch (Larix gmelinii), providing a basis for its further application in light wood frame construction. An extensive experimental study was conducted. Besides, the statistical analyses of MOR were also performed.

2. Materials and Methods

2.1. Materials

Larch (Larix gmelinii) was collected from the Cuigang and Pangu forest farms of Heilongjiang Province, China. The diameter range of logs was 160–340 mm, and the average tree age was 35 years. The material was cut into 2 × 3, 2 × 4, and 2 × 6 dimension lumber samples. As specified in the Chinese National Standard [15], any single digit of lumber size, measured in millimeters (mm), was rounded to zero or five; unlike other countries’ standards, then, the actual size of the 2 × 3, 2 × 4, and 2 × 6 lumber specimens were 40 × 65, 40 × 90, and 40 × 140 mm, respectively. The length of each specimen was 4000 mm. The strength grade of dimension lumber is determined by its visual defects, such as knots, slope of grain, checks, splits and so on, according to the NLGA standard [16]. Besides, grades SS, No. 1, No. 2, and No. 3 in the NLGA standard, which are referred to in this paper, can be equated to grades Ic, IIc, IIIc, and IVc, respectively, in the Chinese National Code [15].
The number of specimens, the mean value, and coefficient of variation (COV) of density for each size of dimension lumber are shown in Table 1. Due to lack of a sufficient number of specimens to obtain accurate results, grades No. 1 and No. 3 of 2 × 6 lumber were not analyzed in this paper. According to ASTM D245 [17], an assumed minimum grade quality index (GQI) of each test sample was determined by the above visual defects.
Before bending testing, all specimens were conditioned at 20 °C and 65% relative humidity (RH) in a standard room, to arrive at the equilibrium moisture content (EMC). The measured average moisture content was 11.3% with a standard deviation of 1.11% [18].

2.2. Static Testing Method

According to ASTM D4761 [19], the third-point edgewise bending tests were carried out on an MTS universal testing machine. Specimens were loaded at a rate of 5 mm/min, which continued until failure. The span to depth ratio was 18 to 1. The MOR of each specimen was calculated as follows:
MOR = a F max / 2 W
where a is the distance between a loading position and the nearest support (mm), Fmax is the maximum load (N), and W is the section modulus (mm3).
The MOR of each specimen, adjusted to 15% MC (MOR15) in accordance with ASTM D1990 [20], can be represented as follows:
MOR 15 = { MOR MOR + ( M 1 15 ) × ( MOR 16.66 ) / ( 40 M 1 ) MOR 16.66 MPa MOR > 16.66 MPa
where M1 is the moisture content of the specimen (%).
Table 1. Number of specimens and density of each dimension lumber size. COV: Coefficient of variation
DimensionGradeNumber of SpecimensDensity
Mean (kg/m3)COV (%)
2 × 3SS20964910.48
No. 110963210.55
No. 225563511.29
No. 328164711.30
2 × 4SS42964610.69
No. 120163210.60
No. 228563910.66
No. 316564811.29
2 × 6SS2536118.58
No. 1286119.89
No. 213463160.86
No. 36065311.11

2.3. Statistical Analysis

2.3.1. One-Way Anova Analysis

The graphical analysis was conducted with Origin 9 software (OriginLab Corporation, Northampton, MA, USA). The differences in bending strength between different sizes were analyzed by one-way analysis of variance (ANOVA); multiple comparisons for different sizes were calculated by the Least Significant Difference (LSD) method using the ANOVA test results using SPSS 19.0 (IBM SPSS Corporation, Chicago, IL, USA). Significance level was set to 0.05.

2.3.2. Distribution Model

Both chi-square (χ2) and Kolmogorov-Smirnov (K-S) tests were used to determine the probability distribution of MOR15.
For the chi-square (χ2) test method, the probability distribution of MOR15 was assumed to be either a normal distribution (N), or a lognormal distribution (L). The cumulative distribution function is defined as follows:
F 0 ( x ) = 1 2 π σ x e ( t μ ) 2 2 σ 2 d t
where x and t are random variables of either MOR15 or logarithmic MOR15 obtained by the static bending test, and μ and σ are unknown parameters determined in the following analysis.
First, the μ and σ parameters were calculated by the maximum likelihood method in which the likelihood function can be expressed:
L ( μ , σ 2 ) = i = 1 n 1 2 π σ e ( x i μ ) 2 2 σ 2 = ( 2 π σ 2 ) n 2 e 1 2 σ 2 i = 1 n ( x i μ ) 2
where xi is the random variable of the ith sample and n is the total number of samples.
After a logarithmic transformation, the likelihood function can be rewritten as follows:
log L ( μ , σ 2 ) = n 2 log ( 2 π ) n 2 log ( σ 2 ) 1 2 σ 2 i = 1 n ( x i μ ) 2
By calculating the partial derivatives of Equation (5), the likelihood equations can be obtained, which are defined as:
{ log L ( μ , σ 2 ) μ = 1 σ 2 i = 1 n ( x i μ ) = 0 log L ( μ , σ 2 ) σ 2 = n 2 σ 2 + 1 2 σ 4 i = 1 n ( x i μ ) 2 = 0
The maximum likelihood estimation of the μ and σ parameters is as follows:
{ μ ^ = x ¯ = 1 n i = 1 n x i 1 N j = 1 k n i x i ¯ σ ^ = 1 n i = 1 n ( x i x ¯ ) 2 1 N j = 1 k n i ( x i ¯ x ¯ ) 2
where k is the sum of interval numbers of observed MOR15, N is the total number of specimens equal to the sum of ni, ni is the observed number of specimens located in the ith interval, and x i ¯ is the value of the interval center.
By substituting Equation (7) into Equation (3), F0(x) can be rewritten as:
F 0 ( x ) = 1 2 π σ ^ x e ( t μ ^ ) 2 2 σ ^ 2 d t
F(x) is the cumulative distribution function of MOR15 obtained by the static bending test. Whether or not the F(x) is suitable for the assumed F0(x) at the setting level, can be judged by the chi-square (χ2) test [21]. The calculation formula for χ2 is as follows:
χ 2 = i = 1 k ( n i N p ^ i ) 2 N p ^ i
where p ^ i and N p ^ i are the cumulative distribution probability and predicted numbers of random variables on the ith interval, respectively.
The formula for the Kolmogorov-Smirnov (K-S) test method is as follows:
D = | S n ( x ) F 0 ( x ) |
where D is the maximum absolute difference between the empirical distribution function and the theoretical distribution function, and S n ( x ) is the empirical distribution function of x.

2.3.3. Reliability Analysis

As reported in the authors’ previous research [13,14], the characteristic values of MOR15 for larch lumber can be determined by the fifth percentile value of probability distribution. As a lognormal distribution, the characteristic value (fk) and design value (fd) are as follows [22,23]:
f k = e μ f ( 1 1.645 δ f )
f d = f k / γ f = μ k 3 f k / γ R
where μf is the mean value of logarithmic MOR15, and δf is the coefficient of variance (COV) (Table 2). γf is the partial safety factor of material property, µk3 is the mean value of the adjusting factor for the effect of long-term load and is equal to 0.72, and γR is the partial safety factor of bending resistance.
Table 2. Summary of bending strength statistics adjusted to 15% moisture content (MOR15).
GradeSizeMOR15ln(MOR15)
Mean (MPa)SD (MPa)COV (%)Mean (MPa)SD (MPa)COV (%)
SS2 × 372.123.132.14.220.3528.34
2 × 465.120.331.24.130.3307.99
2 × 655.619.535.03.950.3709.36
No. 12 × 356.320.937.13.960.3859.71
2 × 446.916.535.13.790.3569.41
No. 22 × 356.620.235.73.970.3799.54
2 × 451.918.936.43.880.3769.70
2 × 649.920.440.93.830.40910.7
No. 32 × 351.621.441.43.850.43911.4
2 × 449.720.942.13.810.44911.8
In order to determine the design value of the bending strength and its adjusting factor of size effect of larch lumber, first-order second-moment reliability analyses were performed for all data cells and simulation load cases: dead load plus office occupancy load (G + LO), dead load plus residential occupancy load (G + LR), dead load plus wind load (G + LW), and dead load plus snow load (G + LS) [22,24]. A calculation program for reliability index (β) was developed in Matlab 7 software (MathWorks Corporation, Natick, MA, USA).
The performance function can be expressed as follows [25,26,27]:
Z = R ( D + L )
where R, D, and L are random variables representing bending resistance, dead load (G), and live load (LO, LR, LW, or LS), respectively.

3. Results and Discussion

3.1. Results of the Bending Test

Each test sample met grade quality index (GQI) requirements, under which the difference between the observed GQI of the samples and the assumed GQI of the grade must be 5% or less of the total range of possible GQI [20]. An observed GQI for each test sample can be calculated for all specimens that did not fail in clear wood [17,20]. The difference between the observed GQI of the samples and the assumed GQI of the grade was less than 5%. Thus, the observed GQI of test data could be used to represent the grades of the samples.
Table 2 shows the mean value, standard deviation, and coefficient of variation (COV) of the final MOR15 for each size of lumber. Results indicated that the MOR15 is correlated to the size. The MOR15 values showed highly significant (p < 0.05, F-test ANOVA) differences between different sizes of dimension lumber, except pairs 2 × 3 vs. 2 × 4 of grade No. 3, and 2 × 4 vs. 2 × 6 of grade No. 3 (Table 3). For the same grade of lumber, the bigger the size, the smaller the MOR15. For instance, the mean value of MOR15 of grade SS for 2 × 3 was 72.1 MPa, 1.11, 1.30 times that of 2 × 4, and 2 × 6, respectively. Similar results were obtained in previous studies [4,28].
Table 3. One-way analysis of variance (ANOVA) test results of MOR15 for different lumber sizes.
GradeSignificance
2 × 3 vs. 2 × 42 × 3 vs. 2 × 62 × 4 vs. 2 × 6
SS********
No. 1***--
No. 2****0.320
No. 30.300--
The symbols ** and *** represent p-values less than 0.01 and 0.001, respectively.

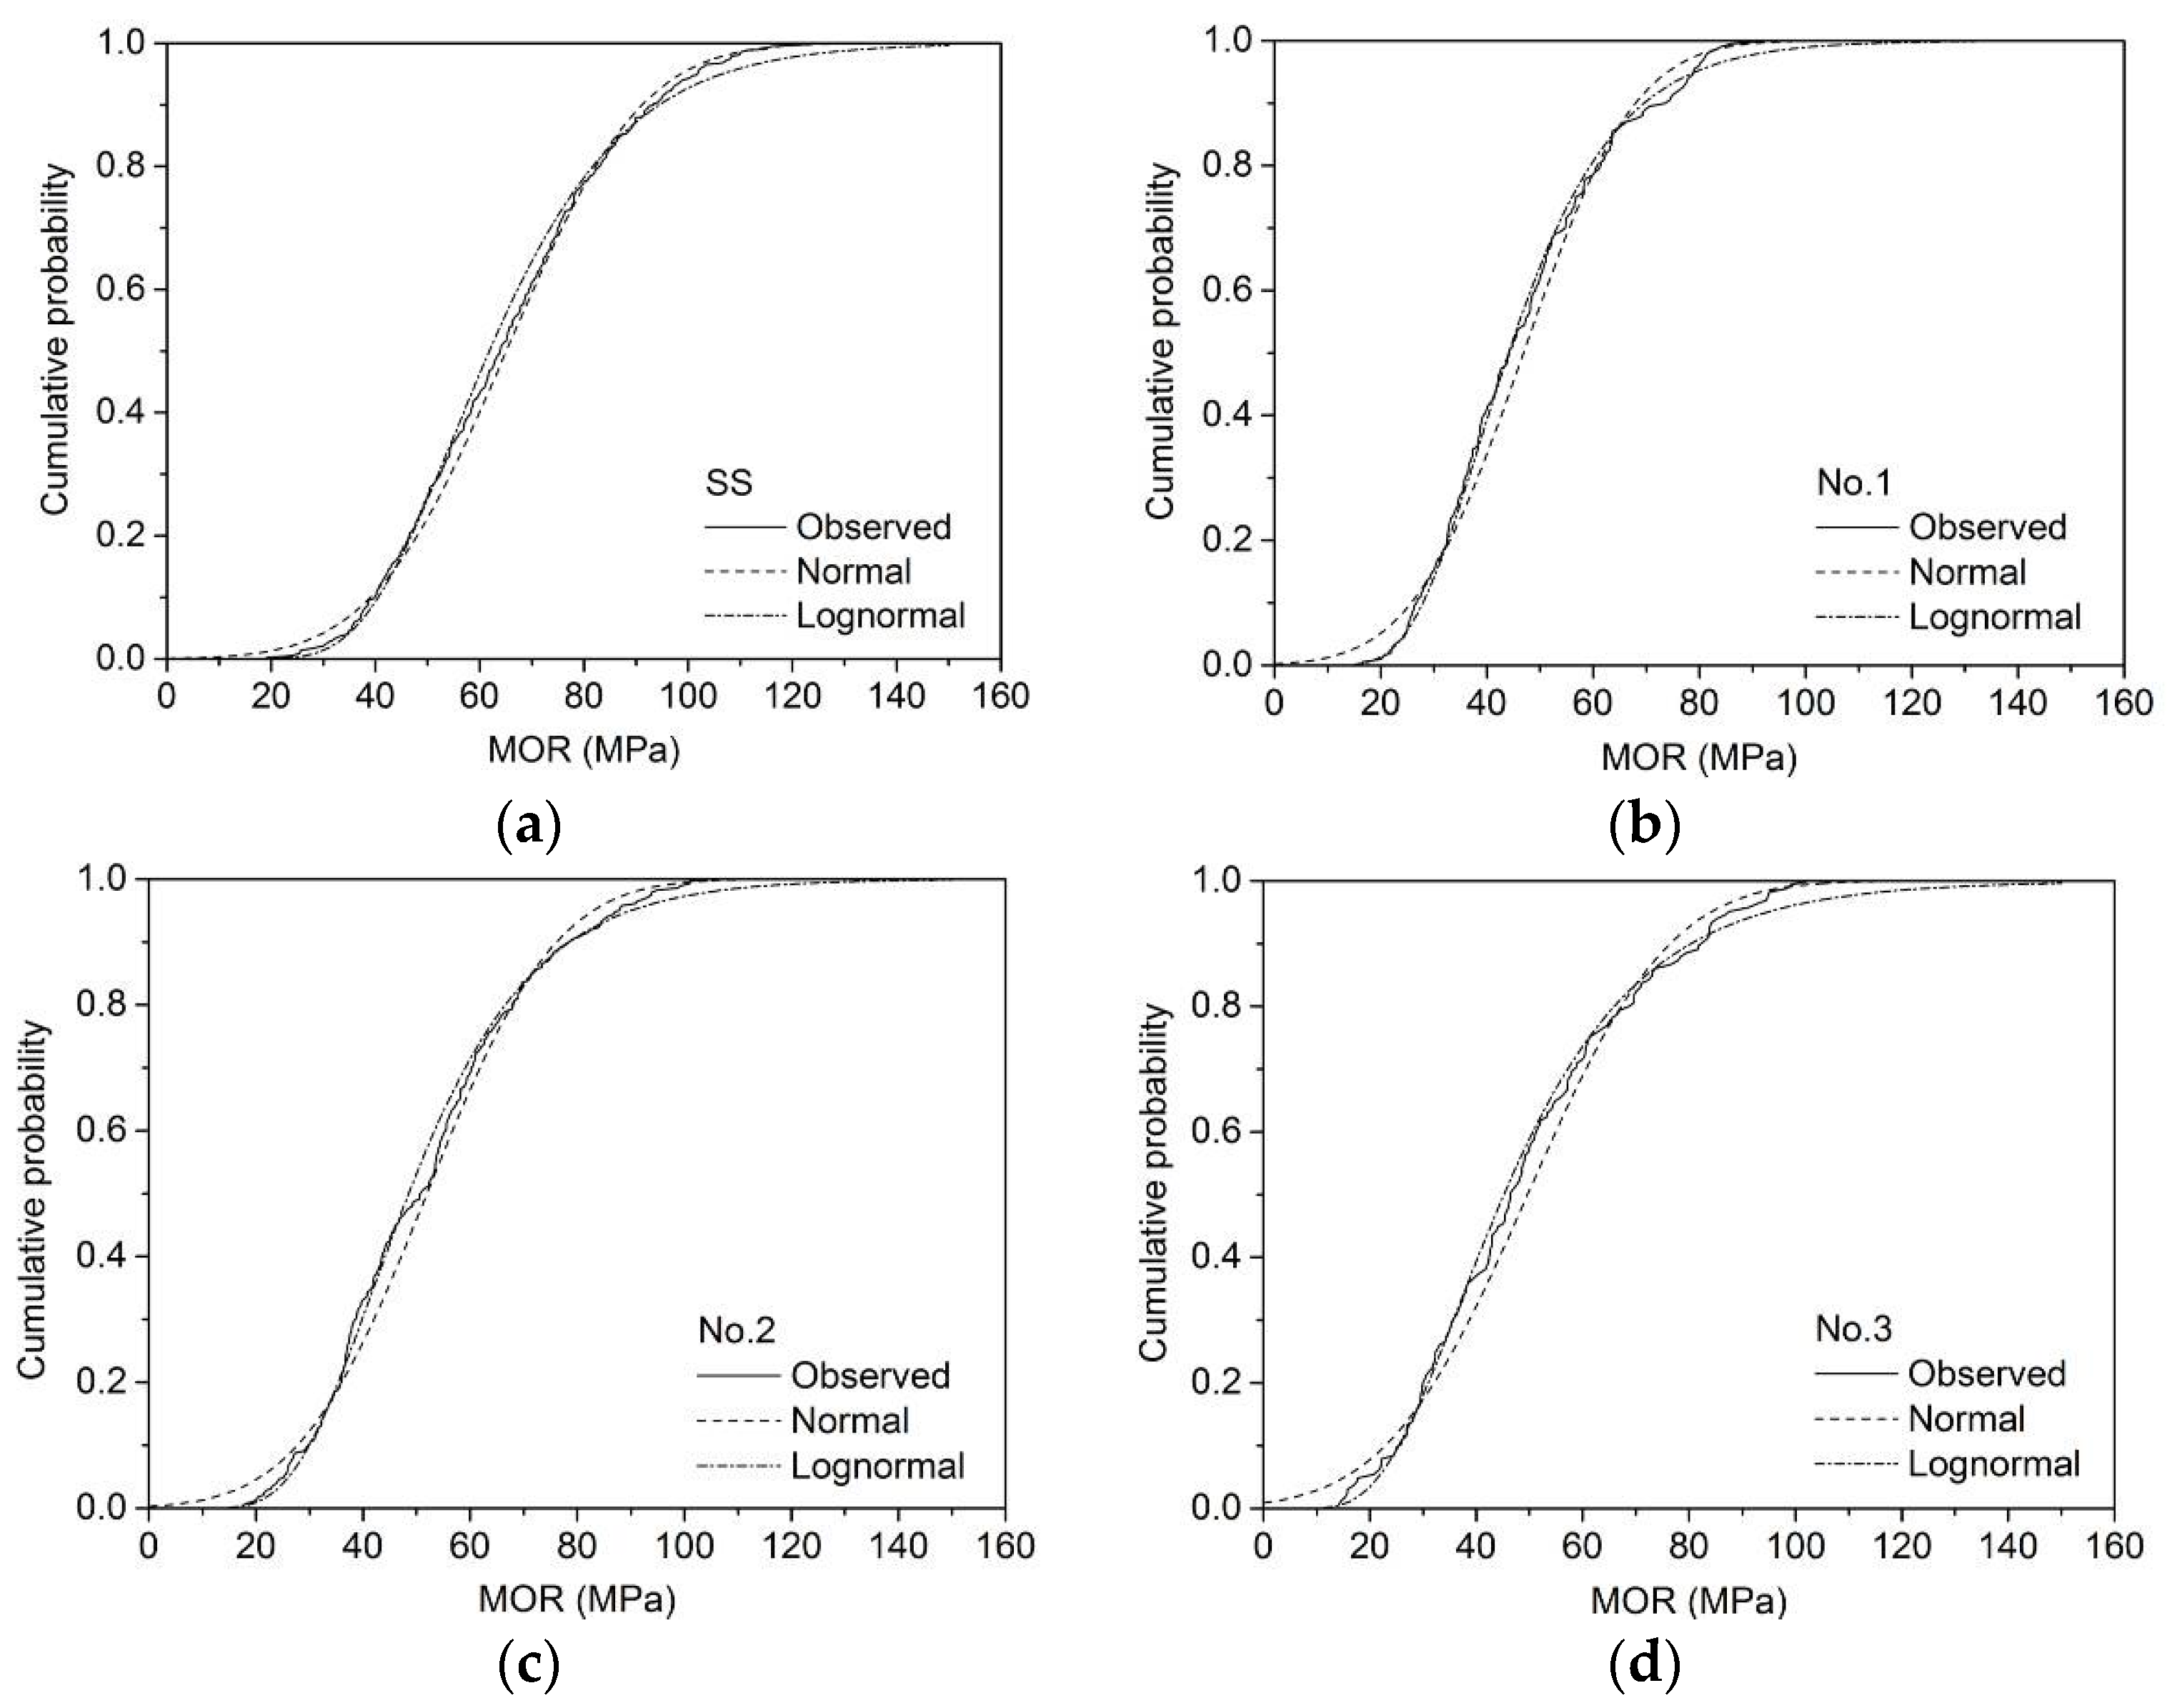
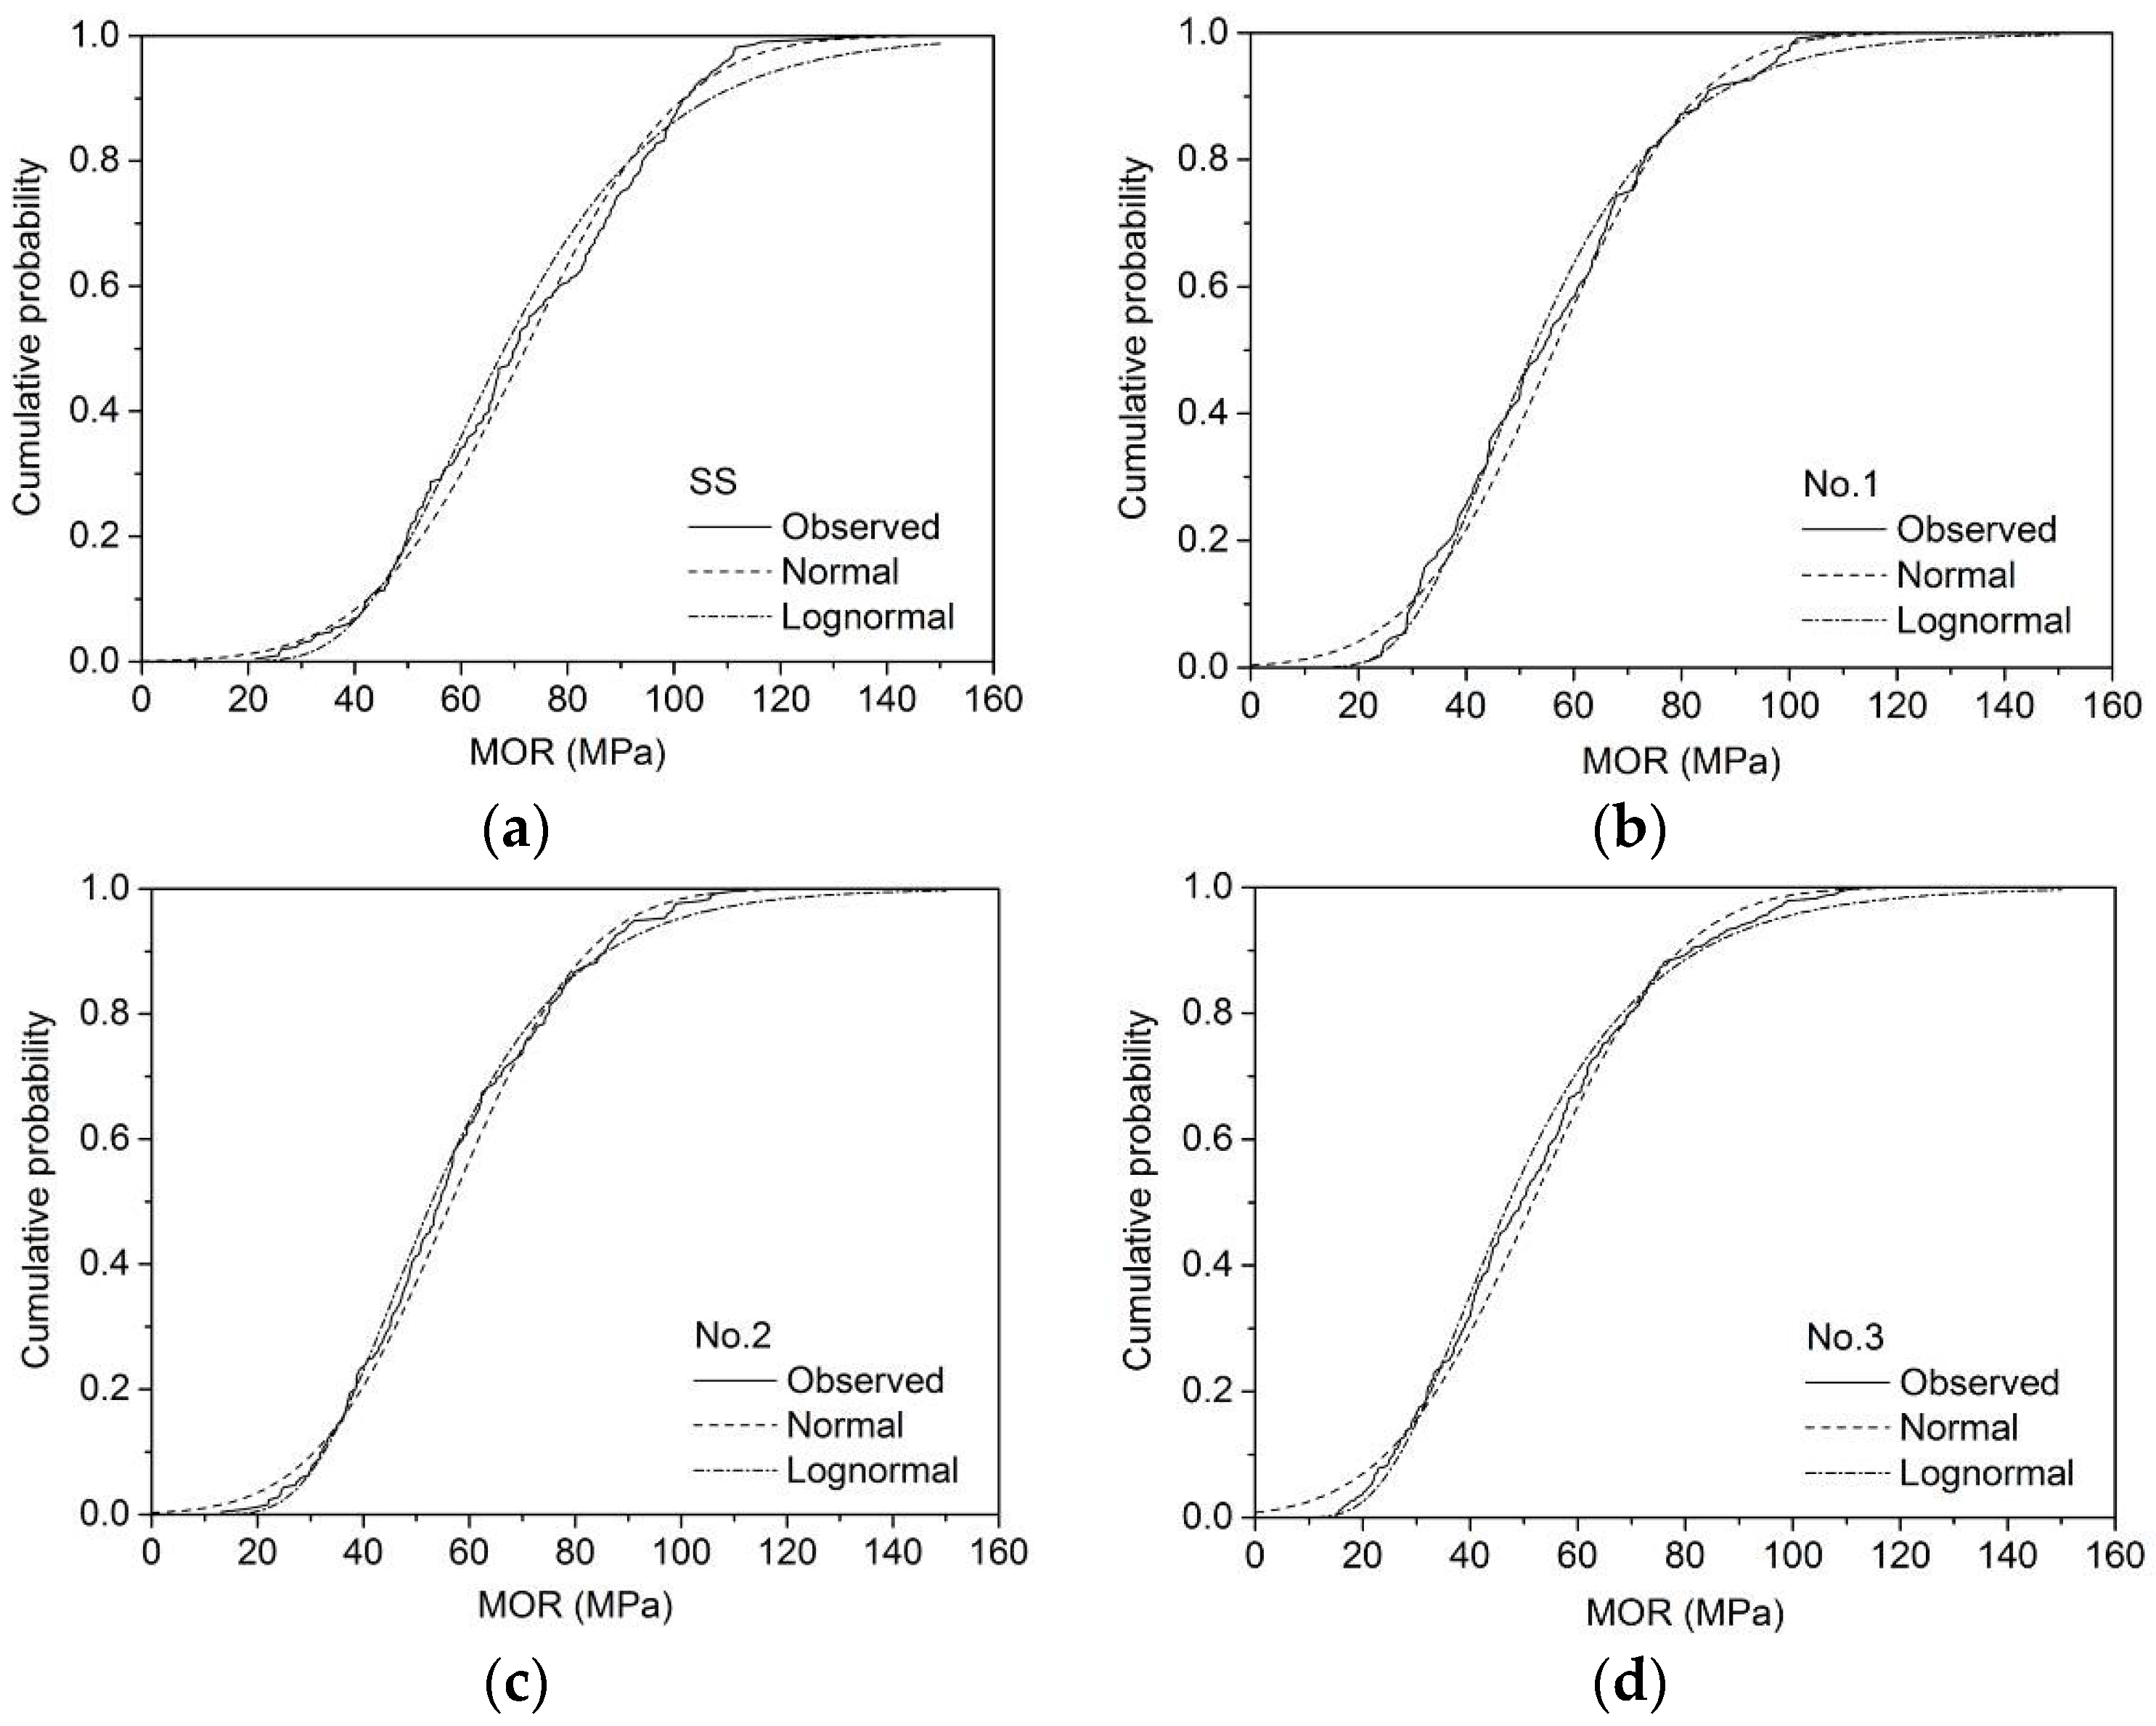
3.2. Probability Distribution

The cumulative probability distributions of MOR15 for different sizes are presented in Figure 1, Figure 2 and Figure 3. The unknown parameters μ and σ were calculated according to Equations (4)–(8). For example, the estimated μ and σ of MOR15 of SS grade for 2 × 4 larch lumber were 65.1 and 20.3 MPa, while logarithmic MOR15 values were 4.12 and 0.328 MPa, respectively (Table 4).
Figure 1. Normal and lognormal fit of MOR15 for 2 × 3 lumber: (a) SS; (b) No. 1; (c) No. 2; (d) No. 3.
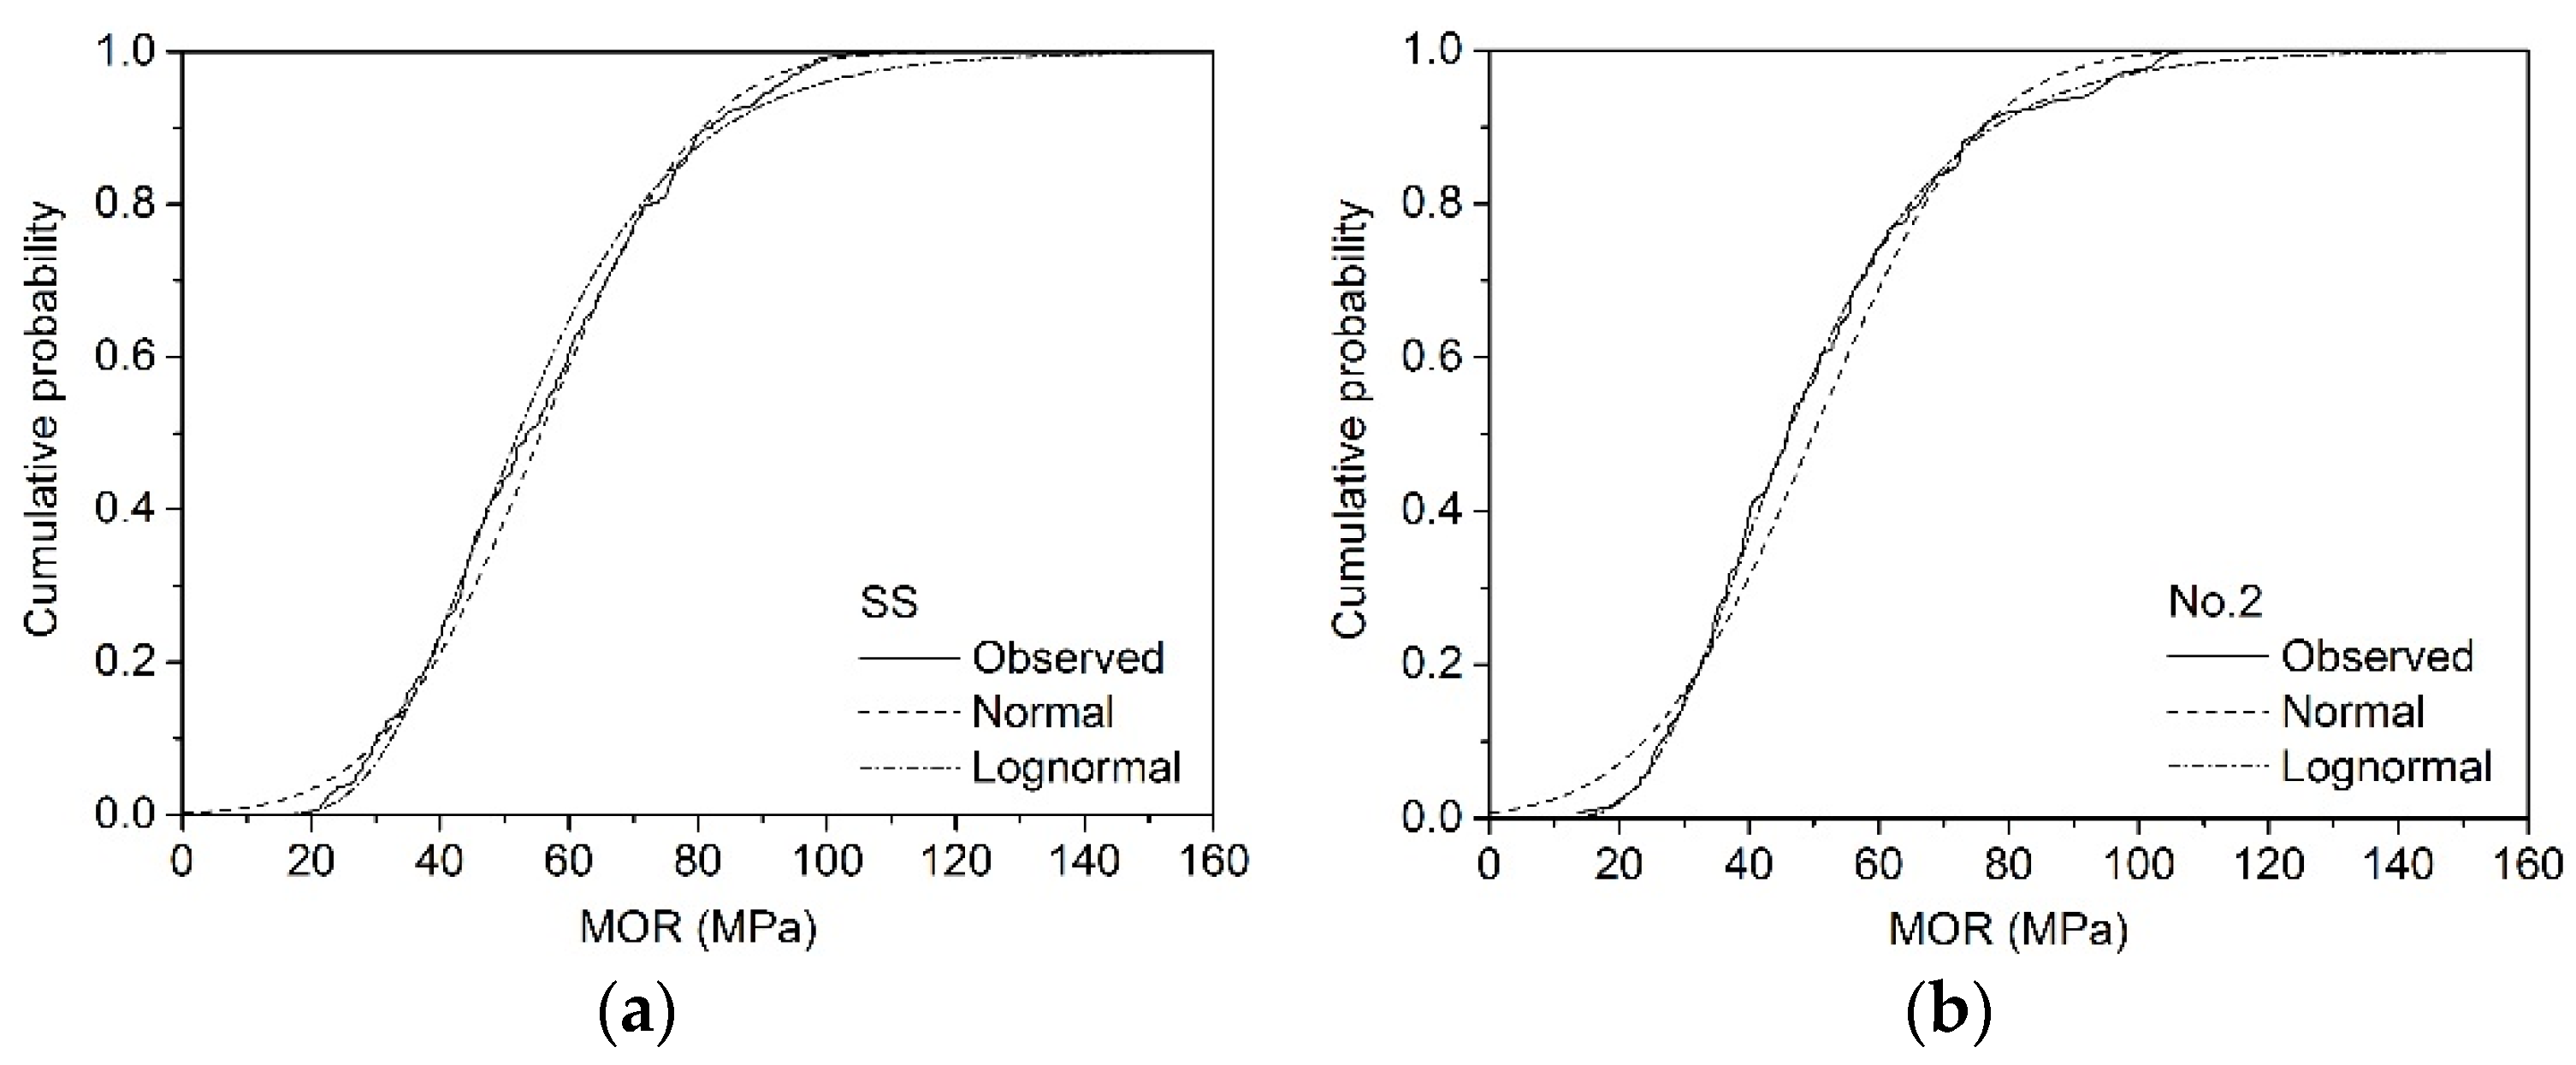
Materials 09 00089 g001
Figure 2. Normal and lognormal fit of MOR15 for 2 × 4 lumber: (a) SS; (b) No. 1; (c) No. 2; (d) No. 3.
Materials 09 00089 g002
Figure 3. Normal and lognormal fit of MOR15 for 2 × 6 lumber: (a) SS; (b) No. 2.
Materials 09 00089 g003
Table 4. Calculation table of μ ^ , σ ^ and chi-square χ2 of MOR15 of SS grade larch 2 × 4 lumber.
IntervalInterval Center x i ¯ Observed Numbers (ni)Probability ( p ^ i )Predicted Numbers ( n p ^ i )
NormalLognormalNormalLognormal
[15, 20]17.510.01800.00037.72150.1228
[20, 25]22.520.02350.002610.07711.1236
[25, 30]27.550.02980.010912.76854.6816
[30, 35]32.5110.03660.027715.708211.9015
[35, 40]37.5250.04370.050818.762421.8053
[40, 45]42.5310.05070.074321.758331.8568
[45, 50]47.5380.05710.092324.498639.5891
[50, 55]52.5370.06240.101826.781543.6884
[55, 60]57.5350.06630.102828.425344.1028
[60, 65]62.5360.06830.097029.292241.5938
[65, 70]67.5410.06830.086729.307337.2154
[70, 75]72.5380.06640.074528.469331.9526
[75, 80]77.5320.06260.061926.850726.5543
[80, 85]82.5220.05730.050124.587321.5030
[85, 90]87.5230.05100.039821.859717.0551
[90, 95]92.5130.04400.031018.869213.3038
[95, 100]97.5140.03690.023915.813910.2396
[100, 105]102.5100.03000.018212.86787.7969
[105, 110]107.580.02370.013710.16595.8860
[110, 115]112.530.01820.01037.79764.4130
[115, 120]117.520.01350.00775.80713.2907
[120, 125]122.520.00980.00574.19882.4434
Sum-N = 429--402.388422.120
Both the χ2 (Equation (9)) and K-S (Equation (10)) test values of different sizes of larch lumber are shown in Table 5. Results indicated that the lognormal distribution fitted the bending test data much better than the normal distribution for all sizes except the SS grade of 2 × 3, SS grade of 2 × 4, and No. 2 grade of 2 × 4. Findings presented by Dahlen et al. [29] similarly showed that the lognormal distribution model provides a better fit for Douglas fir and Southern pine 2 × 4 lumber.
The assumed F0(x) can be considered a good fit for the F(x) obtained by the static bending test when the critical value, which is dependent on probability levels, is greater than the test value [21]. At a probability level of 0.05, the χ2 test results showed that normal distribution fitting did not provide accurate results for most sizes, the exceptions being grade No. 1 of 2 × 3 and No. 3 of 2 × 4 larch lumber. Conversely, lognormal distribution fit the data well for grade SS of 2 × 4 (19.8 < 30.1), No. 1 of 2 × 3 (14.3 < 26.3) and 2 × 4 (17.6 < 22.4), No. 2 of 2 × 6 (11.3 < 27.6), and No. 3 of 2 × 3 (22.1 < 32.7) and 2 × 4 (14.8 < 26.3). When the probability level increased to 0.01, the lognormal distribution provided good fitting results for all sizes apart from SS of 2 × 3 and No. 2 of 2 × 4 (Table 5). The K-S test results showed that both the normal and lognormal distribution can provide a good fit at probability levels of 0.05 and 0.01. In this paper, lognormal distribution was thus selected for the following reliability analysis.
Table 5. χ2-values for bending strength adjusted to 15% moisture content (MOR15) for Chinese larch.
GradeSizeχ2 χ a 2 = 0.05 χ a 2 = 0.01DmaxDa = 0.05Da = 0.01
NormalLognormalNormalLognormal
SS2 × 333.0845.2932.6738.930.0660.0870.0940.113
2 × 457.7719.7930.1436.190.0450.0480.0660.079
2 × 629.6729.1527.5933.410.0680.0570.0860.102
No. 12 × 319.1114.2826.3032.000.0730.0670.1300.156
2 × 433.5117.6222.3627.690.0780.0370.0960.115
No. 22 × 335.5330.5728.8734.810.0740.0640.0850.102
2 × 439.4589.2825.0030.580.0750.0700.0810.097
2 × 634.3211.3027.5933.410.0910.0330.1170.141
No. 32 × 335.4022.0532.6738.930.0660.0540.0810.097
2 × 423.9814.8426.3032.000.0730.0580.1170.141

3.3. Reliability Analysis

Table 6 shows the characteristic values of MOR15 (fk) calculated by Equation (11). The fk value generally decreased alongside the reduction in strength of size. For instance, the fk for grade SS of 2 × 3 was 38.2 MPa, 0.061, 0.345 times higher than those of 2 × 4 and 2 × 6, respectively. The γR values were determined according to the reliability analysis described below.
Table 6. Characteristic values of MOR15.
GradeSSNo. 1No. 2No. 3
Size2 × 32 × 42 × 62 × 32 × 42 × 32 × 42 × 62 × 32 × 4
fk (MPa)38.236.028.427.824.528.426.123.522.921.6
According to the authors’ previous research [13,14], random variables of bending resistance (R) are also distributed lognormally. The calculated mean value and COV of R for larch lumber are shown in Table 7 based on statistical theory.
Table 7. Summary of the resistance stress (R) statistics.
GradeSizeR (MPa)
Mean ValueSDCOV (%)
SS2 × 348.817.335.5
2 × 444.115.334.8
2 × 637.714.438.2
No. 12 × 338.115.340.1
2 × 431.712.238.3
No. 22 × 338.314.938.8
2 × 435.113.939.4
2 × 633.814.743.6
No. 32 × 335.015.444.1
2 × 433.615.044.8
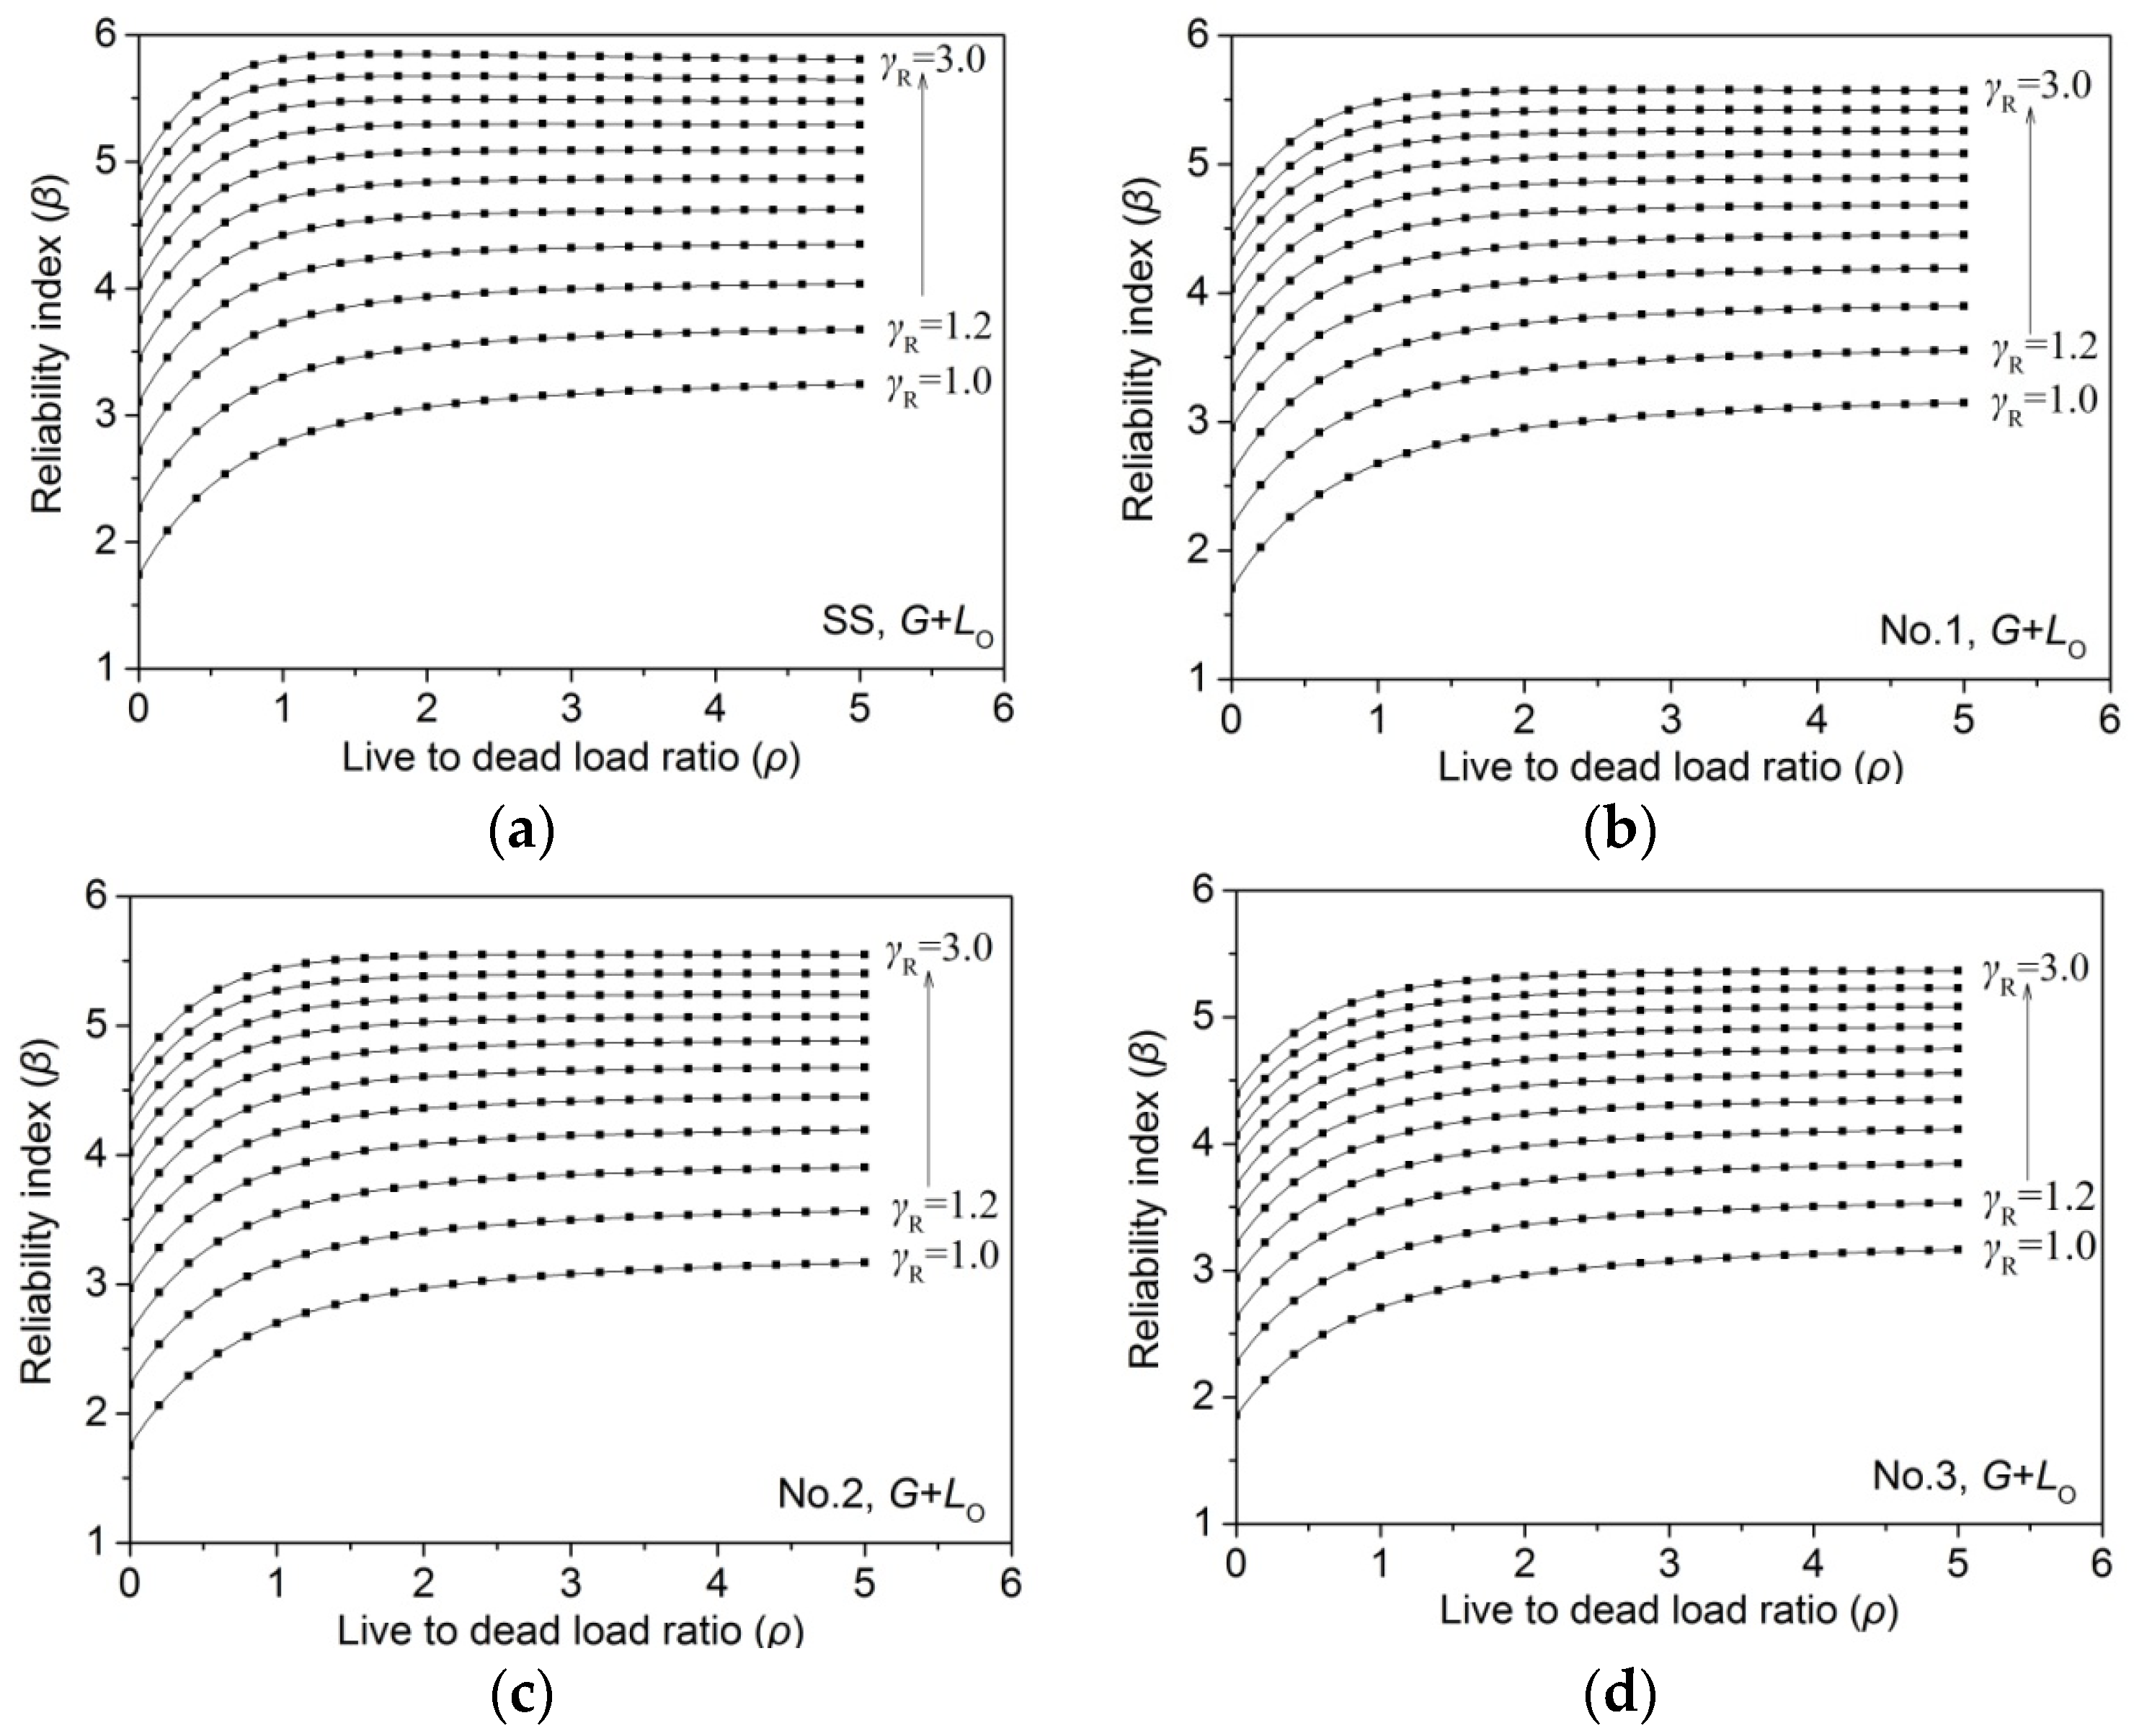
Reliability analysis results indicated that β increased nonlinearly as live-to-dead load ratio (ρ) increased in all the simulation load cases. As an example, the relationship between β and ρ of 2 × 4 larch lumber, under dead load (G) plus live office load (LO), are shown in Figure 4. Several previous studies [13,25,26,27,30] achieved a similar result regarding the relationship between ρ and β.
Figure 4. Relationship between reliability index (β) and live-to-dead load ratio (ρ) for larch 2 × 4 lumber under G + LO: (a) SS; (b) No. 1; (c) No. 2; (d) No. 3.
Materials 09 00089 g004
The reliability level must meet the target level (β0 = 3.2) to effectively determine the MOR15 design value [24]. In order to evaluate the reliability level, the live-to-dead load ratio (ρ) was specified as 0.25, 0.5, 0.75, 1.0, 1.25, 1.5, 1.75, 2.0, 2.25, 2.5, 2.75, and 3.0 for each load combination (G + LO, G + LR, G + LW, and G + LS), respectively, according to the Chinese National Standard [22], then the average of reliability index was calculated under different load ratios. The relationship between the average reliability index and the partial safety factor is shown in
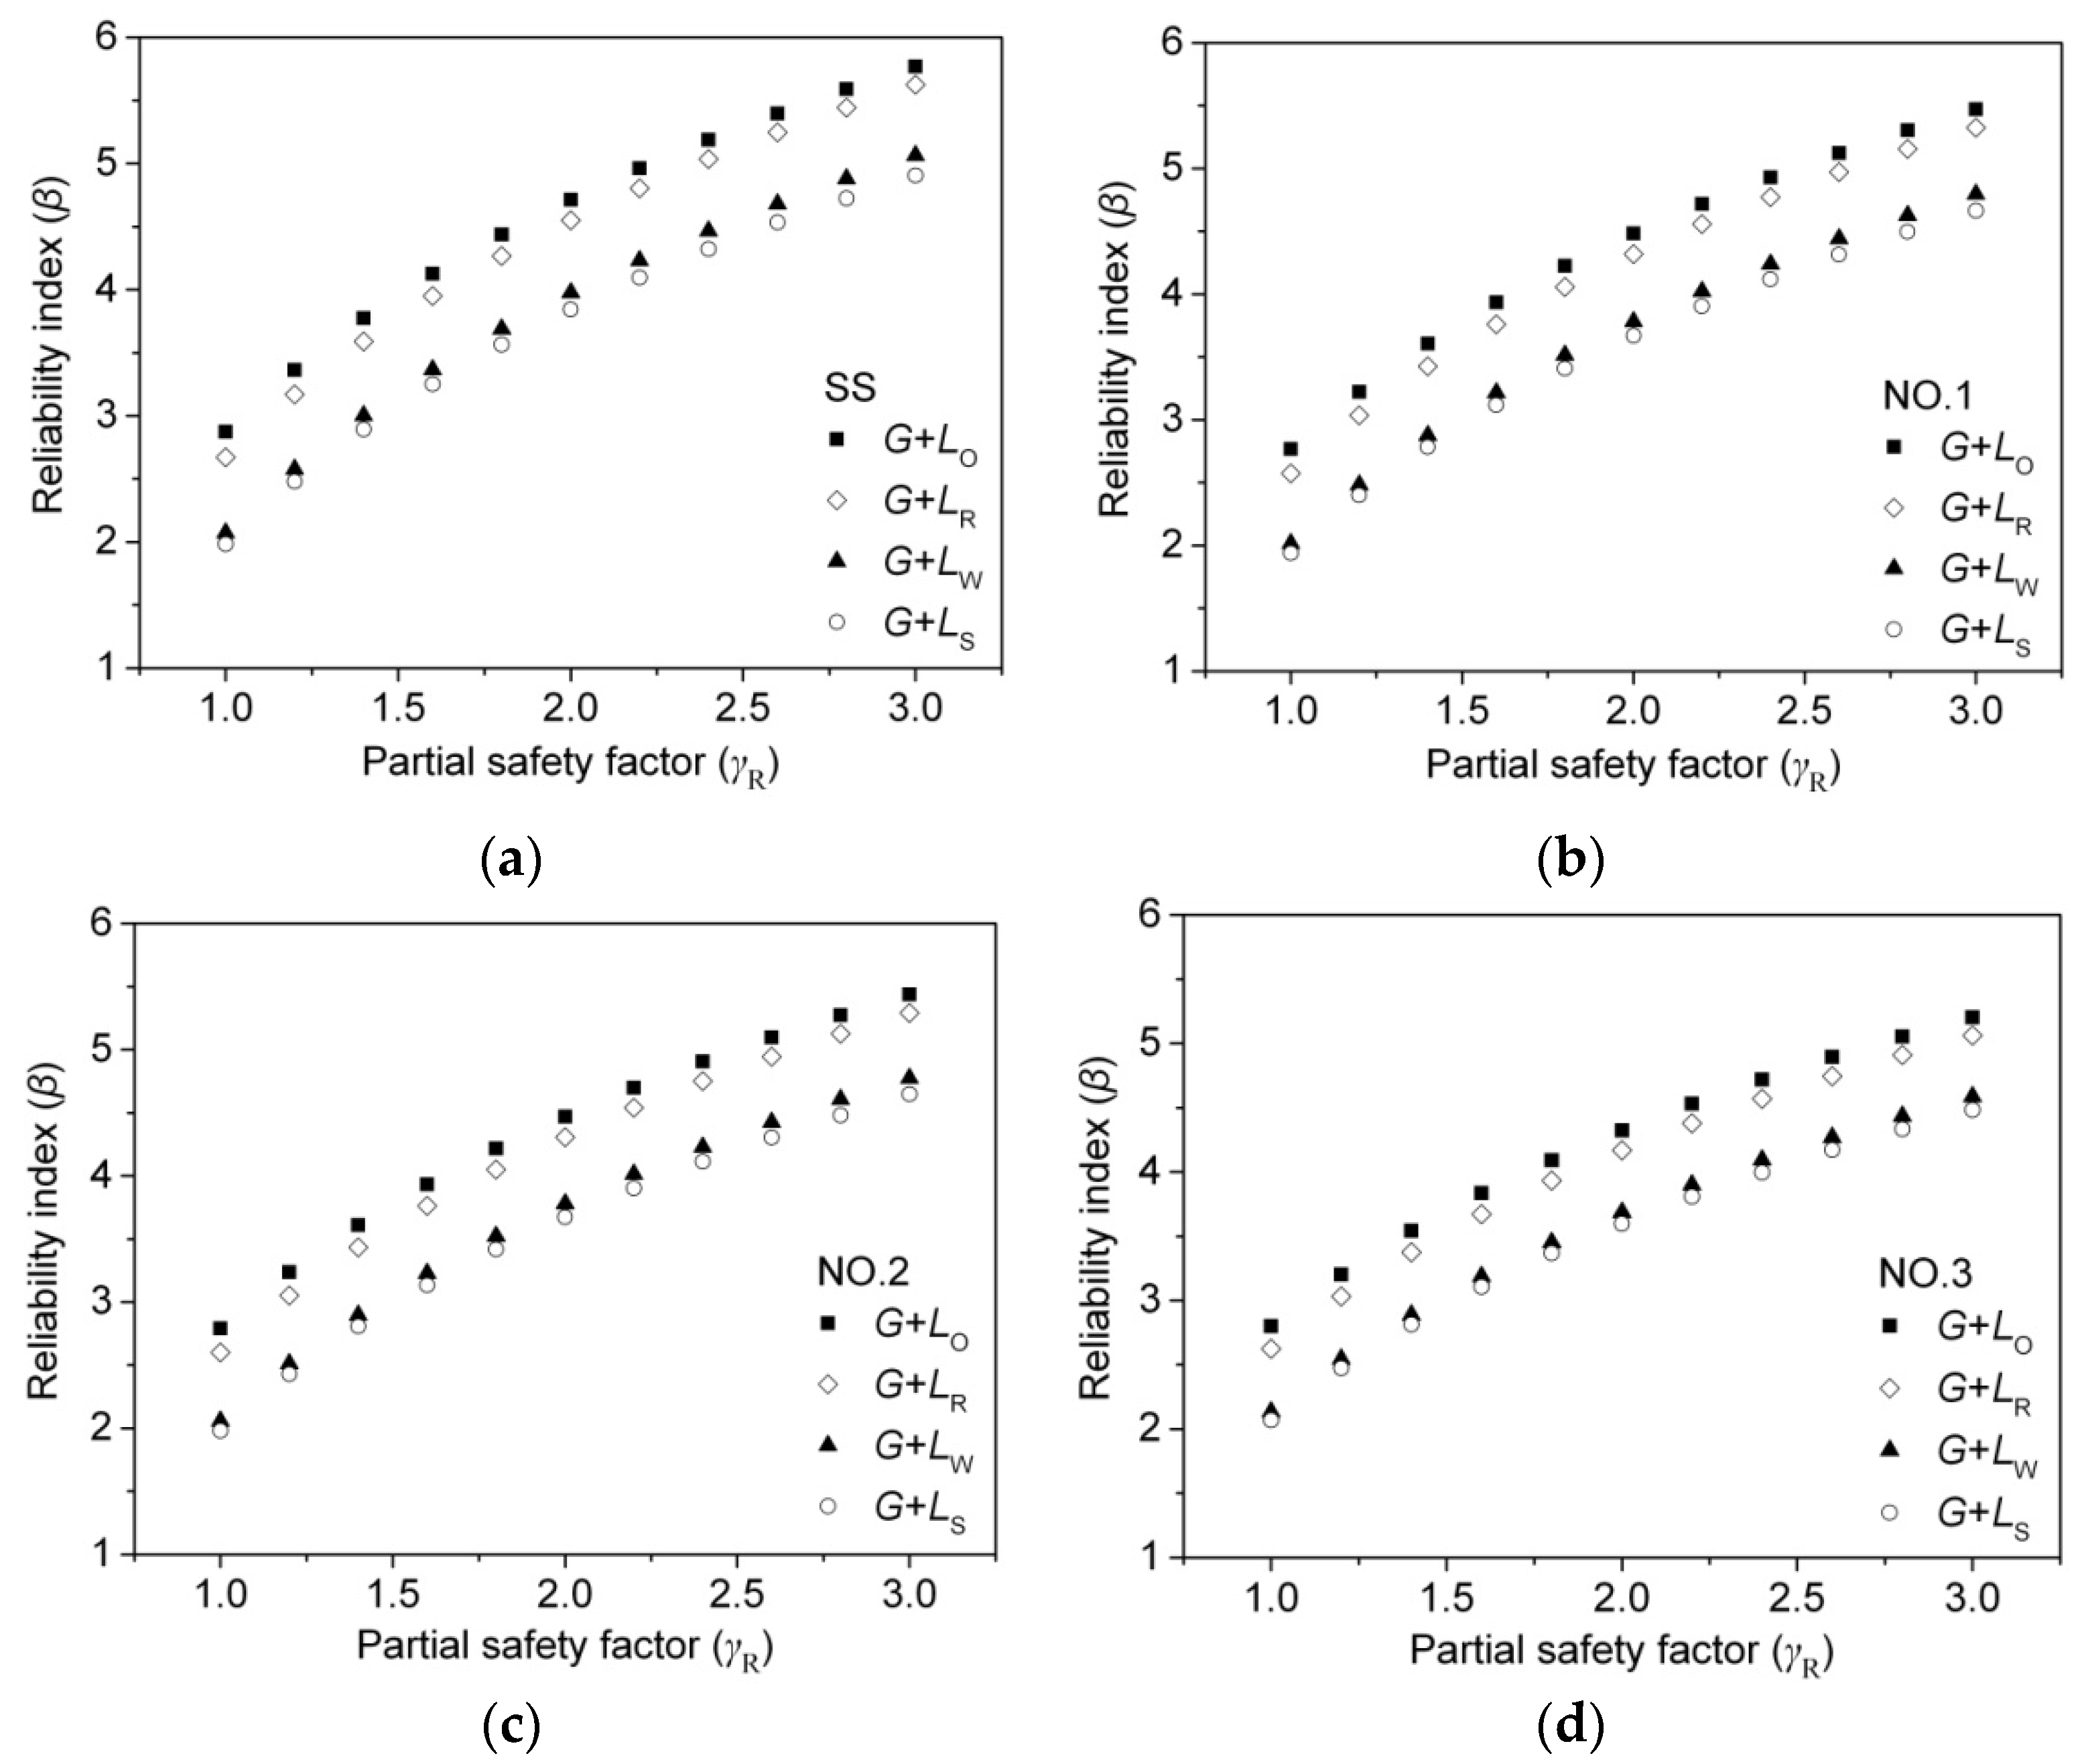
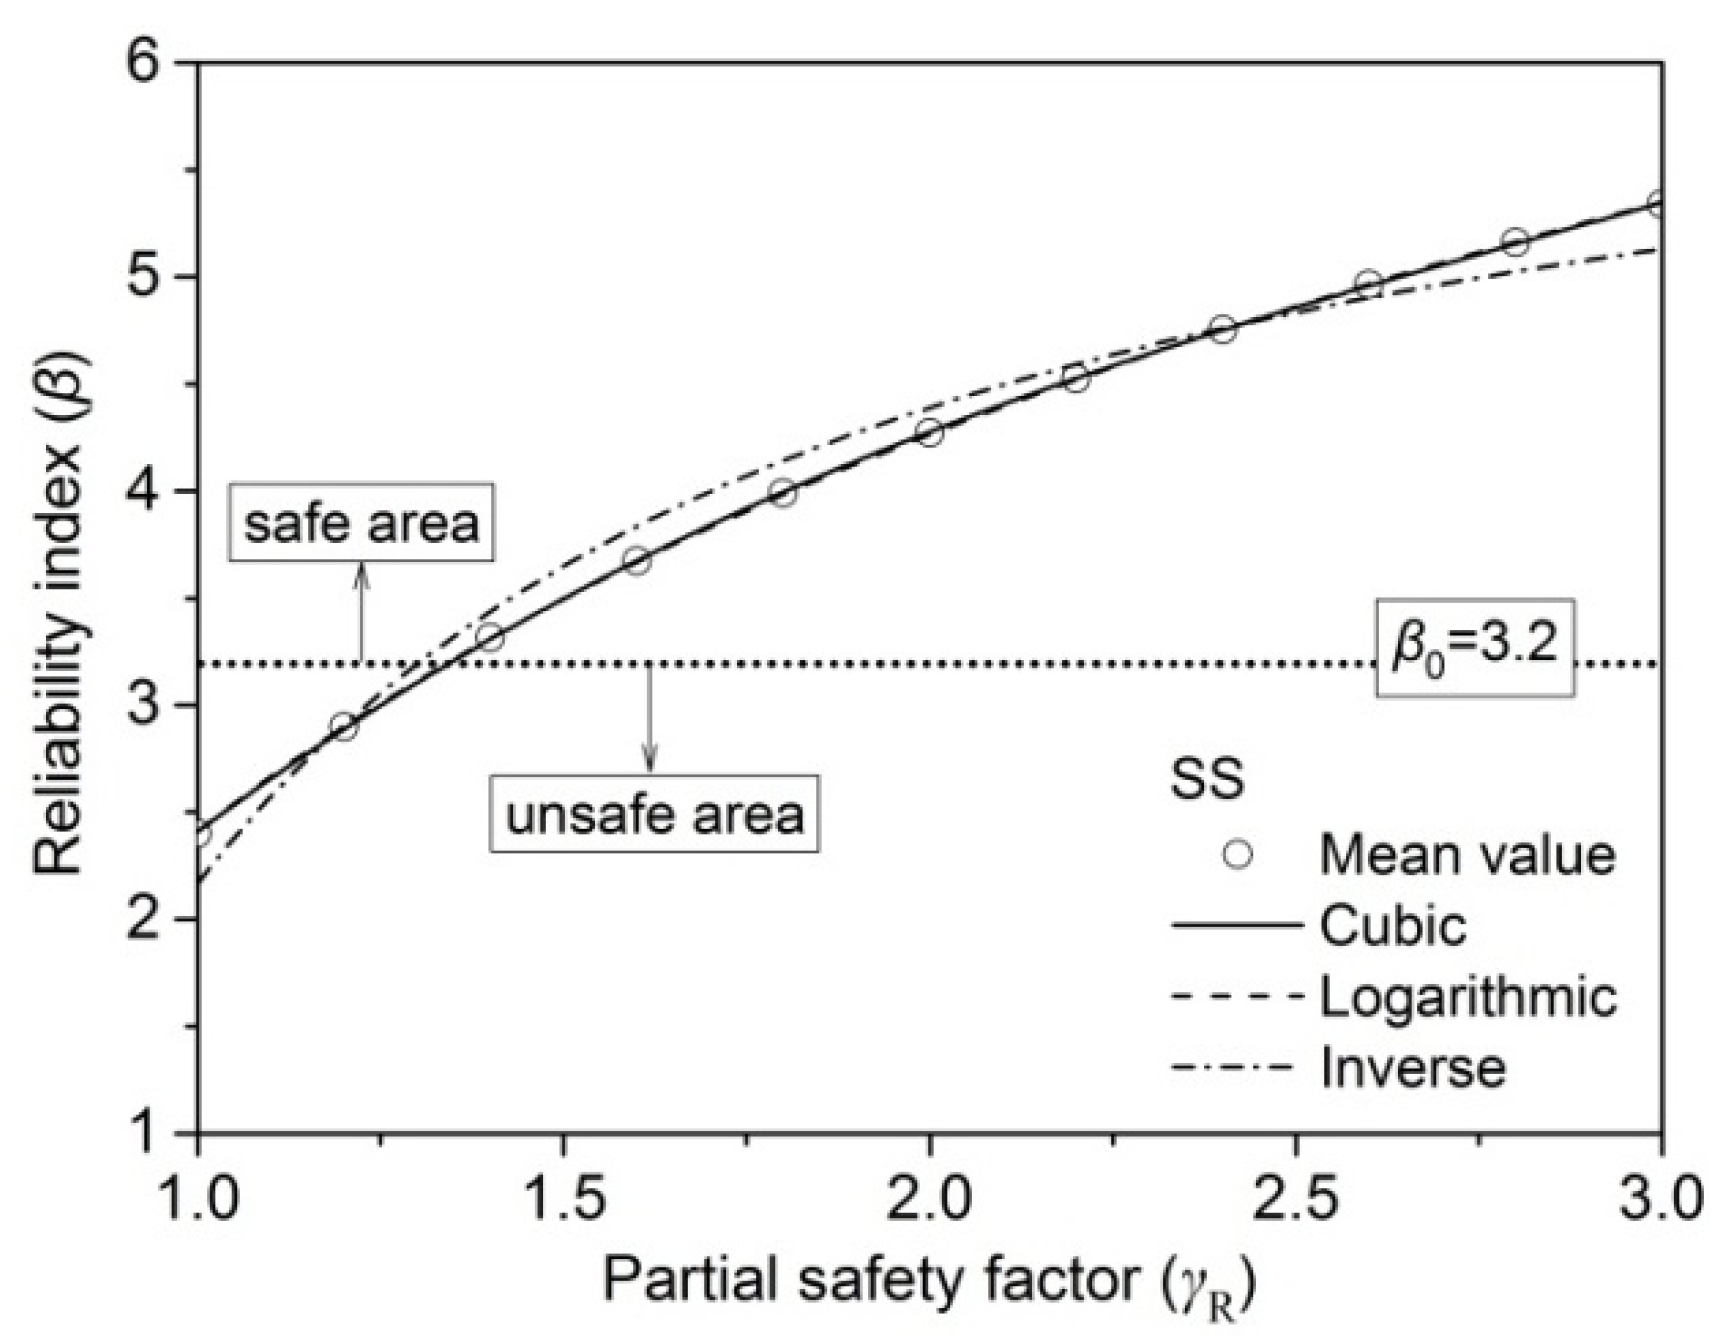
 Figure 5.
As shown in Figure 5, β increased nonlinearly with the increase of the partial safety factor (γR) in all simulation load cases, G + LO, G + LR, G + LW, and G + LS. For the same ratio of live-to-dead load (ρ), the simulated load cases of the maximum and minimum β were G + LO and G + LS, respectively. This is consistent with the findings of previous researchers [13,25,26,27]. The partial safety factor (γR) of all sizes of larch lumber was obtained, as mentioned above, by taking the average of all simulation load cases. In order to obtain β, the linear, cubic, logarithmic, and inverse models were utilized to predict the relationship between β and γR. For example, the predicted result of grade SS of 2 × 4 larch lumber is shown in Figure 6.
Figure 5. Relationship between reliability index (β) and partial safety factor (γR) for larch 2 × 4 lumber under G + LO: (a) SS; (b) No. 1; (c) No. 2; (d) No. 3.
Materials 09 00089 g005
Figure 6. Prediction of reliability index (β) by partial safety factor (γR) of grade SS for 2 × 4 lumber.
Materials 09 00089 g006
Fitting results indicated that the linear, cubic, logarithmic, and inverse models precisely predicted β as a function of γR for all sizes of larch lumber, though the logarithmic model (which was thus used for the reliability index calculation) fitted the data slightly better than other models. Table 8 shows all the fitting results for 2 × 4 larch lumber as an example, with standard errors of 0.006, 0.004, 0.004, and 0.002 for grades SS, No. 1, No. 2, and No. 3, respectively.
Table 8. Fitting results by various models for larch 2 × 4 lumber.
GradeModelCalculation Formular2Std. ErrorγR (β = β0 = 3.2)fd (MPa)
SSLineary = 1.263 + 1.427x 0.9750.1591.35719.1
Logarithmicy = 2.411 + 2.674lnx1.0000.0061.34219.3
Inversey = 6.612 − (4.444/x)0.9780.1501.30319.9
Cubicy = −1.138 + 4.678x − 1.278x2 + 0.146x31.0000.0071.34519.2
No. 1Lineary = 1.261 + 1.330x 0.9760.1471.45812.1
Logarithmicy = 2.332 + 2.492lnx1.0000.0041.41712.5
Inversey = 6.247 − (4.141/x)0.9770.1421.36013.0
Cubicy = −0.949 + 4.321x − 1.174x2 + 0.134x31.0000.0071.41712.5
No. 2Lineary = 1.317 + 1.301x 0.9760.1431.44713.0
Logarithmicy = 2.365 + 2.438lnx1.0000.0041.40813.4
Inversey = 6.193 − (4.050/x)0.9770.1391.35413.9
Cubicy = −0.838 + 4.216x − 1.144x2 + 0.131x31.0000.0071.41113.3
No. 3Lineary = 1.461 + 1.179x 0.9760.1291.47510.5
Logarithmicy = 2.410 + 2.209lnx1.0000.0021.42910.9
Inversey = 5.879 − (3.669/x)0.9770.1271.36911.4
Cubicy = −0.470 + 3.790x − 1.023x2 + 0.117x31.0000.0061.43210.9
According to the above reliability analysis, plus the requirements for the minimum reliability index (β > β0 = 3.2) [22], the suggested design values of MOR15 and partial safety factors are shown in Table 9. For instance, the partial safety factors which satisfied the conditions γR ≥ 1.34, 1.42, 1.41, and 1.43 for grades SS, No. 1, No. 2, and No. 3 of 2 × 4 larch lumber, respectively, can be considered safe for engineering design; the design values should be set to 19.3, 12.5, 13.4, and 10.9 MPa, as calculated by Equation (12). It is not reasonable, however, that fd of grade No. 2 was larger than that of grade No. 1 in 2 × 3 and 2 × 4. To ensure conservative estimates and safe design, the fd for grade No. 1 and No. 2 must have the small design value between them. Thus, the final design values of grade No. 2 in 2 × 3 and 2 × 4, which were 14.2, 13.4 MPa, respectively, were considered the same as that of grade No. 1.
Table 9 indicates that the size of larch lumber had significant impact on the design value of MOR15. For each grade of lumber, the bigger the size, the smaller the design value of MOR15. As an example, the design value of grade SS of 2 × 3 was 20.8 MPa, which was 1.08 and 1.40 times that of 2 × 4 and 2 × 6, respectively. It is important to note that, for convenience in practical engineering application, the design value specified in the national standard requires multiplying different adjusting factors by the same reference value for different sizes of the same grade of lumber. The design value of 2 × 3 larch lumber was selected as the reference value.
Table 9. Design values of MOR15 and partial safety factor γR.
GradeSSNo. 1No. 2No. 3
Size2 × 32 × 42 × 62 × 32 × 42 × 32 × 42 × 62 × 32 × 4
fd (MPa)20.819.314.914.212.514.913.411.311.510.9
γR1.3181.3421.3751.4111.4171.3751.4081.4921.4291.429
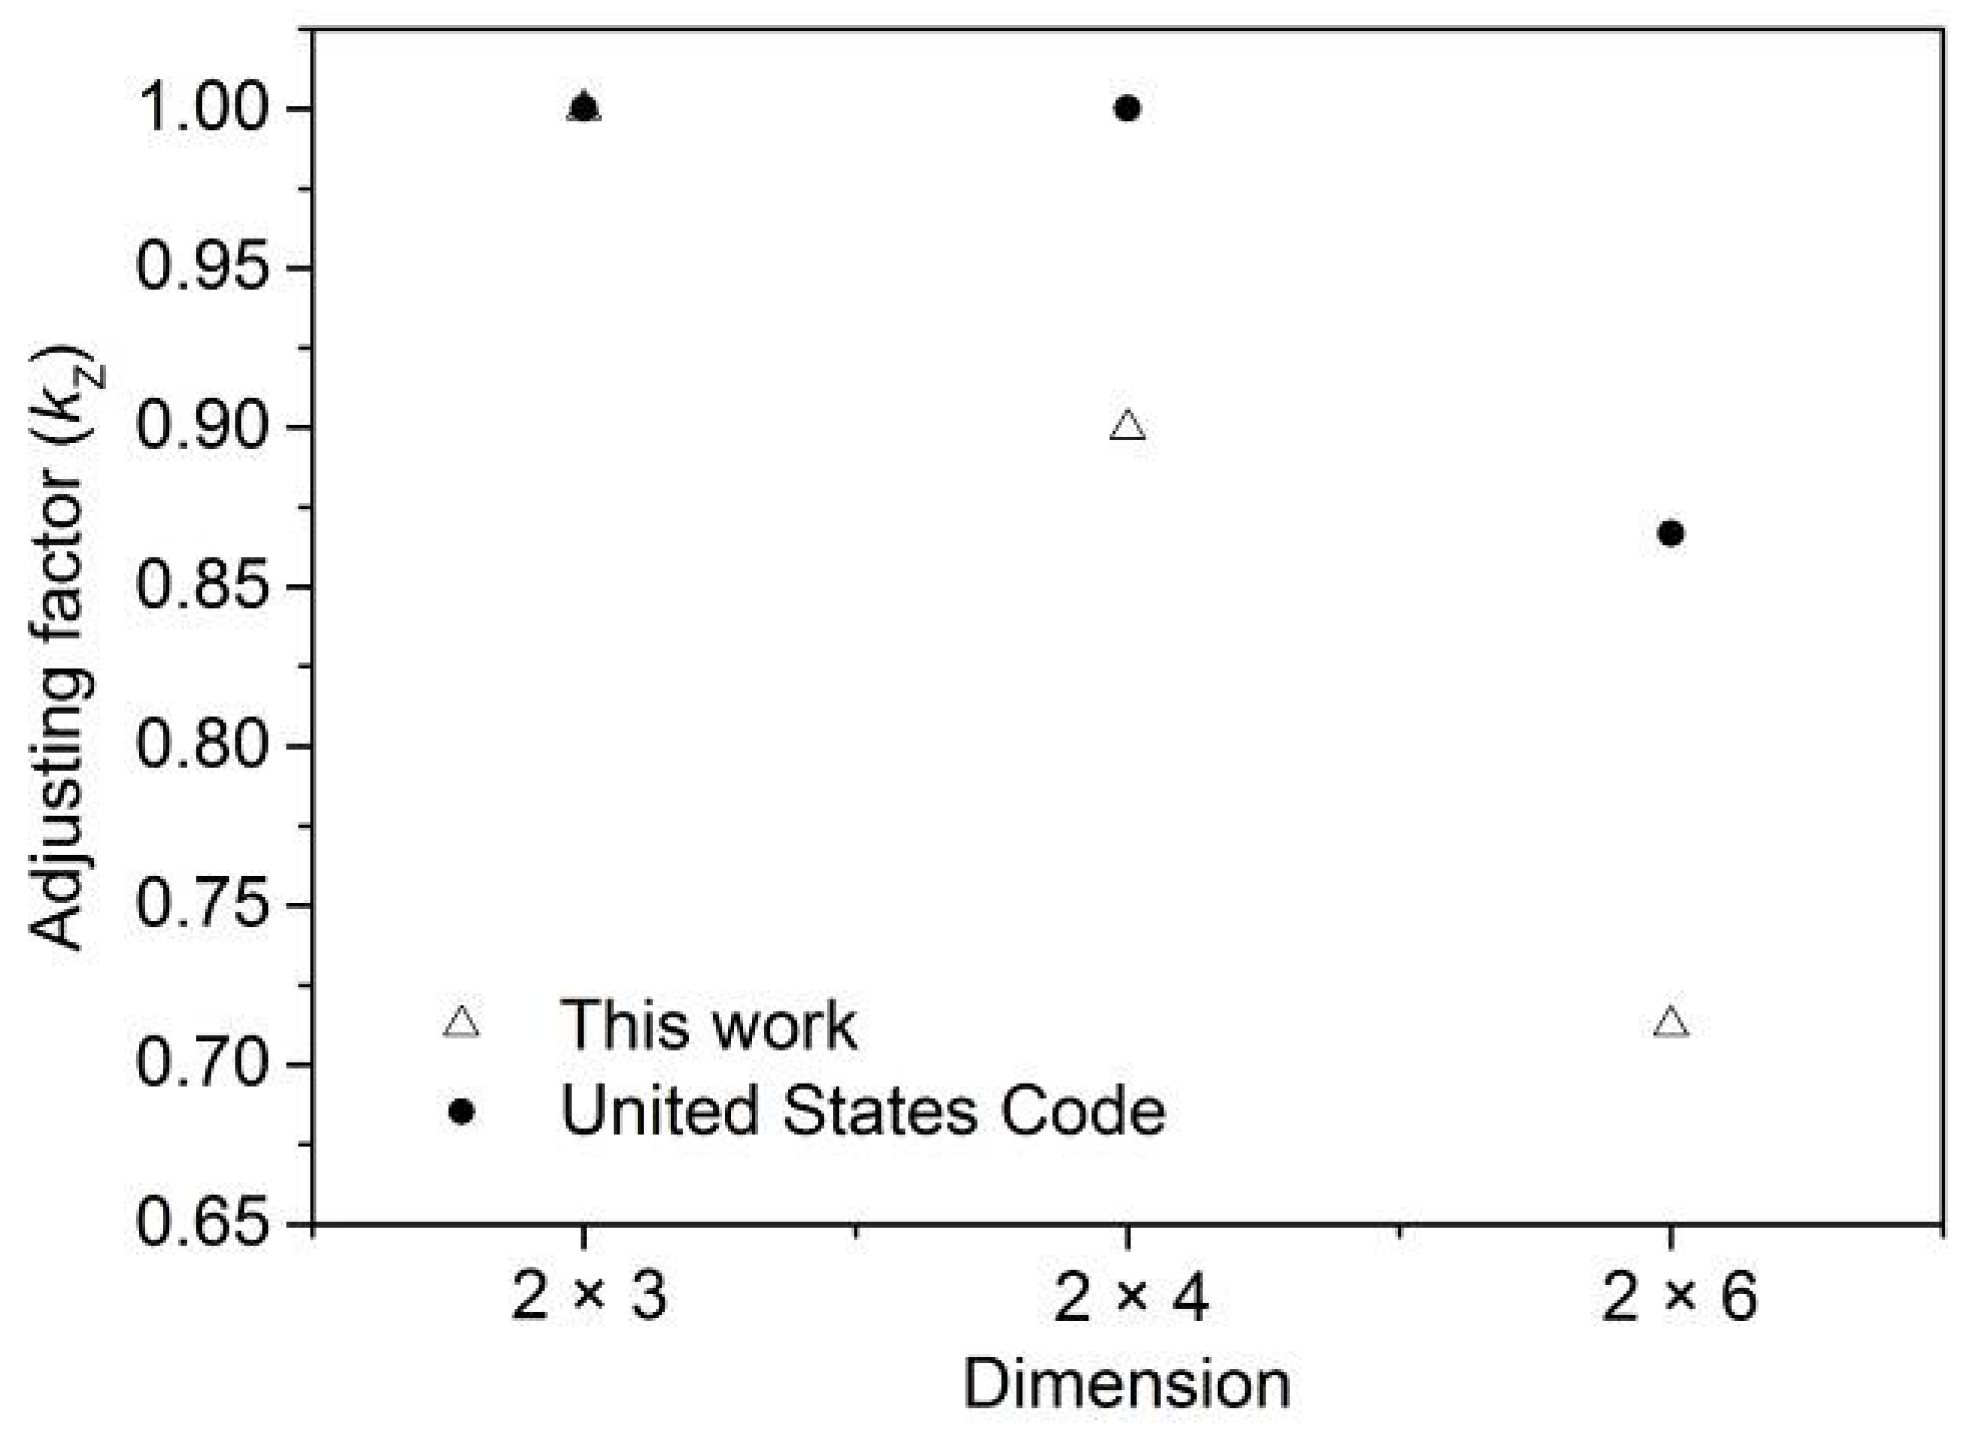
The adjusting factors of 2 × 4 were 0.925, 0.900, 0.900, and 0.942 for grades SS, No. 1, No. 2 and No. 3, and those of 2 × 6 were 0.713 and 0.762 for grades SS and No. 2, respectively. These results indicate that the adjusting factors were not the same among different grades, though most countries do set the same adjusting factors for different grades in one dimension. To ensure conservative estimates and safe design, it was reasonable to set adjusting factors to 0.900, 0.713 for 2 × 4 and 2 × 6 lumber, as shown in Figure 7. In the United States Code [2], adjusting factors are equal to 1.0 if the section height is not more than 90 mm, and grade and adjusting factors are uncorrelated. The adjusting factors of 2 × 4 and 2 × 6 are 1.00 and 0.867 for any tree species—significantly higher than those for larch lumber.
Figure 7. Adjusting factor of size effect (kZ) for larch lumber.
Materials 09 00089 g007

4. Conclusions

In this work, a series of static bending tests and statistical analyses were performed for Northeast China larch (Larix gmelinii) dimension lumber in order to investigate the size effect on the bending strength of dimension lumber. Frequency histograms of bending strength were fitted by normal and lognormal distribution models. Additionally, the effects of partial safety factor and live-to-dead load ratio were studied by reliability analysis. Based on the analysis of the test data, the following conclusions can be drawn:
  • MOR15 is affected by the size of larch dimension lumber; the bigger the size, the smaller the MOR15.
  • Design value of bending strength and adjusting factor of size effect of 2 × 3, 2 × 4, and 2 × 6 larch dimension lumber were successfully obtained according to the Chinese National Standards’ requirements.
  • Further developments will be mainly devoted to carry out wider experimental activity particularly on more varied sizes and species, in order to validate the adjusting factor of size effect obtained in this work.

Acknowledgments

This project was financially supported by the National Key Technology Support Program (2014BAL03B02) and Chinese Academy of Forestry Fundamental Research Fund (CAFINT2014C01). We are also honored to thank the Processing and Utilization Technology of High Strength Structural Materials team, at work during the 11th Five-year Plan of China, for providing basic data.

Author Contributions

Ze-Hui Jiang proposed the topic of this study. Hai-Qing Ren performed the experiments. Yong Zhong analyzed the data and wrote the final manuscript.

Conflicts of Interest

The authors declare no conflict of interest.

References

  1. Ye, K.L.; Lu, J.X. Processing and application technology development for Larch dimensional lumber. China Wood Ind. 2010, 24, 1–3. [Google Scholar]
  2. American Wood Council. National Design Specification for Wood Construction; American Wood Council: Leesburg, VA, USA, 1997. [Google Scholar]
  3. Canadian Standards Association. Engineering Design in Wood; Canadian Standards Association: Toronto, ON, Canada, 1994. [Google Scholar]
  4. Zhao, X. Probability distributions of ultra compression strength for the dimension lumber of Larch. For. Sci. Technol. 2013, 38, 41–44. [Google Scholar]
  5. Jiang, J.H.; Lu, J.X.; Ren, H.Q. Study on characteristic values for strength properties of Chinese Larch dimension lumber. J. Build. Mater. 2012, 15, 361–365. [Google Scholar]
  6. Zhao, X.; Lu, J.X.; Jiang, J.H. Study on characteristic values of Chinese Larch dimension lumber bending properties. China Wood Ind. 2009, 23, 1–4. [Google Scholar]
  7. Zhao, X.; Lu, J.X.; Jiang, J.H. Relationship between modulus of rupture and ultimate tension strength of dimensional Larch lumber. China Wood Ind. 2010, 24, 1–4. [Google Scholar]
  8. Long, C.; Lu, J.X. Progress on the testing methods for mechanical properties of dimension lumber. China Wood Ind. 2007, 21, 1–4. [Google Scholar]
  9. Lou, W.L.; Wang, Z.H.; Luo, X.Q.; Guo, W.; Ren, H.Q. Full size bending mechanical properties of Dahurian Larch dimension lumber. J. Anhui Agric. Univ. 2011, 38, 185–189. [Google Scholar]
  10. Zhong, Y.; Sun, H.L.; Lou, W.L.; Ren, H.Q.; Li, X.Z. Effect of knots on bending modulus of elasticity of Larch dimension lumber. J. Build. Mater. 2012, 15, 518–521. [Google Scholar]
  11. Zhong, Y.; Ren, H.Q.; Lou, W.L. Experimental research on the effects of knot on the bending strength of dimension lumber. J. Build. Mater. 2012, 15, 875–878. [Google Scholar]
  12. British Standards Institution. Timber Structures. Calculation of Characteristic 5-Percentile Values and Acceptance Criteria for a Sample; BS EN 14358:2006; British Standards Institution: London, UK, 2006. [Google Scholar]
  13. Zhong, Y.; Jiang, Z.H.; Ren, H.Q. Reliability analysis of compression strength of dimension lumber of Northeast China Larch. Constr. Build. Mater. 2015, 84, 12–18. [Google Scholar] [CrossRef]
  14. Zhong, Y.; Ren, H.Q. Reliability analysis for the bending strength of Larch 2 × 4 Lumber. Bioresources 2014, 9, 6914–6923. [Google Scholar] [CrossRef]
  15. China Standards Publication. Code for Design of Timber Structures; GB 5000003; China Standards Press: Beijing, China, 2003. [Google Scholar]
  16. National Lumber Grades Authority. Standard Grading Rules for Canadian Lumber; National Lumber Grades Authority: Surrey, BC, Canada, 2014. [Google Scholar]
  17. American Society of Testing Materials. Standard Practice For establishing Structural Grades and Related Allowable Properties for Visually Graded Lumber; ASTM D245-06; ASTM International: West Conshohocken, PA, USA, 2006. [Google Scholar]
  18. American Society of Testing Materials. Standard Test Methods for Direct Moisture Content Measurement of Wood and Wood-Base Materials; ASTM D4442-07; ASTM International: West Conshohocken, PA, USA, 2006. [Google Scholar]
  19. American Society of Testing Materials. Standard Test Methods for Mechanical Properties of Lumber and Wood-Base Structural Material; ASTM D4761-09; ASTM International: West Conshohocken, PA, USA, 2009. [Google Scholar]
  20. American Society of Testing Materials. Standard Practice for Establishing Allowable Properties for Visually-Graded Dimension Lumber from in-Grade Tests of Full-Size Specimens; ASTM D1990-14; ASTM International: West Conshohocken, PA, USA, 2007. [Google Scholar]
  21. Mao, S.L.; Wang, J.L.; Pu, X.L. Advanced Mathematical Statistics, 2nd ed.; Higher Education Press: Beijing, China, 2006. [Google Scholar]
  22. China Standards Publication. Unified standard for Reliability Design of Building Structures; GB 50068-2001; China Standards Press: Beijing, China, 2001. [Google Scholar]
  23. China Standards Publication. Unified Standard for Reliability Design of Engineering Structures; GB 50153-2003; China Standards Press: Beijing, China, 2003. [Google Scholar]
  24. China Standards Publication. Load Code for the Design of Building Structures; GB 50009-2012; China Standards Press: Beijing, China, 2001. [Google Scholar]
  25. Li, T.E. Determining the Strength Design Values of Wood Based on the Reliability Requirements. Ph.D. Thesis, Harbin Institute of Technology, Harbin, China, 2011. [Google Scholar]
  26. Zhuang, X.J. Reliability study of North American dimension lumber in the Chinese Timber Structures Design Code. Master’s Thesis, Shanghai University, Shanghai, China, 2004. [Google Scholar]
  27. Zhong, Y.; Jiang, Z.H.; Shangguan, W.W.; Ren, H.Q. Design value of the compressive strength for bamboo fiber reinforced composite based on a reliability analysis. Bioresources 2014, 9, 7737–7748. [Google Scholar] [CrossRef]
  28. Folz, B.; Foschi, R.O. Reliability-based design of wood structural systems. J. Struct. Eng. 1989, 115, 1666–1680. [Google Scholar] [CrossRef]
  29. Jiang, J.H.; Lu, J.X.; Ren, H.Q.; Long, C. Effect of growth ring width, pith and visual grade on bending properties of Chinese fir plantation dimension lumber. Eur. J. Wood Wood Prod. 2012, 70, 119–123. [Google Scholar] [CrossRef]
  30. Dahlen, J.; Jones, P.D.; Seale, R.D.; Shmulsky, R. Bending strength and stiffness of in-grade Douglas-fir and southern pine No. 2 2 × 4 lumber. Can. J. For. Res. 2012, 42, 858–867. [Google Scholar] [CrossRef]

