Article

Investigation of Fumed Silica/Aqueous NaCl Superdielectric Material

1
Department of Mechanical Engineering, Naval Postgraduate School, Monterey CA 93943, USA
2
Energy Academic Group, Naval Postgraduate School, Monterey, CA 93943, USA
*
Author to whom correspondence should be addressed.
Materials 2016, 9(2), 118; https://doi.org/10.3390/ma9020118
Submission received: 8 January 2016 / Revised: 4 February 2016 / Accepted: 16 February 2016 / Published: 20 February 2016
(This article belongs to the Section Energy Materials)

Abstract

:
A constant current charge/discharge protocol which showed fumed silica filled to the point of incipient wetness with aqueous NaCl solution to have dielectric constants >108 over the full range of dielectric thicknesses of 0.38–3.9 mm and discharge times of 0.25–>100 s was studied, making this material another example of a superdielectric. The dielectric constant was impacted by both frequency and thickness. For time to discharge greater than 10 s the dielectric constant for all thicknesses needed to be fairly constant, always >109, although trending higher with increasing thickness. At shorter discharge times the dielectric constant consistently decreased, with decreasing time to discharge. Hence, it is reasonable to suggest that for time to discharge >10 s the dielectric constant at all thicknesses will be greater than 109. This in turn implies an energy density for a 5 micron thick dielectric layer in the order of 350 J/cm3 for discharge times greater than 10 s.

Graphical Abstract

1. Introduction

There are several major technological transformations that are driving research into more energy-dense capacitors. First, a “green world” requires replacing fossil fuel systems with electric systems. Electric energy can be generated from a host of renewable, non-polluting sources including solar, wind, thermal, tide, etc. Yet to be employed in mobile systems, this electrical energy must be stored in high energy density form, generally batteries. In turn, battery systems are often buffered by capacitors as this prevents power surges from damaging and reducing the lifetime of batteries. Second, the need for power delivery at a level that cannot be achieved with batteries, for example in pulsed lasers, electromagnetic forming, accelerators, etc. requires higher energy density capacitors. Third, there is a general need for faster re-charge rates than can be achieved with batteries. The ultimate solution for this would be capacitors with energy density approaching that of the best (Li-ion) batteries.
Most of the attention given to development of higher energy capacitors is focused on “supercapacitors”, perhaps better described as electric double-layer capacitors (EDLC). This class of capacitors achieves high energy density by increasing the surface area of the electrically conductive electrodes. At present, most of the effort is focused on the use of graphene as the electrode material [1,2,3,4,5,6], although some high surface area clay shows promise [7]. The best “prototypes” of graphene-based EDLC have measured energy density of nearly 350 J/cm3 [6], and theoretical calculations suggest 800 J/cm3 is possible. Notably, commercial supercapacitors, which use less expensive forms of carbon, are all rated at <50 J/cm3.
Recently a new class of materials was invented: superdielectrics [8,9,10]. This suggests an alternative approach to increase the energy density of capacitors: to dramatically increase the dielectric constant of materials used in parallel plate capacitors. That is, use low surface area electrodes, but replace the current generation of dielectrics, for example, barium titanate [11,12,13] with a dielectric constant <104, with superdielectrics, defined to be materials with a dielectric constant >105 [8].
Superdielectrics were invented on the basis of a simple hypothesis, as discussed in the only three published articles on the topic [8,9,10]: Any non-conductive porous solid in which the pores are filled with a liquid with a sufficient concentration of dissolved ions will have a high dielectric constant. Hence, superdielectric materials (SDM) are hypothesized to be a large family. The proposed physical basis for the high dielectric constant is migration of dissolved ionic species to form giant dipoles within the liquid filling the pores of the insulating material in the presence of an applied field. The theory is a modification of the classic “ponderable media” model, which, in short, is that the dielectric value of a media is proportional to the size and concentration of dipoles that will form in the media upon the application of an electric field [14].
There are many unanswered questions regarding SDM. This study was intended to address a few. First, to demonstrate that Powder SDM (P-SDM) is a family of materials, as suggested in the hypothesis. This was done in the present work by a thorough study of fumed silica mixed with “salt water” (NaCl in distilled, deionized water), whereas earlier studies focused on high surface area, porous alumina containing other salts [8,9]. As described below, fumed silica-based P-SDM have dielectric constants >108 over a wide range of discharge times and dielectric thicknesses below 2.2 V. This result demonstrates that the fundamental SDM hypothesis is predictive. Second, to determine if the high dielectric constants measured for relatively thick dielectric layers can be extrapolated to very thin layers. It was found that the dielectric constant decreases as the layer thickness decreases. Third, to study the frequency/discharge time dependence of the dielectric constant. The results of this study show the dielectric constant decreases rapidly only when the discharge time is reduced below about 10 s. Extrapolating the results suggests that for discharge times greater than 10 s, and fumed silica layers of the order of 5 micron thick, the energy density will be >350 J/cm3.

2. Results

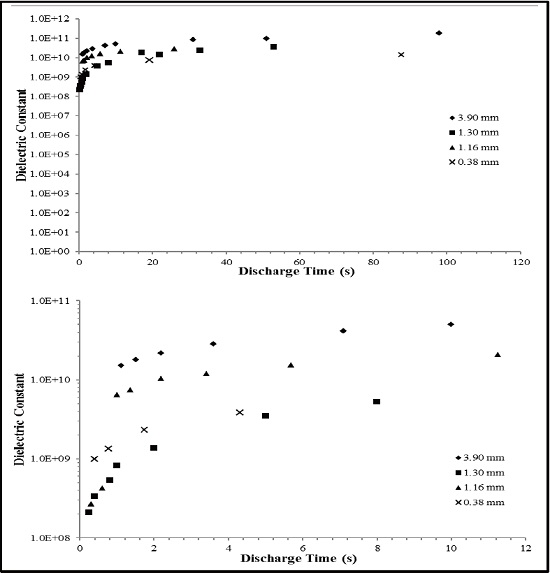
2.1. RC Time Constant

A set of capacitors employing fumed silica-based P-SDM, all 2 ± 0.1 mm thick, filled with aqueous solutions, with a range of salt (NaCl) concentrations were created. Three major points can be made concerning the results. First, the low frequency dielectric constants, determined for discharge times >4000 s in all cases, were clearly higher than any previously measured for SDM. Second, the dielectric constants measured for all fumed silica-based powder SDM were nearly constant over the entire discharge range, approximately 100 mV–1.1 V. Third, the dielectric constants increased as the salt concentration in the water increased (Figure 1).

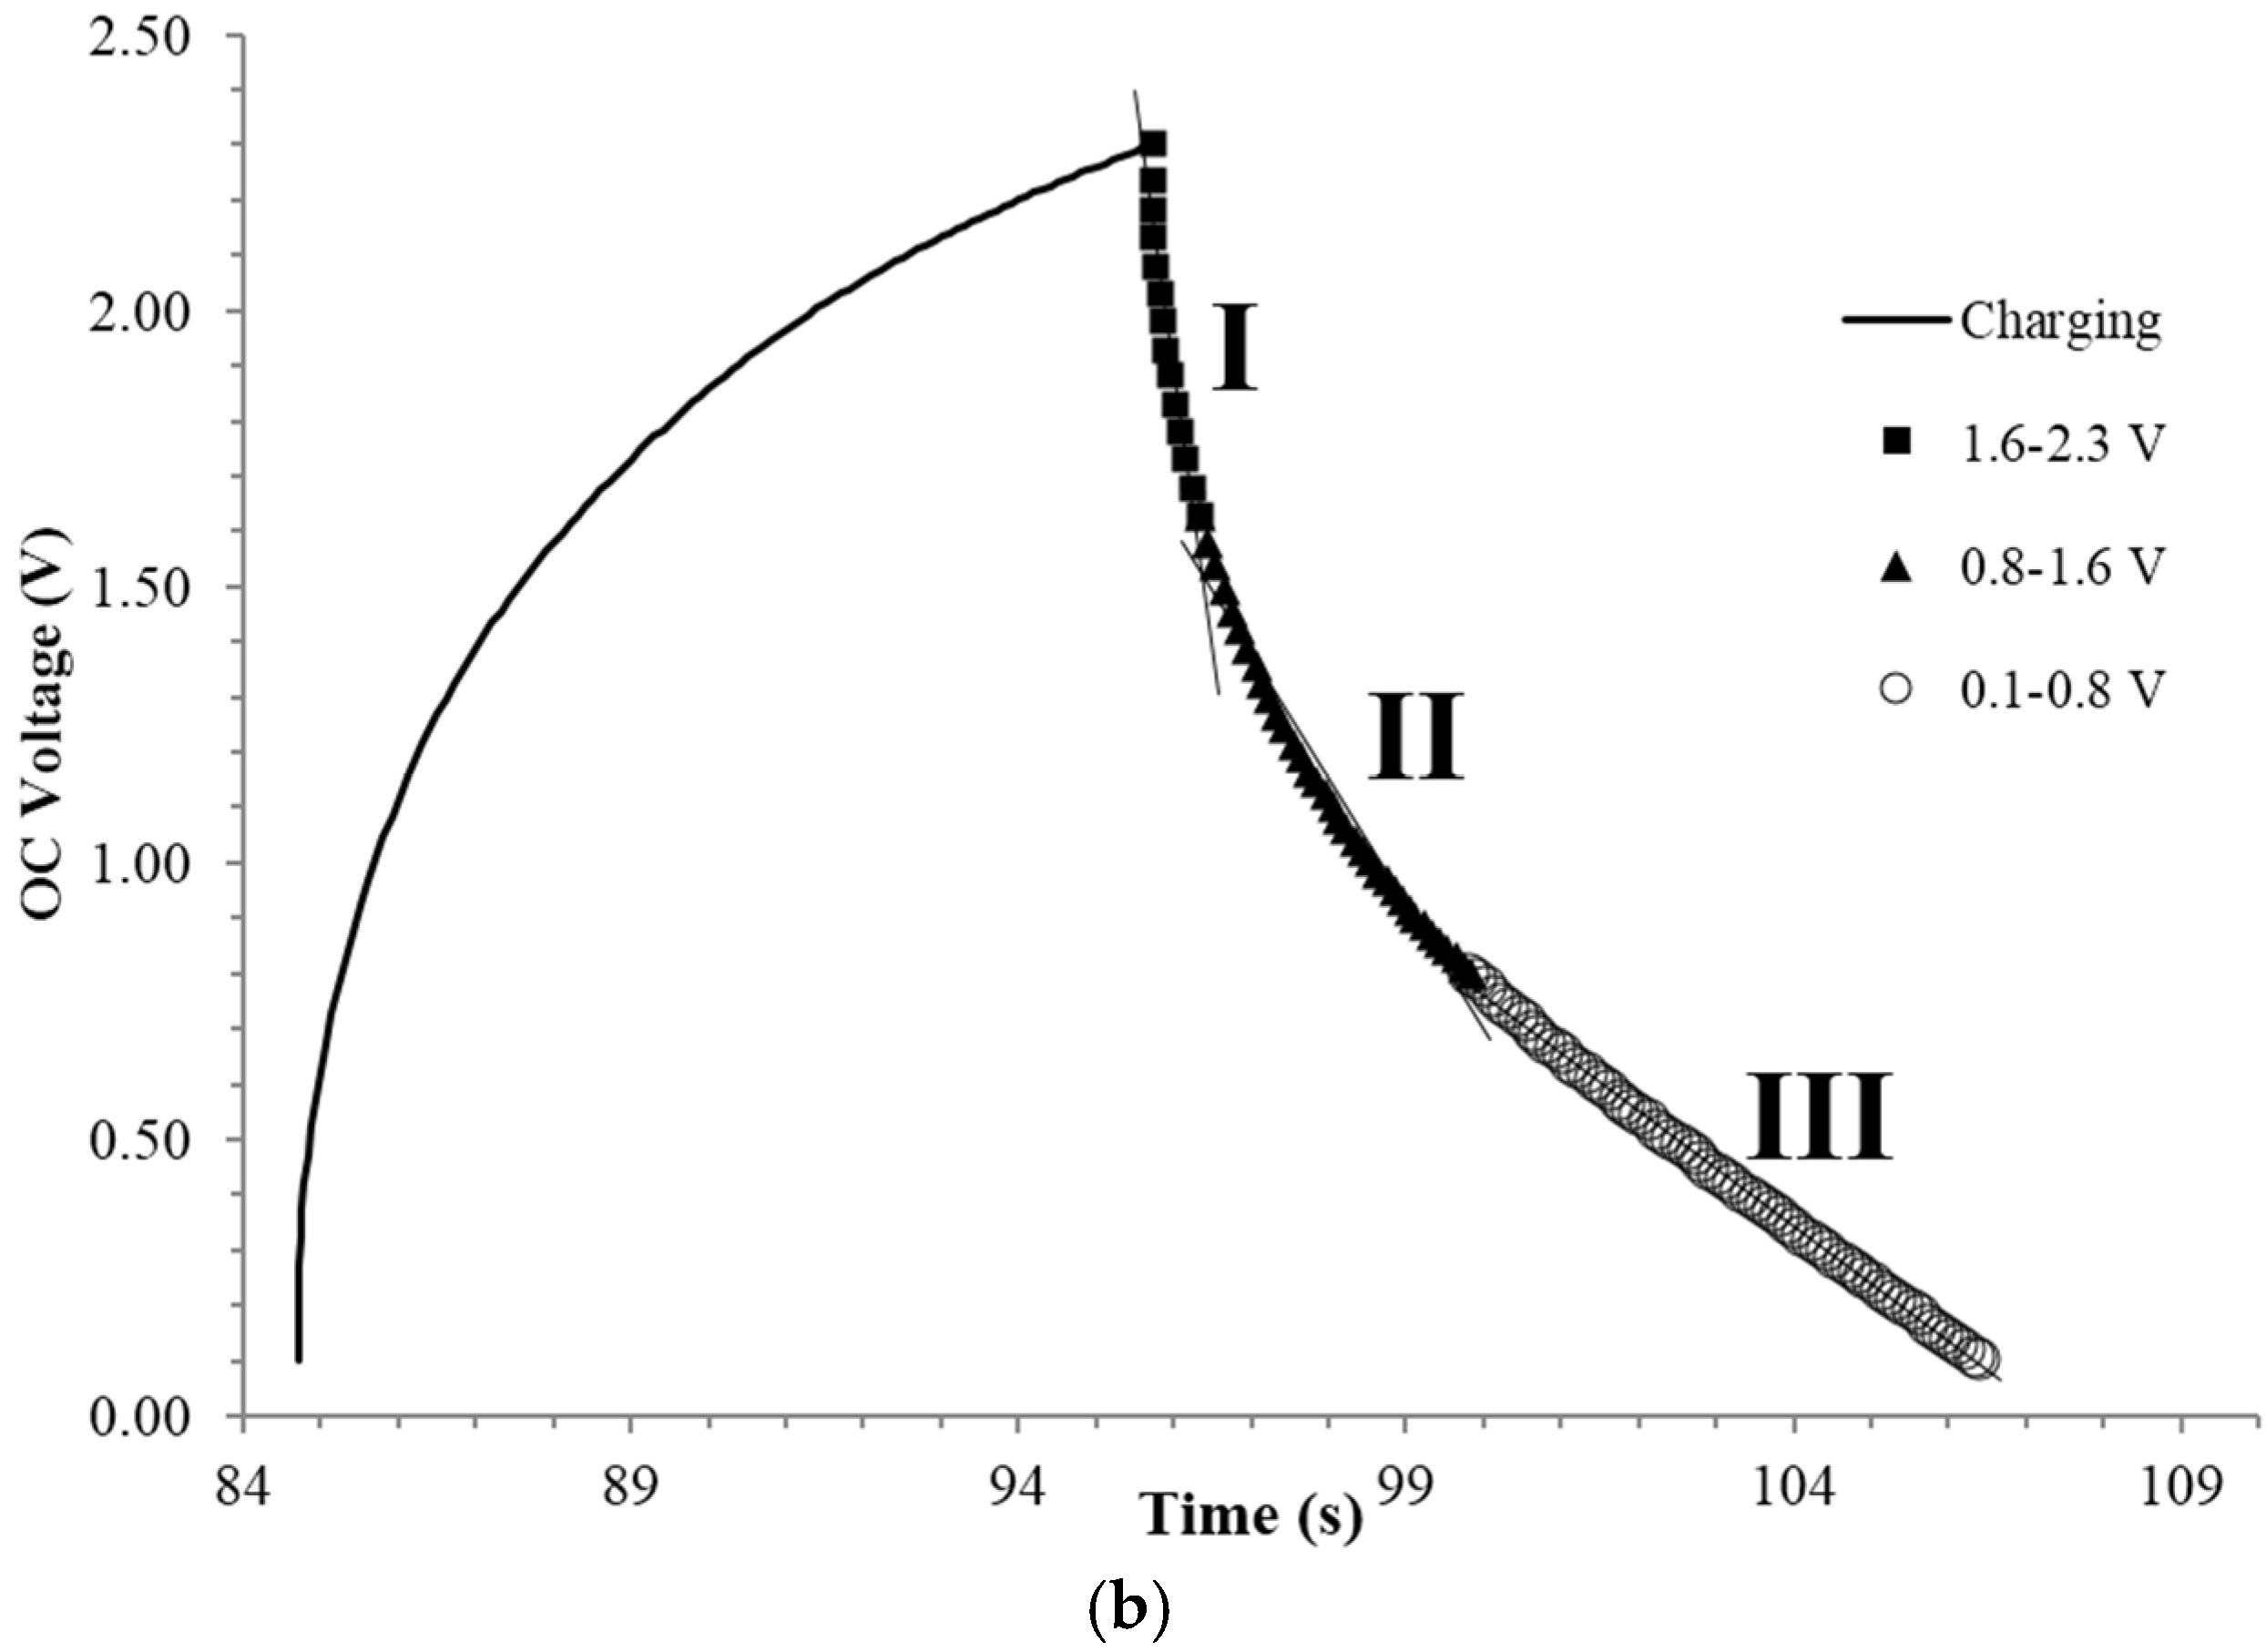
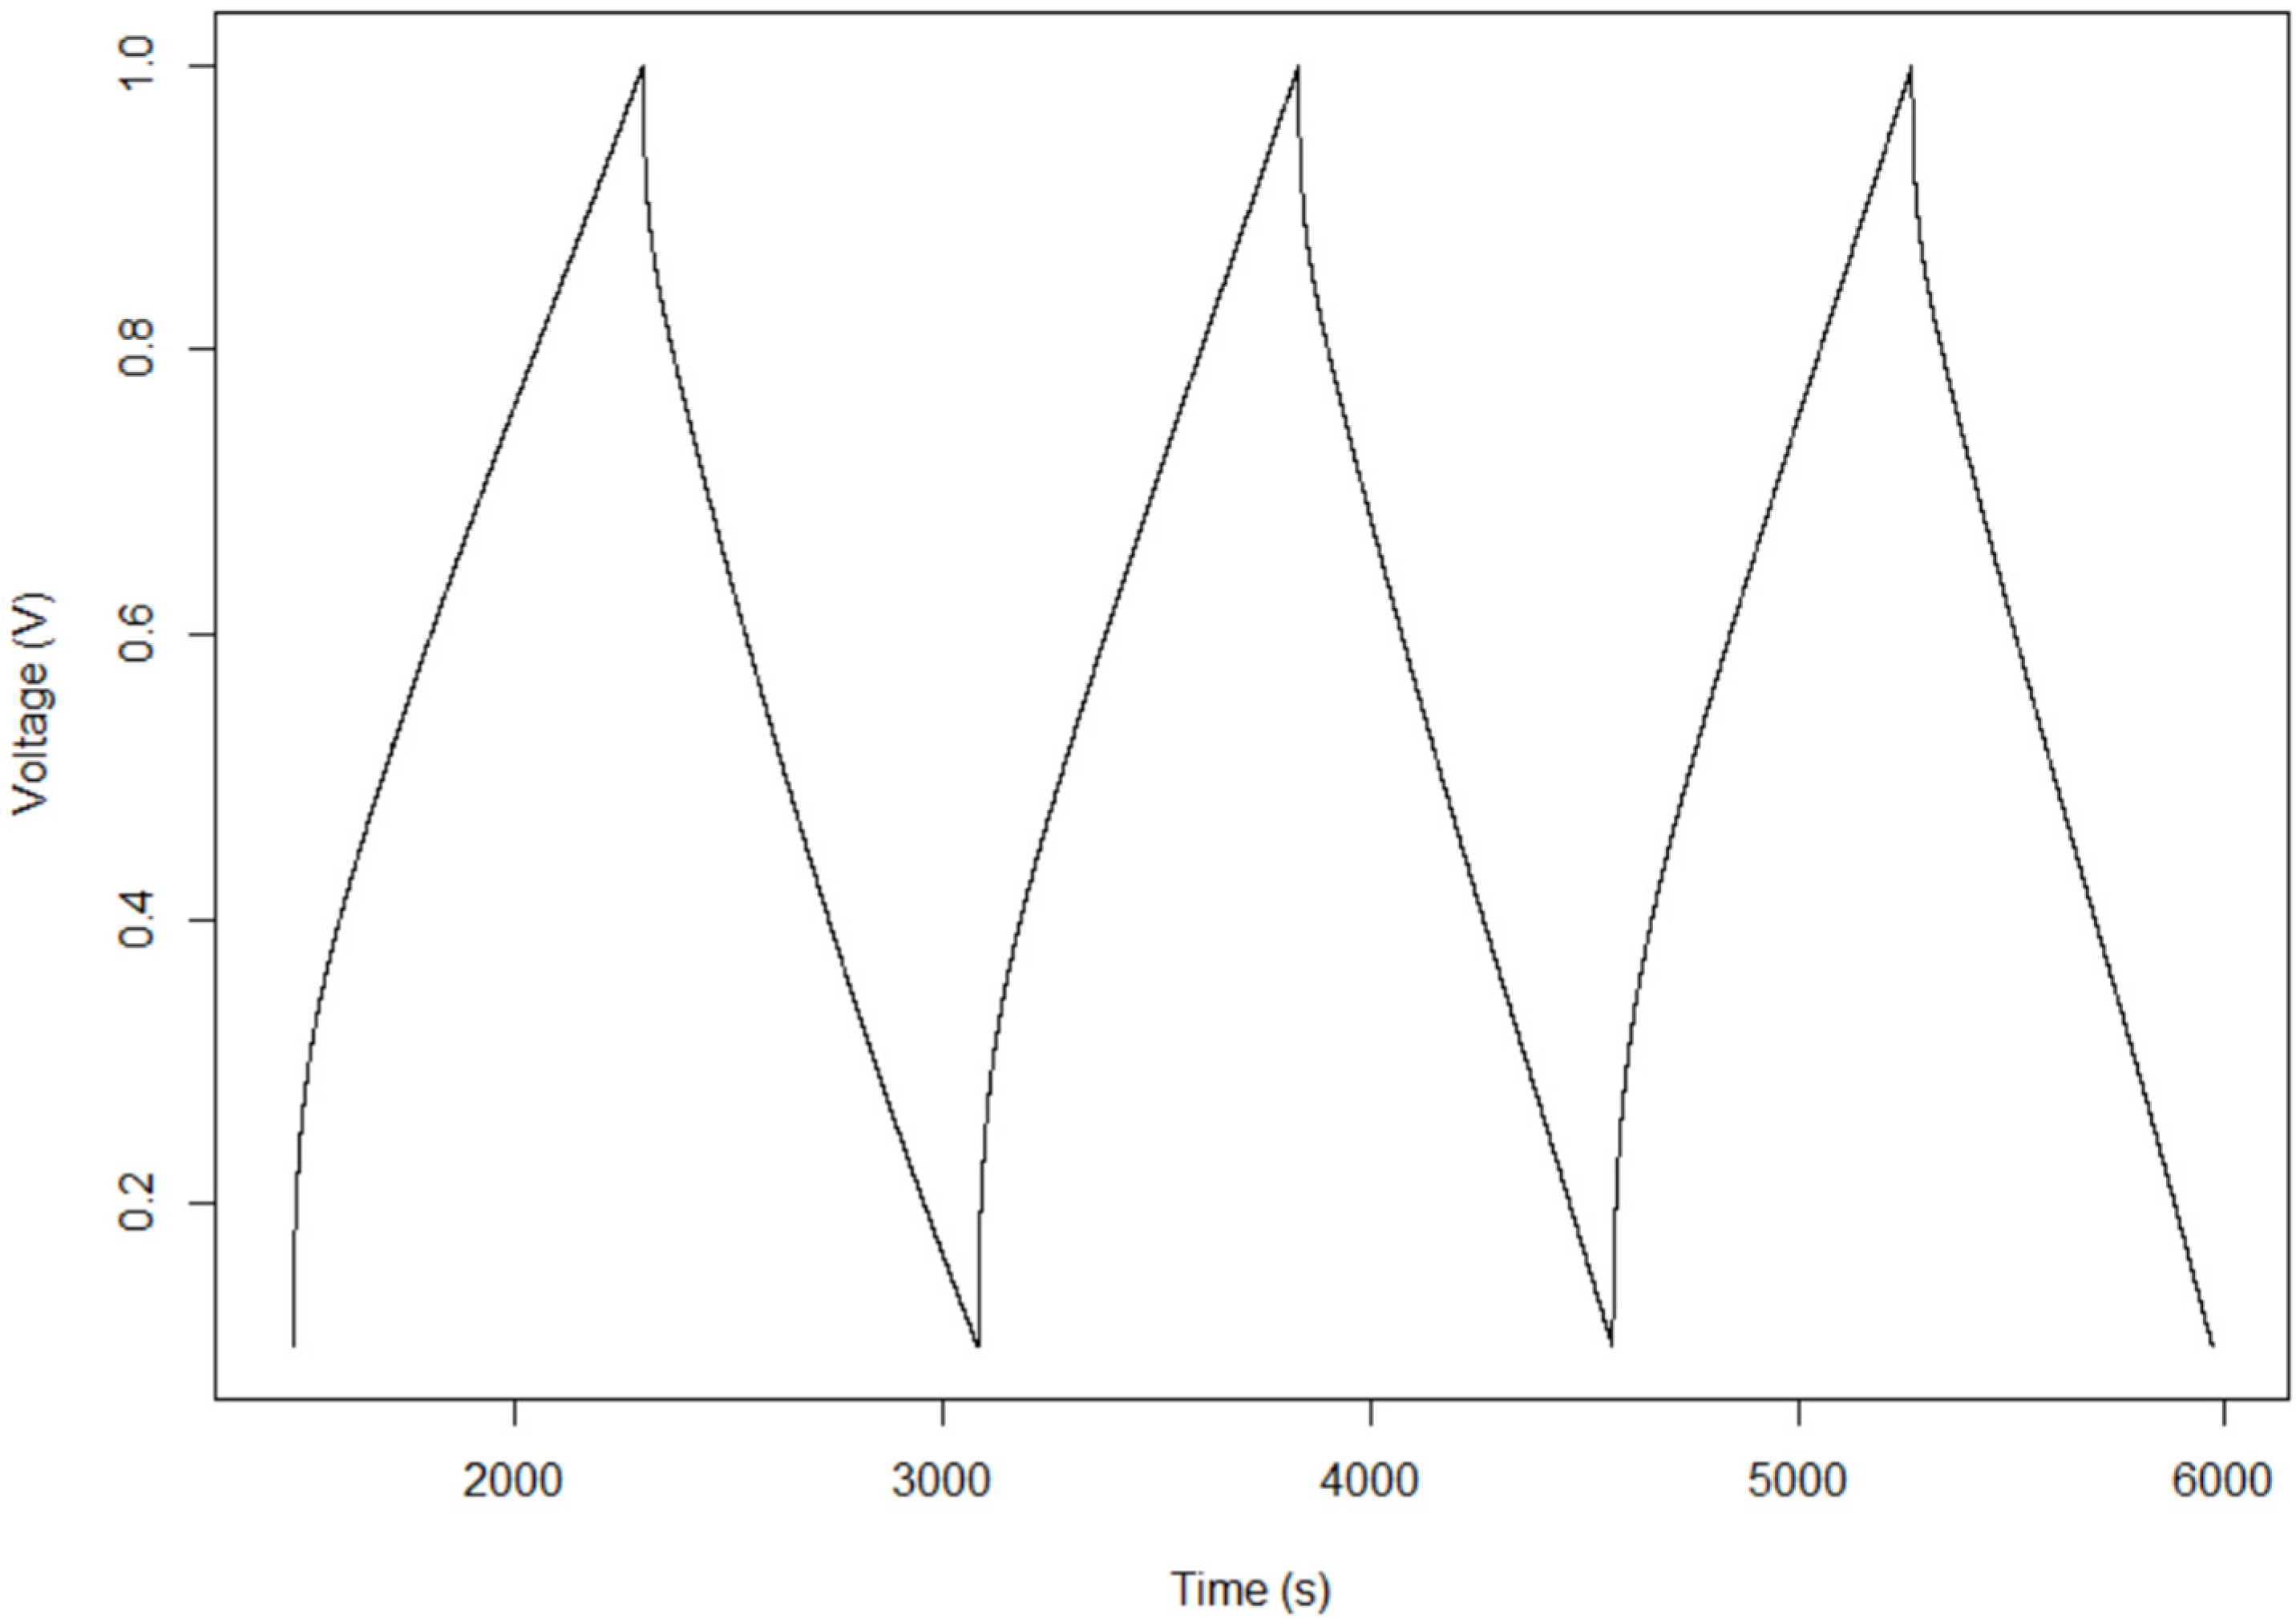
2.2. Constant Current

Constant current studies were only performed on four fumed silica samples of different dielectric thickness. Each of the four was filled to the point of incipient wetness with deionized DI water at a 72% ± 0.2% NaCl saturation level (Table 1). All studies were over the voltage range 0.1–2.3 V (Figure 2). A slightly higher maximum voltage, perhaps 2.5 V, was possible but only for the fastest discharge rates.
In the following analysis, for dielectric constant and other parameters, the quantitative analysis of the discharge was based on the “time to discharge” (DT). DT is defined as the time for the voltage during the discharge leg to go from 2.3 to 0.1 V. Frequency was not employed as a time unit for several reasons: (i) the discharge curves are not sine waves or any other regular “named” pattern; (ii) cycle time implies symmetric charge/discharge legs, and although the DT and TC (“Time to Charge”) was always within 20%, a perfectly symmetric charge/discharge was not observed; and (iii) the “discharge time” is a conservative, quantitative parameter related to “Power” output, the presumed application of Novel Paradigm Supercapacitors (NPS). Still, the DT values can be roughly related to frequency through the standard parameter of “period”, T where frequency is 1/T. That is, DT is approximately ½ T. The discharge time is not directly controlled but rather is a function of the constant current applied. Specifically, the higher the current applied, the faster charge/discharge. Hence, a range of currents was selected to determine dielectric values, energy density, power delivery, etc. as a function of DT (Table 1).
The decision to limit the constant current analysis to DT of less than ~120 s was based on the observation that at long DT the discharge curves are fundamentally different. For example for DT > 120 s the upper limit of the achievable voltage is far lower, and the regions of linear discharge are different. In fact, as shown in Figure 3, to a good approximation there is only one linear discharge region for slow discharges. This invalidates direct, quantitative, data comparisons between DT > 120 s and DT < 120 s.
The analysis starts, as with all discussions of electrostatic capacitors, with the dielectric constant. As discussed above, in order to make a quantitative comparison, the following points only pertain to DT < 120 s. The first result, Figure 4, is the remarkable magnitude of the dielectric constants. For example, in Region III (Figure 2) the dielectric constants were >108 for all thicknesses (0.38–3.9 mm) and DT (0.25–~100 s) studied.
In Region II (Figure 2) the dielectric constant values were about half that found below 0.8 V (Region III). In Region I (above 1.6 V) far lower dielectric constants were measured. The trends in the dielectric values as a function of discharge time and voltage region are shown in Figure 5, but only for Capacitor 3. It should be noted very similar trends were found for the other three capacitors.
The next aspect of the dielectric values providing quantitative insight, are trends as a function of DT and thickness. In particular, the dielectric constants as a function of DT reveal how an SDM-based capacitor can be expected to behave as an energy storage and/or power delivery device. Notably, the dielectric constant increases very slowly above a DT value of 10 s (Figure 4).
The data in Figure 1 (RC time constant data) is consistent with the trend in constant current data (Figure 4). The RC time constant data shows that for a 2 mm thick layer, and a discharge of >4000 s, the dielectric constant is ~1011. This value is consistent with an extrapolation, to long DT, of the constant current data in Figure 4. This is not a perfect comparison. Indeed, as noted above (e.g., Figure 3), the nature of discharges at very long DT values is fundamentally different, e.g., far lower maximum voltage. Still, very good quantitative agreement between measures using both RC time constant and constant current methods in dielectric values for long DT below 0.8 V is reassuring. This suggests that SDM based capacitors could be excellent for energy storage. However, the next trend suggests that power delivery could be a source of concern. Specifically, for DT less than 10 s there is a significant drop in the dielectric value. A decrease in dielectric constant with increasing frequency, or decreasing DT, is anticipated for any type of capacitor, but for the materials tested herein, a sharp drop in dielectric value, hence capacitance and power delivery, occurs at a relatively low frequency. The final notable trend is that the dielectric constants consistently increase with increasing layer thickness. This was not observed with other types of powder based superdielectric materials [8,9]. This issue is considered in the discussion section.
One of the chief intended applications of superdielectric-based capacitors is power delivery. Yet, as noted, the trend in dielectric value suggests there might be a decrease in the ability to deliver power as the frequency increases. Indeed, a similar limitation exists for EDLC. Is power delivery reduction with frequency a significant problem for SDM-based devices? The trend data compiled (Figure 6) suggests it may not be. “Power” is defined to be the total energy released between 0.1 and 2.2 V divided by the discharge time over that interval. Power density, the plotted value, is power/dielectric volume.
Several aspects of power density are notable. First, the power delivered is higher at shorter DT. This indicates that even though the dielectric value decreases as DT gets smaller, power delivery, the real objective, actually improves. Second, the power delivery increases as the thickness of the dielectric layer decreases. This trend is consistent with the general behavior of electrostatic capacitors, but is not anticipated for “supercapacitors”. Third, the power density is nearly flat for DT greater than ~20 s.
A third type of quantitative data obtained is the energy density. Based on an average of at least three cycles the energy density per discharge was computed (Figure 7). It decreased sharply with decreasing DT.
Another empirical finding regarding the behavior of the fumed silica based superdielectric material, is a study of aging. As shown in Figure 8, the capacitor looses dielectric value relatively rapidly in the first couple of days, but “settles in” at about half the original value, even in the poorly controlled environment (see Experimental section), after about three days.
Finally, it is possible to obtain estimated values of the internal resistance as a function of voltage simply by recording the voltage as a function of time for an open circuit. In the open circuit configuration it is assumed that the discharge occurs across an “equivalent circuit” consisting of a (internal) resistance, and a capacitance in parallel. A conservative value of the resistance is then computed by assuming a reasonable dielectric value, 1 × 10⁹. On these bases, the data in Figure 9 was interpreted to reveal that there are two distinct regions of resistance. Above ~1.2 V the internal resistance is of the order of 30,000 Ohm. Below this voltage the internal resistance is at least 2 MOhm. The actual values of internal resistance are subject to assumptions employed, but clearly for any model there is a dramatic increase in internal resistance values below V < 1.2 V. This dramatic “break” in the internal resistance is consistent with the model presented in the discussion section.

3. Discussion

3.1. Overview

It is important to distinguish empirical evidence from models used to explain the evidence. The former is clearly more certain than the latter. Starting with empirical evidence, one novelty of this work is the demonstration that the measured capacitance values using the fumed silica/aqueous NaCl-based material were three or more orders of magnitude higher than any previously measured using dielectrics of the thicknesses employed herein. Although similar capacitance values were measured in earlier studies using SDM, those measurements were all made at very low frequency, ca. 10−2 Hz.
On the next level of certainty are conclusions based on accepting the fundamental equation of parallel plate dielectric-based capacitors:
C =   ε ε 0 A t
On the basis of this equation the work presented allows a comparison of dielectric values. This leads to a second novelty of the work: the dielectric values determined at ~1 Hz (>108) using the fumed silica/aqueous NaCl-based material were three or more orders of magnitude higher than any previously measured. A more detailed discussion of other empirical findings such as the impact of frequency, thickness etc. is found below.
On the next level of certainty are models used to explain the observed high dielectric values. The model (SDM) presented herein is not based on direct measurement. Indeed, no measurement was made of the strength of the dipoles forming in the liquid phase of the dielectrics. Still, the key aspects of the model (more below), such as the presumption that dipoles will form in salt solution in the liquid phase of the dielectric upon the application of an electric field, and will reduce the field/net voltage between plates, is based on very elementary and fundamental concepts in physics. It is also a direct extrapolation of the classic theory of dielectrics [14]. That is, dielectrics increase capacitance by field-induced formation of dipoles that oppose the applied field, hence lowering the net voltage, and concomitantly increasing the capacitance (C = Q/V). More discussion of the SDM model and its congruence with observation is found below.

3.2. Empirical Findings

Eight significant empirical findings regarding fumed silica-based P-SDM are outlined below. All these findings, collectively, permit an extrapolation of the data collected here to a general model of power/energy of P-SDM. As discussed later, a reasonable extrapolation of the data collected herein suggests P-SDM with a dielectric having a thickness of 5 micron will have unprecedented energy and power characteristics.
First finding: As postulated, fumed silica filled with a salt solution to the point of incipient wetness is one of the family of “superdielectric” materials (ε > 105). Indeed, below 1 volt ε was always measured to be greater than 108. The results are consistent with the general SDM hypothesis: A solid, non-electrically conductive matrix, filled with a liquid containing dissolved ionic species will be a superdielectric. This finding is significant for fumed silica as it is not a “porous material”, like the alumina materials employed in earlier studies, but rather a material composed of nanoscale silica particles in which the “pores” are the spaces between particles. The impact of this special morphology on the observed behavior is discussed in the model section below.
Second finding: The dielectric constant for fumed silica-based P-SDM is greater than 108 even for discharge times as low as 0.25 s. Earlier superdielectric materials were only studied for very long DT, of the order of thousands of seconds. It is notable that the values reported here are more than three orders of magnitude greater than any reported for any other class of materials [15,16,17], including colossal dielectric materials [18,19,20,21,22,23,24,25,26].
Third finding: There is a “roll–off” in the effective dielectric constant with decreased discharge time. This is essentially equivalent to the statement that the dielectric constant decreases with increasing frequency. As shown in Figure 4 and Figure 5, the dielectric constant is nearly steady for DT greater than 10 s, in fact >109. However, as the discharge time is decreased below 10 s, the dielectric values decrease sharply. Roll-off of the dielectric constant with frequency is expected for all capacitors.
Fourth finding: The effective maximum operating voltage is a function of charge/discharge rate. For DT of <120 s, the maximum operating voltage was in the range of 2.3–2.5 V. For longer discharge times, the effective maximum operating voltage was lower. For example, for charging that took more than 500 s, and this was accomplished by using constant charging at <1 mA, the approximate maximum effective voltage was 1.1 V (Figure 3).
Fifth finding: The dielectric constant is dependent on thickness for fumed silica-based P-SDM. This was not found to be the case for porous alumina based P-SDM. A tentative explanation is provided in the model section below.
Sixth finding: For fumed silica filled with salt water, the dielectric constant increases with the relative salt saturation of the water. As discussed elsewhere, the dielectric constant should reflect the length of the dipoles forming in the liquid phase as well as the density of dipoles [8,9,10]. The length of the dipoles is considered independent of the salt concentration, but the density of dipoles should be directly proportional to the salt concentration. Thus, this observation is consistent with the SDM hypothesis.
Seventh finding: The internal resistance increases dramatically at ~1.2 V. For the case studied, the internal resistance increased by a factor of ~65 below this voltage.
Eighth finding: P-SDM capacitors, at least for the fumed silica based prototypes constructed for this study, do lose capacitance gradually as a function of time. The capacitance does appear to “stabilize” at a value about half that measured initially.

3.3. Model

Most results are clearly consistent, with two major caveats with the earlier-postulated model for P-SDM [9,10]: Super dielectric behavior results from charge separation occurring via ion transport induced by field gradients in the ionic-filled aqueous solutions trapped in the pores of the refractory oxide. That is, dipole strength/field is proportional to dipole length and dipole charge. The length of dipoles formed by ion separation in the liquid phase is orders of magnitude greater than that possible in a solid, and the “charge” density in a NaCl solution is very high. Hence, the field created by dipoles formed in the liquid phase should dwarf those that can form in solid dielectrics. This should lead to dramatically higher dielectric constants, as observed [9,10].
One feature of the model not previously discussed is the anticipated impact of frequency. Thus we add this postulate: P-SDM will show sharp reduction in dielectric values with increasing frequency because dipole “re-orientation” with field reversal is a slow process. That is, the ions must physically “swim”, clearly a time consuming process, from one end of a pore to another during dipole re-orientation. This qualitative model is clearly consistent with the observed impact of “frequency” on dielectric values. The fall in dielectric values observed for DT <10 s can be attributed to the failure of the dipoles to fully “re-orient” in the allotted time. In contrast, re-orientation of the “atom scale” dipoles in solids should occur much more quickly. Indeed, dielectric roll-off in solid dielectrics, for example Colossal Dielectric Constant CDC [24,25,26] materials, does not occur until far higher frequencies, ca. 1 MHz.
There are two features of the SDM model, that fit alumina- and silica-based P-SDM that are difficult to apply to fumed silica. The two caveats are: (i) the existence of large dielectric constants in fumed silica-based SDM; (ii) the existence of capacitance above the “electrolysis” voltage of water breakdown.
Regarding the first caveat: The above model is not a satisfactory explanation for the observation of super dielectric behavior with fumed silica. That is, there are no large “pores” in fumed silica. Moreover, it is clear the spaces between the ~4 nm particles that compose compacted fumed silica, are no larger than the particles themselves, in fact they are smaller. In sum, the observation of large dielectric values for fumed silica-based SDM is not fully explained by the model.
The above difficulty can be overcome with this modest modification of the SDM postulate: The “size” of the dipoles in SDM reflects the “net length” over which ion transport occurs. That is, charge separation occurs over a “network” of spaces-between-particles in fumed silica. This does not occur in refractory oxides with large pores within individual particles. This modification gives rise to other questions, such as the proposed net length of the network of spaces.
There are at least a couple of models of dipole “net length” in fumed silica-based SDM consistent with the data collected. First model: The “net length” is the actual separation distance between electrodes. Second Model: Net length is a value associated with how far ions can travel during a charge/discharge cycle. In turn, this would imply a decrease in net dipole length and hence dielectric value, as DT is shortened. That is, the dipole length will reflect how far charges, which are after all ionic species, can travel in the time “allotted” for transport, which is roughly the charging time. This is clearly consistent with observation. Moreover, it implies that the dielectric value is also related to the charge protocol, becoming larger as the charge time is increased, or increasing with increased “driving force”, i.e., the voltage applied during charging. The present data is not sufficient to test these implications, but clearly suggest directions for future work.
Regarding the second caveat: The ability of the capacitors to consistently reach 2.3 V is unexpected. Given that dielectric “breakdown” of water to form hydrogen and oxygen is expected at about 1.3 V, how can higher voltages be reached? The following model is put forward. At ~1.3 V there is breakdown of water. This leads to an increase in the number of charged species, such as OH and H+ in the aqueous environment. This effectively increases the number of charge carriers, and concomitantly decreases the “internal resistance” of the dielectric layer. However, it does not lead to an immediate “short”. Given that a simple equivalent circuit consists of a load resistor in series with an internal resistor, changes in the value of the internal resistor will be reflected in the delivery rate of power to the load. It is a simple “voltage divider” analysis. Hence, on the basis of this model it should be expected that above ~1.3 V, there are more charge carriers in the dielectric, leading to a decrease in the internal resistance. This is turn leads to more “power” leaking through the dielectric layer rather than going through the load. This yields an apparent decrease in dielectric value with increasing voltage, as observed. This model is not perfect, as a sharp decrease in dielectric value is observed above 0.8 V, not 1.2 V. Further study and consideration is clearly required.
Are alternative models of high dielectric constant consistent with the observations reported? Indeed, there are highly developed models of high dielectric values for CDC materials. These capacitors are composed of materials with bulk dielectric constants of the order of 103, but sometimes (CaCu3TiO12) very thin layers have measured dielectric values at zero volts as high as 105. In order to explain these results, workers in this field developed equivalent circuit models that assume the existence of “surface states” or “interface states”. The existence of these states is not based on direct measurements, but inferred from models [24,25,26].
Virtually all data on CDC is collected using impedance spectroscopy (IS), a technique that measures dielectric value at a single voltage. The value of the voltage amplitude has to be smaller than the thermal voltage [27], about 25 mV at 25 C, in order to be in a range of linear relation between current and voltage. The algorithms used to determine dielectric values as a function of frequency require perfect sinusoidal waves both for input and output. To insure validity, tests are generally conducted 0 V ± 15 mV [28]. Even for crystals in the “barium titanate family”, impedance spectroscopy shows capacitance to continuously vary as a function of voltage, in some cases, very dramatically [28], and, theoretically, this should be the case for all “high” dielectric constant materials [29].
The voltage range generally studied using IS is below the minimum value employed in the present work. Lower voltage behavior is not reported herein because we noted some instability in behavior at very low voltages, and apparent extreme dielectric values. We also decided to work at conditions similar to those anticipated for fielded devices. Clearly, behavior at zero volts is not representative of that anticipated for actual deployed systems. Hence, direct comparison with the IS data collected in CDC studies cannot be made. However, there are reasons to suggest surface states are not responsible for the observations made here and in earlier studies of SDM. For example, experimental data on CDC shows that at ambient temperature the dielectric constants are virtually constant below ~1 Mhz, clearly not at all similar to the behavior reported herein. Also, the dielectric constants measured here are at least three orders of magnitude higher than any reported in CDC or other literature. Finally, another group reported some preliminary IS data for alumina/aqueous NaCl-based P-SDM. They report dielectric values, stable to ~1 kHz at ambient, consistent with our own observations [30].

3.4. Energy Density

The extrapolation of the data to very thin dielectric layers suggests P-SDM could be excellent energy storage devices. Using a dielectric value of 109 (see earlier discussion, and Figure 4), assuming V = 1.4 V (“net” for three regions), and assuming a dielectric of 5 micron thickness, we obtain an energy density of ~350 J/cm3 from Equation (2) developed [10] elsewhere:
Energy Density = 1 2   ×   ε ε 0 V 2 t 2
This number, based on dielectric values for relatively slow discharge (DT > 10 s), is only a postulate, based on a particular model. As shown in earlier studies, extrapolating dielectric constants, particularly those of titanates, to very thin films is fraught with risk. Specifically, in earlier extrapolations of barium titanate data, insufficient attention was paid to issues such as dipole saturation, and breakdown at high fields, leading to dramatically exaggerated energy density expectations [31]. Indeed, energy densities for very thin films of barium titanate or other titanate species in the hundreds of joules/cm3 were predicted, whereas the realized values were less than 1 J/cm3.
Recently, there have been reports that electrostatic capacitors employing certain nano-composites have high energy density. For example, one report regards dielectric composites composed primarily of nanowires of BaxSr1-xTiO3, and suggests these can be configured into capacitors with energy density of the order of 20 J/cm3 [23]. However, the dielectric constant of these materials is very low, <20 in all cases, and the predicted high energy density is based on high breakdown voltages. Hence, real capacitors based on these materials would have to be extremely thin, and the stability tenuous. For example, a 10 micron thick dielectric layer of this material operated at 30 V (breakdown of air for this thickness) would have an energy density of about 10−3 J/cm3. To reach the predicted value of ~20 J/cm3 , a 10 micron thick dielectric layer would have to be operated at 500 V. This is close to, but below, the reported breakdown voltage of the material; however, given the breakdown voltage of air, the operational parameters are clearly problematic.
Others report that a sol gel can achieve similar or higher energy density, but once again the analysis is based on materials with very low dielectric constants (<25), in very thin layers, operated at voltages far above the breakdown of air [32]. There are also extrapolated energy density values for ceramic capacitors greater than 20 J/cm3, but again these extrapolations require the assumed application of voltages far above the breakdown voltage for air for very thin dielectric layers [33,34]. Can similar difficulties be anticipated for the superdielectric materials studied herein? Although for P-SDM, neither breakdown, saturation, nor voltages that will lead to air breakdown are anticipated, the only conclusion that can be drawn from earlier failed extrapolations is that there is no alternative but to develop and test very thin P-SDM films.

4. Materials and Methods

4.1. Capacitor

As described in two earlier works [8,9] capacitors are created from a “dielectric paste” spread between two Grafoil [35,36] electrodes (0.4 mm thick × 5 cm diameter), a commercially available, paper-like, moderate surface area (~20 m2/gm) material composed of compressed graphite (>99%) flakes. The dielectric paste is created by filling a high surface area refractory oxide, fumed silica, (Aldrich powder, St. Louis, MO, USA, 0.007 μm) to the point of incipient wetness with a solution of salt (Sigma Aldrich 10 mesh anhydrous beads, 99.999% NaCl, St. Louis, MO, USA), dissolved in distilled deionized water. According to the manufacturer, the fumed silica consists of “primary particles” of average size 7 nm, weakly agglomerated into larger particles. This is consistent with observations made elsewhere using SEM [37]. It is also important to note that fumed silica is a very hygroscopic material, and for this work “incipient wetness” was defined to be a weight ratio of 4 water:1 fumed silica. As a point of comparison, in earlier work with alumina the weight ratio for incipient wetness was of order 1.1 water: 1 alumina [8,9]. The dielectric layer thickness was determined by averaging multiple measurements, made with a micrometer, of the assembled NPS. The electrode thickness was subtracted from this value.

4.2. Measurement Methods

Two methods were employed to determine characteristics relevant to energy storage: (i) the classic RC time constant method; and (ii) galvanostatic charge/discharge (constant I). Other methods, for example, impedance spectroscopy, were judged to be inappropriate. That method, associated with hand held multi-meters and far more sophisticated devices, is based on deconvolution of RC time constant data collected at a single voltage, in general 0 ± 15 mV [27,28]. In the more sophisticated devices, the impedance as a function of frequency can be deconvoluted from the data. However, in no case is the energy output during the discharge part of the cycle ever directly measured. It can only be inferred from a model of capacitance and some additional data regarding the maximum voltage that can be achieved. For a reliable understanding of the behavior expected for energy storage devices, the behavior over the entire voltage operating range must be studied [10,31].

4.3. RC Time Constant

In a few cases the RC time constant method was employed. As described in more detail elsewhere [8,9] the test capacitor is charged at 4 V for a specified period and then switched to discharge through a 20 K Ohm resistor. The voltage drop across the capacitor is measured and recorded using an Agilent U1252A multi-meter (Aligent, Santa Clara, CA, USA) linked to a PC. A plot ln(V/Vo) vs t, for a constant capacitance value, produces a slope of −1/RC, given R, C is computed.

4.4. Constant Current

The constant current method was conducted using a BioLogic Model SP 300 Galvanostat (Bio-Logic Science Instruments SAS, Claix, France). This method does not permit the selection of the discharge rate; however, the discharge rate is a function of the discharge current. Thus, the trend in dielectric constants and energy density was determined by measuring these values by variation of the discharge current. In all cases the charging current was the same magnitude as the discharge current, but of opposite sign.
The physical arrangement of the capacitor for the Galvanostat testing is shown in Figure 10. Careful observation of the actual performance of the instrument showed that in all cases the measured current was within 5% of the nominal current. Another source of error was determination of the thickness of the dielectric, estimated to be ±0.05 mm, which for three of the capacitors was less than 5%. A third source of error was in the measurement of the slope of the discharge (dI/dV), determined by measurement of multiple discharges to be no more than 5%. Another indication of data validity is precision. Dielectric values in all cases were determined from three or more discharges and it was found the values differed by less than 5% in all cases. Overall, it is reasonable to feel confident values presented in the results section are ±10% of true values.
It is also notable that careful experiments were conducted to determine the maximum operating voltage. The maximum voltage programmed in all cases was 2.3 V or a little larger. Thus 2.3 V was selected as a conservative, easily repeated, value for the maximum operating voltage. However, the “effective” maximum capacitive voltage for the discharge leg was lower than 2.3 V for very long discharge times: discharges requiring more than 500 s.
Ageing was studied in one case by measuring the decline in the capacitance of one capacitor over fifteen days. Specifically, the performance of one capacitor was studied using a standard protocol: charging at 10 mA to a maximum voltage of 2.3 V, followed by discharging at 10 mA to 100 mV for many cycles.
Finally, measurements were made of the approximate internal resistance of the capacitor simply by measuring the decrease in voltage during open circuit operation.

5. Conclusions

This is the first study of the frequency response of capacitors built with P-SDM. It was demonstrated that at least one type of Powder SDM, a type never previously tested, fumed silica filled to the point of incipient wetness with highly concentrated aqueous NaCl solution, has remarkable/unprecedented dielectric constants (>108), below a frequency of ~1 Hz, and below about 1 V. Above this frequency and/or voltage the dielectric constant drops quickly. These findings are consistent with the SDM hypothesis: Any electrically insulating porous solid filled with a liquid containing a high concentration of dissolved ions is likely to be an SDM. On the basis of the novel frequency response data a further logical, qualitative, corollary was added to the SDM hypothesis: P-SDM will show a sharp reduction in dielectric values with increasing frequency because dipole “re-orientation” with field reversal is a slow process. Moreover, the results suggest thin layer P-SDM-based capacitors may make excellent energy storage/power releasing devices. A simple computation suggests fumed silica-based capacitors 5 microns thick could have an energy density of the order of 350 /cm3.

Acknowledgments

This project was partially funded by the Naval Research Program at the Naval Postgraduate School.

Author Contributions

Natalie Jenkins performed all experimental/analysis work for the RC time constant section. Clayton Petty aided in capacitor creation, data collection, and limited analysis as well as graph preparation and paper editing. Jonathan Phillips built and tested the capacitors studied using the constant current method. He also directed all work and did the bulk of the analysis and writing.

Conflicts of Interest

The authors declare no conflict of interest.

References

  1. Lee, H.; Byamba-Ochir, N.; Shim, W.G.; Balathanigaimani, M.S.; Moon, H. High-performance super capacitors based on activated anthracite with controlled porosity. J. Power Sources 2015, 275, 668–674. [Google Scholar] [CrossRef]
  2. Sui, Z.Y.; Meng, Y.N.; Xiao, P.W.; Zhao, Z.Q.; Wei, Z.X.; Han, B.H. Nitrogen-doped grapheme aerogels as efficient supercapacitor electrodes and gas adsorbents. ACS Appl. Mater. Interfaces 2015, 7, 1431–1438. [Google Scholar] [CrossRef] [PubMed]
  3. Murali, S.; Quarles, N.; Zhang, L.L.; Pottsa, J.R.; Tanb, Z.; Lub, Y.; Zhub, Y.; Ruoffa, R.S. Volumetric capacitance of compressed activated microwave-expanded graphite oxide (a-MEGO) electrodes. Nano Energy 2013, 2, 764–768. [Google Scholar] [CrossRef]
  4. Liu, C.; Yu, Z.; Neff, D.; Zhamu, D.N.; Jang, B.Z. Graphene-based supercapacitor with an ultrahigh energy density. Nano Lett. 2010, 10, 4863–4868. [Google Scholar] [CrossRef] [PubMed]
  5. Qiu, Y.; Li, G.; Hou, Y.; Pan, Z.; Li, H.; Li, W.; Liu, M.; Ye, F.; Yang, X.; Zhang, Y. Vertically aligned carbon nanotubes on carbon nanofibers: A hierarchical three-dimensional carbon nanostructure for high-energy flexible supercapacitors. Chem. Mater. 2015, 27, 1194–1200. [Google Scholar] [CrossRef]
  6. Xu, Y.; Lin, Z.; Zhong, X.; Huang, X.; Weiss, N.O.; Huang, Y.; Duan, X. Holey graphene frameworks for highly efficient capacitive energy storage. Nat. Commun. 2014, 5. [Google Scholar] [CrossRef] [PubMed]
  7. Ghidiu, M.; Lakatskaya, M.R.; Zhao, M.Q.; Gogotski, Y.; Barscum, M.W. Conductive two dimensional titanium carbide “clay” with high volumetric capacitance. Nature 2014. [Google Scholar] [CrossRef] [PubMed]
  8. Fromille, S.; Phillips, J. Super Dielectric Materials. Materials 2014, 7, 8197–8212. [Google Scholar] [CrossRef] [Green Version]
  9. Quintera, F.; Phillips, J. Super dielectrics composed of NaCl and H2O and porous alumina. J. Electro. Mater. 2015, 44, 1367–1376. [Google Scholar]
  10. Quintera, F.; Phillips, J. Tube-super dielectric materials: Electrostatic capacitors with energy density greater than 200 J·cm−3. Materials 2015, 8, 6208–6227. [Google Scholar]
  11. Pecharroman, C.; Esteban-Betegon, F.; Bartolome, F.; Lopez-Esteban, J.F.; Moya, J. New percolative BaTiO3-Ni composites with a high and frequency-independent dielectric constant (ϵr ≈ 80000). Adv. Mat. 2001, 13, 1541–1544. [Google Scholar] [CrossRef]
  12. Pecharroman, C.; Esteban-Betegon, F.; Jimenez, R. Electric field enhancement and conduction mechanisms in Ni/BaTiO3 percolative composites. Ferroelectrics 2010, 400, 81–88. [Google Scholar]
  13. Saha, S.K. Observation of giant dielectric constant in an assembly of ultrafine Ag particles. Phys. Rev. B 2004, 69, 125416–125420. [Google Scholar] [CrossRef]
  14. Jackson, J.D. Classical Electrodynamics, 2nd ed.; Wiley: New York, NY, USA, 1975. [Google Scholar]
  15. Bergman, D.J.; Imry, Y. Critical behavior of the complex dielectric constant near the percolation threshold of a heterogeneous material. Phys. Rev. Lett. 1977, 39, 1222–1225. [Google Scholar] [CrossRef]
  16. Efros, A.L.; Shklovskii, B.I. Critical behaviour of conductivity and dielectric constant near the metal-non-metal transition threshold. Phys. Stat. Sol. B 1976, 76, 475–485. [Google Scholar] [CrossRef]
  17. Efros, A.L. High volumetric capacitance near the insulator-metal percolation transition. Phys. Rev. B 2011, 84. [Google Scholar] [CrossRef]
  18. Samara, A.A.; Hammetter, W.F.; Venturini, E.L. Temperature and frequency dependences of the dielectric properties of YBa2Cu3O6+x (x ≊ 0). Phys.Rev. B 1990, 41, 8974–8980. [Google Scholar]
  19. Rey, C.M.; Mathias, H.; Testardi, L.R.; Skirius, S. High dielectric constant and nonlinear electric response in nonmetallic YBa2Cu3O6+δ. Phys. Rev. B 1992, 45, 10639–10646. [Google Scholar]
  20. Yang, Y.; Wang, X.; Liu, B. CaCu3Ti4O12 ceramics from different methods: microstructure and dielectric. J. Mat. Sci. 2014, 25, 146–151. [Google Scholar] [CrossRef]
  21. Lunkenheimer, P.; Krohns, S.; Riegg, S.; Ebbinghaus, S.G.; Reller, A.; Loidl, A. Colossal dielectric constants in transition-metal oxides. Eur. Phys. J. 2009, 180, 61–89. [Google Scholar] [CrossRef]
  22. Lunkenheimer, P.; Bobnar, V.; Pronin, A.V.; Ritus, A.I.; Volkov, A.A.; Loidl, A. Origin of apparent colossal dielectric constants. Phys. Rev. B 2002, 66. [Google Scholar] [CrossRef]
  23. Tang, H.; Sodano, H.A. Ultra high energy density nanocomposite capacitors with fast discharge using Ba0.2Sr0.8TiO3 nanowires. Nano Lett. 2013, 13, 1373–1379. [Google Scholar] [PubMed]
  24. Lunkenheimer, P.; Fichtl, R.; Ebbinghaus, S.G.; Loidl, A. Nonintrinsic origin of the colossal dielectric constants in CaCu3Ti4O12. Phys. Rev. B 2004, 70. [Google Scholar] [CrossRef]
  25. Krohns, S.; Lu, J.; Lunkenheimer, P.; Brize, V.; Autret-Lambert, C.; Gervais, M.; Gervais, F.; Bouree, F.; Porcher, F.; Loidl, A. Correlations of structural, magnetic, and dielectric properties of undoped and doped CaCu3Ti4O12. Eur. Phys. J. B 2009, 72, 173–182. [Google Scholar] [CrossRef]
  26. Kant, C.; Rudolf, T.; Mayr, F.; Krohns, S.; Lunkenheimer, P.; Ebbinghaus, S.G.; Loidl, A. Broadband dielectric response of CaCu3Ti4O12: From dc to the electronic transition regime. Phys. Rev. B 2008, 77. [Google Scholar] [CrossRef]
  27. Barsoukov, E.; MacDonald, J.R. Impedance Spectroscopy Theory, Experimental and Applications, 2nd ed.; Wiley: New York, NY, USA, 2005; p. 4. [Google Scholar]
  28. Raistrick, I.D.; Franceschetti, D.; MacDonald, J.R. Impedance Spectroscopy Emphasizing Solid Materials and Systems; MacDonald, J.R., Ed.; Wiley: New York, NY, USA, 1987; p. 27. [Google Scholar]
  29. Waser, R.; Lohse, O. Science and Technology of Integrated Ferroelectrics. In Proceedings of the International Symposium on Integrated Ferroelectrics, Colorado Springs, CO, USA, 11–14 March 2001; de Aranjo, C.P., Ramedi, R., Taylor, G.W., Eds.; CRC Press: Boca Raton, FL, USA, 2001; p. 501. [Google Scholar]
  30. Yun, L.; College of Physical and Mathematical Sciences, Australia National University, Canberra, Australia. Personal communication, 2015.
  31. Reynolds, G.J.; Krutzer, M.; Dubs, M.; Felzer, H.; Mamazza, R. Electrical properties of thin-film capacitors fabricated using high temperature sputtered modified barium titanate. Materials 2012, 5, 644–660. [Google Scholar] [CrossRef]
  32. Kim, Y.; Kathaperumal, M.; Chen, V.W.; Park, Y.; Fuentes-Hernandez, C.; Pan, M.J.; Kippelen, B.; Perry, J.W. Energy storage: Bilayer structure with ultrahigh energy/power density using hybrid sol-gel dielectric and charge-blocking monolayer. Adv. Energy Mat. 2015. [Google Scholar] [CrossRef]
  33. Parizi, S.S.; Mellinger, A.; Caruntu, G. Ferroelectric barium titanate nanocubes as capacitive building blocks for energy storage applications. ACS Appl. Mater. Interfaces 2014, 6, 17506–17517. [Google Scholar] [CrossRef] [PubMed]
  34. Tong, S.; Ma, B.; Narayanan, M.; Liu, S.; Koritala, R.; Balachandran, U.; Shi, D. Lead lanthanum zirconate titanate ceramic thin films for energy storage. ACS Appl. Mater. Interfaces 2013, 5, 1474–1480. [Google Scholar] [CrossRef] [PubMed]
  35. Phillips, J.; Clausen, B.; Dumesic, J.A. Iron pentacarbonyl decomposition over grafoil. Production of small metallic iron particles. J. Phys. Chem. 1980, 84, 1814–1822. [Google Scholar] [CrossRef]
  36. Phillips, J.; Dumesic, J.A. Iron pentacarbonyl decomposition over grafoil: II. Effect of sample outgassing on decomposition kinetics. Appl. of Surf. Sci. 1981, 7, 215–230. [Google Scholar] [CrossRef]
  37. Jenkins, N.R. Optimal Superdielectric Materials. M.S. Thesis, Naval Postgraduate School, Monterey, CA, USA, September 2015. [Google Scholar]
Figure 1. Dielectric constant below 1 volt vs. level of NaCl saturation for fumed silica-based capacitors. The RC time constant method was employed to determine the dielectric constant of fumed silica/aqueous NaCl dielectric materials that differed substantially only in the level of salt concentration. For example, in all cases the dielectric thickness was 2 ± 0.2 mm. Relative saturation computation was based on 100% NaCl saturation at 25 °C: 360 g NaCl/1000 g H2O.
Materials 09 00118 g001
Figure 2. Example of raw, constant current data for capacitor 1. (a) Ten cycles, with a DT of ~9 s. (b) In this and all other cases dielectric constants computed for three regions, by voltage; I: 1.6–2.3; II: 0.8–1.6; and III: 0.1–0.8 V. These regions show nearly linear change in voltage for a constant current.
Materials 09 00118 g002aMaterials 09 00118 g002b
Figure 3. Long time to discharge behavior. Shown is a slow discharge process (DT ~600 s) for capacitor 1, programmed to reach 1 volt. The maximum voltage attainable, for long DT, just over 1.1 V in this case, was at best 1.3 V, and to a good approximation the capacitance is constant over the entire discharge.
Materials 09 00118 g003
Figure 4. Dielectric constant 0.8–0.1 Volts. (a) Dielectric constants measured for DT of less than 120 s. (b) Dielectric constants measured for DT less than 12 s. The thickness of the dielectric layer is shown in the figure key.
Materials 09 00118 g004
Figure 5. Dielectric constant as a function of DT, three voltage regions, capacitor 3. Dielectric constants were computed for three voltage regions, as described in the text. The highest dielectric constant, and ~60% of the energy, is found below 0.8 V. All four capacitors displayed a similar pattern of deceasing dielectric value with increasing voltage and decreasing DT.
Materials 09 00118 g005
Figure 6. Power as a function of thickness and DT. (a) Power density (total energy released in one discharge divided by DT × dielectric volume) increases as the dielectric layer thickness decreases. For DT greater than ~20 s power is nearly constant for any dielectric thicknesses. (b) DT values less than 12 s. The delivered power increases as discharge is done more rapidly.
Materials 09 00118 g006
Figure 7. Energy density as a function of DT and dielectric thickness. (a) For discharge times up to 120 s. Energy density decreases very slowly for DT > 10 s; (b) For discharge times less than 12 s. This clearly shows energy density drops sharply for DT < 2 s.
Materials 09 00118 g007
Figure 8. Relative capacitance as a function of time. As shown the capacitance decreases steadily for the first 150 h, and then stabilizes. All three capacitive regions, 0.8–0.1 V, 1.6–0.8 V, and 2.3–1.6 V loose capacitance at roughly the same rate.
Materials 09 00118 g008
Figure 9. Open circuit voltage. There is clearly a dramatic change in internal resistance at approximately 1.2 V, the voltage of water decomposition.
Materials 09 00118 g009
Figure 10. Testing geometry galvanostat: A—Dielectric Material, variable thickness; B—Grafoil electrodes, 0.04 cm thick × 5 cm diameter; C—Grafoil “wires”, ~10 cm length; D—Galvanastat (BioLogic 300); E—1 liter volume zip lock plastic bag; F—DI water-saturated paper towel.
Materials 09 00118 g010
Table 1. Capacitors tested with Galvanostat.
CapacitorDielectric Layer Thickness * (mm) (±0.05)MAX/MIN Current ** Applied (mAmps)Dielectric Constant, <0.8 V At DT of 10 s (±10%)
13.9070/105.5 × 1010
21.3090/87.0 × 109
31.15110/101.05 × 1010
40.38100/106.0 × 109
* Dielectric thickness was varied over a full order of magnitude in this study. ** In order to study the effects of DT (discharge time) the applied constant current was also varied over approximately an order of magnitude range. As anticipated, the higher the current, the faster the discharge.

