Article

Functionalization of Fe3O4 NPs by Silanization: Use of Amine (APTES) and Thiol (MPTMS) Silanes and Their Physical Characterization

1
Dipartimento di Chimica e Chimica Industriale, Università degli Studi di Genova, Via Dodecaneso 31, 16146 Genova, Italy
2
Dipartimento di Chimica e Chimica Industriale, Università degli Studi di Genova and CNR-SPIN Genova Unit, Via Dodecaneso 31, 16146 Genova, Italy
*
Author to whom correspondence should be addressed.
Materials 2016, 9(10), 826; https://doi.org/10.3390/ma9100826
Submission received: 29 July 2016 / Revised: 29 September 2016 / Accepted: 2 October 2016 / Published: 12 October 2016

Abstract

:
In this paper the results concerning the synthesis of magnetite (Fe3O4) nanoparticles (NPs), their functionalization using silane derivatives, such as (3-Aminopropyl)triethoxysilane (APTES) and (3-mercaptopropyl)trimethoxysilane (MPTMS), and their exhaustive morphological and physical characterization by field emission scanning electron microscopy (FE-SEM) with energy dispersion X-ray spectrometer (EDX) analysis, AC magnetic susceptibility, UV-VIS and IR spectroscopy, and thermogravimetric (TGA) analyses are reported. Two different paths were adopted to achieve the desired functionalization: (1) the direct reaction between the functionalized organo-silane molecule and the surface of the magnetite nanoparticle; and (2) the use of an intermediate silica coating. Finally, the occurrence of both the functionalization with amino and thiol groups has been demonstrated by the reaction with ninhydrin and the capture of Au NPs, respectively.

Graphical Abstract

1. Introduction

Magnetic nanoparticles (MNPs) have many attractive applications for a wide range of disciplines, including magnetic fluids, catalysis, biotechnology/biomedicine, magnetic resonance imaging, data storage, and environmental remediation [1,2,3,4,5,6,7,8,9,10,11,12]. While a number of suitable methods have been developed for the synthesis of magnetic nanoparticles, successful application is highly dependent on the stability of the particles under a range of different conditions.
However, among the different kinds of (MNPs), only maghemite (γ-Fe2O3) and magnetite (Fe3O4) NPs are mainly taken into account due to their lower toxicity for biomedical or environmental applications, with respect to other magnetic materials (Co- and Ni- based nanoparticles (NPs) [13]. Both iron oxides are ferrimagnetic with a magnetic moment of 2.5 μB/f.u. (formulae units) for γ-Fe2O3 and 4.0 μB/f.u. for Fe3O4, respectively [13]. Below a characteristic dimension (critical diameter ds), in single-domain magnetic nanoparticles, the magnetic behavior called superparamagnetism, is reached when the thermal energy is greater with respect to the anisotropy energy, so the magnetization vector can fluctuate easily between the up and down directions, with a time-averaged net moment equal to zero. The time required to have a change from the up to the down state is called relaxation timeN) and the temperature at which a change from the spin -flip free state to the blocked state is observed is called blocking temperature (TB). Since the time required to make a measurement is dependent on the equipment used, the blocking temperature for the same system of NPs could be different depending on the technique used. The superparamagnetic state is characterized by a zero value of the coercivity and this is the magnetic state commonly used for the above-cited applications.
Fe3O4 NPs are currently preferred to γ-Fe2O3 ones, due to larger magnetic moment and relatively simple synthetic methods. These NPs are also widely used as the starting point for complex functionalization in order to reach different properties. A typical “nano-architecture” is formed by a magnetic core plus one or more intermediate coatings before the final functionalization.
Usually, polymer or inorganic coatings are widely used when the core of functionalized “nano-architectures” needs to be protected from oxidation/corrosion processes, or when toxic or pollution problems, arising from the core, must be prevented. Furthermore, the use of inorganic structures (silica, alumina, or titania coatings) around the magnetic NPs increases their stability in solution, preventing or minimizing the formation of agglomerates due to magnetic dipole–magnetic dipole interactions. However, this step is always time consuming and is often quite expensive. Functionalized magnetic nanoparticles could be used to capture, for instance, toxic heavy metals or molecules, arising from relatively large quantities of waste water; this is a typical example where a fast and economic production of functionalized MNPs (without the presence of an intermediate coating) seems to be highly advisable.
The possibility of obtaining the same functionalization of the nanostructures with or without the presence of the intermediate coating is a desirable goal, but a comparison between the two complex nanosystems is fundamental to verify the achieved functionalization and its efficiency.
The purpose of the present paper is, thus, the functionalization of magnetite NPs with two different organo-silane molecules (OSM), namely (3-aminopropyl)triethoxysilane (APTES) and (3-mercaptopropyl)trimethoxysilane (MPTMS). Two different paths were used to achieve the desired functionalization: the first one is a direct reaction between the OSM and the surface of the magnetite nanoparticle (Fe3O4@OSM) and the second one is the use of an intermediate silica coating (using tetraethoxysilane (TEOS) as a reagent) with the silane derivative (Fe3O4@SiO2@OSM). The two paths are shown in the following:
Fe3O4 + OSM → Fe3O4@OSM
Fe3O4 + TEOS → Fe3O4@SiO2 + OSM → Fe3O4@SiO2@OSM
In order to verify the achieved functionalization and its efficiency, the different products have been analyzed by field emission scanning electron microscopy (FE-SEM) equipped with an energy dispersion X-ray spectrometer (EDX), IR spectroscopy, TGA (thermogravimetric analysis) and AC susceptibility measurements, adopting the physical model already proposed for a system of magnetic nanoparticles in suspension [14]. The presence of the primary amine of APTES on the surface of the functionalized NPs was confirmed by UV-VIS spectroscopy analyses using ninhydrin as the revealing agent [15]. The success of the thiol functionalization (MPTMS) was confirmed by the well-known reactivity of the -SH group with respect to Au. In fact Au NPs were successfully conjugated on the surface of Fe3O4@MPTMS and Fe3O4@SiO2@MPTMS, thus leading to a nanocomposite formed by a magnetic core of Fe3O4 surrounded by Au NPs.
We demonstrated here that Fe3O4@OSM particles could be used with an efficiency comparable to Fe3O4@SiO2@OSM ones, for all the applicative uses not requiring a high dispersion in a fluid, thus avoiding a further synthetic step.

2. Results and Discussion

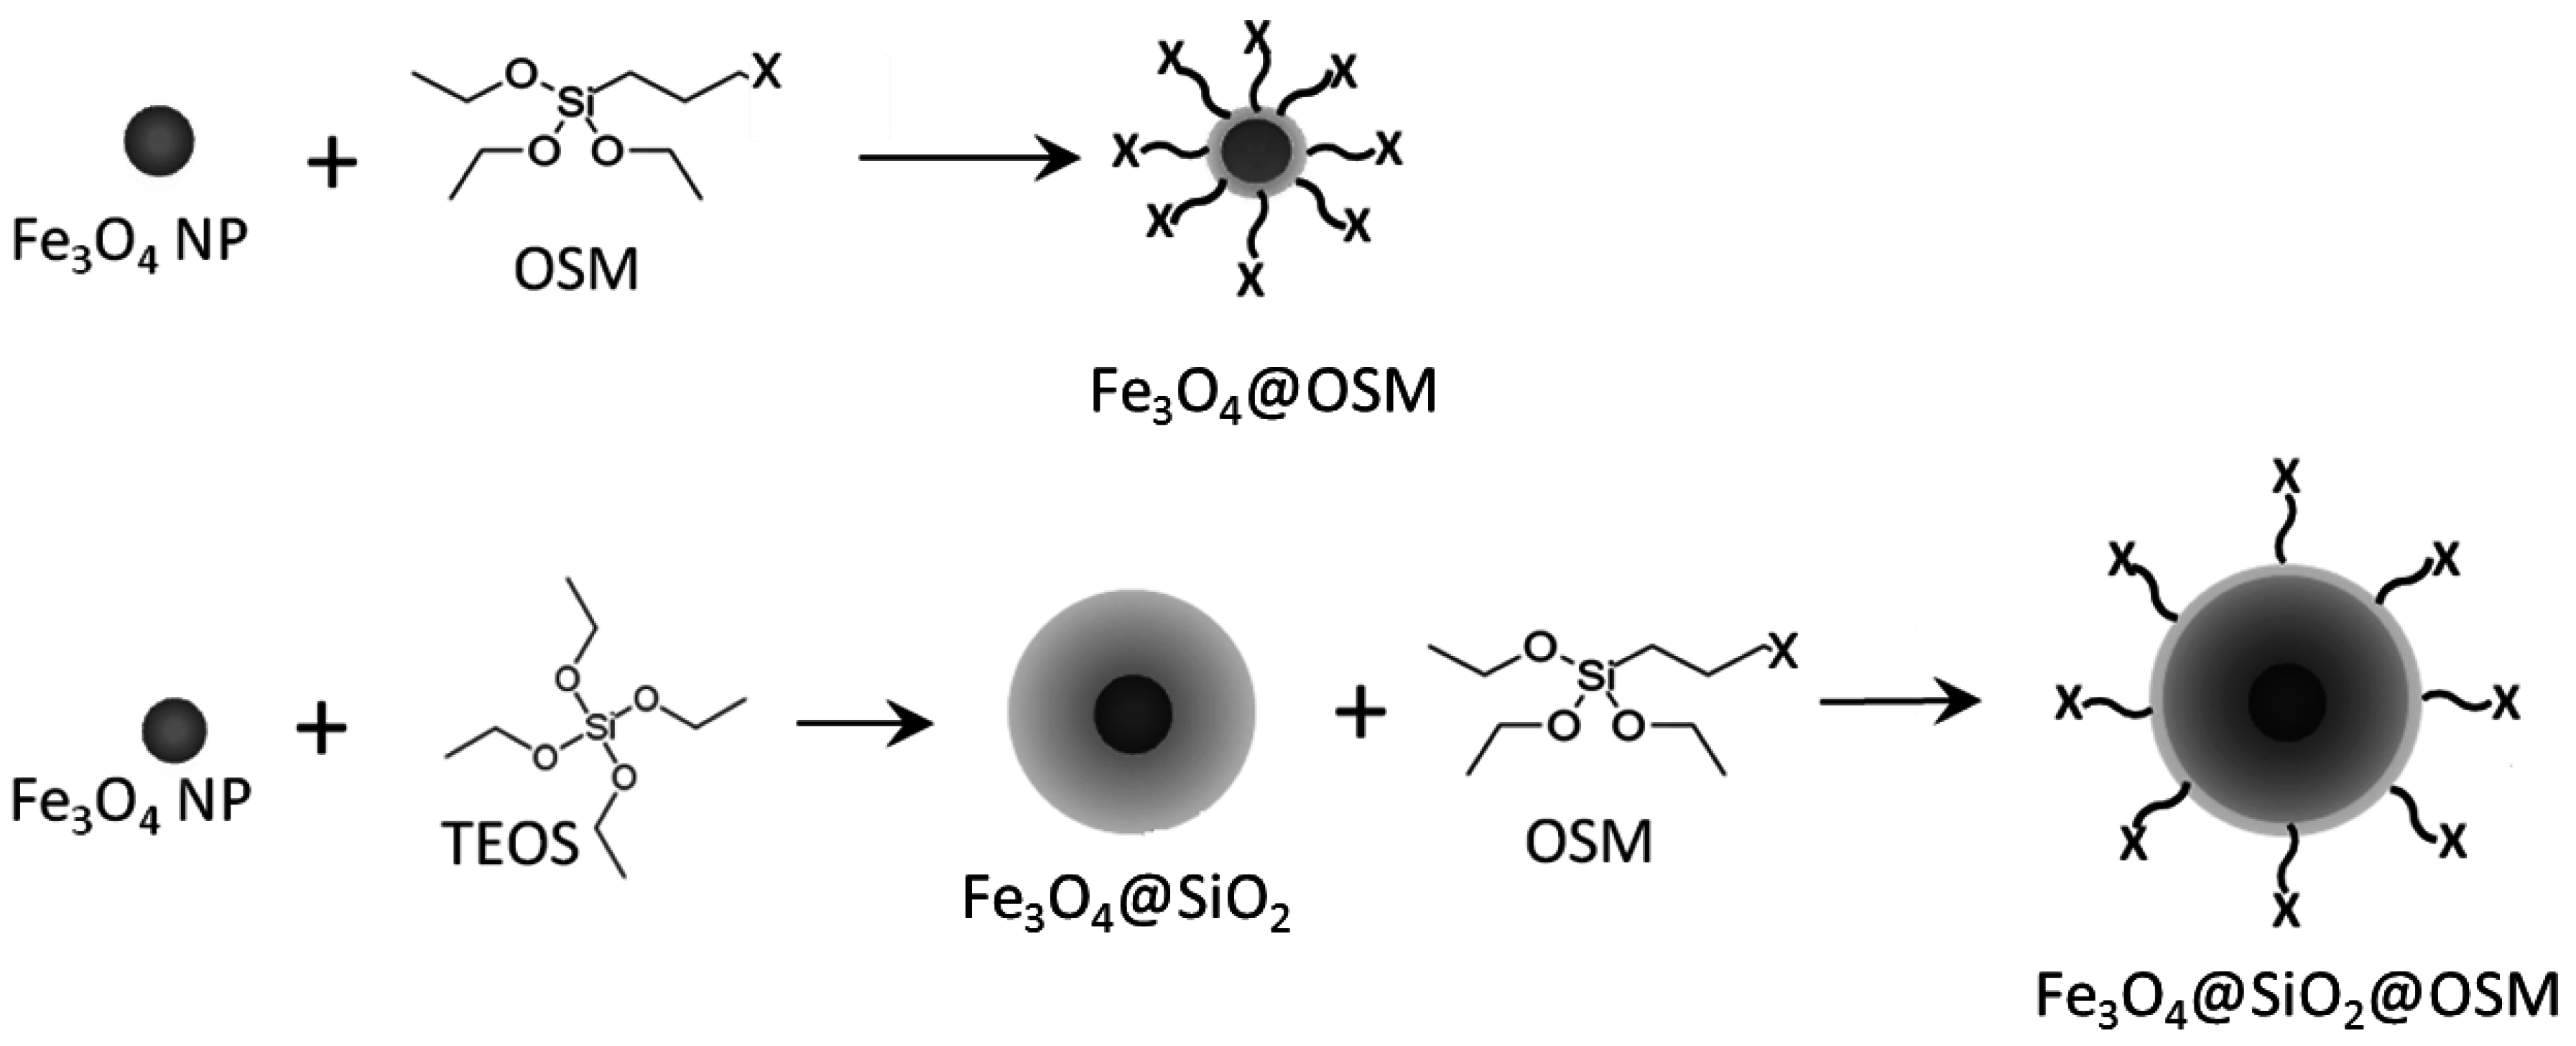
2.1. APTES Functionalization

In this section the results concerning the two different paths used for the APTES functionalization are reported.

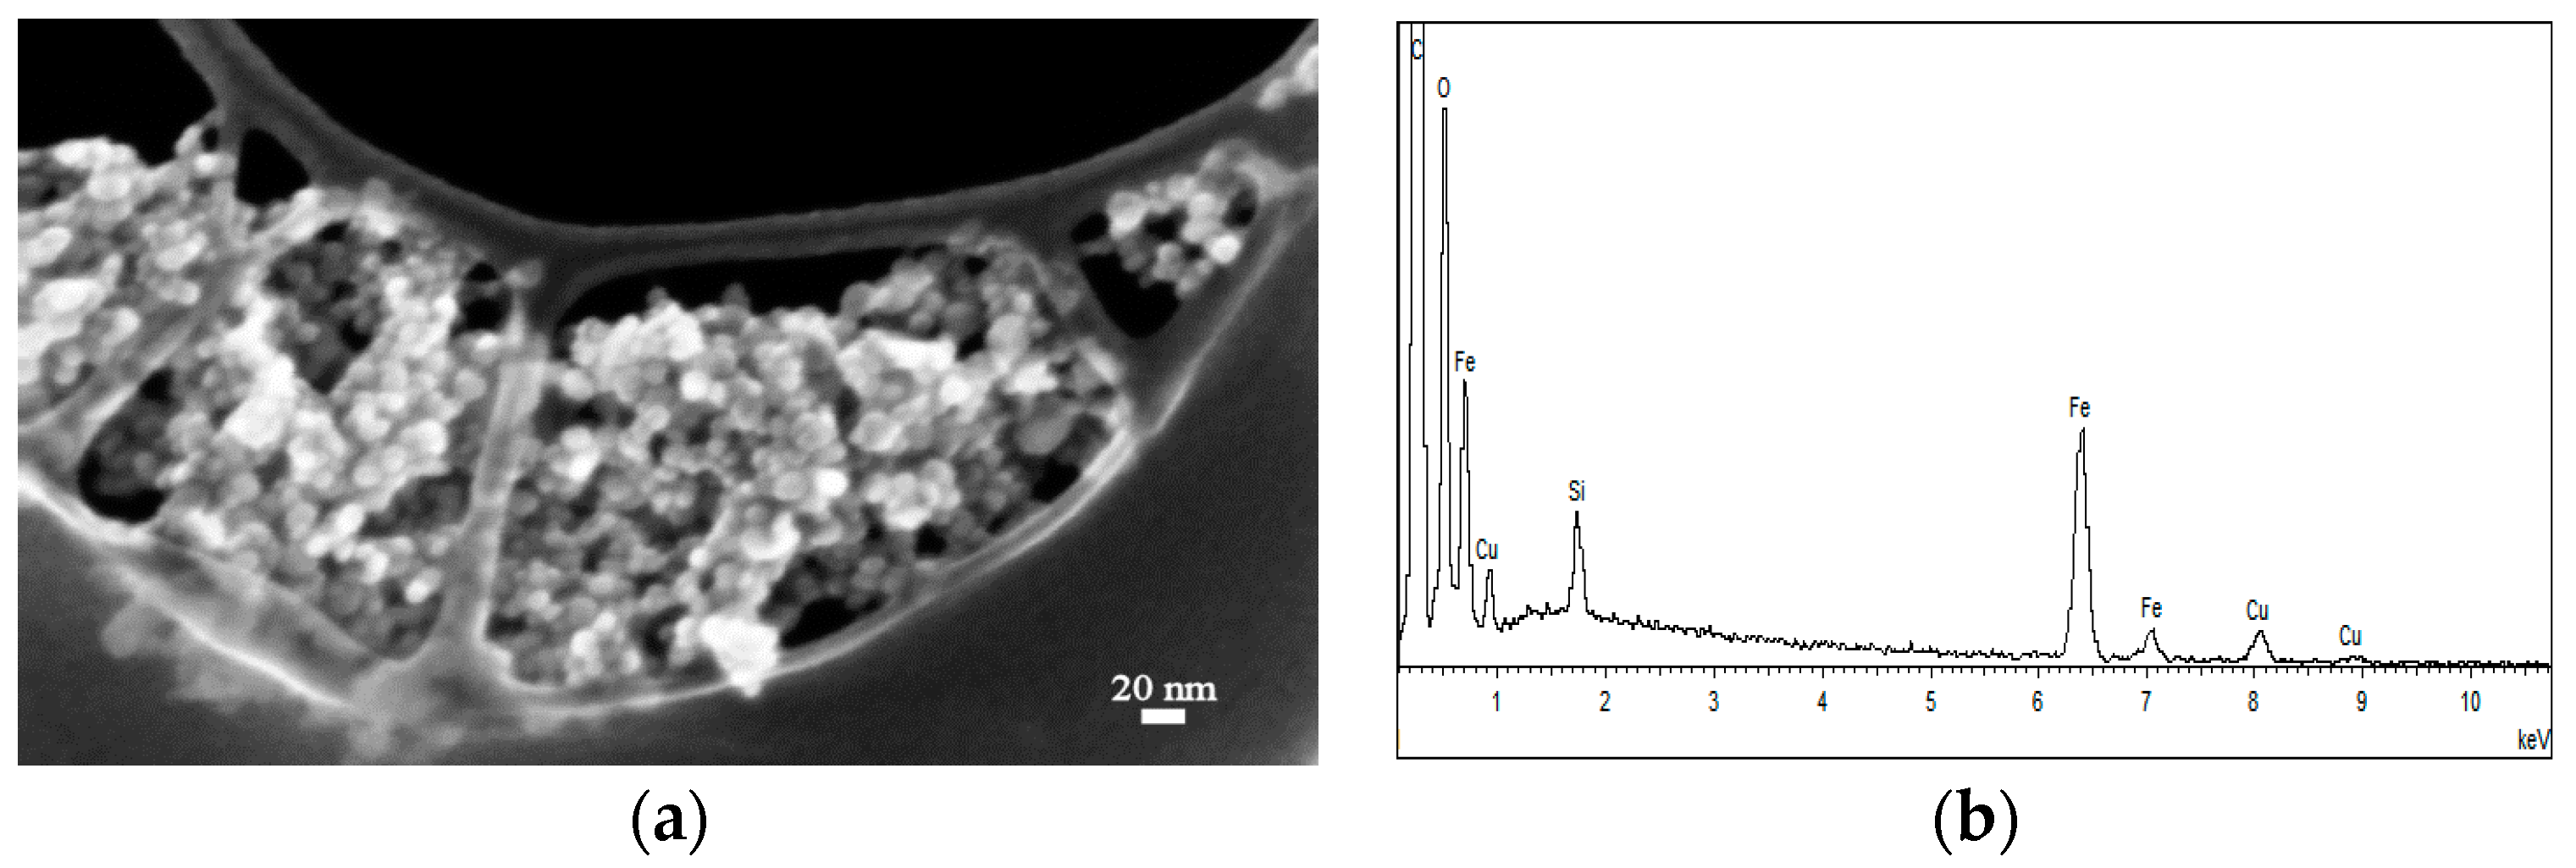
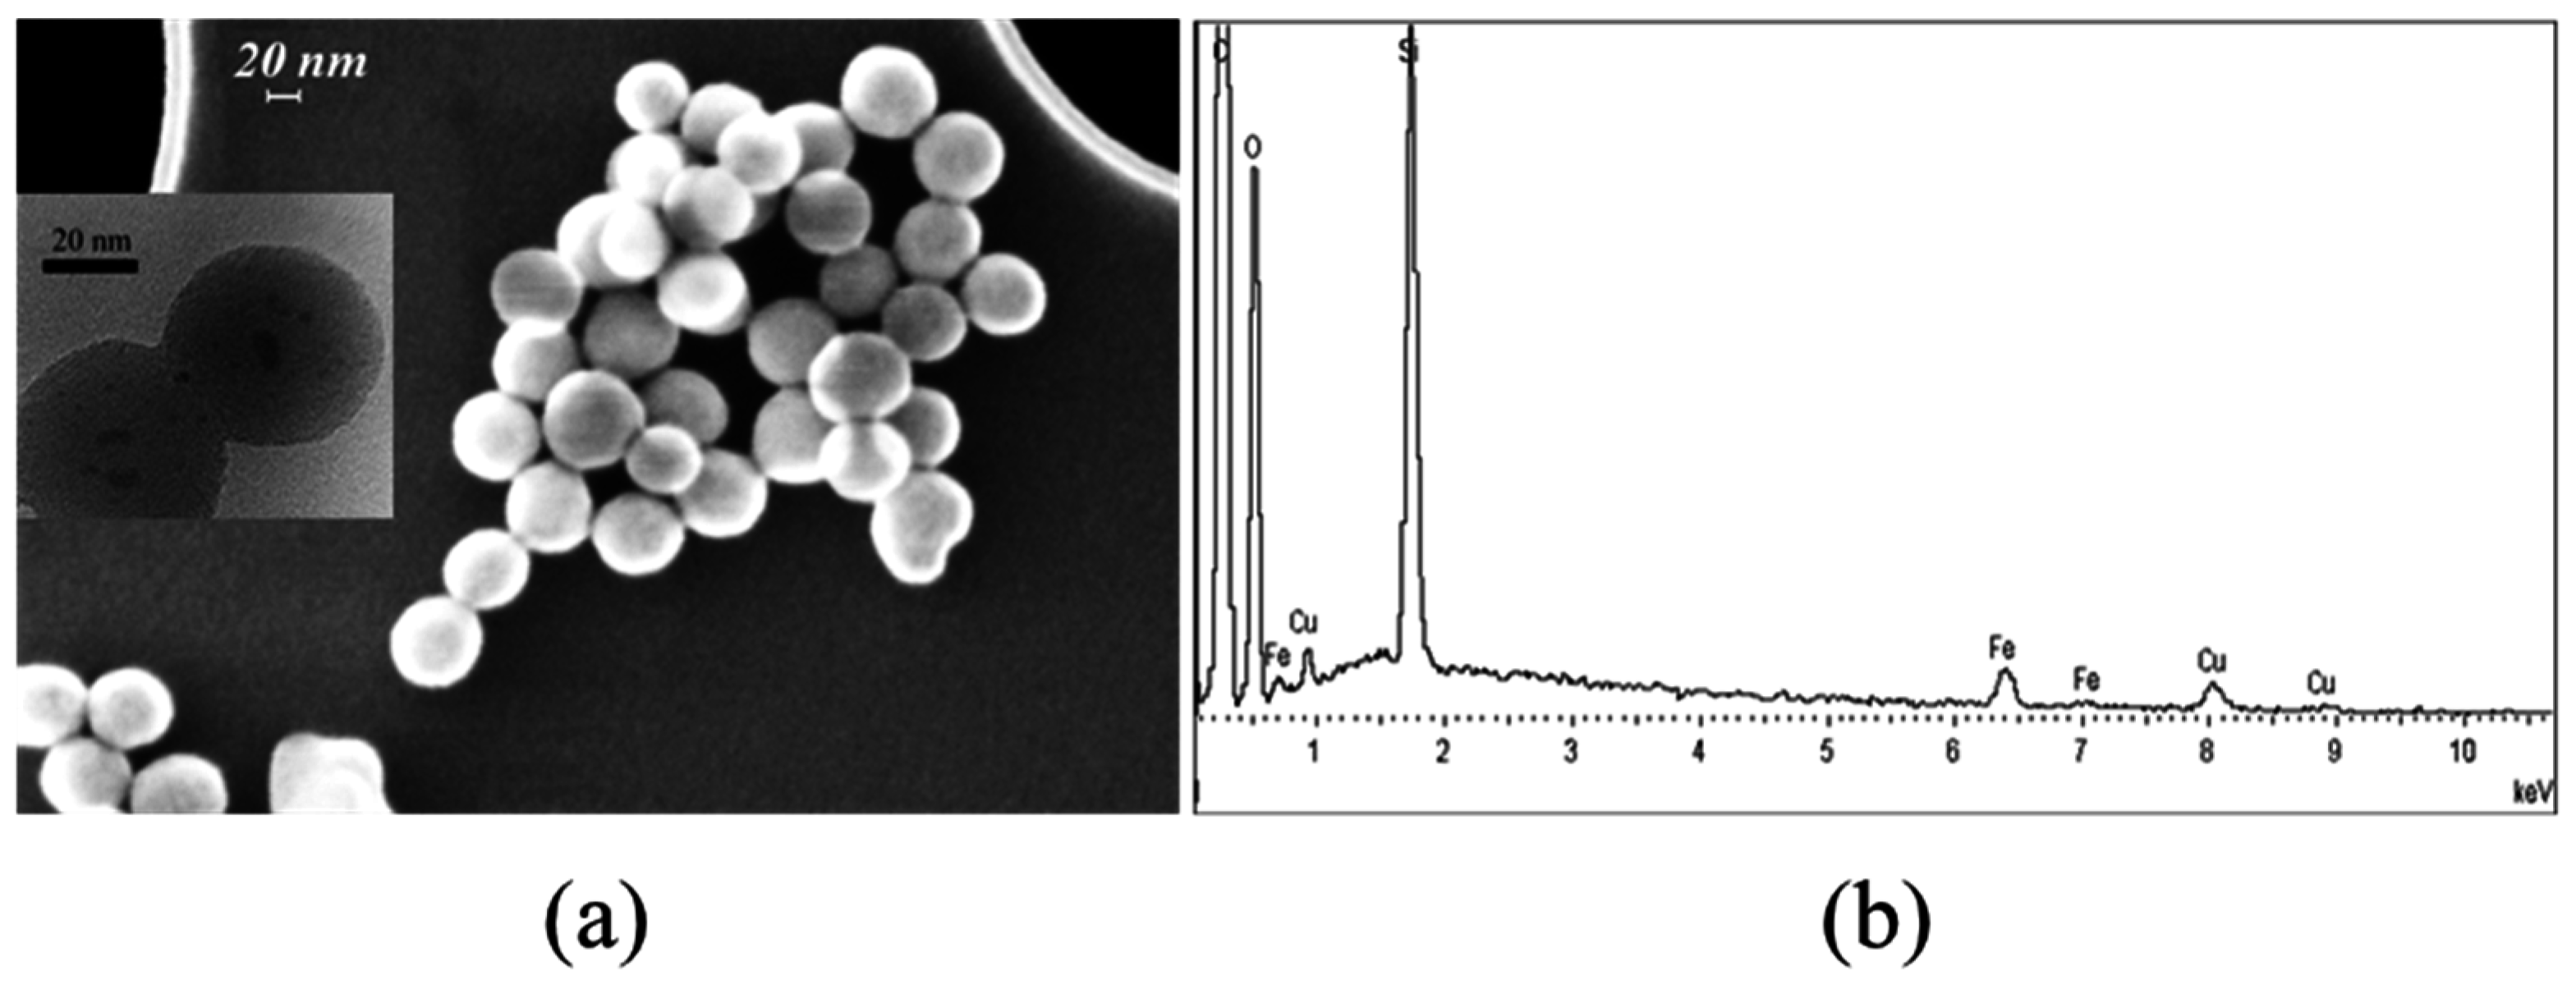
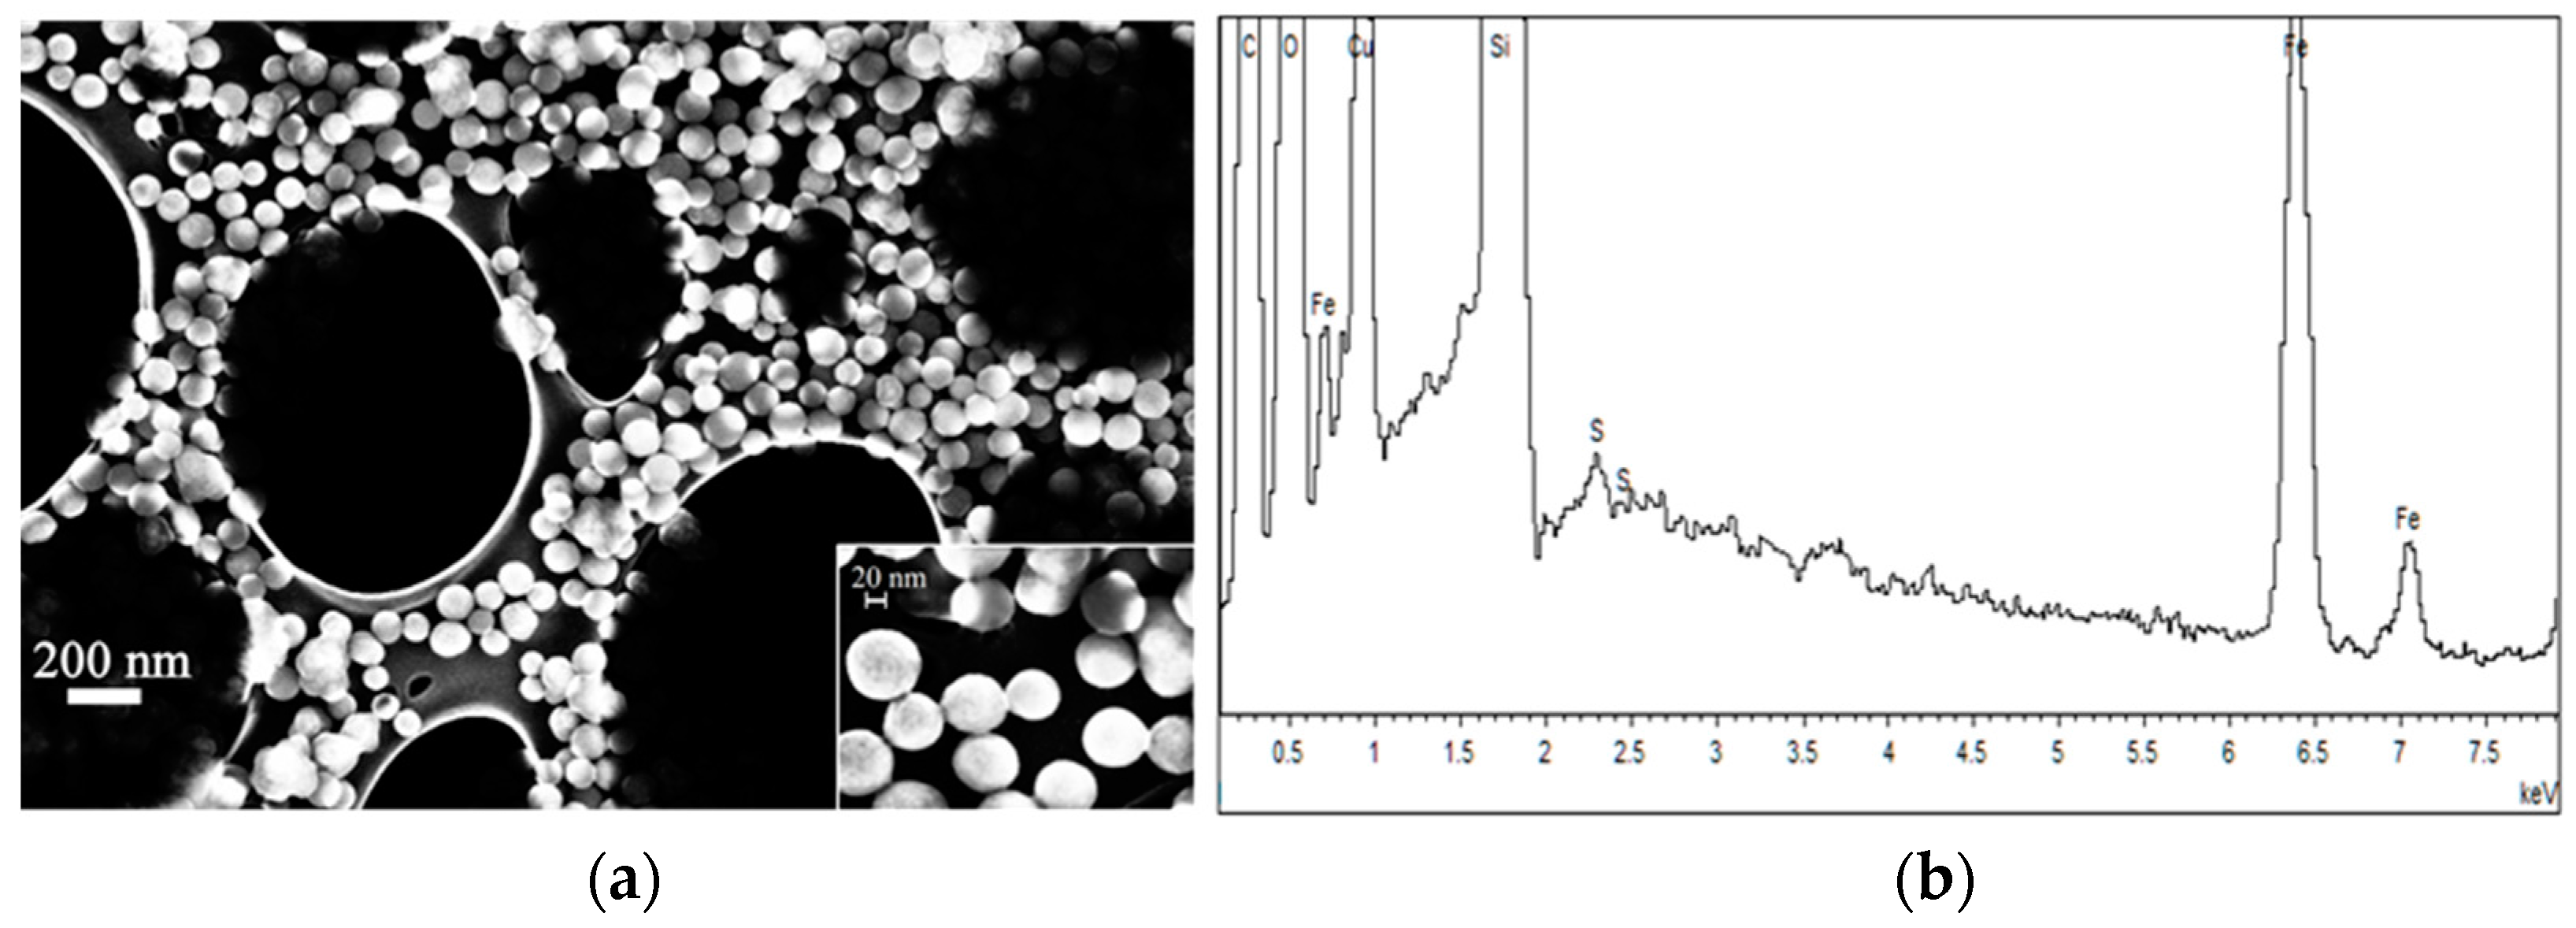
2.1.1. FE-SEM Results

In Figure 1 the FE-SEM image of the Fe3O4@APTES NPs is shown with the corresponding EDX spectrum: the obtained microanalysis evidences the presence of Si related to the APTES functionalization. The Cu peaks come from the copper grids used as support. The image shows NPs organized in large agglomerates due to interparticle interactions. The mean radius measured on fifty nanoparticles belonging to an aggregate is about 7 nm.
In Figure 2 the FE-SEM image of the Fe3O4@SiO2@APTES NPs is presented: it is evident that the better dispersion of these NPs, presenting a regular spherical shape, with dimensions between 40 and 100 nm. In the inset of Figure 2a, a TEM image of the same NPs is presented, showing the dark Fe3O4 NPs surrounded by large silica shells.

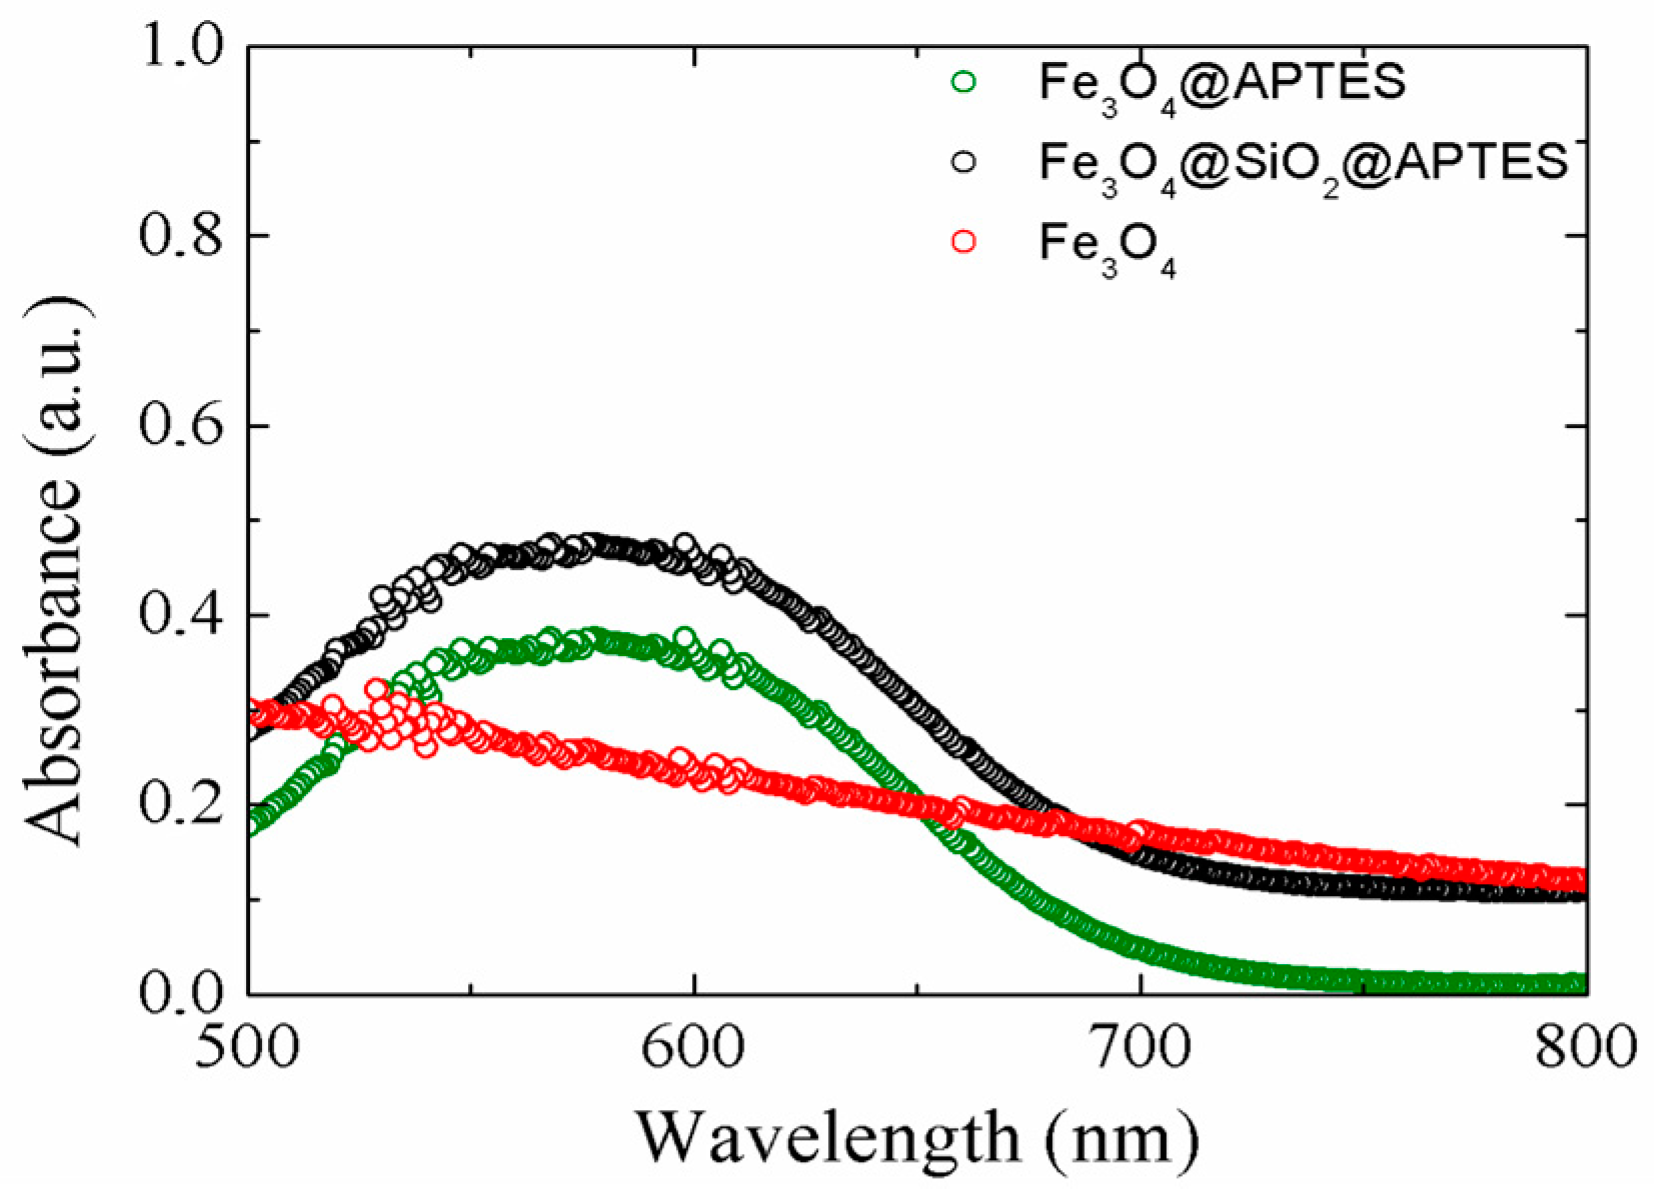
2.1.2. UV-VIS Results

In Figure 3, the UV-VIS spectra of Fe3O4@APTES and Fe3O4@SiO2@APTES treated with a ninhydrin/ethanol solution are presented. In both samples APTES molecules bonded on the surface of the NPs were detected by the appearance of the typical absorbance peak related to the formation of the Ruhemann complex around 560 nm [16], absent in the Fe3O4 alcoholic solution.

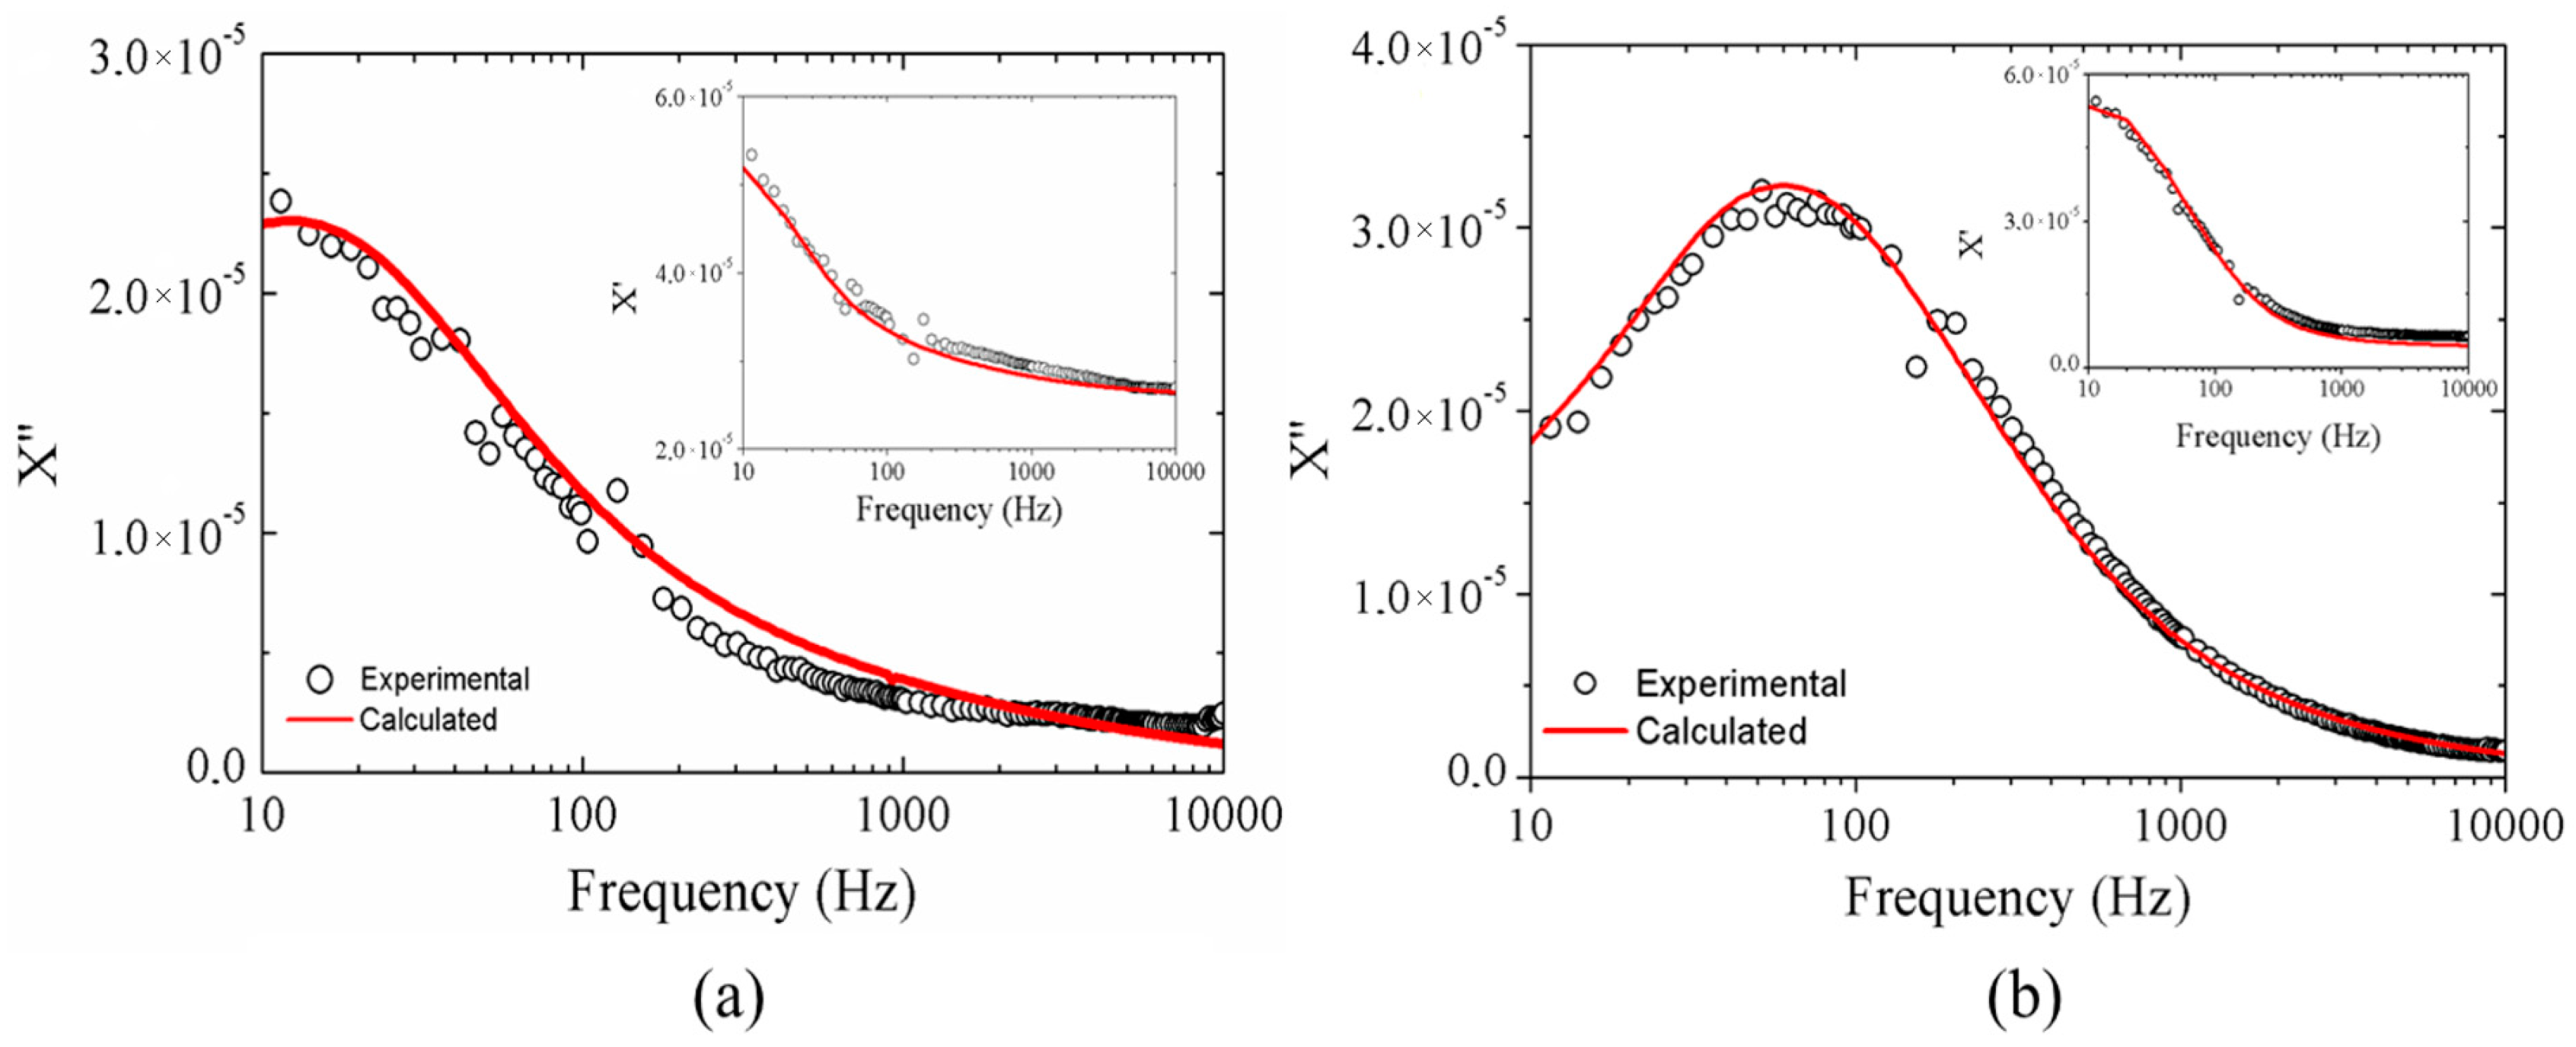
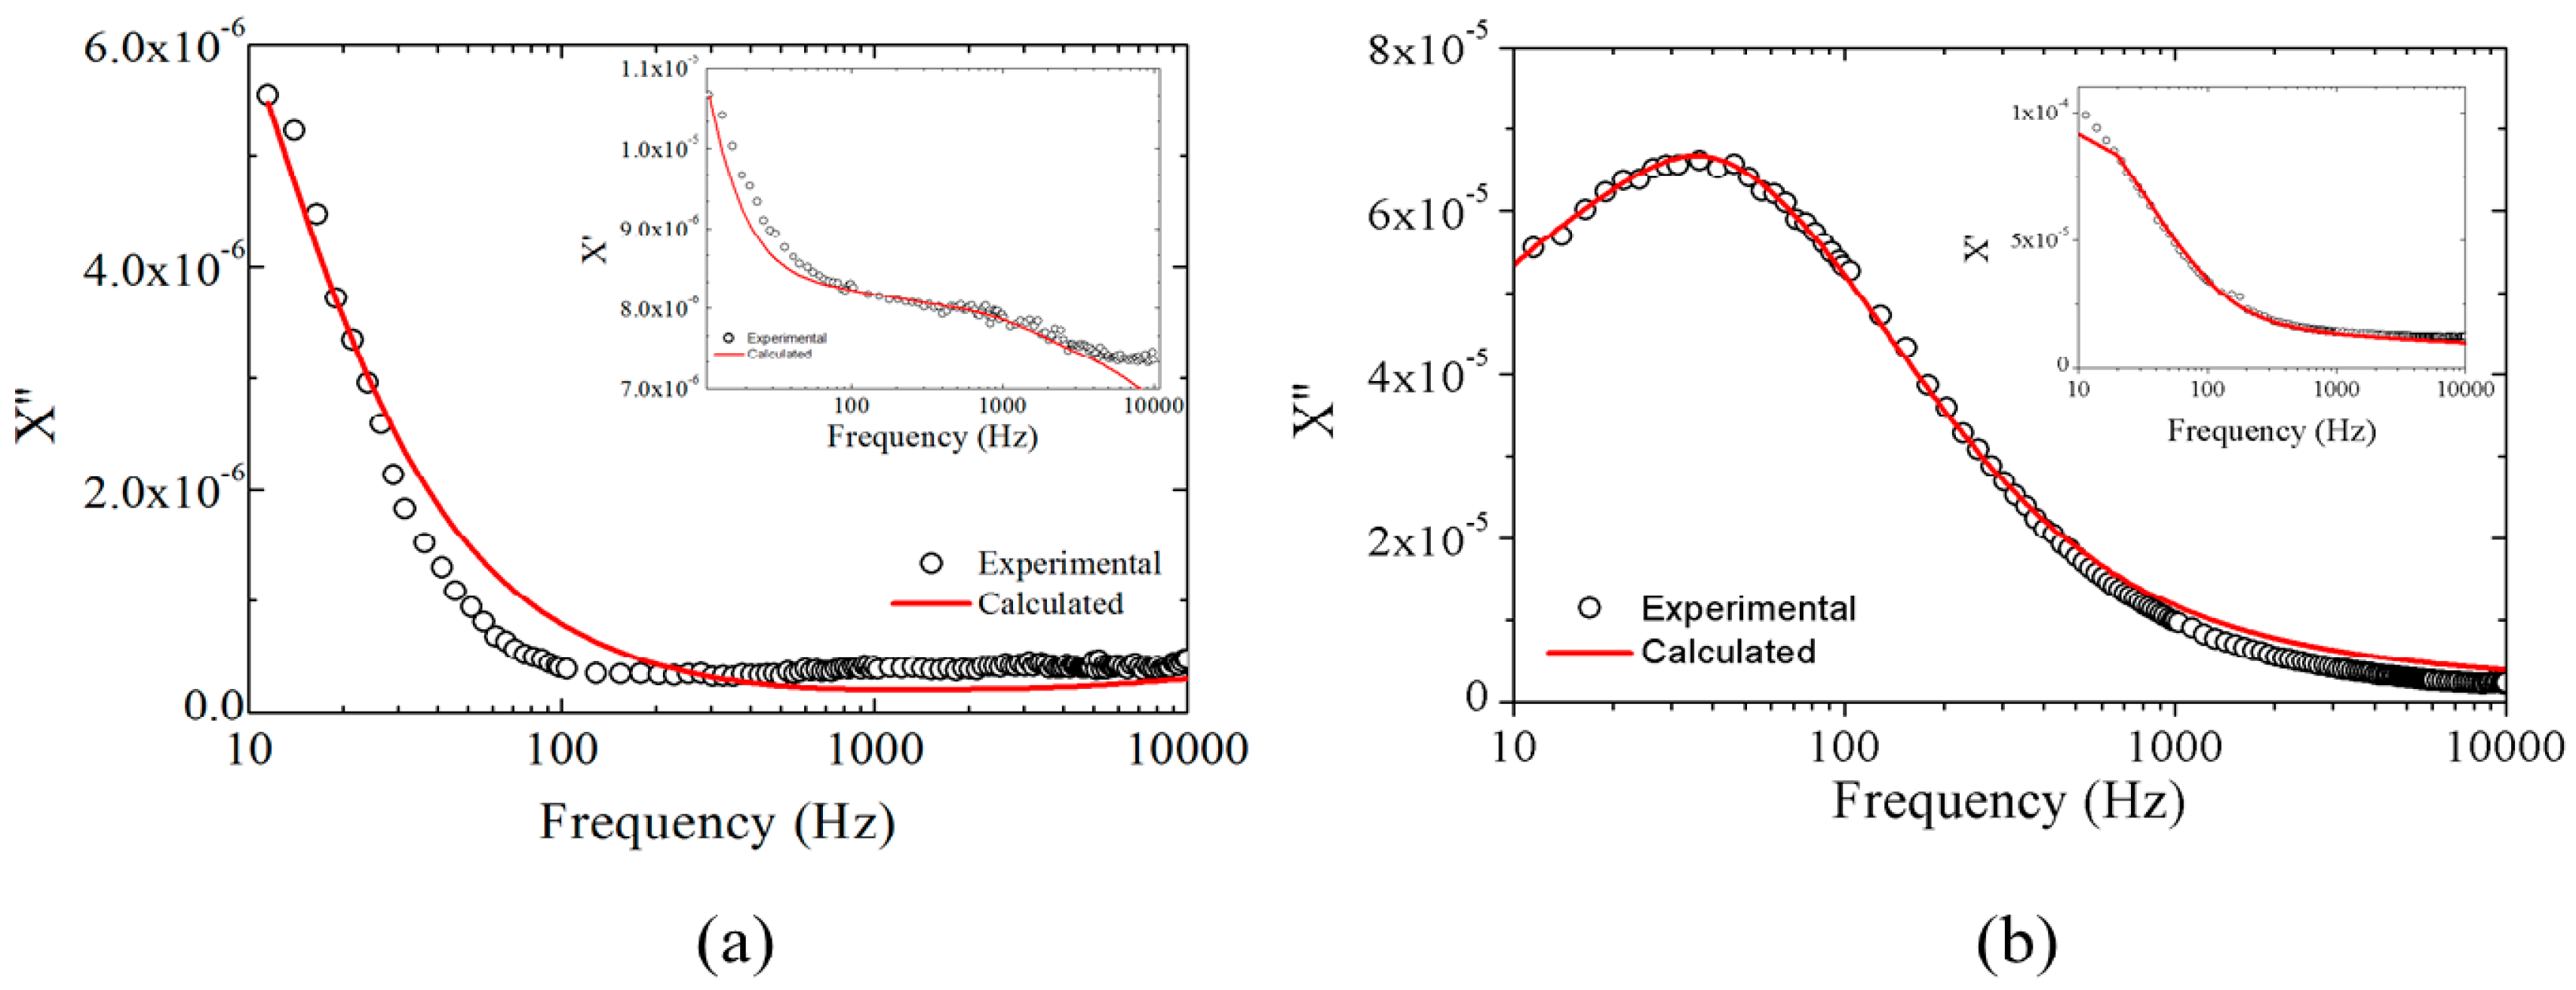
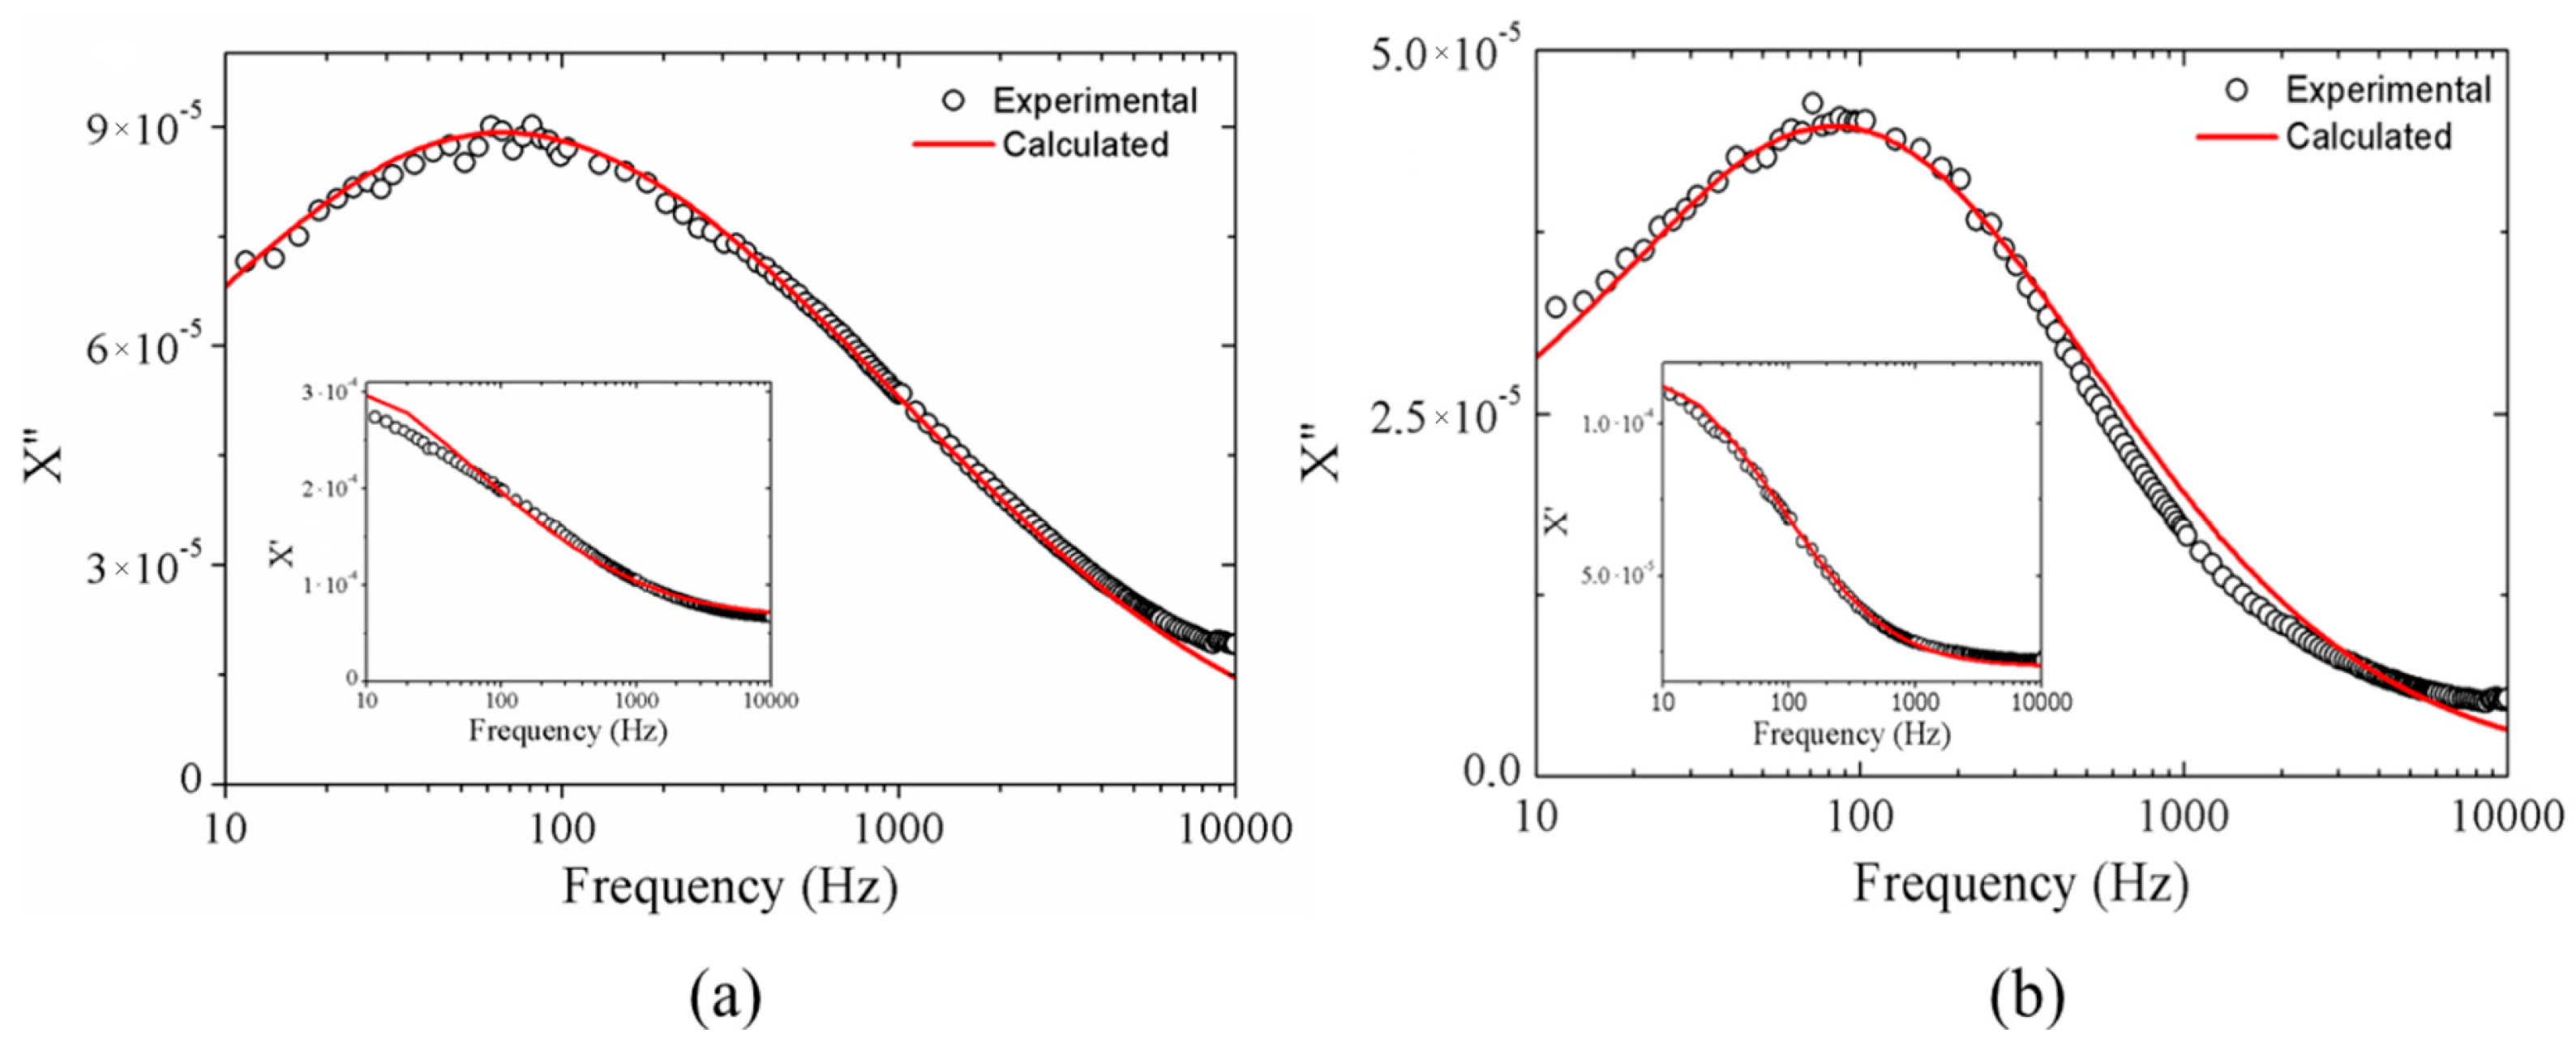
2.1.3. Magnetic Results

Previous SQUID DC magnetic measurements performed on Fe3O4 NPs prepared in our laboratories [17] gave evidence that the adopted protocol results in nanoparticles with diameters between 3 and 7 nm, i.e., well below the superparamagnetic limit of 12.5 nm calculated for magnetite NPs (magnetocrystalline anisotropy constant Ku = 1.9 × 10⁵ J/m3 [18]). The room temperature isothermal magnetization of the bare Fe3O4 NPs displaying the absence of the coercivity, typical of the superparamagnetic regime, is shown in Figure S1 in the Supplementary Information.
Furthermore, we optimized an AC susceptibility model [14], based on the well-known Debye’s model for the electrical susceptibility of polar molecules [19], for magnetic nanoparticles in solution, where both Brownian relaxation (due to the coherent rotation of hydrated NPs in solution with the AC field) and Néel relaxation (due to the rotation of the magnetization vector of the NP with the alternating magnetic field) are taken into account. In our model, the real (χ′) and imaginary (χ″) components of the AC susceptibility as a function of the frequency ν are defined as:
χ ( ν ) = χ + r 1 r 2 ( χ 0 B χ ) P B ( r ) 1 + ( 2 π ν 4 π η k B T r h y d r . 3 ) 2 d r + r 1 r 2 ( χ 0 N χ ) P N ( r ) 1 + ( 2 π ν e x p 4 π K a r c 3 3 k B T ) 2 d r
χ ( ν ) = r 1 r 2 ( χ 0 B χ ) P B ( r ) ( 2 π ν 4 π η k B T r h y d r . 3 ) 1 + ( 2 π ν 4 π η k B T r h y d r . 3 ) 2 d r + r 1 r 2 ( χ 0 N χ ) P N ( r ) ( 2 π ν e x p 4 π K a r c 3 3 k B T ) 1 + ( 2 π ν e x p 4 π K a r c 3 3 k B T ) 2 d r
where χ is the susceptibility at the highest frequency, χ0B and χ0N are the two contributions to the experimental susceptibility at zero frequency, PB(r) and PN(r) are the two log-normal Brownian and Néel size distribution functions, respectively, η is the viscosity of the solvent, T is the absolute temperature, rhydr. is the hydrodynamic radius of the nanoparticle, rc the magnetic radius of the nanoparticle, and Ka is the first order anisotropy constant. The correlation of the model to the experimental data is satisfied if, simultaneously, both components of the complex susceptibility are well fitted.
In Figure 4 the complex susceptibility of a Fe3O4@APTES (a) and of Fe3O4@SiO2@APTES (b) samples are reported. In both plots the symbols represent the experimental data while the continuous red line represents the fit. In Table 1 the fit results for both systems are reported.
The values of the Brownian distribution mean radius for both systems are related to the stronger agglomeration among the magnetic nanoparticles for Fe3O4@APTES NPs with respect to the Fe3O4@SiO2@APTES ones. Moreover, comparing this result with the data from FE-SEM analysis (diameters between 40 and 100 nm) we can conclude that Fe3O4@SiO2@APTES NPs in the solvent are organized in small agglomerates formed by a few particles.
Finally, we want to emphasize here the complete agreement, as expected, between the results of the Néel distribution obtained for both coated and uncoated systems. We demonstrated, in our previous papers that the synthetic protocol used allows magnetite NPs with a mean diameter around 6–8 nm [17] to be obtained. This value is also confirmed by the magnetic analysis on the functionalized structures.

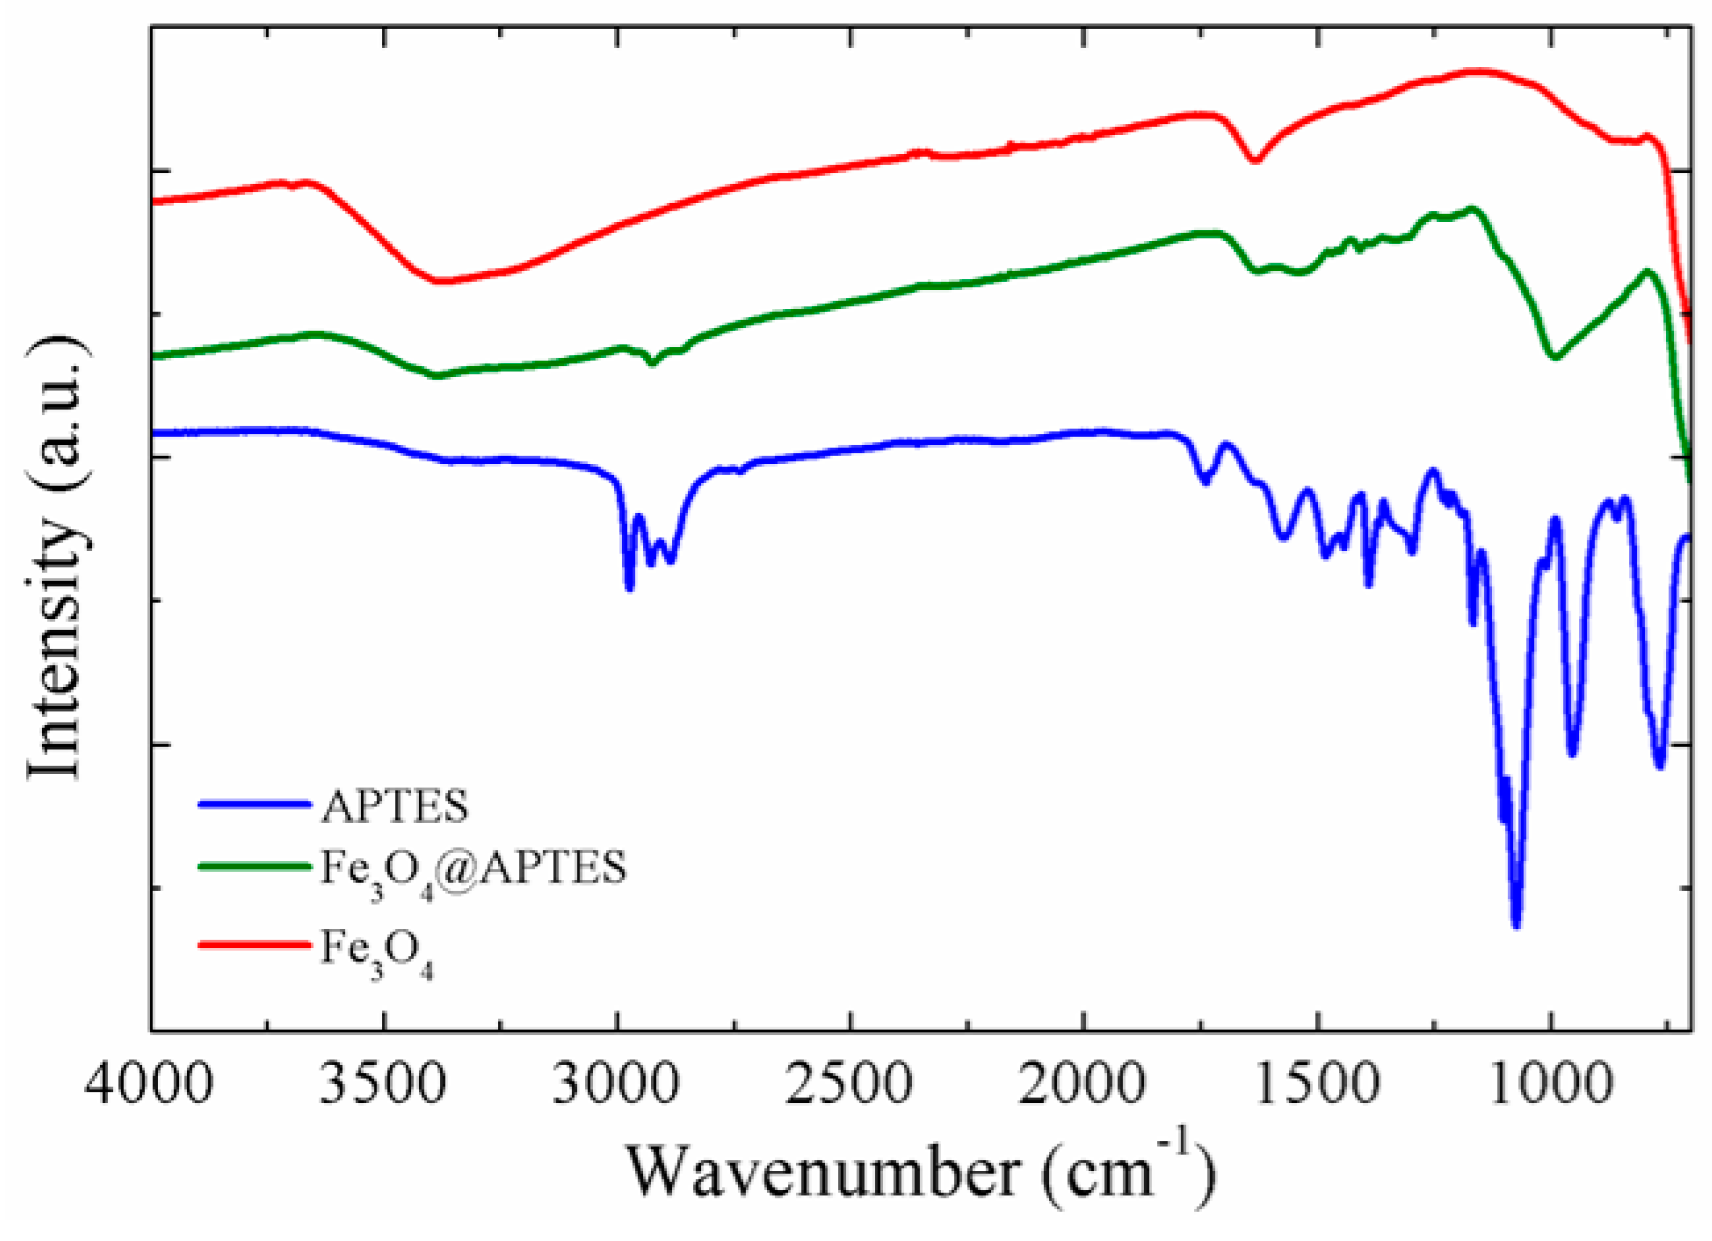
2.1.4. FT-IR Spectroscopy

To further investigate the nature of the final product, the dried powders have been analyzed by FT-IR measurement. Figure 5 reports the spectra collected on Fe3O4@APTES sample compared with bare Fe3O4 NPS and pure APTES.
In the figure the presence of peaks around 3000 cm−1, related to C–H stretching, can be clearly observed for the functionalized sample (green curve). The broad peak in the spectrum of bare Fe3O4 NPs at about 3400 cm−1 is due to O–H stretching. Furthermore, the functionalization causes the appearance of additional barely resolvable peaks in the fingerprint region. The strong peaks near 1100 and 800 cm−1 are due to Si–O–Si and Si–O stretching vibrations, respectively, which confirm the condensation between hydroxyl groups on the magnetite NPs’ surface and the alkoxysilane molecule. Thus, FT-IR measurements confirm the functionalization with organic moieties for the directly-functionalized particle.
Infrared analysis has also been performed for the silica coated samples; nevertheless, in this second case, the presence of silica did not allow to detect any other functional group.

2.1.5. Thermogravimetric Analyses

In Figure S2 the TGA analysis of sample Fe3O4@SiO2@APTES is reported. Two different weight losses are identifiable. The first one, from low temperature up to 200 °C, is due to the release of the solvent absorbed onto the nanoparticle’s surface. This phenomenon is well known; in fact, as reported in the literature, small molecules, like water and ethanol, can be easily entrapped in porous matrices [20]. The second one started immediately after the aforementioned loss, and it is marked by a continuous decrease of sample weight until about 950 °C. In this range the organic ligand decomposes. The real degradation mechanism is not a trivial problem; moreover, literature data are very poor and not exhaustive [21]. The most reasonable hypothesis supposes the Si–C bond breaking, with the release of the organic chain, while the silane part of the ligand is still linked to the particle’s surface. The total weight loss amounts to 8.2%. For the magnetite sample Fe3O4@APTES (Figure S3), the decomposition of the organic ligand seems to follow a different mechanism characterized by a first decomposition step between 200 °C and 500 °C, and a second one in the 500–800 °C range. For this latter sample the total weight loss is about 7.8%.

2.2. MPTMS Functionalization

This section presents the results related to the thiol functionalization.

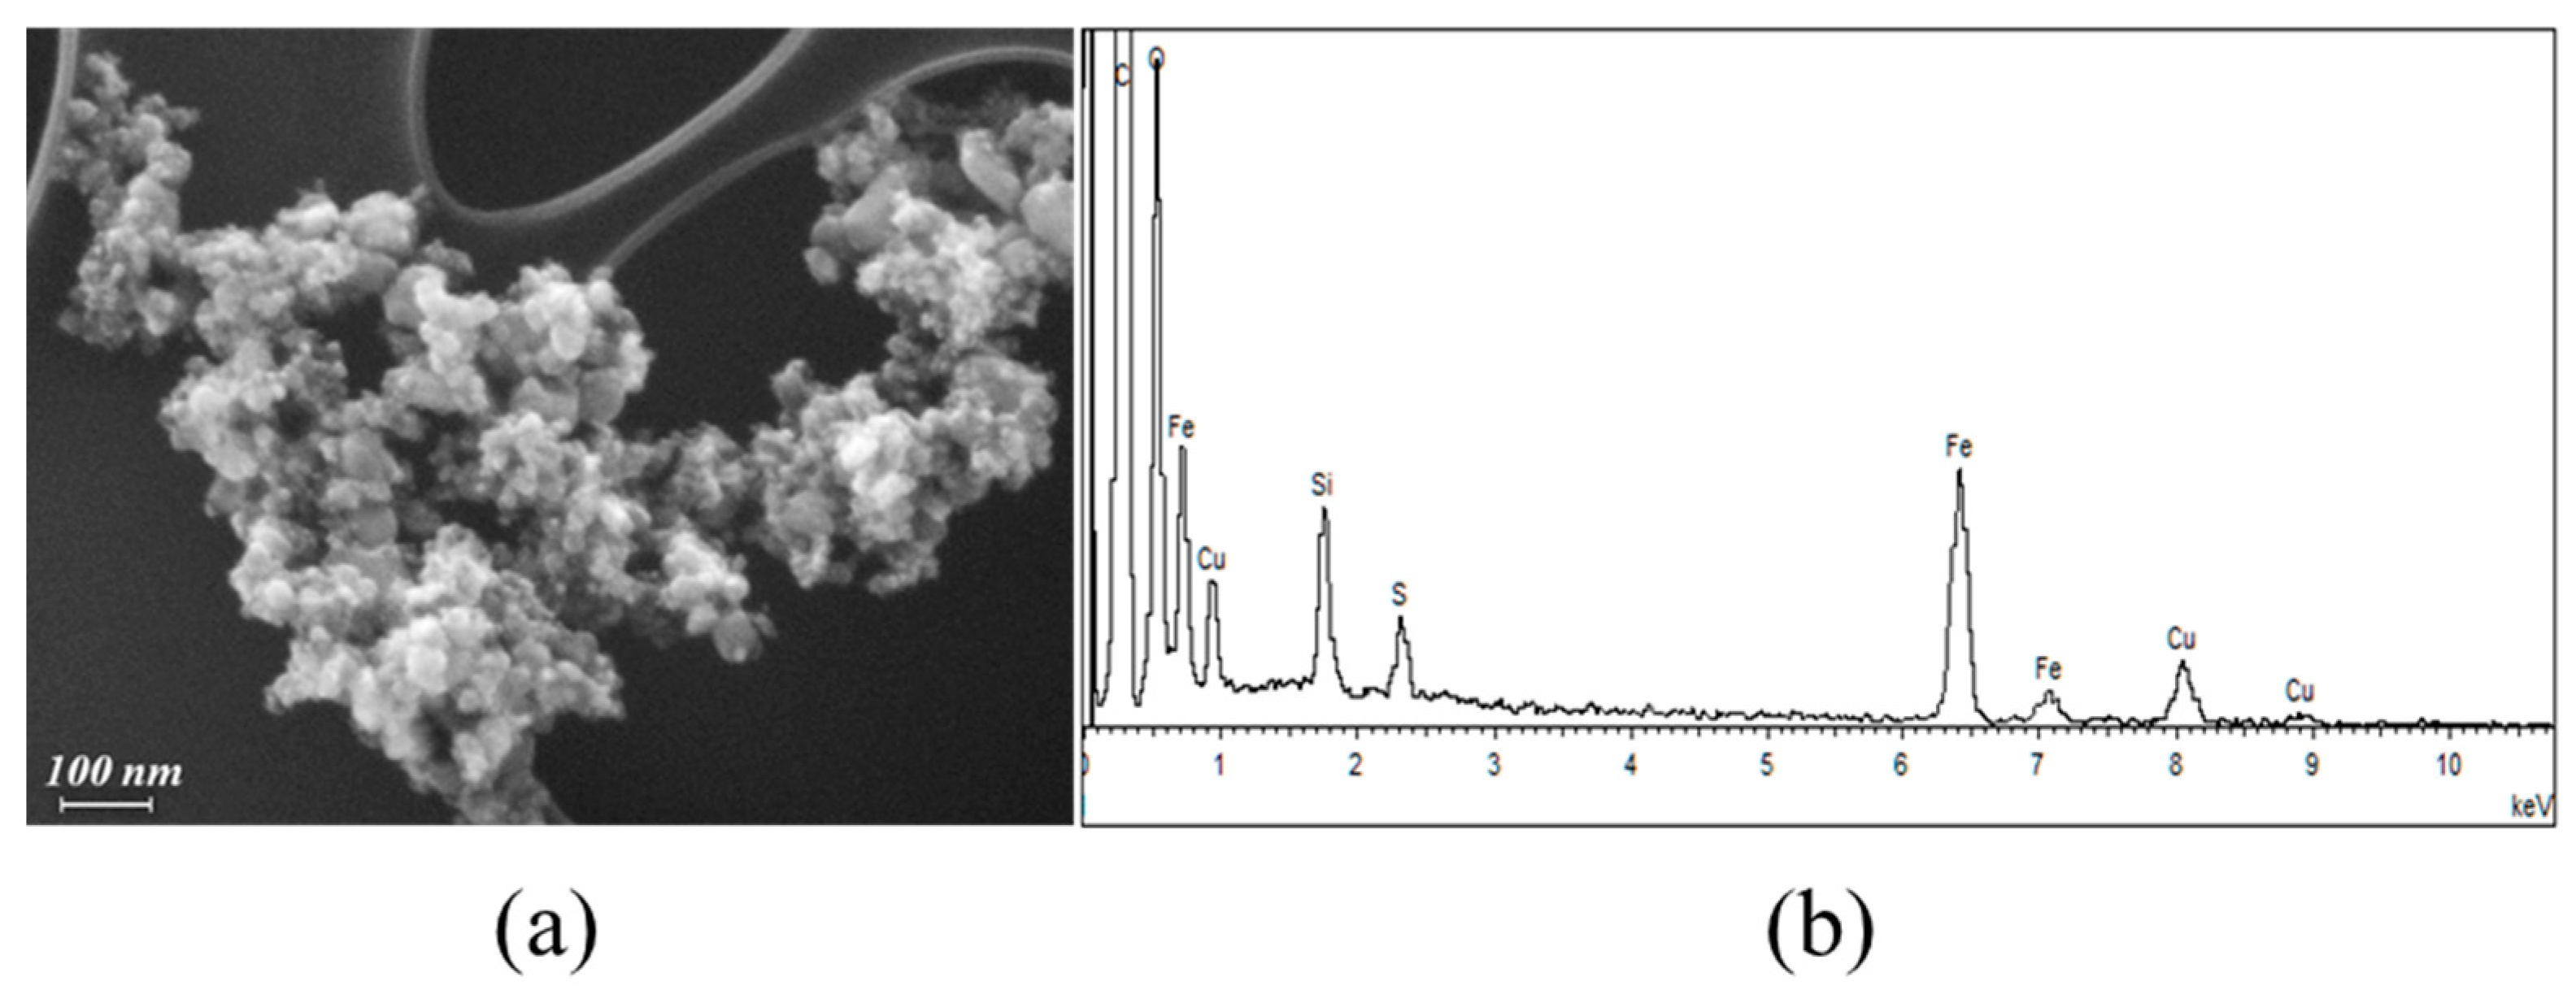
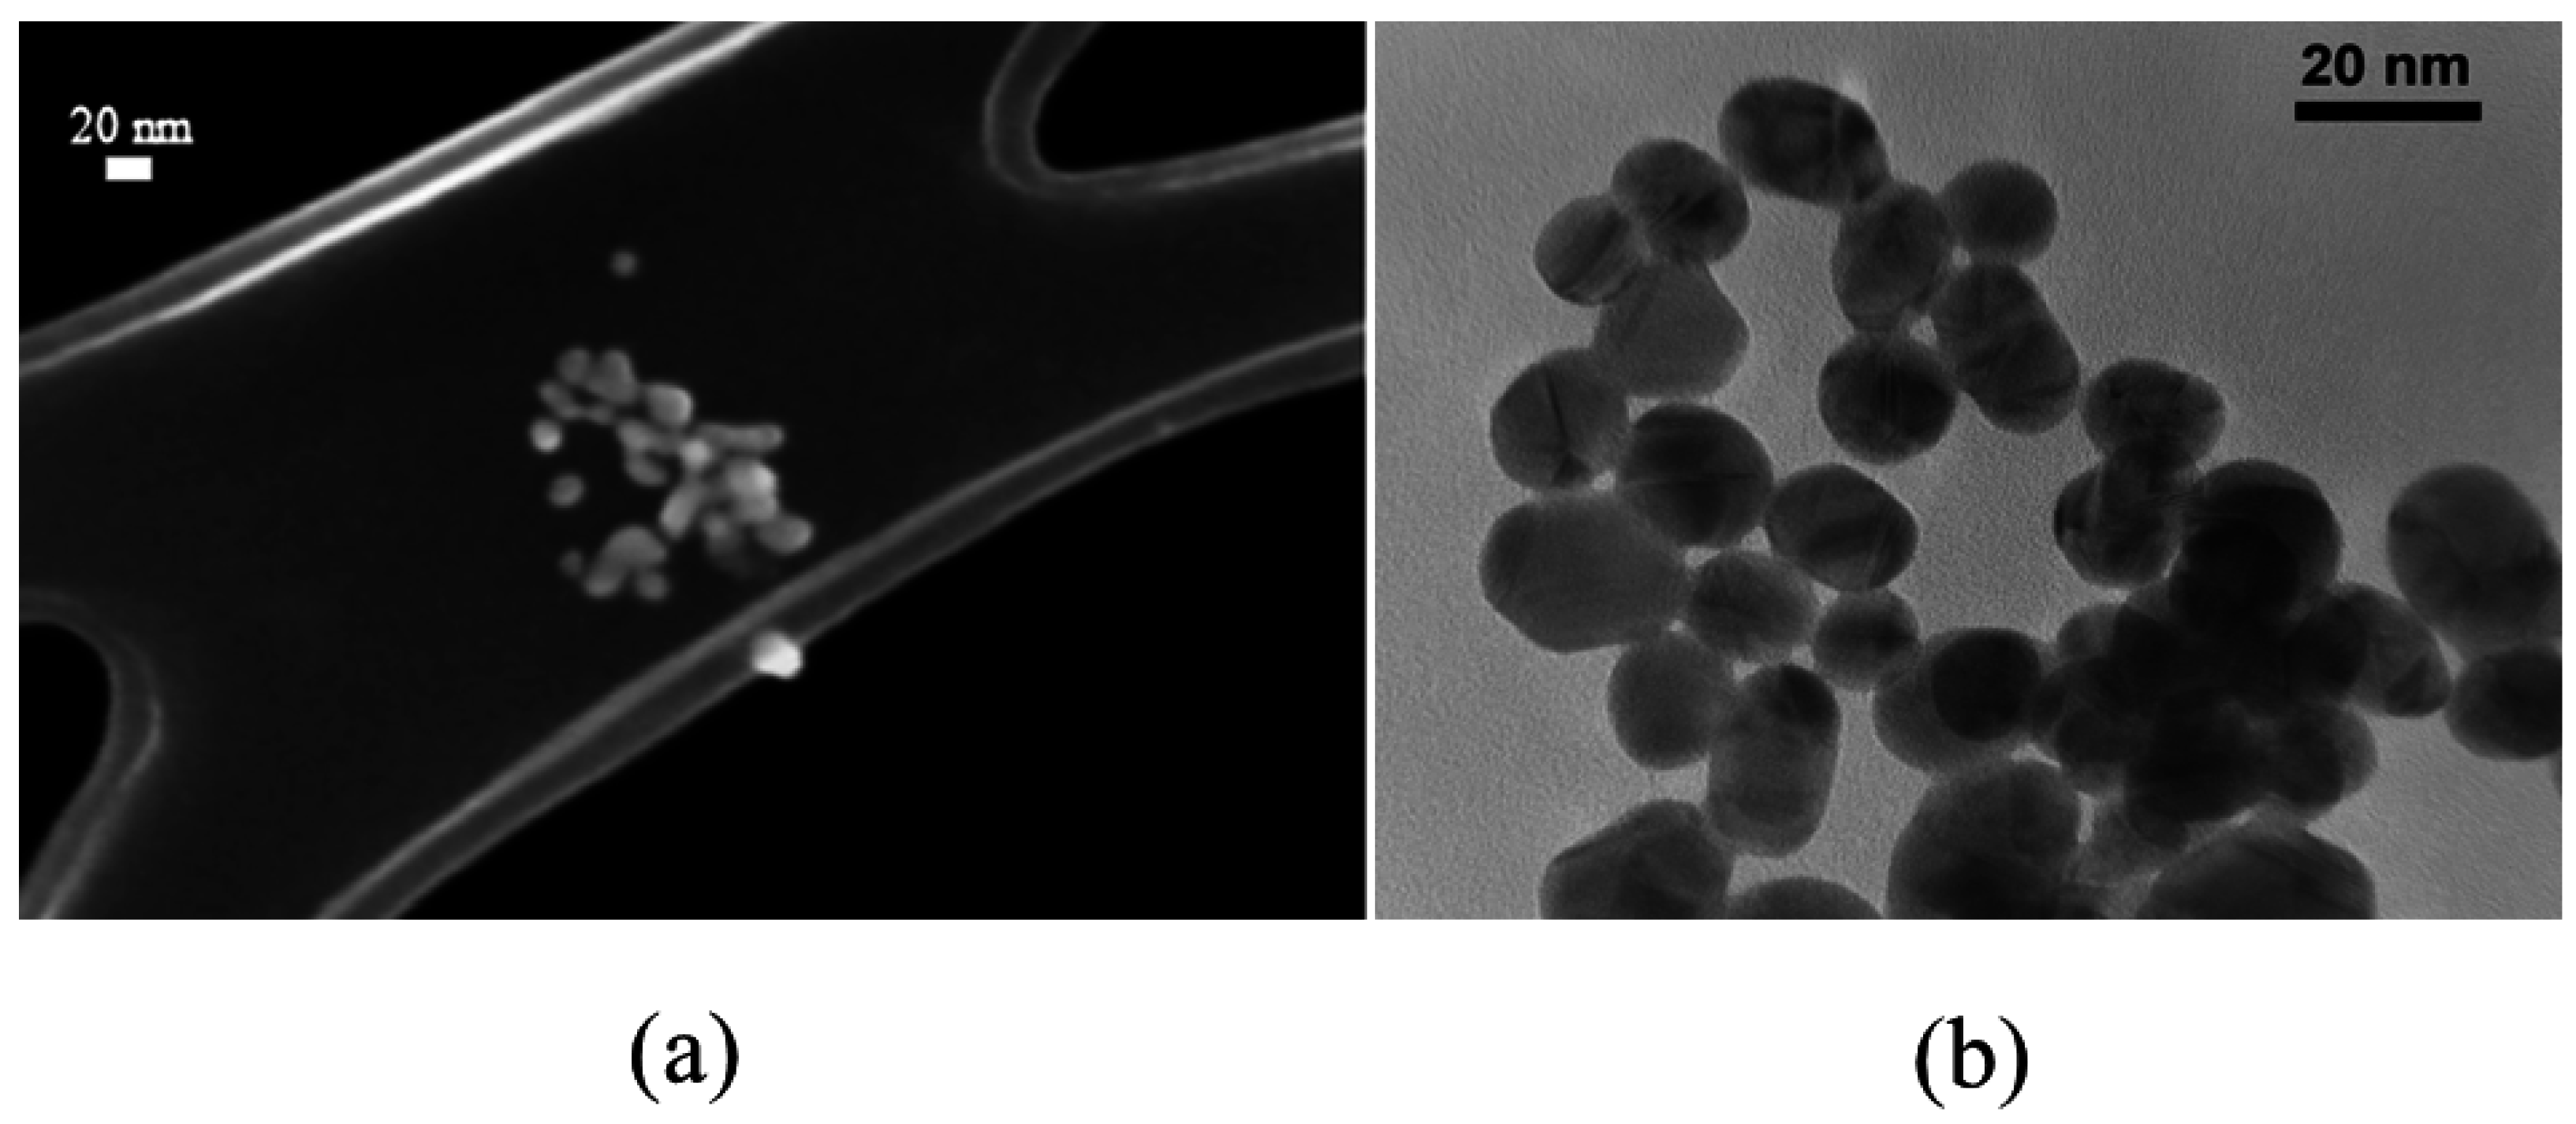
2.2.1. FE-SEM Results

In Figure 6a FE-SEM image of the magnetite NPs coated by the thiol derivative of the OSM, together with the EDX analysis, is shown. Additionally, in this case, the lack of a thick coating promotes magnetic dipole interactions, giving rise to large agglomerates. The presence of the thiol is confirmed by the EDX spectrum, where two small peaks related to the presence of sulphur can be observed. Furthermore, in this case, the mean radius measured on fifty NPs belonging to an aggregate is about 7 nm.
In Figure 7 an FE-SEM image related to the functionalized Fe3O4@SiO2@MPTMS NPs and its EDX analysis are presented. Here, the nanoparticles are well-defined and separated, with dimensions ranging from 50–110 nm. The EDX analysis displays, together with the peaks of Fe, Si, and O, two very small peaks related to sulphur, confirming again the functionalization with MPTMS.

2.2.2. Magnetic Results

Figure 8 presents the AC susceptibility and the fit of Fe3O4@MPTMS (a) and Fe3O4@SiO2@MPTMS (b). The results of the fit are reported in Table 2.
Again, the values of the mean Brownian radius for both types of functionalized nanoparticles are related to very different morphologies: in Fe3O4@MPTMS we observe agglomerates due to strong magnetic dipole interactions, while the large silica shell is the major responsible of the Brownian mean radius of Fe3O4@SiO2@MPTMS. The magnetic results confirm, also in this case, that Fe3O4@SiO2@MPTMS particles are organized in small agglomerates formed by few particles in the solvent.
The contributions of the Néel distribution for both of the systems of MPTMS functionalized nanoparticles are comparable and in complete agreement with the information arising from the NPs functionalized with APTES, and with our already-presented results.

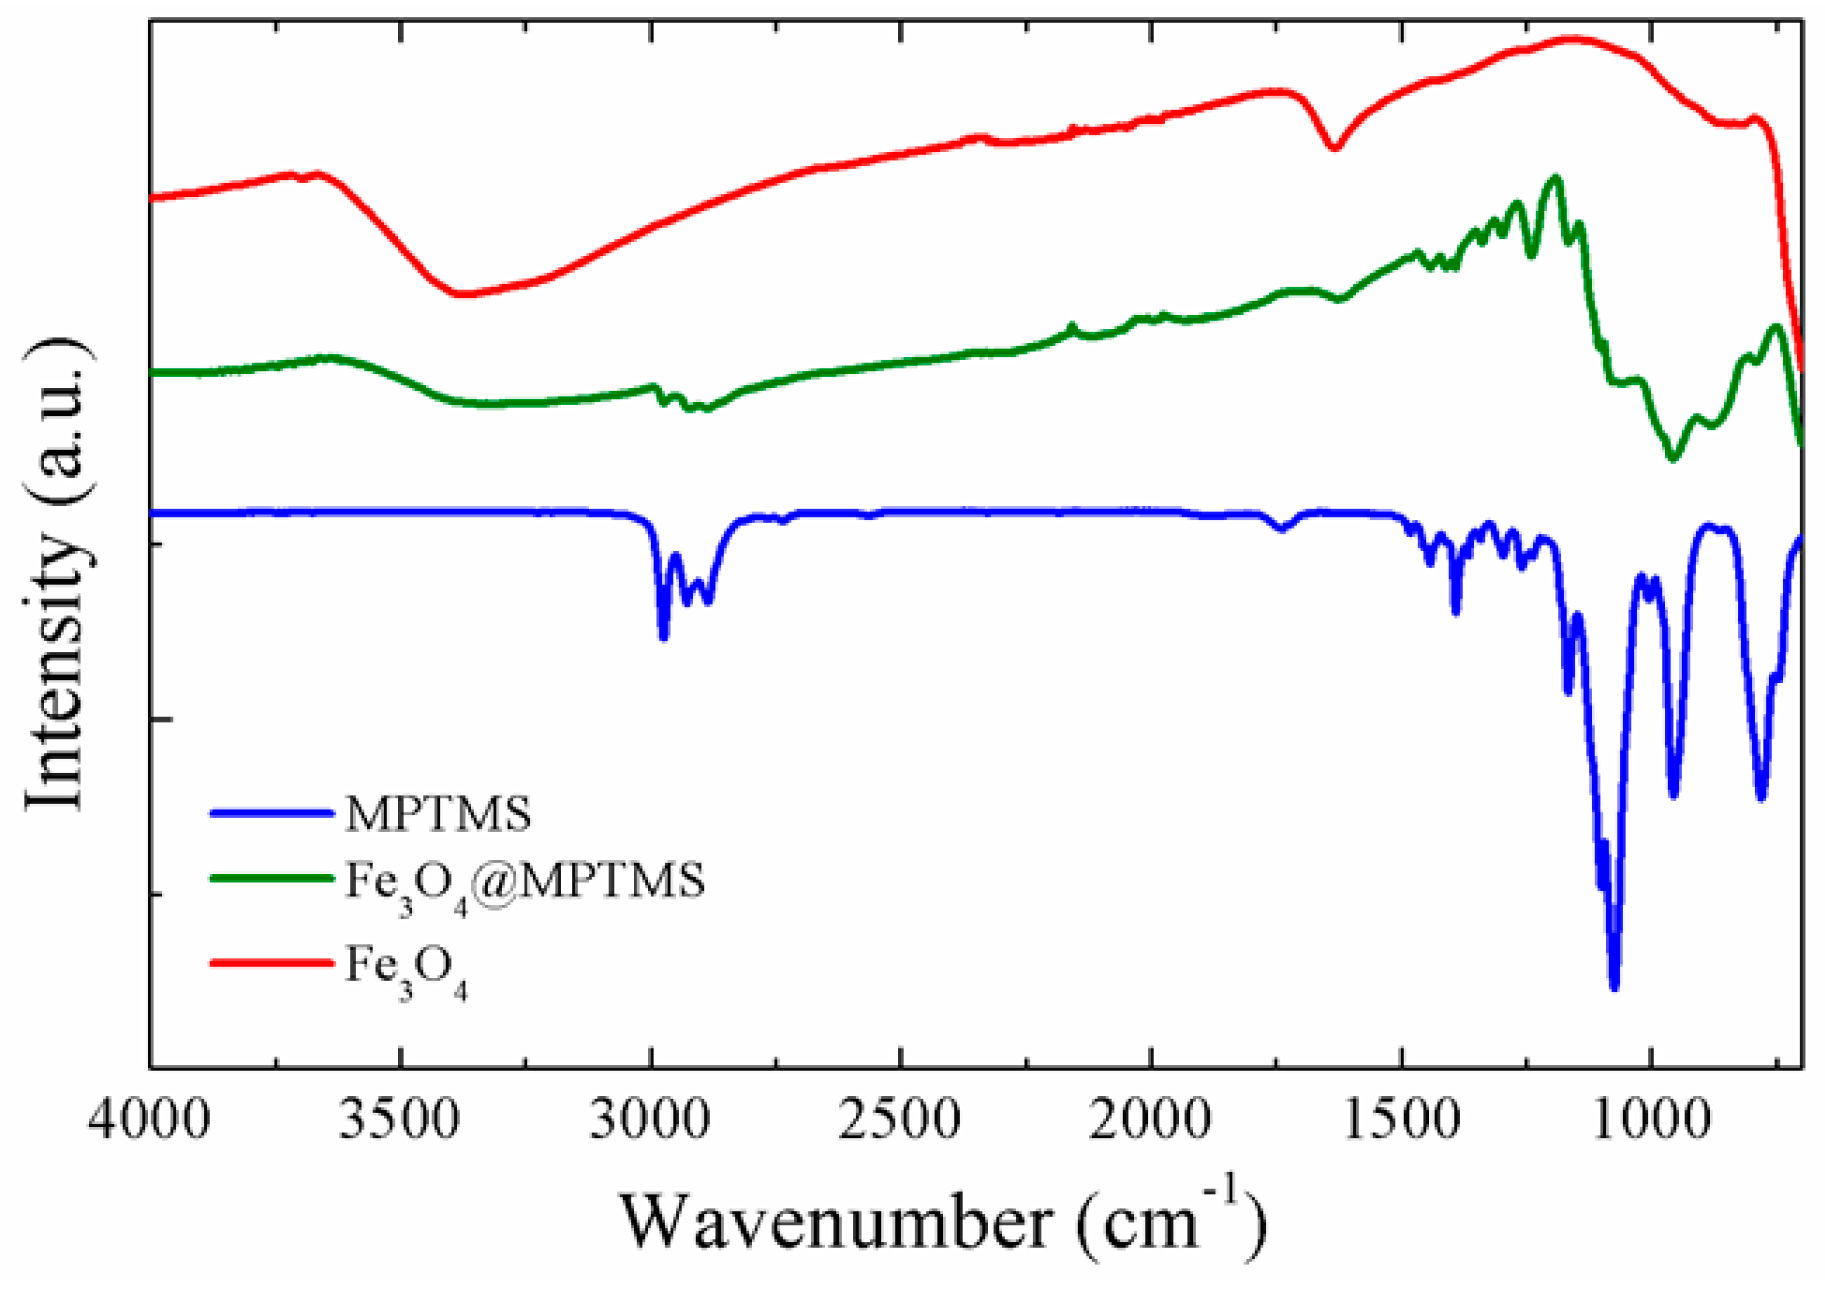
2.2.3. FT-IR Spectroscopy

To further investigate the nature of the final product, the dried powders have been analyzed by FT-IR measurements. Figure 9 reports the spectra collected on a Fe3O4@MPTMS sample compared with bare Fe3O4 NPS and pure MPTMS.
The spectra of both functionalized samples with APTES or MPTMS are very similar. In fact, in the Fe3O4@MPTMS spectrum (green curve), the peaks around 3000 cm−1, also related to C–H stretching, can be clearly observed. The broad peak in the spectrum of bare Fe3O4 NPs at about 3400 cm−1 is due to O–H stretching. Furthermore, the functionalization causes the appearance of additional barely-resolvable peaks in the fingerprint region. The strong peaks near 1100 and 800 cm−1 are due to Si–O–Si and Si–O stretching vibrations, respectively, which confirm the condensation between hydroxyl groups on magnetite NP surfaces and the alkoxysilane molecule. The typical, very weak, peak related to the S–H bond was observed only in the spectrum of the pure silane at about 2600 cm−1. Thus, FT-IR measurements confirm the functionalization with organic moieties for the directly-functionalized particle.
Infrared analysis has been also performed for the silica coated samples; nevertheless, in this second case, the presence of silica did not allow the detection of any other functional group.

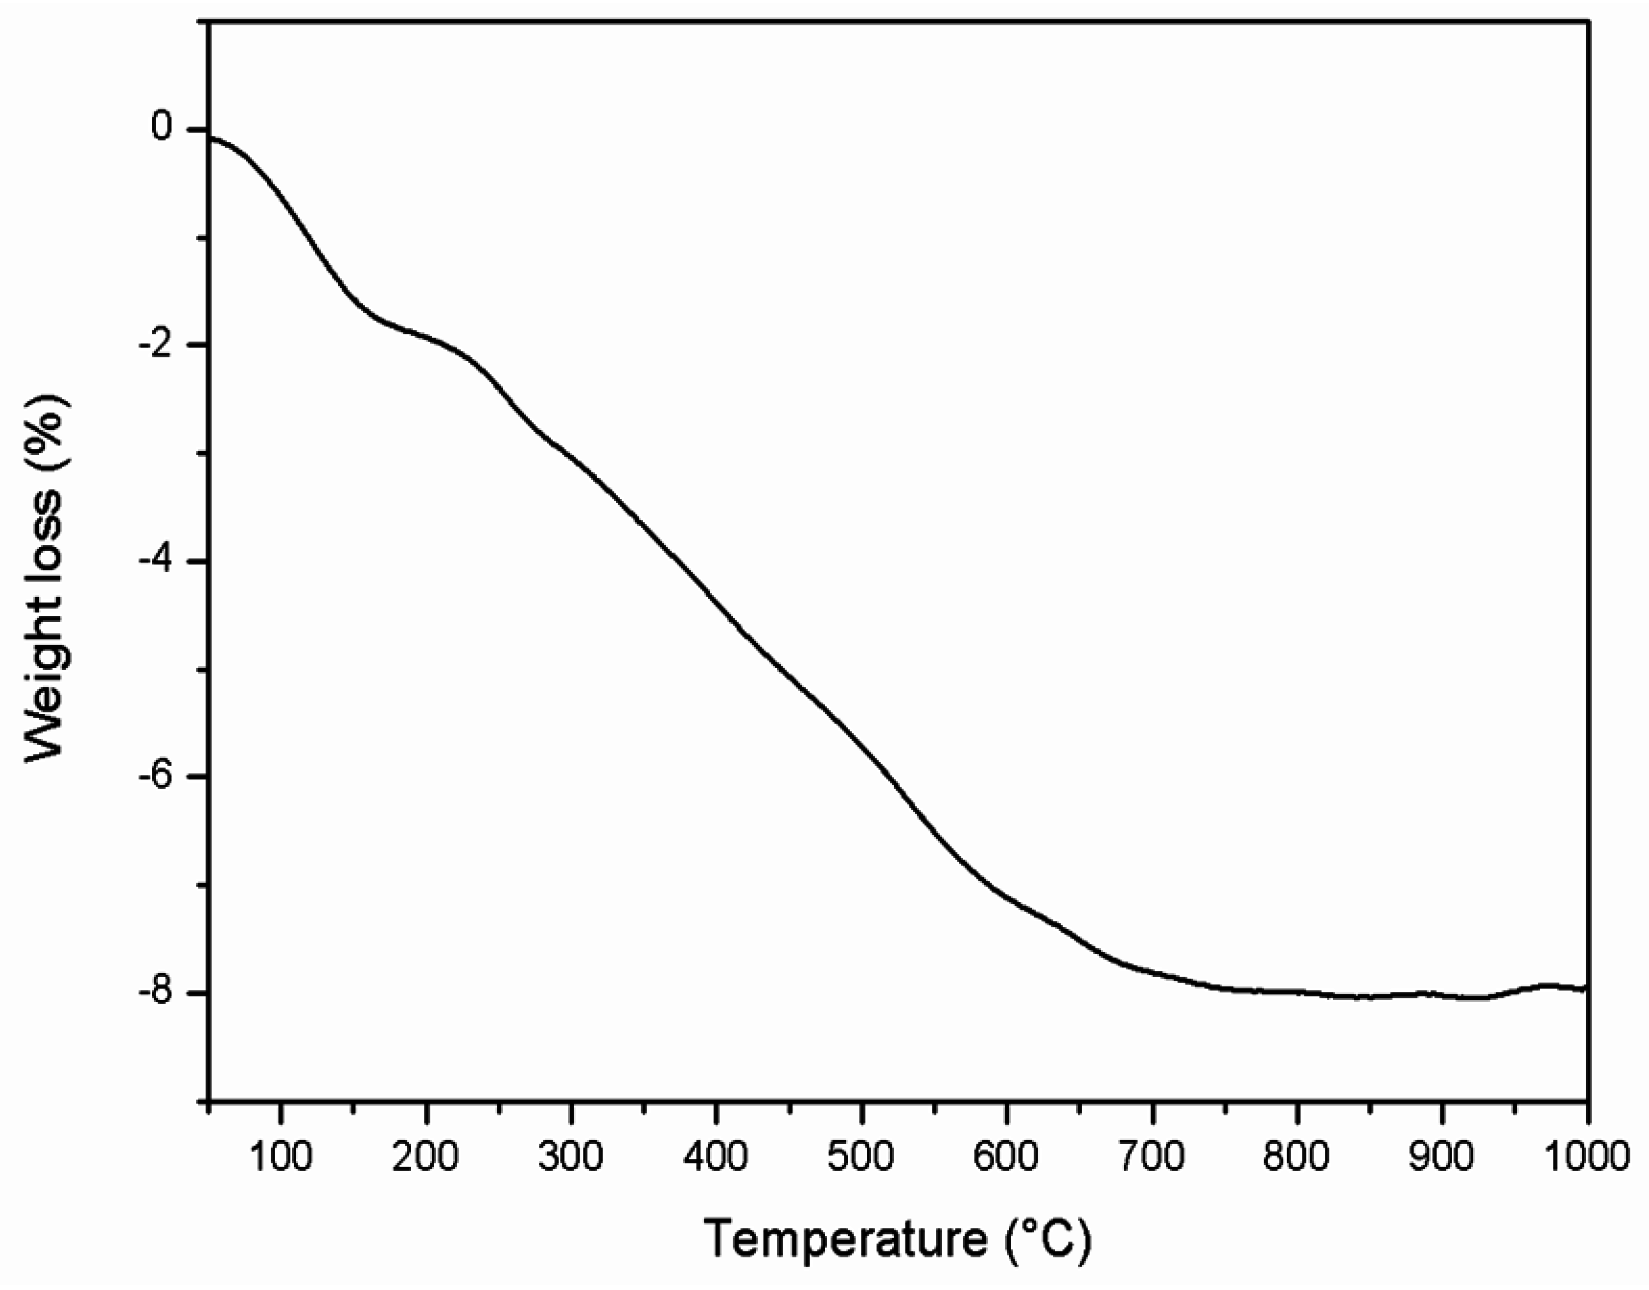
2.2.4. Thermogravimetric Analyses

In Figure 10 and Figure S4 the TGA analyses of Fe3O4@SiO2@MPTMS and Fe3O4@MPTMS samples are reported. No significant differences were detected. The total weight loss amounted to 7.9% and 7.2%, respectively.
It should be noted that, for both APTES and MPTMS derivatives, the weight loss for the nanoparticles with the silica intermediate coating is a slightly higher with respect to those without any silica intermediate, in agreement with the trend reported by Čampelj et al. [22]. In any case these results also confirmed that the amount of organic ligands bonded to the inorganic surface of all of the analyzed nanostructures, could be considered comparable. Moreover, in this way we demonstrate that the synthetic processes give good results in both cases; thus, the use of the inorganic coating could be strictly required only for specific uses, for instance for biomedical applications.

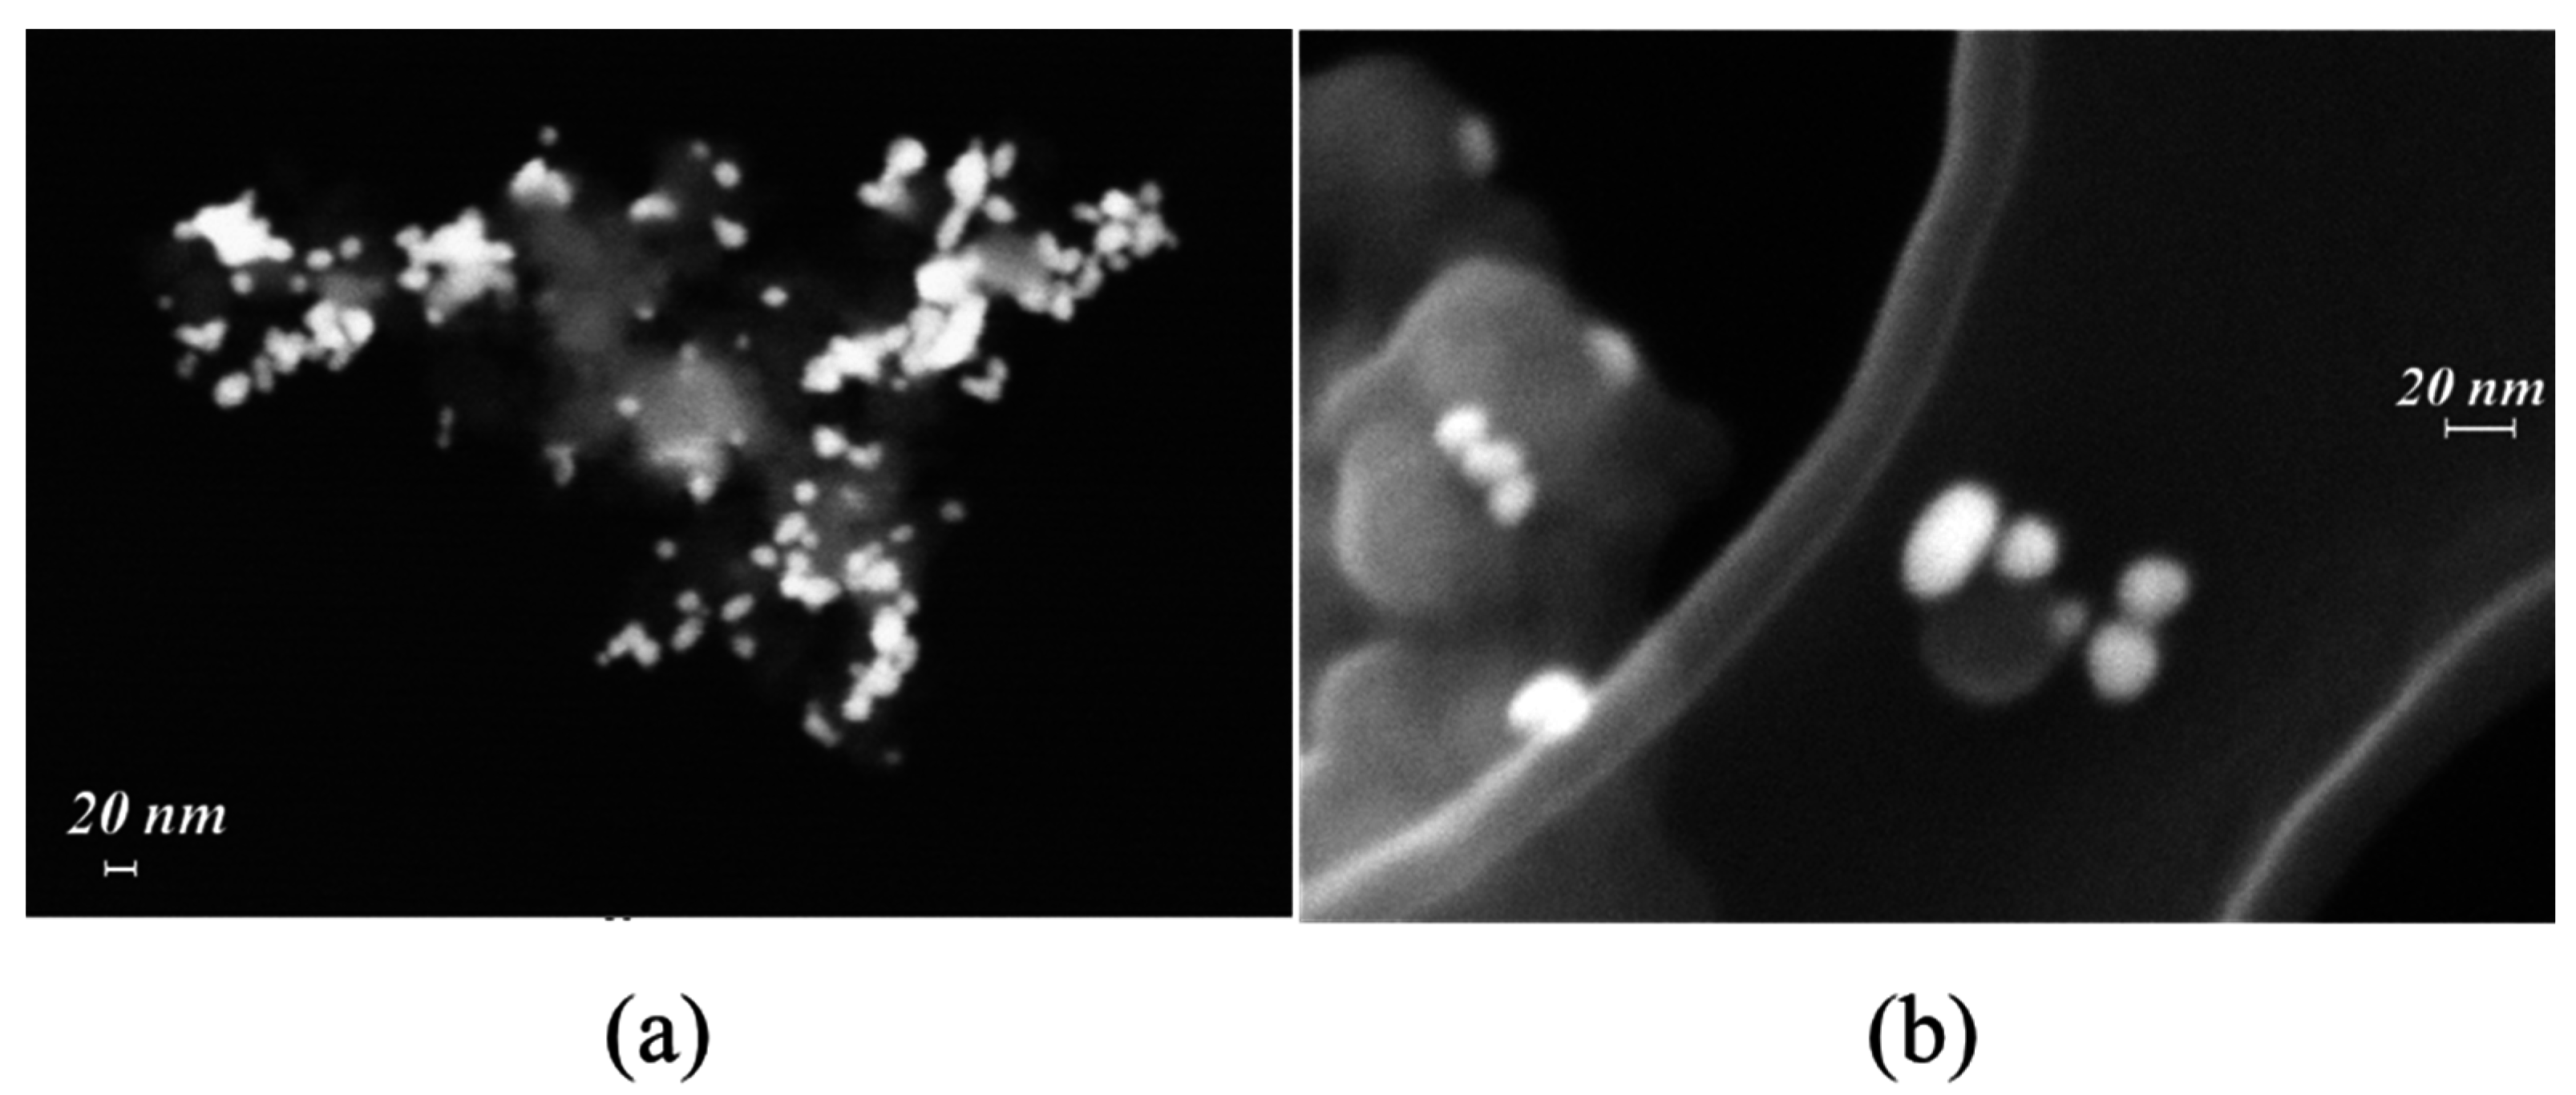
2.2.5. Au NP Conjugation

Gold NPs have been synthetized following the synthetic method reported by Turkevich et al. [23]. A characteristic image of the synthesized Au NPs is shown in Figure 11. From different images of these NPs a mean diameter ranging from 8 to 20 nm has been evaluated.
These data are also confirmed by UV-VIS measurements (see Figure S5b): the observed absorbance peak at 524 nm is related to a gold particle dimension of about 20 nm, as reported in the literature [23], in excellent agreement with the FE-SEM observation.
Figure 12 has been collected using the back-scattered signal since it allows for obtaining a better contrast for different Z-value materials. In these conditions, Au NPs appear brighter than magnetite NPs. The Fe3O4@MPTMS@Au sample (Figure 12a) is characterized by strong agglomeration. In this sample, Au NPs are randomly distributed across the surface of the agglomerates. Furthermore, all of the detected Au NPs have been found linked to a magnetic moiety; no free Au NPs were observed. Figure 12b refers to a Fe3O4@SiO2@MPTMS@Au sample. Additionally, in this case, Au NPs can be found linked to the Fe3O4@SiO2@MPTMS surface. Since the agglomeration of the sample is much lower with respect to the non-stabilized one, single-coated particles with Au on the surface can be detected. Again, no free Au NPs have been observed.
Figure 13 displays the AC susceptibilities of Fe3O4@MPTMS@Au (a) and Fe3O4@SiO2@MPTMS@Au (b) NPs, while the results of the fits are presented in Table 3. From Figure 13a a maximum centered below 10 Hz can be observed. The fit results give evidence of Fe3O4@MPTMS@Au agglomerates with relatively large dimensions of rm = 210 nm. For Fe3O4@SiO2@MPTMS@Au (Figure 13b) a well-defined maximum is observed. The increase of the mean radius from 95 nm for Fe3O4@SiO2@MPTMS NPs to 115 nm for Fe3O4@SiO2@MPTMS@Au NPs is totally ascribed to the mean diameter of the gold nanoparticles, as shown in the image reported in Figure 12b.

3. Materials and Methods

3.1. Materials and Synthetic Method

All chemicals (99.9 wt % purity minimum) were purchased from Sigma Aldrich (St. Louis, MO, USA) and used without further purification.
Magnetite nanoparticles were synthesized using a modified Massart method [24] based on the co-precipitation of stoichiometric iron (II) and iron (III) chloride hexa-hydrate salts in aqueous ammonia solution. The obtained nanoparticles were washed several times in hot water and magnetically collected, following the protocol previously described [17]. The NPs were finally dispersed in water to be used for further functionalization.
Silica-coated magnetite NPs were prepared following the Stöber process [25]. Briefly, to an alcoholic suspension of magnetite (60 mg/L), water, ammonia, and TEOS are added. The reaction was then maintained for two hours at 40 °C and, finally, the product is magnetically collected. Details about the synthesis were already presented [26].
The two different paths used to functionalize the magnetite NPs are reported in Scheme 1, where OSM is the generic organo-silane molecule and X is the functional group (–NH2 or –SH).

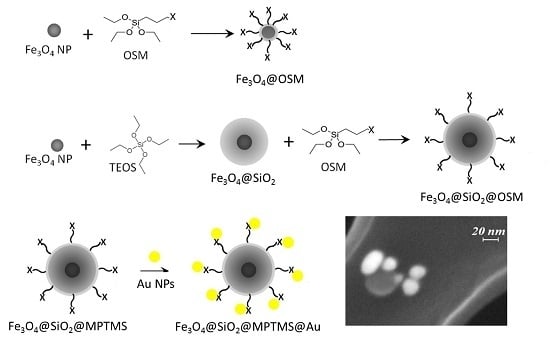
3.1.1. APTES Functionalization

The protocol used for the direct APTES [(3-Aminopropyl)triethoxysilane] functionalization of magnetite nanoparticles is described here: 40 mL of a dispersion of Fe3O4 NPs in water (2 g/L) were added to 40 mL of ethanol and to 1.6 mL of 2% v/v solution of APTES. The temperature was kept constant at 50 °C and the reaction was carried out for 24 h.
The very low concentration of silica coated magnetite nanoparticles suggested the use of smaller volumes for reactants: 1 mL of Fe3O4@SiO2 (60 mg/L) in water was added to 1 mL ethanol and to 43 μL of APTES (2% v/v); temperature and time were the same as in the previous functionalization [27].
Each sample has been magnetically washed several times using first ethanol and then Milli-Q water (MilliQ Academic from Merck Millipore, Darmstadt, Germany).

3.1.2. MPTMS Functionalization

The method for the direct functionalization of Fe3O4 NPs with MPTMS [(3-mercaptopropyl) trimethoxysilane] is reported here: 40 mL of a dispersion of magnetite NPs in water (0.5 g/L) were added to 40 mL of ethanol and 1.6 mL of MPTMS (2% v/v). The reaction was carried out in the same conditions reported above.
The standard reaction used to functionalize silica-coated magnetite NPs is: to 1 mL of ethanol in Eppendorf, 1 mL of Fe3O4@SiO2 NPs (60 mg/L) in water, and 20 μL of a solution 1% v/v of MPTMS and 11.5 μL of acetic acid were added. The reaction was carried out in the same conditions reported above [28]. As for APTES-functionalized samples, each sample has been magnetically washed several times using ethanol and then Milli-Q water.

3.1.3. Synthesis of Au NPs

Gold NPs were prepared by the reduction of an aqueous solution of HAuCl4 (0.01 M) with sodium citrate (0.01 M) in a ratio of 1:3 (v/v) at room temperature under vigorous sonication for 15 min. After a few minutes, a color change from yellow to purple is easily detectable: the solution so obtained is stable for a very long time and does not require further treatments. A characteristic image of the synthesized Au NPs is shown in Figure 10.

3.1.4. MPTMS-Au Conjugation

The gold NP conjugation to NPs@MPTMS (Fe3O4@MPTMS and Fe3O4@SiO2@MPTMS) (1:1 wt/wt ratio) is performed at RT in Eppendorf under vigorous mechanical stirring for 24 h. The NPs are then washed three times in Milli-Q water to completely eliminate the chemical environment, and then magnetically separated.

3.2. Characterization Techniques

Field emission scanning electron microscopy (FE-SEM) analyses were carried out using a FE-SEM JEOL ZEISS SUPRA 40 VP (Carl Zeiss AG, Oberkochen, Germany). Transmission electron microscopy (TEM) analyses were performed with the model JEOL JEM 2010 200 kV microscope from JEOL Ltd. (Peabody, MA, USA). The specimen powders for FE-SEM and TEM analyses were suspended in ethanol, and then exposed to ultrasonic vibrations to decrease the aggregation. A drop of the resultant mixture was deposited on a copper grid covered with a thin carbon lace and then carefully dried before the analysis.
Information on the organic molecules linked to the surface of the particles have been obtained by means of FT-IR spectrometry. For our purpose, we investigated dried samples with a Perkin Elmer Spectrum 65 FT-IR spectrometer (Perkin Elmer, Waltham, MA, USA) equipped with universal ATR (Attenuated Total Reflectance) sampling accessory.
Gold particle dimensions have been evaluated by means of FE-SEM and TEM observation, and indirectly determined by UV measurements of the absorbance in 0.01 M aqueous solution, using a Varian CARY50 UV-VIS spectrometer (Varian Medical Systems, Palo Alto, CA, USA). The organic compound ninhydrin (2,2-dihydroxyindane-1,3-dione) was used as the revealing agent. This chemical, when reacting with primary or secondary amines, produces a deep blue or purple color known as a Ruhemann complex [16].
AC susceptibility measurements were obtained using an Oxford Maglab2000 (Oxford Instruments, Abingdon on Thames, UK), operating in the 1–104 Hz frequency range with 10 Oe applied a.c. magnetic field. The resolution of the AC signal was better than 10−7 emu.
Thermogravimetric analyses (TGA) were performed using a Labsys EVO Setaram instrument (Setaram Instrumentation, Caluire, France). Approximately 5 mg of each sample were weighed in an open alumina crucible (Setaram Instrumentation, Caluire, France) and heated from 50 °C to 1000 °C in a He atmosphere (20 mL/min) with a heating rate equal to 10 °C/min.

4. Conclusions

In this paper the results of the functionalization of magnetite nanoparticles with organo-silane molecules (APTES and MPTMS) using two different paths have been presented.
The functionalized magnetic NPs have been analyzed by different experimental techniques and the results are completely in agreement with each other. Furthermore, the magnetic susceptibility confirms the ability to achieve dimensional information about systems of magnetic nanoparticles in solution.
We demonstrated here the possibility of obtaining the same functionalization on the nanoparticles’ surfaces with and without the presence of the intermediate coating. Thus, the Fe3O4@OSM particles could be used with an efficiency comparable to the Fe3O4@SiO2@OSM one, for all of the applicative uses, for instance in the analytical and/or environmental fields, not requiring a high dispersion in a fluid, thus avoiding a further synthetic step.

Supplementary Materials

The following are available online at www.mdpi.com/1996-1944/9/10/826/s1. Figure S1: Room temperature isothermal magnetization of the bare Fe3O4 NPs, displaying the absence of the coercivity, typical of the superparamagnetic regime, Figure S2: TGA analysis of Fe3O4@SiO2@APTES, Figure S3: TGA analysis of Fe3O4@APTES, Figure S4: TGA analysis of Fe3O4@MPTMS, Figure S5: FE-SEM image of Gold NPs (a) and the relative UV-VIS spectrum (b).

Author Contributions

P.R., S.V. and F.C. conceived and designed the experiments; S.V., F.L. performed the experiments; P.R., S.V., F.L. and F.C. analyzed the data; F.C. contributed reagents/materials/analysis tools; P.R., S.V., F.L. and F.C. wrote the paper.

Conflicts of Interest

The authors declare no conflict of interest.

References

  1. Rocha-Santos, T.A.P. Sensors and biosensors based on magnetic nanoparticles. TrAC 2014, 62, 28–36. [Google Scholar] [CrossRef]
  2. Barry, N.P.E.; Sadler, P.J. Challenges for metals in medicine: How nanotechnology may help to shape the future. ACS Nano 2013, 7, 5654–5659. [Google Scholar] [CrossRef] [PubMed]
  3. Porosoff, M.D.; Chen, J.G. Trends in the catalytic reduction of CO2 by hydrogen over supported monometallic and bimetallic catalysts. J. Catal. 2013, 301, 30–37. [Google Scholar] [CrossRef]
  4. Parveen, S.; Misra, R.; Sahoo, S.K. Nanoparticles: A boon to drug delivery, therapeutics diagnostic and imaging. Nanomed. NBM 2012, 8, 147–166. [Google Scholar] [CrossRef] [PubMed]
  5. Pelaz, B.; Jaber, S.; de Aberasturi, D.J.; Wulf, V.; Aida, T.; de la Fuente, J.M.; Feldmann, J.; Gaub, H.E.; Josephson, L.; Kagan, C.R. The state of nanoparticles-based nanoscience and biotechnology: Progress, promises and challenges. ACS Nano 2012, 6, 8468–8483. [Google Scholar] [CrossRef] [PubMed]
  6. Bell, A.T. The impact of nanoscience on heterogeneous catalysis. Science 2003, 299, 1688–1691. [Google Scholar] [CrossRef] [PubMed]
  7. Veiseh, O.; Gunn, J.W.; Zhang, M. Design and fabrication of magnetic nanoparticles for targeted drug delivery and imaging. Adv. Drug Deliv. Rev. 2010, 62, 284–304. [Google Scholar] [CrossRef] [PubMed]
  8. Acklin, B.; Lautens, E. Magnetic Nanoparticles: Properties, Synthesis and Applications; Nova Science Publishers: New York, NY, USA, 2012; ISBN 161942424X,9781619424241. [Google Scholar]
  9. Tiwari, As.; Tiwari, At.; Tripathi, A.; Melo, J.S.; D’Souza, S.F. Magnetic nanoparticles in tissue regeneration. In Nanomaterials in Drug Delivery, Imaging, and Tissue Engineering; Tiwari, As., Tiwari, At., Eds.; John Wiley & Sons Inc.: Hoboken, NJ, USA, 2013; Volume 14. [Google Scholar] [CrossRef]
  10. Mireles, L.-K.; Sachera, E.; L’Hocine, Y.; Laurent, S.; Stanicki, D. A comparative physicochemical, morphological and magnetic study of silane-functionalized superparamagnetic iron oxide nanoparticles prepared by alkaline coprecipitation. Int. J. Biochem. Cell Biol. 2016, 75, 203–211. [Google Scholar] [CrossRef] [PubMed]
  11. Mahmoudi, M.; Sant, S.; Wang, B.; Laurent, S.; Sen, T. Superparamagnetic iron oxide nanoparticles (SPIONs): Development, surface modification and applications in chemotherapy. Adv. Drug Deliv. Rev. 2011, 63, 24–46. [Google Scholar] [CrossRef] [PubMed]
  12. Bini, R.A.; Marques, R.F.C.; Santos, F.J.; Chaker, J.A.; Jafelicci, M., Jr. Synthesis and functionalization of magnetite nanoparticles with different amino-functional alkoxysilanes. J. Magn. Magn. Mater. 2012, 324, 534–539. [Google Scholar] [CrossRef]
  13. Gubin, S.P. Magnetic Nanoparticles; Gubin, S.P., Ed.; Wiley VCH-Verlag GmbH and Co.: Weinheim, Germany, 2009; ISBN 978-3-527-40790-3. [Google Scholar]
  14. Lucchini, M.A.; Riani, P.; Canepa, F. Quantitative analysis of the a.c. susceptibility of core–shell nanoparticles. J. Nanopart. Res. 2013, 15, 1601–1611. [Google Scholar] [CrossRef]
  15. Friedman, M. Applications of the ninhydrin reaction for analysis of amino acids, peptides, and proteins to agricultural and biomedical sciences. J. Agric. Food Chem. 2004, 52, 385–406. [Google Scholar] [CrossRef] [PubMed]
  16. Shankara, S.; Ganesh, M.K.; Hemavathi, A. Laboratory Manual for Practical Biochemistry; JAYPEE Brothers Medical Publishers Ltd.: New Delhi, India, 2008; ISBN 978-81-8448-259-1. [Google Scholar]
  17. Riani, P.; Napoletano, M.; Canepa, F. Synthesis, characterization and a.c. magnetic analysis of magnetite nanoparticles. J. Nanopart. Res. 2011, 13, 7013–7020. [Google Scholar] [CrossRef]
  18. O’Handley, R.C. Modern Magnetic Materials: Principles and Applications; Wiley: New York, NY, USA, 2000; ISBN 978-0-471-15566-9. [Google Scholar]
  19. Debye, P. Polar Molecules; The Chemical Catalog Company Inc.: New York, NY, USA, 1929; p. 179. [Google Scholar]
  20. Dick, K.; Dhanasekaran, T.; Zhang, Z.; Meisel, D. Size-dependent melting of silica-encapsulated gold nanoparticles. J. Am. Chem. Soc. 2002, 124, 2312–2317. [Google Scholar] [CrossRef] [PubMed]
  21. Varganici, C.D.; Durdureanu-Angheluta, A.; Rosu, D.; Pinteale, M.; Simionescu, B.C. Thermal degradation of magnetite nanoparticles with hydrophilic shell. J. Anal. Appl. Pyrolysis 2012, 96, 63–68. [Google Scholar] [CrossRef]
  22. Čampelj, S.; Makovec, D.; Drofenik, M. Functionalization of magnetic nanoparticles with 3-aminopropyl silane. J. Magn. Magn. Mater. 2009, 321, 1346–1350. [Google Scholar] [CrossRef]
  23. Turkevich, J.; Stevenson, P.C.; Hillier, J. A study of the nucleation and growth processes in the synthesis of colloidal gold. Discuss. Faraday Soc. 1951, 11, 55–75. [Google Scholar] [CrossRef]
  24. Massart, R. Preparation of aqueous magnetic liquids in alkaline and acidic media. IEEE Trans. Magn. 1981, 17, 1247–1250. [Google Scholar] [CrossRef]
  25. Stober, W.; Fink, A.; Bohn, E. Controlled growth of mono-disperse silica spheres in the micron size range. J. Colloid Interface Sci. 1968, 26, 62–69. [Google Scholar] [CrossRef]
  26. Riani, P.; Lucchini, M.A.; Thea, S.; Alloisio, M.; Bertoni, G.; Canepa, F. New approach for the step by step control of magnetic nanostructure functionalization. Inorg. Chem. 2014, 53, 9166–9173. [Google Scholar] [CrossRef] [PubMed]
  27. Yamaura, M.; Camilo, R.L.; Sampaio, L.C.; Macedo, M.A.; Nakamura, M.; Toma, H.E. Preparation and characterization of (3-aminopropyl) triethoxysilane-coated magnetite nanoparticles. J. Magn. Magn. Mater. 2004, 279, 210–217. [Google Scholar] [CrossRef]
  28. Huang, C.; Hu, B. Silica-coated magnetic nanoparticles modified with γ-mercaptopropyl trimethoxysilane for fast and selective solid phase extraction of trace amounts of Cd, Cu, Hg, and Pb in environmental and biological samples prior to their determination by inductively coupled plasma mass spectrometry. Spectrochim. Acta Part B 2008, 63, 437–444. [Google Scholar] [CrossRef]
Figure 1. FE-SEM image of Fe3O4@APTES NPs (a); and the corresponding EDX spectrum (b). The Fe3O4@APTES NPs are laying on a carbon lace covering a copper grid support.
Materials 09 00826 g001
Figure 2. FE-SEM image of Fe3O4@SiO2@APTES NPs (a); and the corresponding EDX spectrum (b). In the inset of figure (a) a TEM image of the specimen is shown.
Materials 09 00826 g002
Figure 3. UV-VIS spectra of Fe3O4, Fe3O4@APTES, and Fe3O4@SiO2@APTES in ninhydrin/ethanol solution, red, green, and black curves, respectively. Green and black curves are superimposed, thus, in the graph, the corresponding spectra have been shifted.
Materials 09 00826 g003
Figure 4. Imaginary and real (inset) components of the complex susceptibility of Fe3O4@APTES (a); and Fe3O4@SiO2@APTES (b). The symbols are the experimental points, while the red line is the fit with the model of [14].
Materials 09 00826 g004
Figure 5. FT-IR spectra of bare Fe3O4 (red curve), Fe3O4@APTES (green curve), and pure APTES (blue curve).
Materials 09 00826 g005
Figure 6. FE-SEM image of Fe3O4@MPTMS NPs (a); and the corresponding EDX spectrum (b).
Materials 09 00826 g006
Figure 7. FE-SEM image of Fe3O4@SiO2@MPTMS NPs (a); and the corresponding EDX spectrum (b).
Materials 09 00826 g007
Figure 8. Imaginary and real, as inset, components of the complex susceptibility of Fe3O4@MPTMS (a); and Fe3O4@SiO2@MPTMS (b). The symbols are the experimental points, while the red line is the fit with the model of [14].
Materials 09 00826 g008
Figure 9. FT-IR spectra of bare Fe3O4 (red curve), Fe3O4@MPTMS (green curve), and pure MPTMS (blue curve).
Materials 09 00826 g009
Figure 10. TGA analysis of Fe3O4@SiO2@MPTMS.
Materials 09 00826 g010
Figure 11. FE-SEM (a) and TEM (b) images of Au NPs.
Materials 09 00826 g011
Figure 12. FE-SEM images of Fe3O4@MPTMS@Au (a) and Fe3O4@SiO2@MPTMS@Au (b) NPs.
Materials 09 00826 g012
Figure 13. Imaginary and real, as inset, components of the complex susceptibility of Fe3O4@MPTMS@Au (a); and Fe3O4@SiO2@MPTMS@Au (b). The symbols are the experimental points, while the red line is the fit with the model of ref [14].
Materials 09 00826 g013
Scheme 1. The different paths used to synthesize magnetite NPs functionalized with the organo-silane molecules.
Materials 09 00826 sch001
Table 1. Mean Brownian and Néel radii, obtained from the analysis of the AC susceptibility data for the Fe3O4@APTES and Fe3O4@SiO2@APTES NPs; σ is the standard deviation of the distribution.
SampleBrownian DistributionNéel Distribution
rm (nm)σrm (nm)σ
Fe3O4@APTES1150.63.80.03
Fe3O4@SiO2@APTES800.440.04
Table 2. Mean Brownian and Néel radii, obtained from the analysis of the AC susceptibility data for the Fe3O4@MPTMS and Fe3O4@SiO2@MPTMS NPs; σ is the standard deviation of the distribution.
SampleBrownian DistributionNéel Distribution
rm (nm)σrm (nm)σ
Fe3O4180.553.40.4
Fe3O4@MPTMS1600.2540.05
Fe3O4@SiO2820.2540.05
Fe3O4@SiO2@MPTMS950.2540.05
Table 3. Mean Brownian and Néel radii, obtained from the analysis of the AC susceptibility data for the Fe3O4@MPTMS@Au and Fe3O4@SiO2@MPTMS@Au NPs: σ is the standard deviation of the distribution.
SampleBrownian DistributionNéel Distribution
rm (nm)σrm (nm)σ
Fe3O4@MPTMS@Au2100.1540.05
Fe3O4@SiO2@MPTMS@Au1150.340.1

