3.1. Flame Parameters
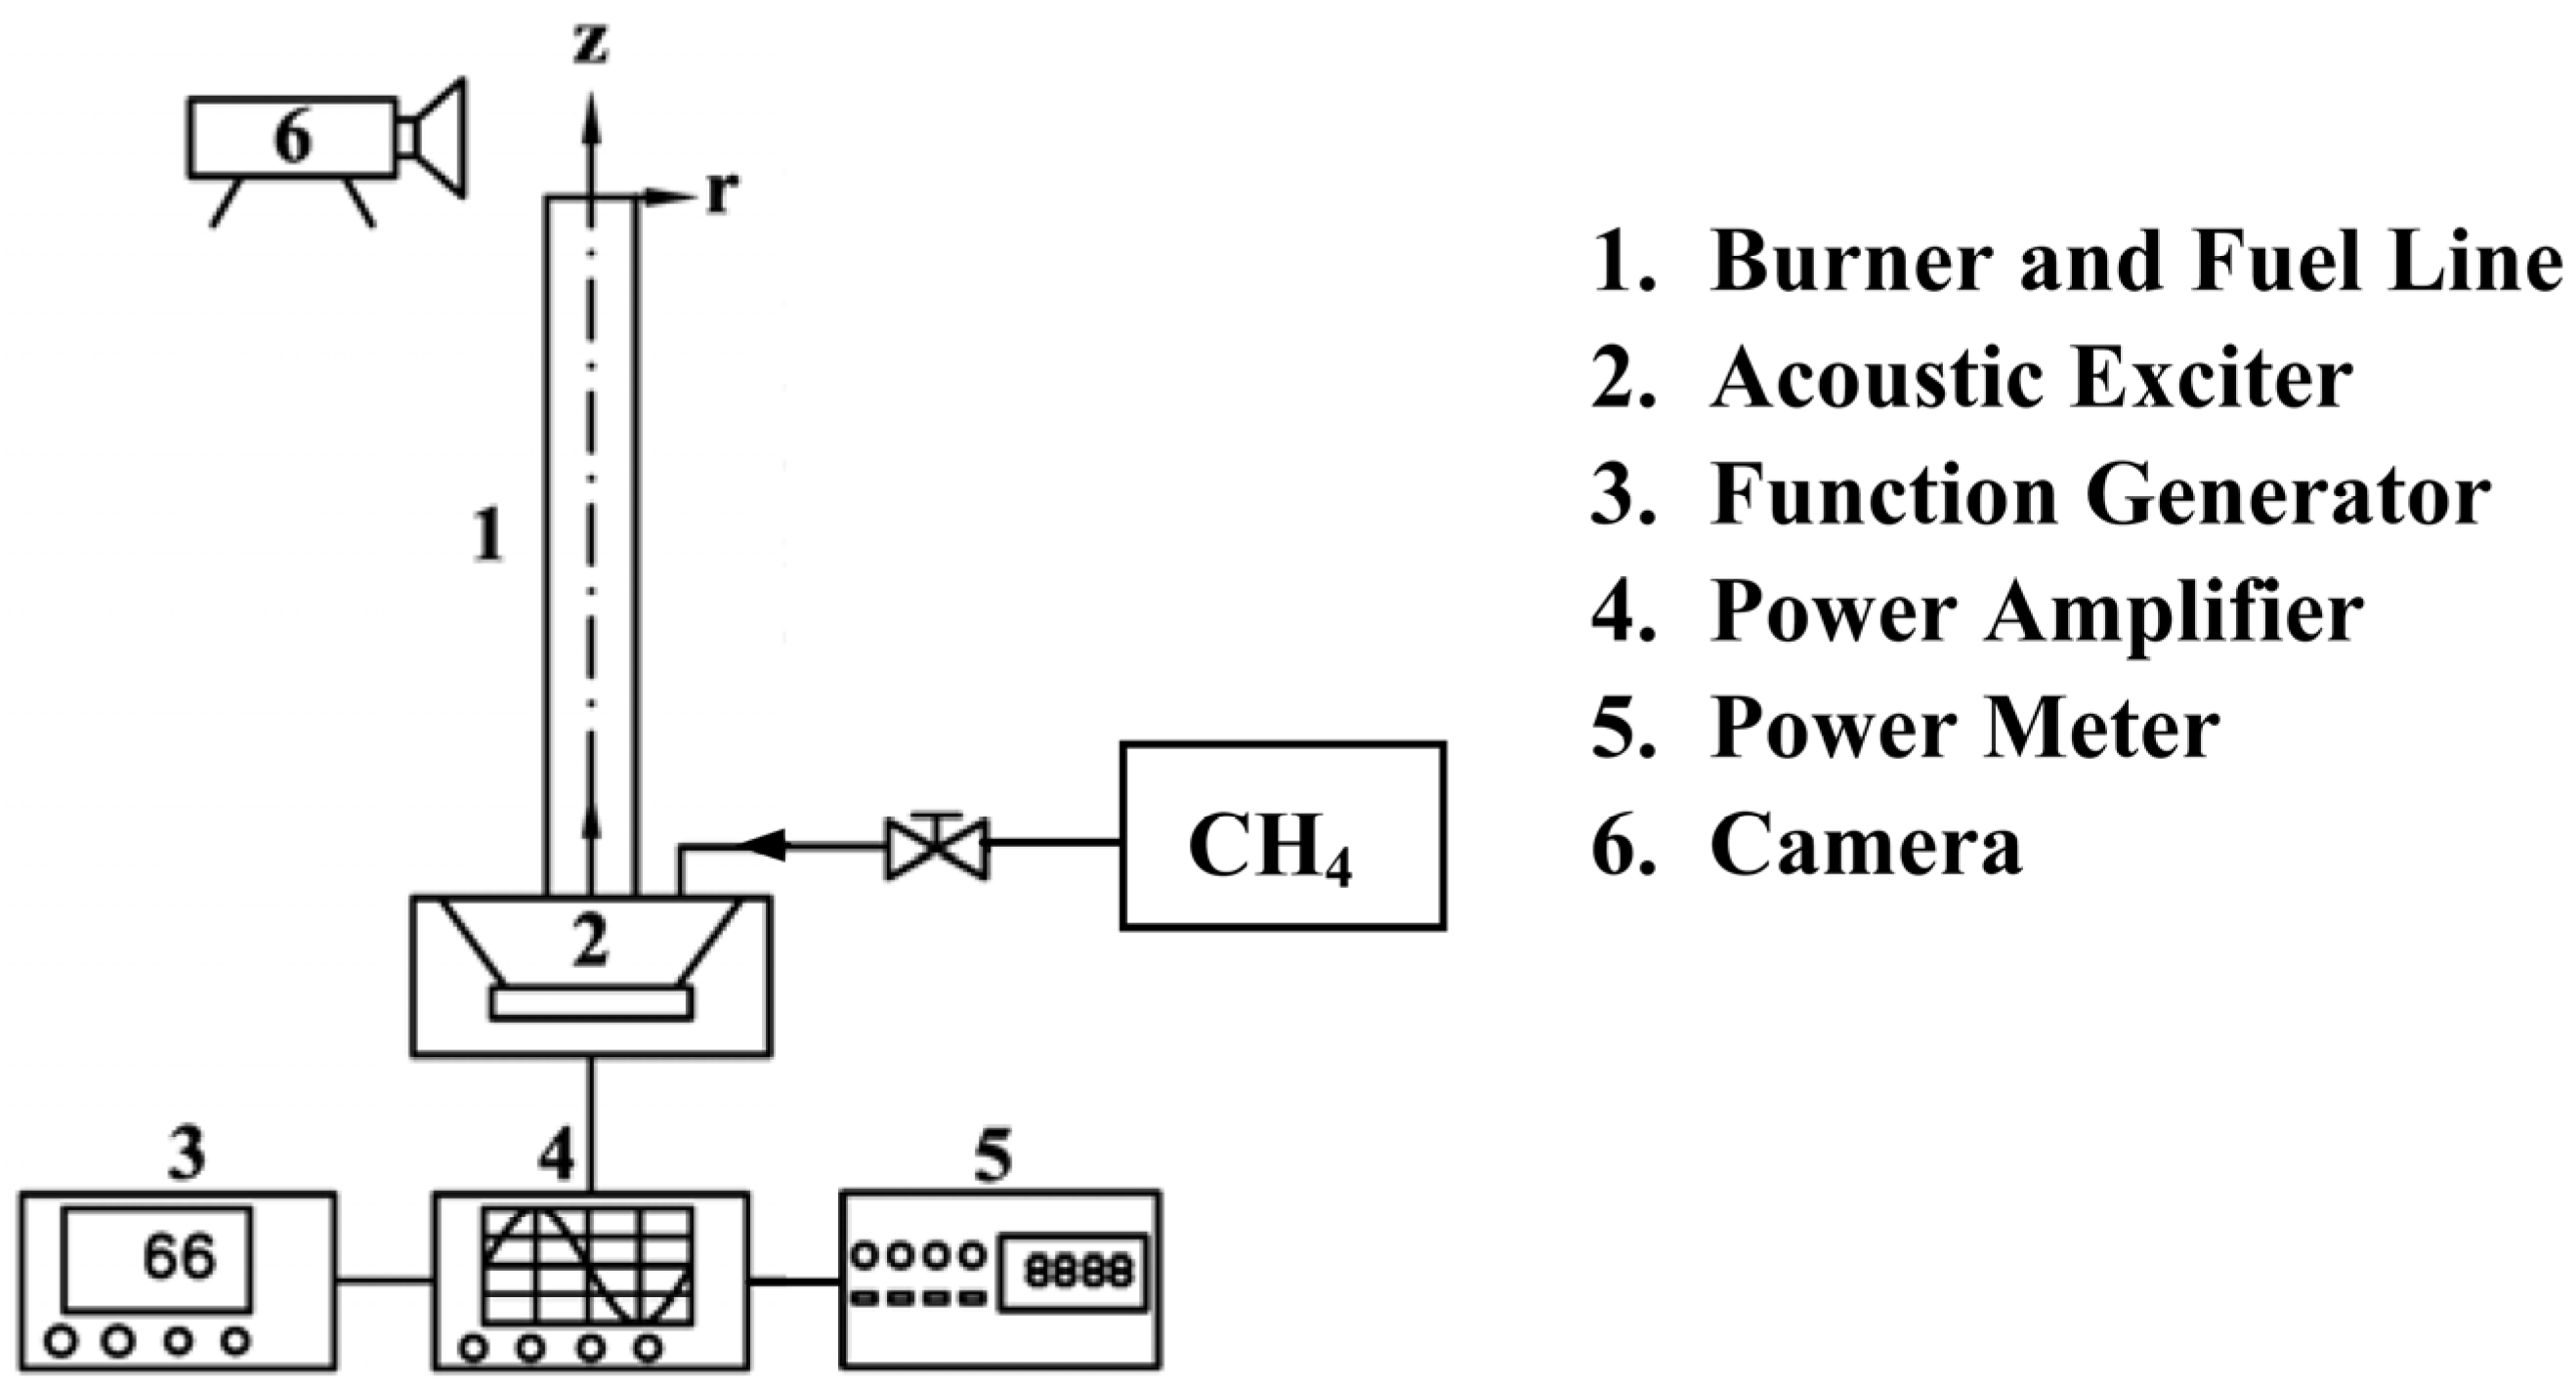
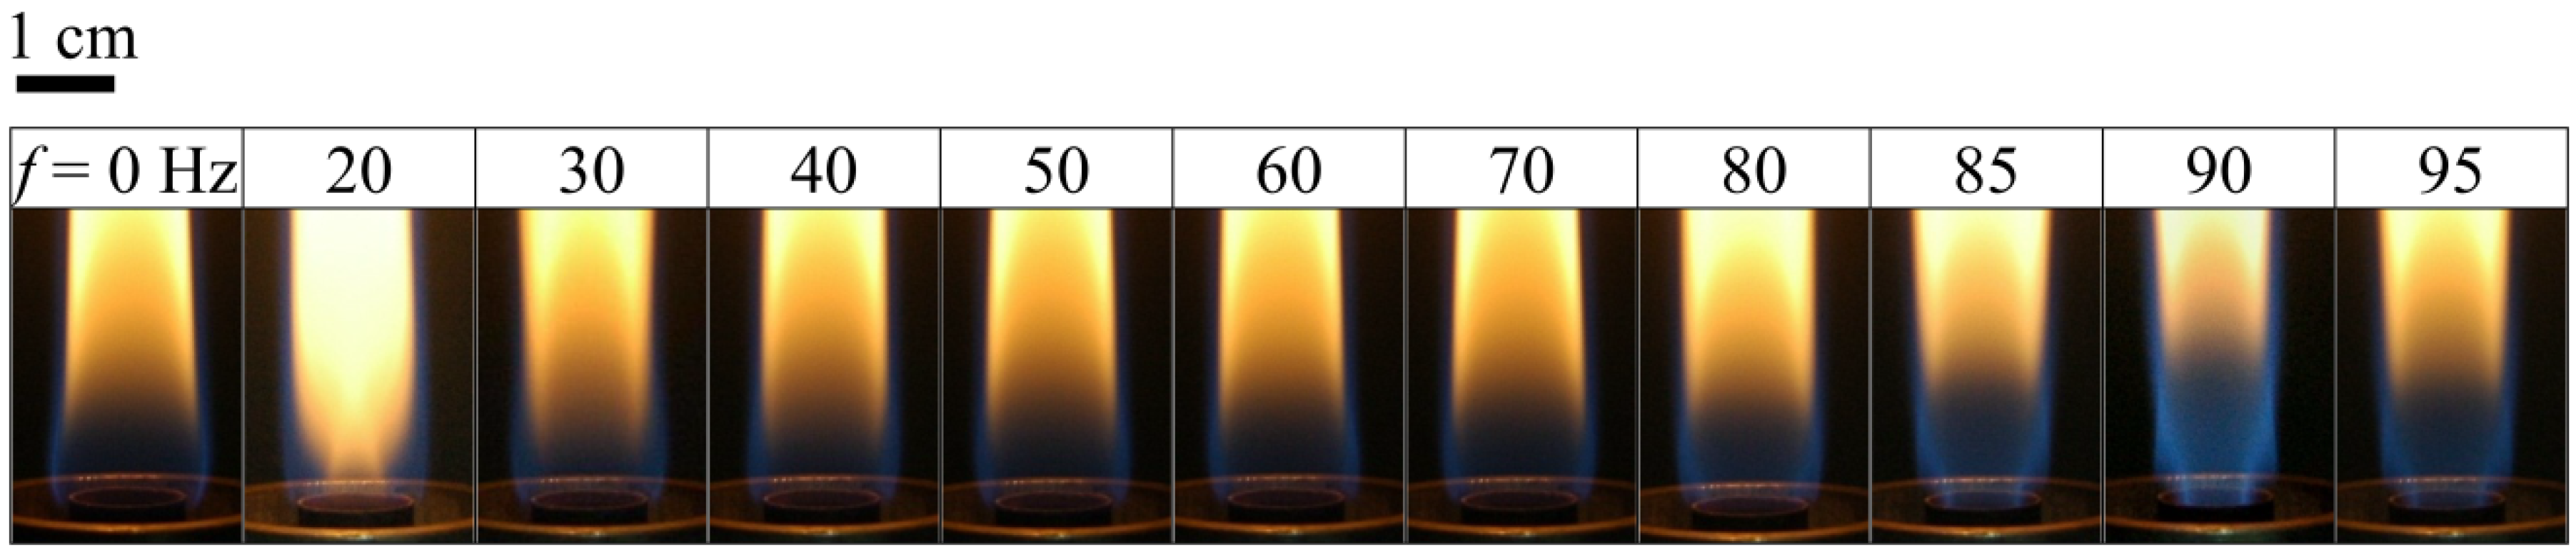
Figure 2 shows images of the flame structure at various excitation frequencies (
f) in the range of 0–95 Hz.
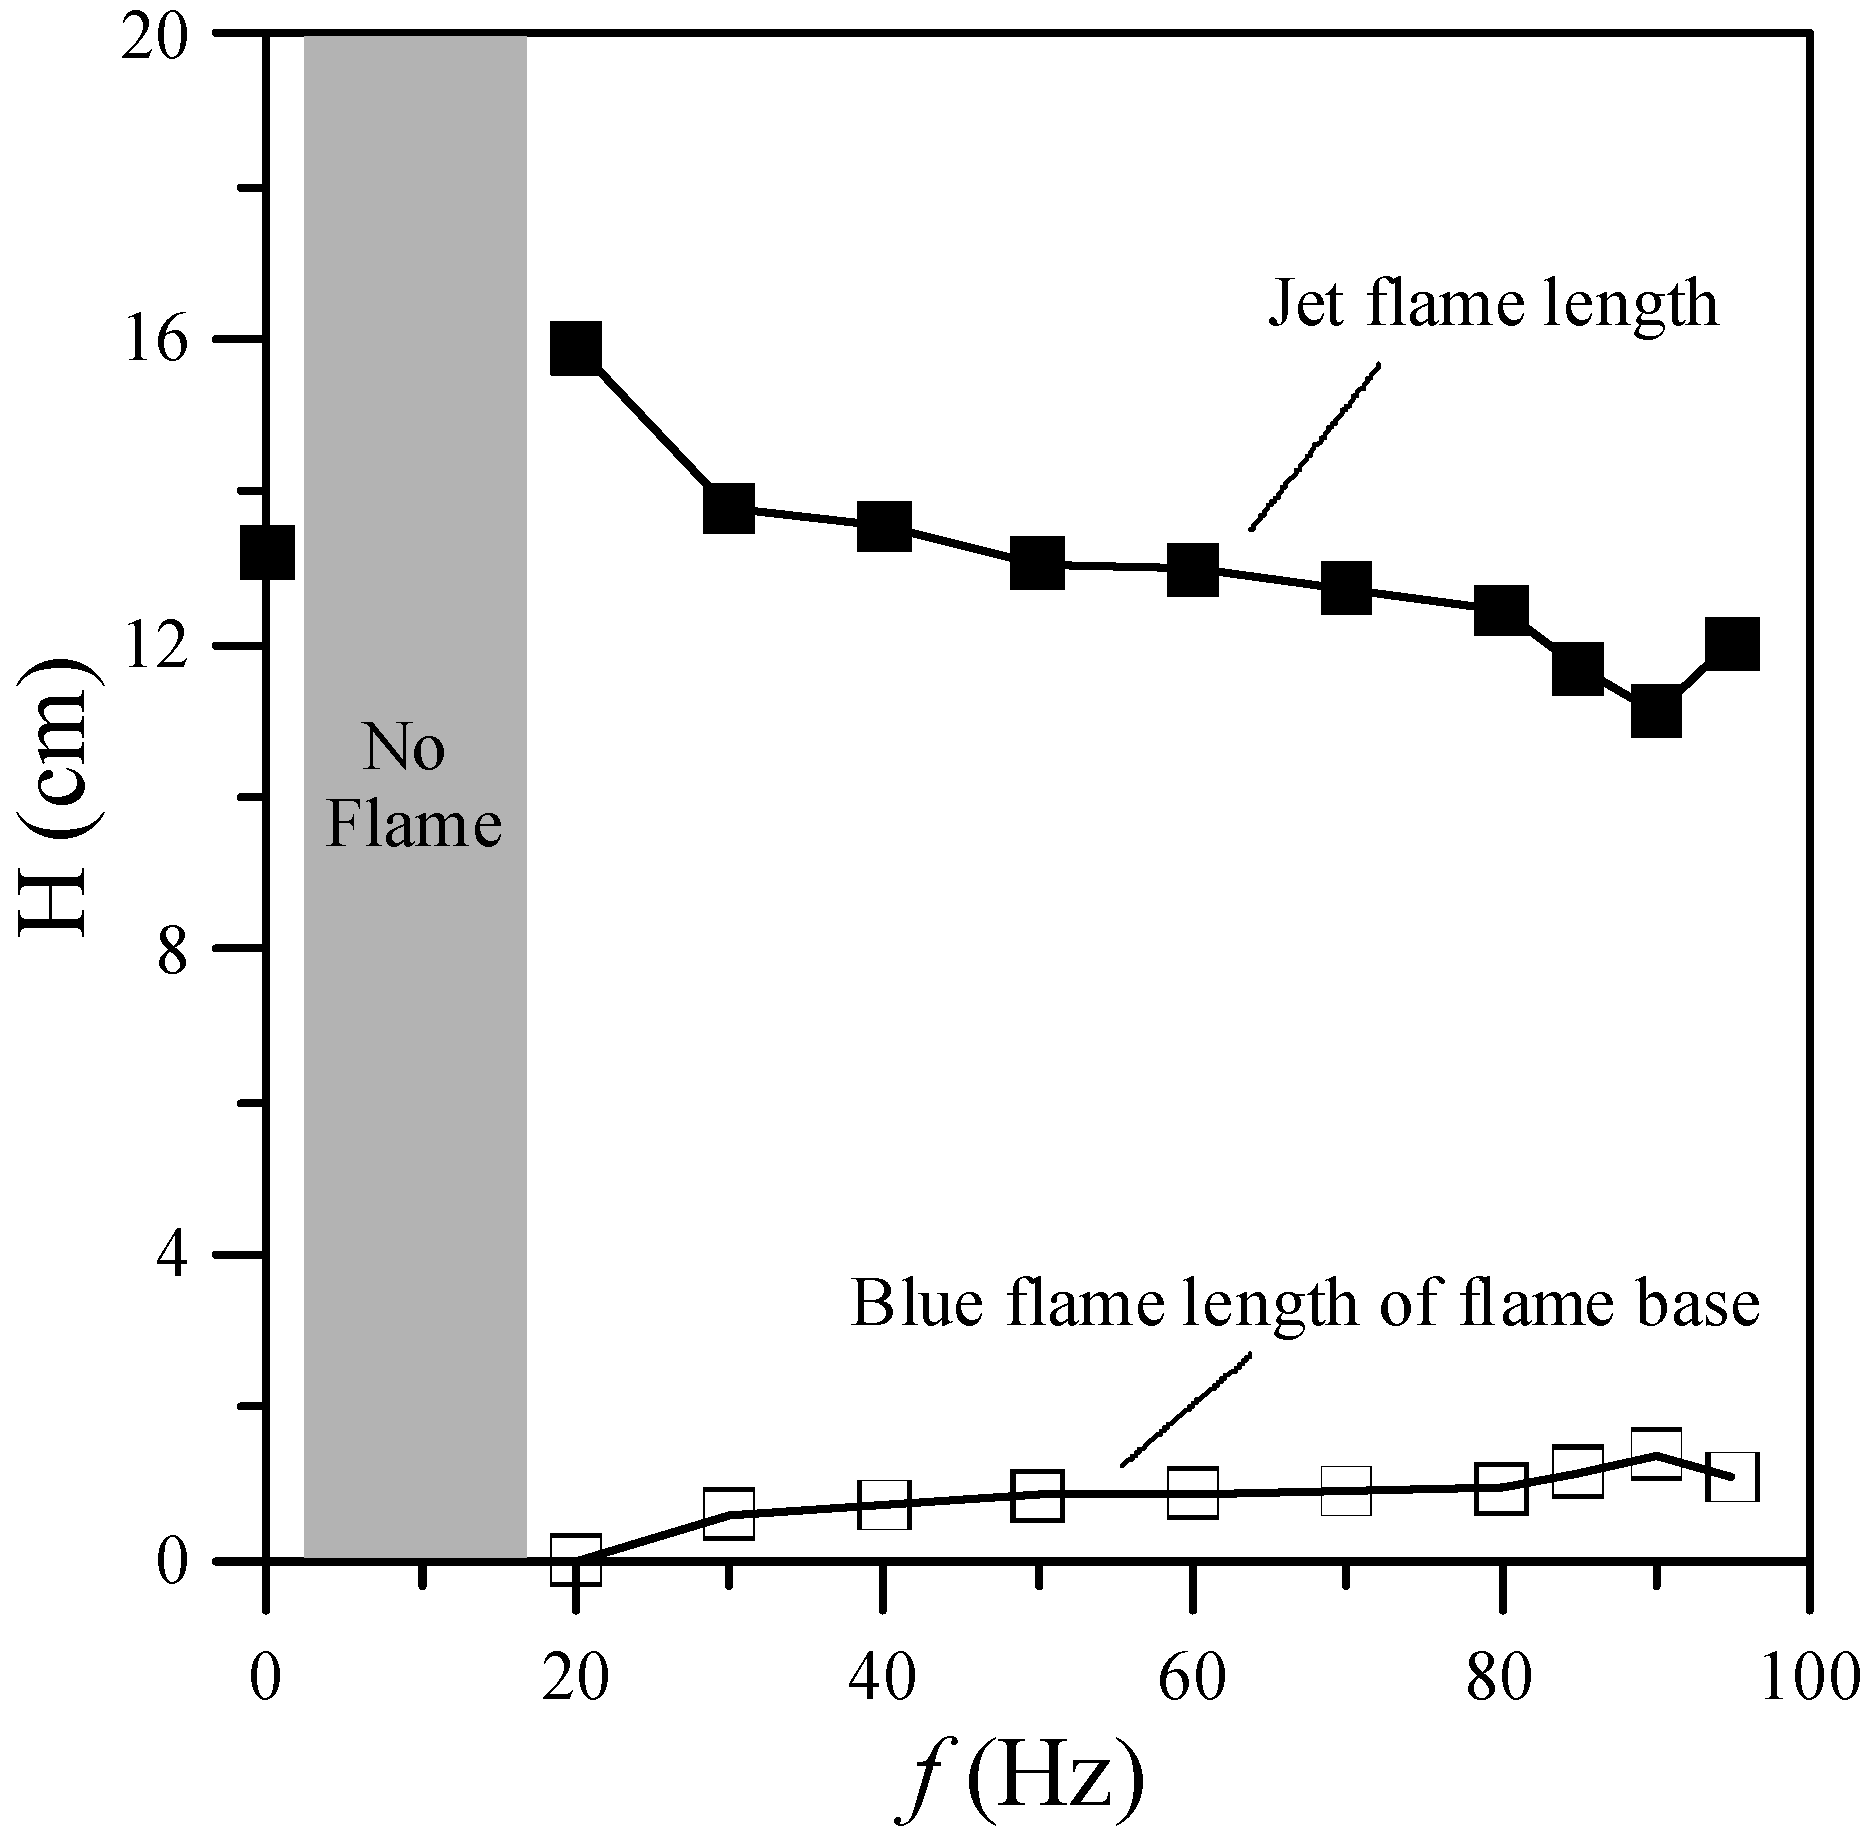
Figure 3 shows the jet flame length and blue flame length of the flame base for various excitation frequencies. In general, the low-frequency oscillation (10–15 Hz) or “flickering” of laminar diffusion flames is caused by buoyancy effects induced by Kelvin-Helmholtz instability [
16]. As shown in
Figure 2, the image for
f = 0 Hz (without acoustic excitation) shows a typical laminar jet flame, which has a single-flame structure. When the excitation frequency was close to the flame flickering frequency (20 Hz), the flame was composed of a slender yellow central flame and a blue outer flame. When the excitation frequency was increased from 20 to 80 Hz, the radius of the central flame in the region near the burner exit increased gradually and the flame color became less bright since the frequency deviated from the natural flickering frequency. Moreover, the jet flame length decreased, whereas the blue flame length of the flame base increased, as shown in
Figure 3. When the excitation frequency was increased from 80 to 90 Hz, the radius of the core flame gradually decreased. Moreover, the flame length decreased and the blue flame length of the flame base increased.
Figure 2 also shows that the shortest flame length and the longest blue flame length of the flame base occurred at the acoustically resonant frequency (90 Hz). As shown in
Figure 2, when the excitation frequency approached the acoustically resonant frequency (90 Hz), the flame had a double-flame structure that consisted of a blue central flame and a blue outer flame (e.g., 85 and 90 Hz). The central flame color became brighter when the excitation frequency was increased from 80 to 90 Hz. At the first acoustically resonant frequency, 90 Hz, the flame structure showed the slenderest and most luminous core flame with the broadest blue outer flame. It is noted that the acoustic excitation caused the reverse flow to induce strong air entrainment, which in turn enhanced flow mixing, slenderizing the blue core flame and leading to the partially premixed blue outer flame. Note that at the natural flickering frequency (
f = 20 Hz), the central flame was yellow, whereas at the acoustically resonant frequency (
f = 90 Hz), the central flame was blue. Under these acoustic excitation conditions, a significant amount of air was sucked into the burner exit during the entrainment part of the cycle. Consequently, the jet flow was compressed and the central flame burned more brightly [
13,
17]. These characteristics imply that the effect of air entrainment at the natural flickering frequency (
f = 20 Hz) was slightly weaker than that at the acoustically resonant frequency (
f = 90 Hz).
Figure 3.
Flame lengths and blue flame lengths of flame base at various excitation frequencies.
Figure 3.
Flame lengths and blue flame lengths of flame base at various excitation frequencies.
There are two modes of resonance associated with acoustic excitation, namely natural flickering and acoustical resonance [
13]. Natural flickering occurred for acoustic excitation frequencies in the range of 10–20 Hz due to the interaction between the hot combustion gas and the ambient air, which induced large vortices. At acoustical resonance, a large amount of ambient air was entrained into the burner exit and mixed with the fuel. From Equation (1), the resonant frequency is about 90 Hz for methane. The change in the acoustically resonant frequency resulted in a significant difference in the flame structure and appearance, which in turn significantly influenced the formation of carbon nanostructures.
The flame structures shown in
Figure 2 can be classified into three main types, namely natural flickering, non-resonant, and acoustically resonant. At the acoustically resonant frequency, a double-layer flame structure was observed. Both the natural flickering mode and the acoustically resonant mode resulted in a flame with a luminous core, which was carbon-rich and had a high temperature. Furthermore, it is expected that the suitable range of fuel concentration for synthesis was wider at these two frequencies than at other frequencies [
13].
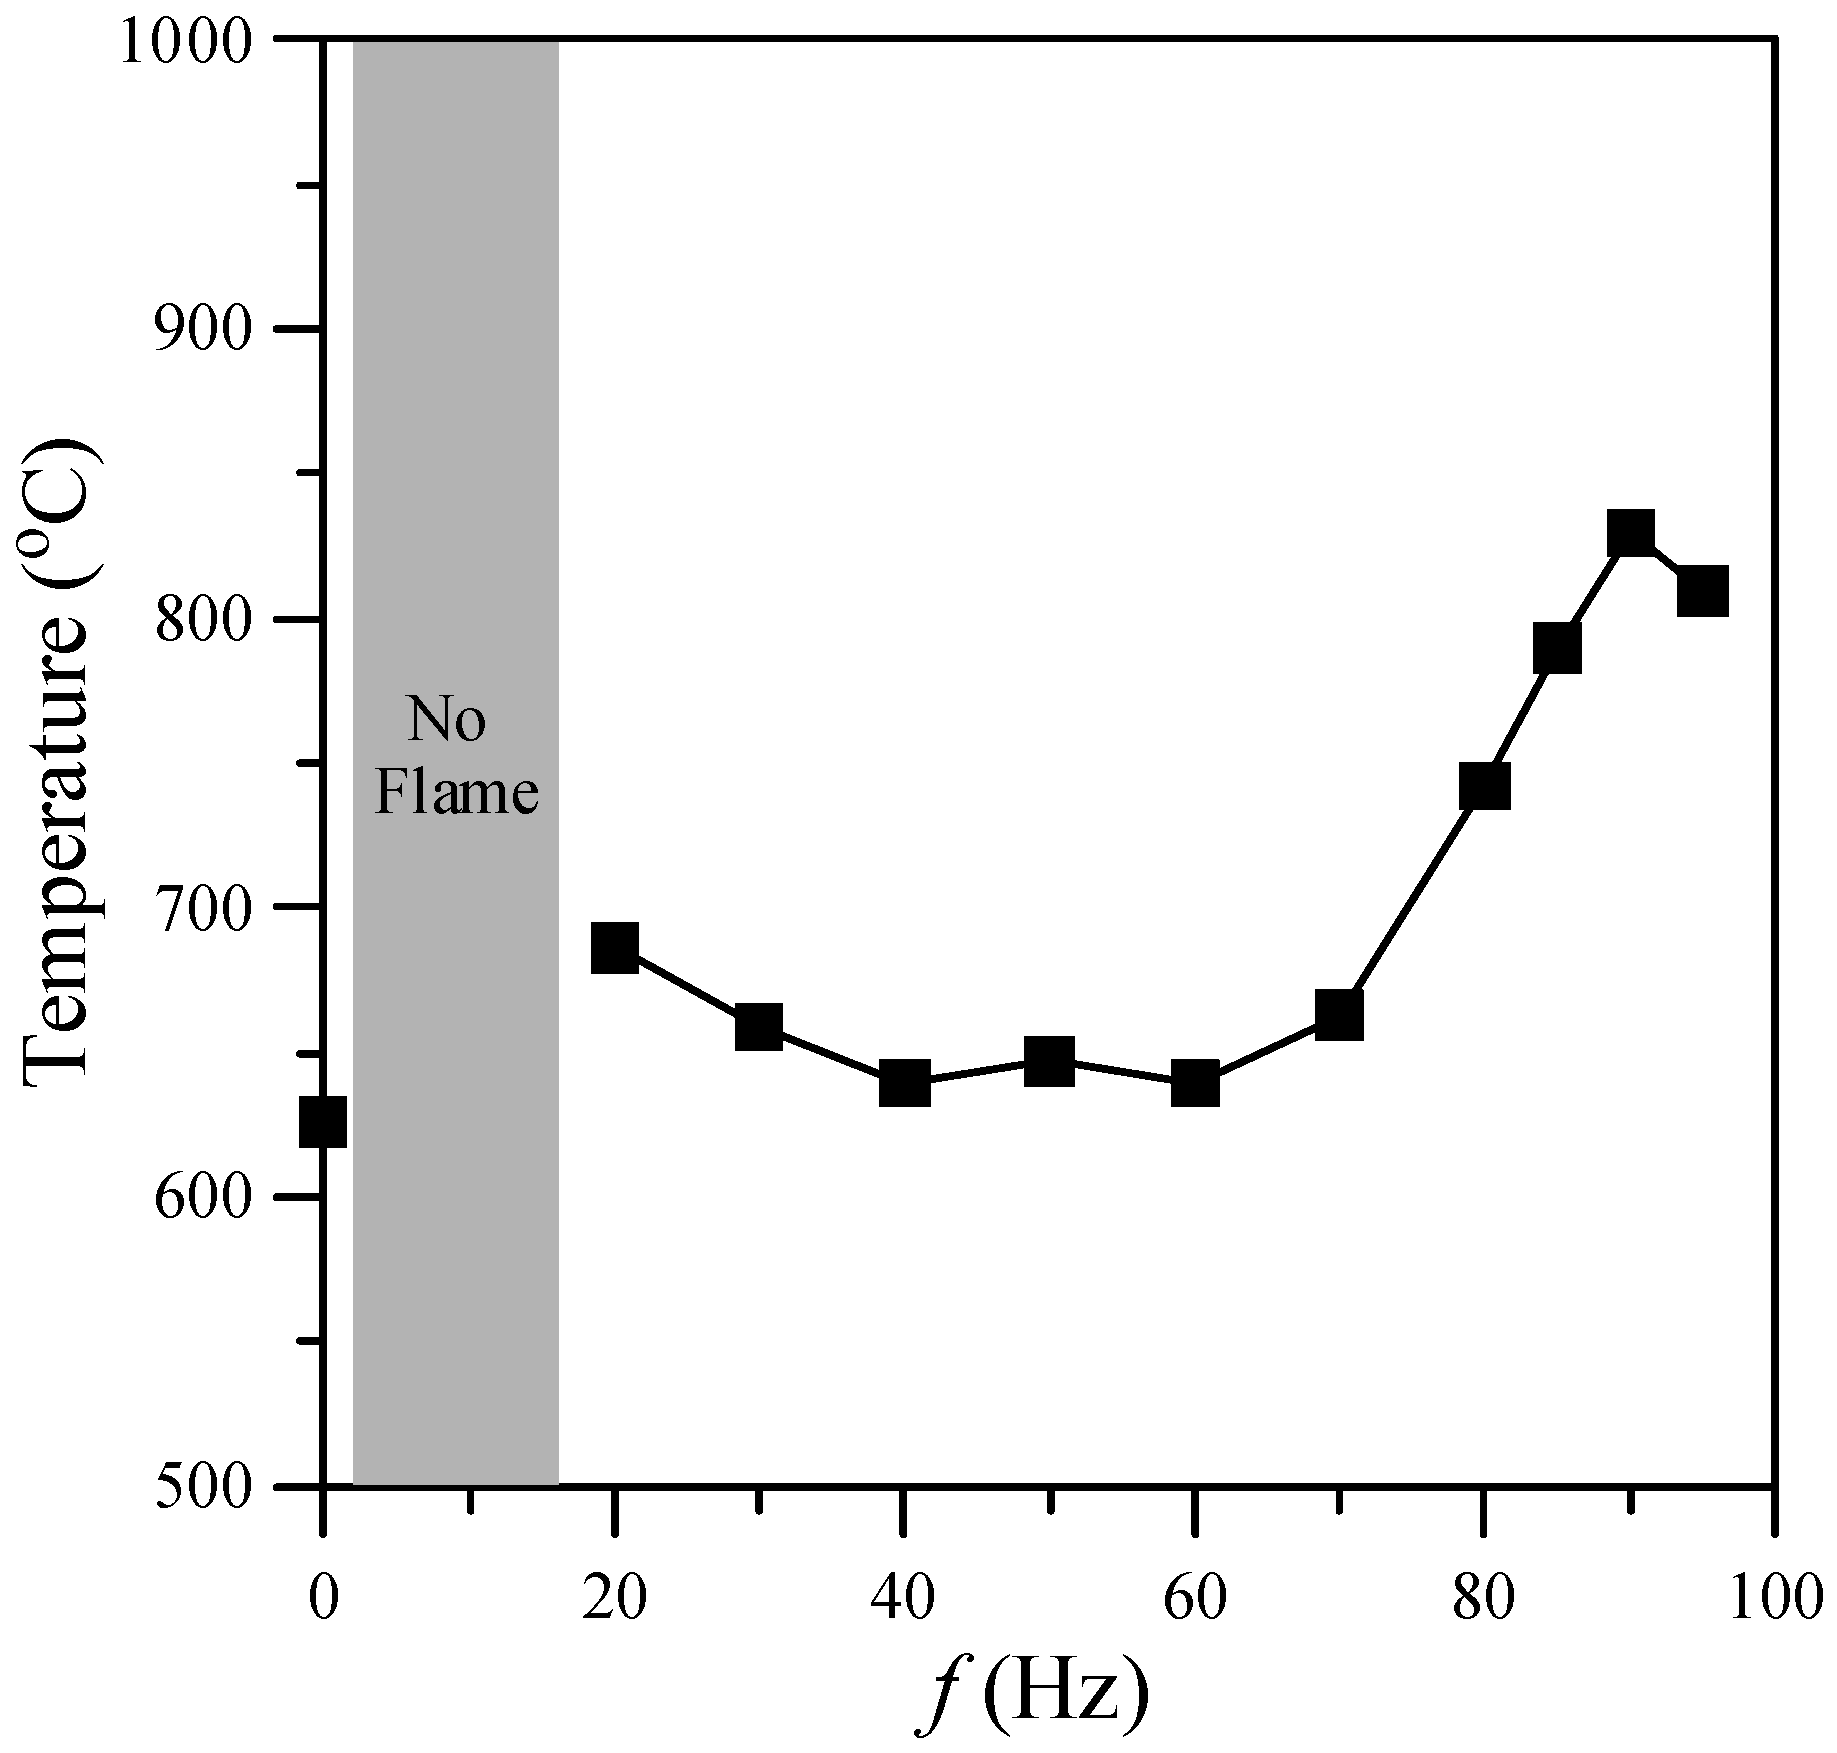
One of the important factors in nanostructure synthesis is the temperature of the environment. This investigation focused on the region near the flame base, and hence the mean temperatures (
T) at
z = 10 mm above the burner exit for acoustic excitation frequencies of 0–95 Hz were examined. The results are presented in
Figure 4. As shown, the gas temperature of the flame with acoustic excitation was higher than that without acoustic excitation due to a more slender core flame (
i.e., higher temperature gradient). Two temperature peaks, at the natural flickering and acoustically resonant frequencies, respectively, were observed as the excitation frequency increased. The first peak (680 °C) appeared at
f = 20 Hz and the second peak (830 °C) appeared at the acoustically resonant frequency (
f = 90 Hz).
Figure 4.
Gas temperature at z = 10 mm above burner exit for various excitation frequencies.
Figure 4.
Gas temperature at z = 10 mm above burner exit for various excitation frequencies.
3.2. Flame Synthesis of Carbon Nanomaterials
The focus of this investigation was analyzing the formation of carbon nanomaterials sampled at z = 10 mm above the burner exit along the centerline for a fixed power output of 5 W. This was done because the flow field near the flame base (0 ≤ z ≤ 15 mm above the burner exit) was strongly affected by acoustic excitation. In the experiments, SEM was employed to analyze the fabrication of carbon nanomaterials. The formation of carbon nanomaterials was greatly affected by acoustic excitation at frequencies near the natural flickering frequency and the acoustically resonant frequency.
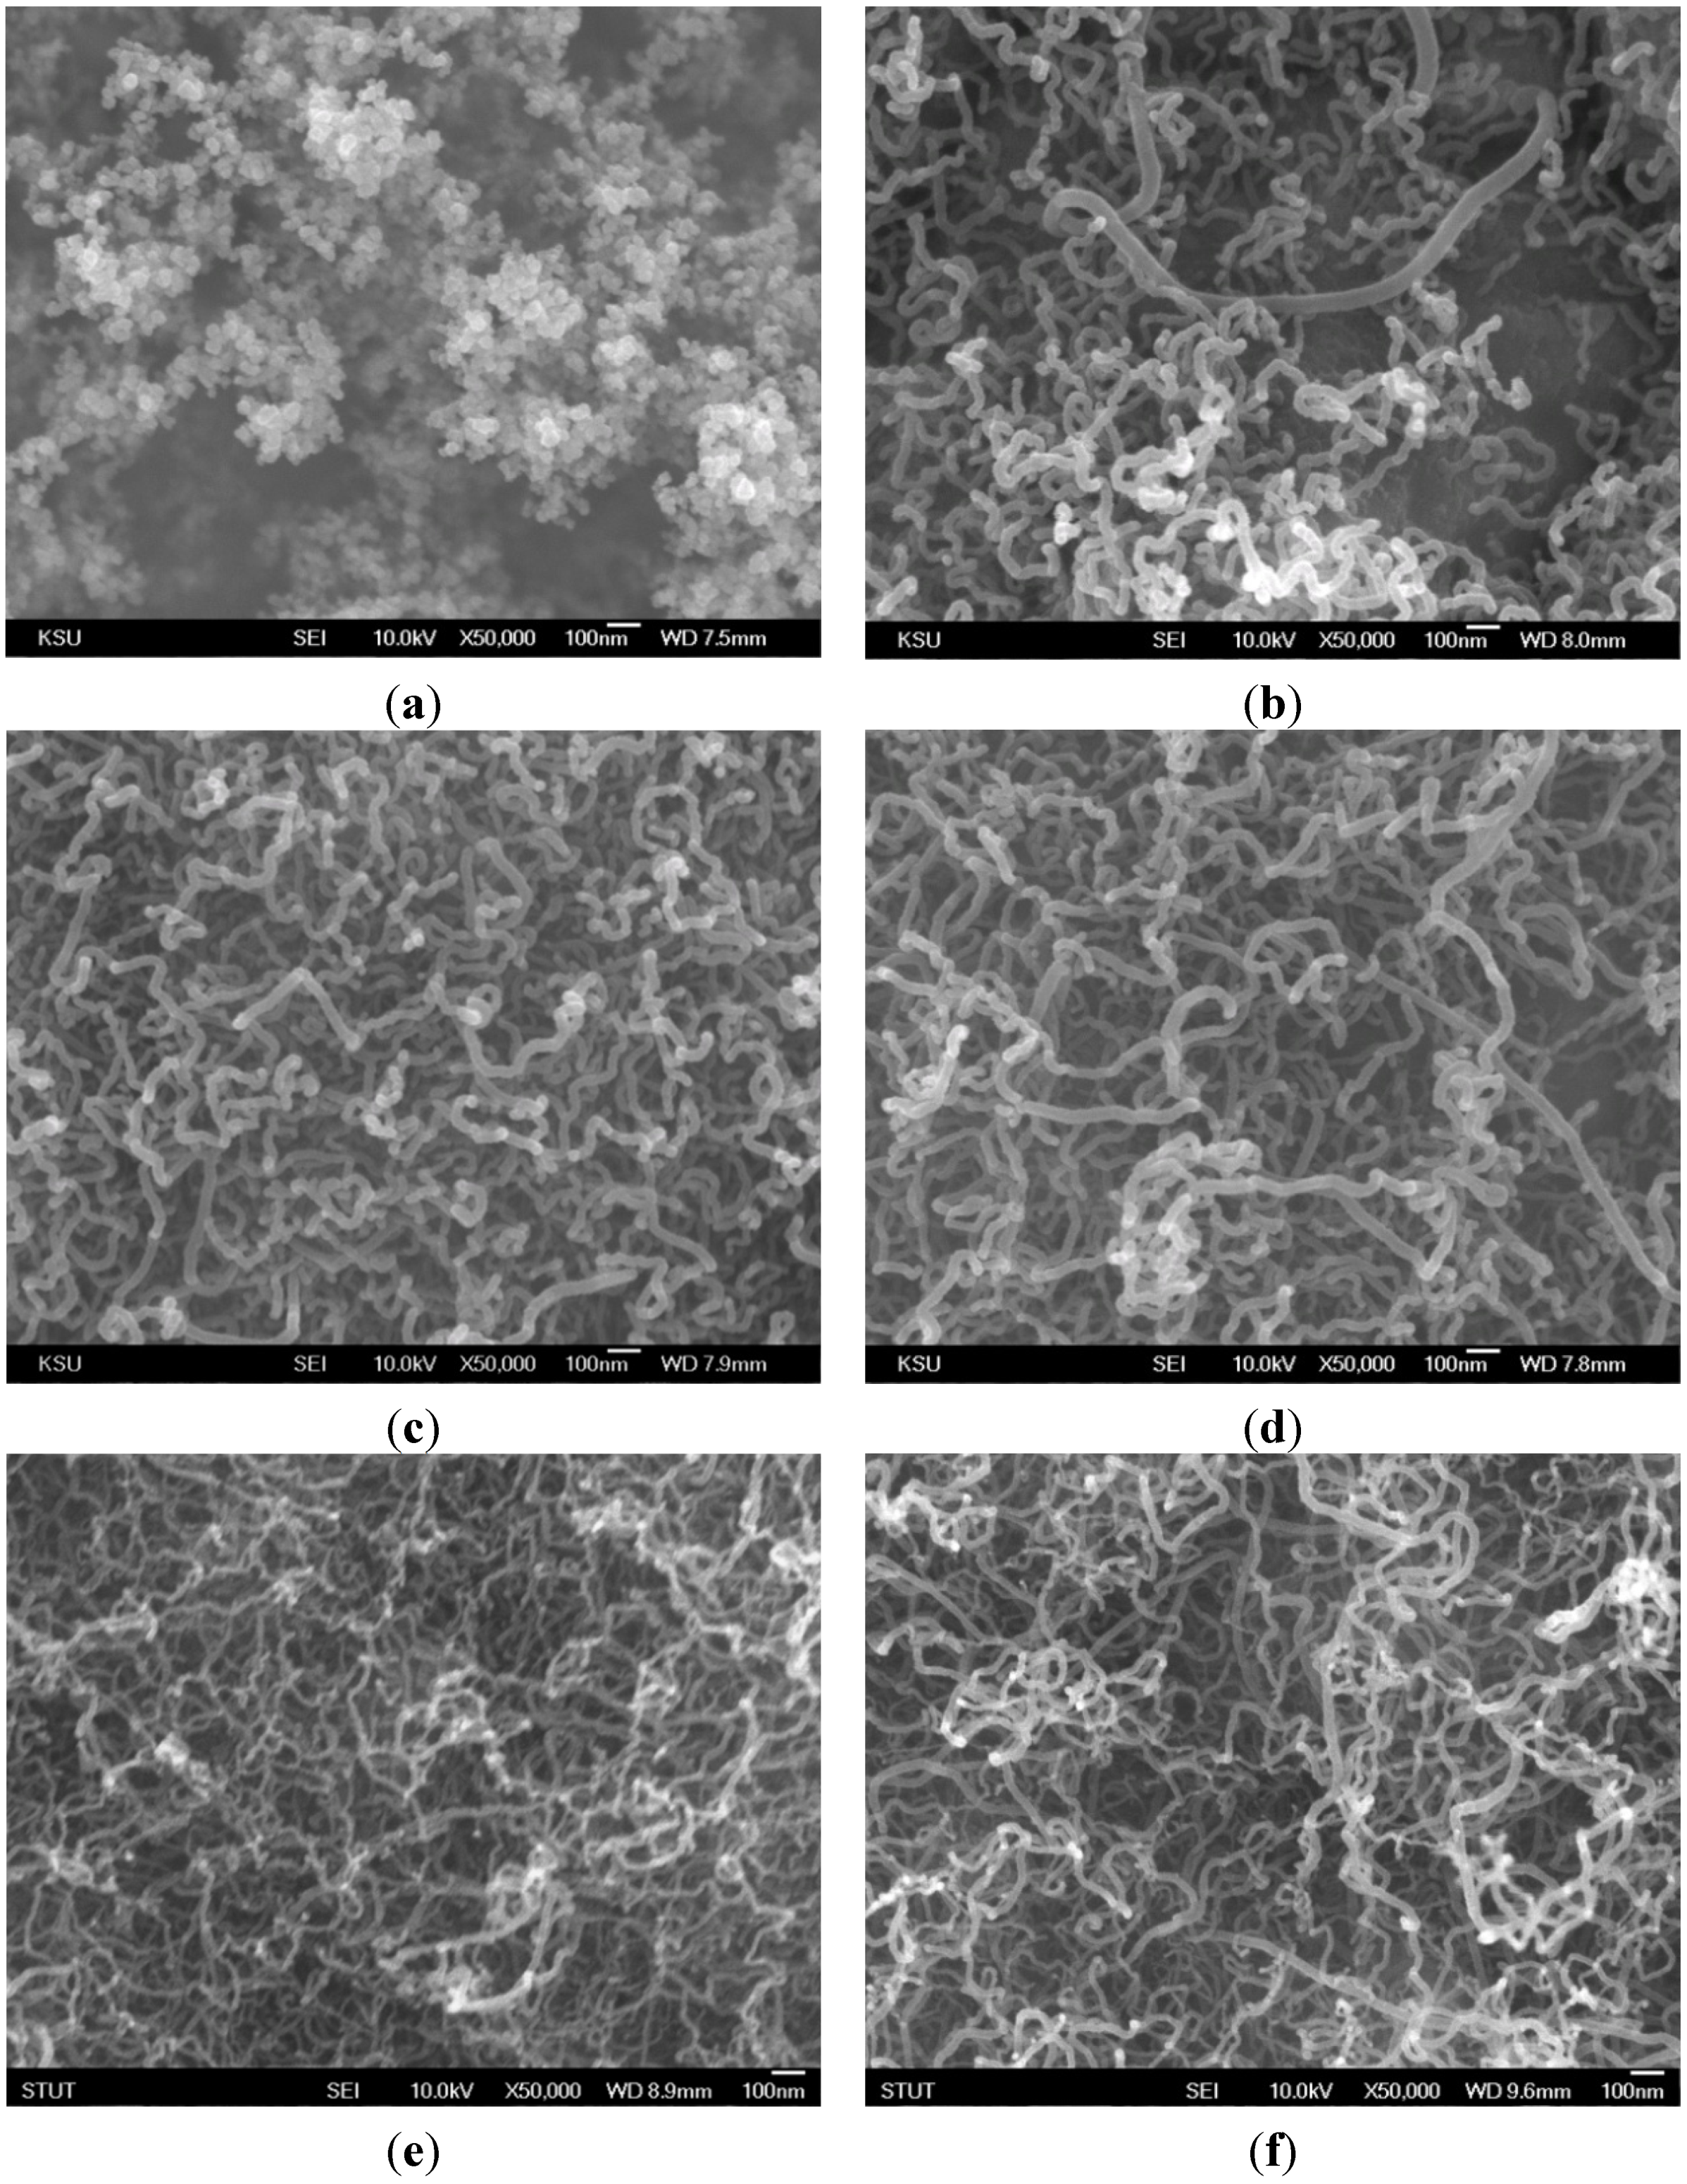
As shown in
Figure 5, there was a large quantity of carbon nanomaterials (piled like bunches of grapes) on the substrate at frequencies near the natural flickering frequency (
f = 20 Hz). The SEM image shows a CNO microstructure. Additionally, a quantity of CNTs was obtained at 70–95 Hz, near the acoustically resonant frequency, at which the gas temperature was 665–830 °C. However, almost no CNOs or CNTs were synthesized at other frequencies due to low temperature or a lack of carbon sources. The enhanced synthesis of carbon nanomaterials was attributed to strong mixing of the fuel and oxidizer due to acoustic excitation at the resonant frequencies. The results verify that the main products were CNOs and CNTs. In Chung
et al. [
13], ethylene was used as the fuel, and only CNOs were fabricated. In this study, methane was employed as the fuel. Only CNOs were synthesized at the natural flickering frequency, and only CNTs were grown at the acoustically resonant frequency. In Chung
et al. [
13], a yellow core flame appeared at both the natural flickering frequency and the acoustically resonant frequency. In contrast, in the present study, yellow and blue core flames were observed at the natural flickering frequency and the acoustically resonant frequency, respectively. The flame structure affected the formation of carbon nanomaterials. It is noteworthy that CNOs were synthesized in a sooty yellow core flame, whereas CNTs were fabricated in a blue core flame. The slender and luminous core flame led to good synthesis of carbon nanostructures due to a favorable environment temperature and a high carbon precursor concentration.
Figure 5.
SEM images of carbon nanomaterials synthesized at z = 10 mm for f values of (a) 20; (b) 70; (c) 80; (d) 85; (e) 90; and (f) 95 Hz.
Figure 5.
SEM images of carbon nanomaterials synthesized at z = 10 mm for f values of (a) 20; (b) 70; (c) 80; (d) 85; (e) 90; and (f) 95 Hz.
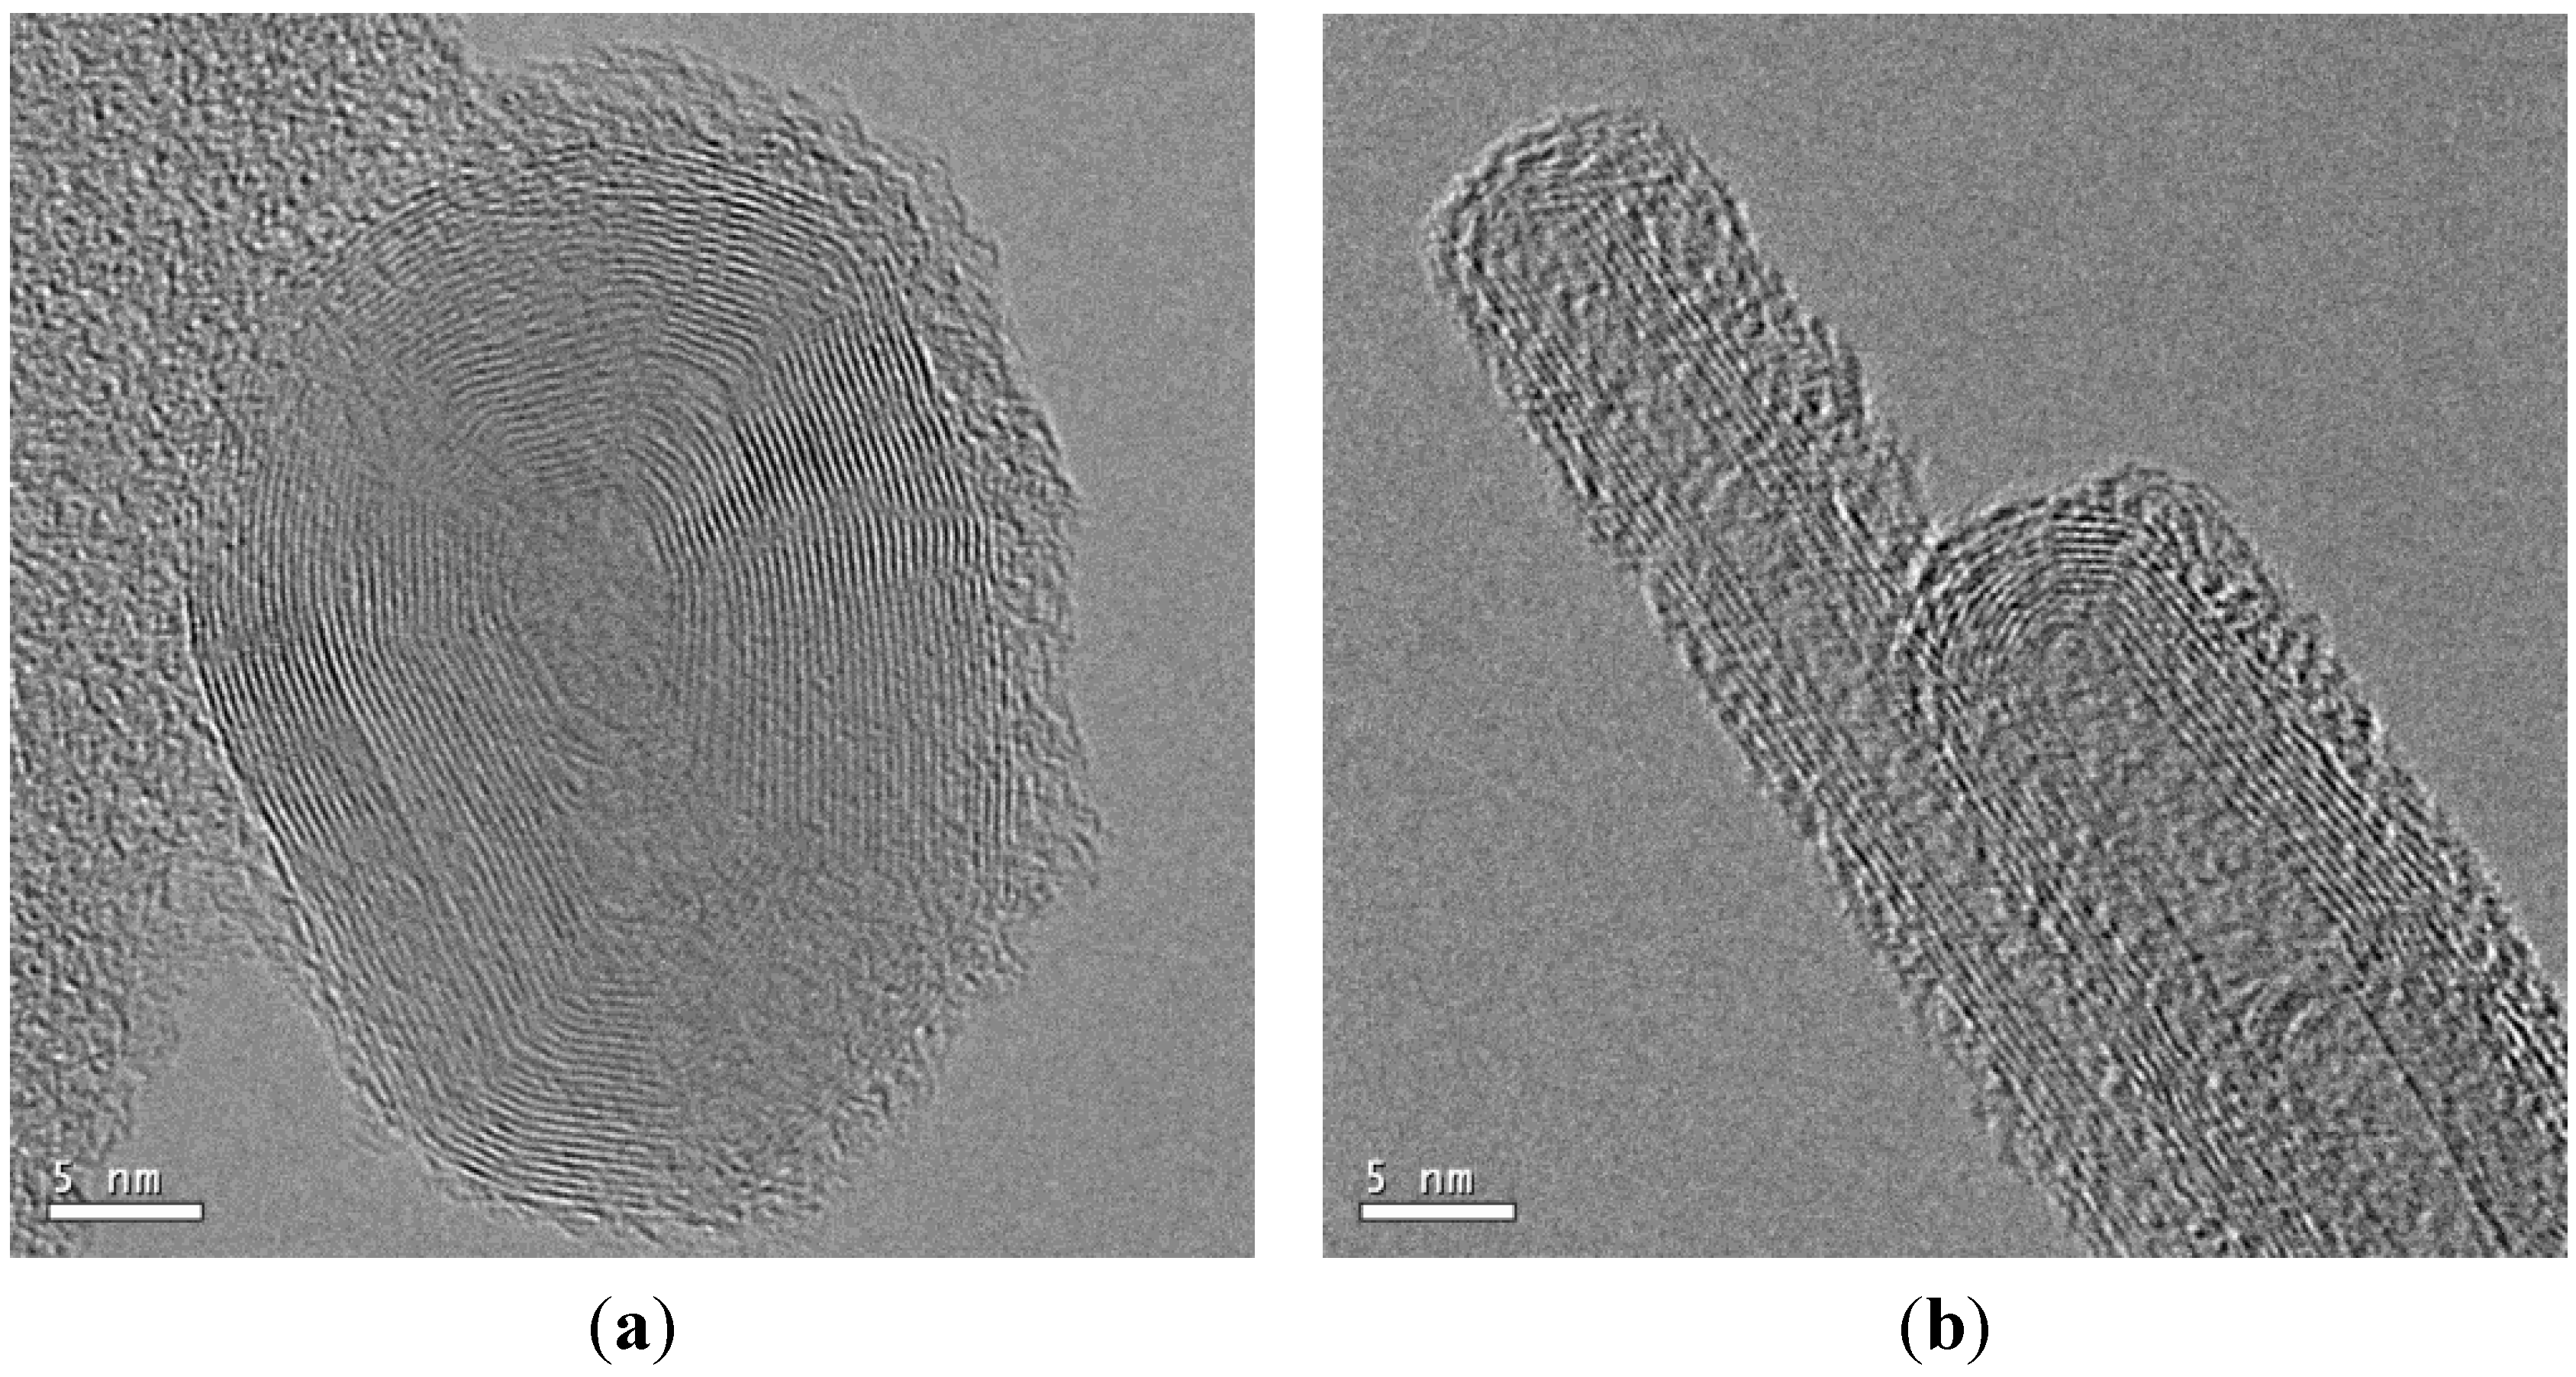
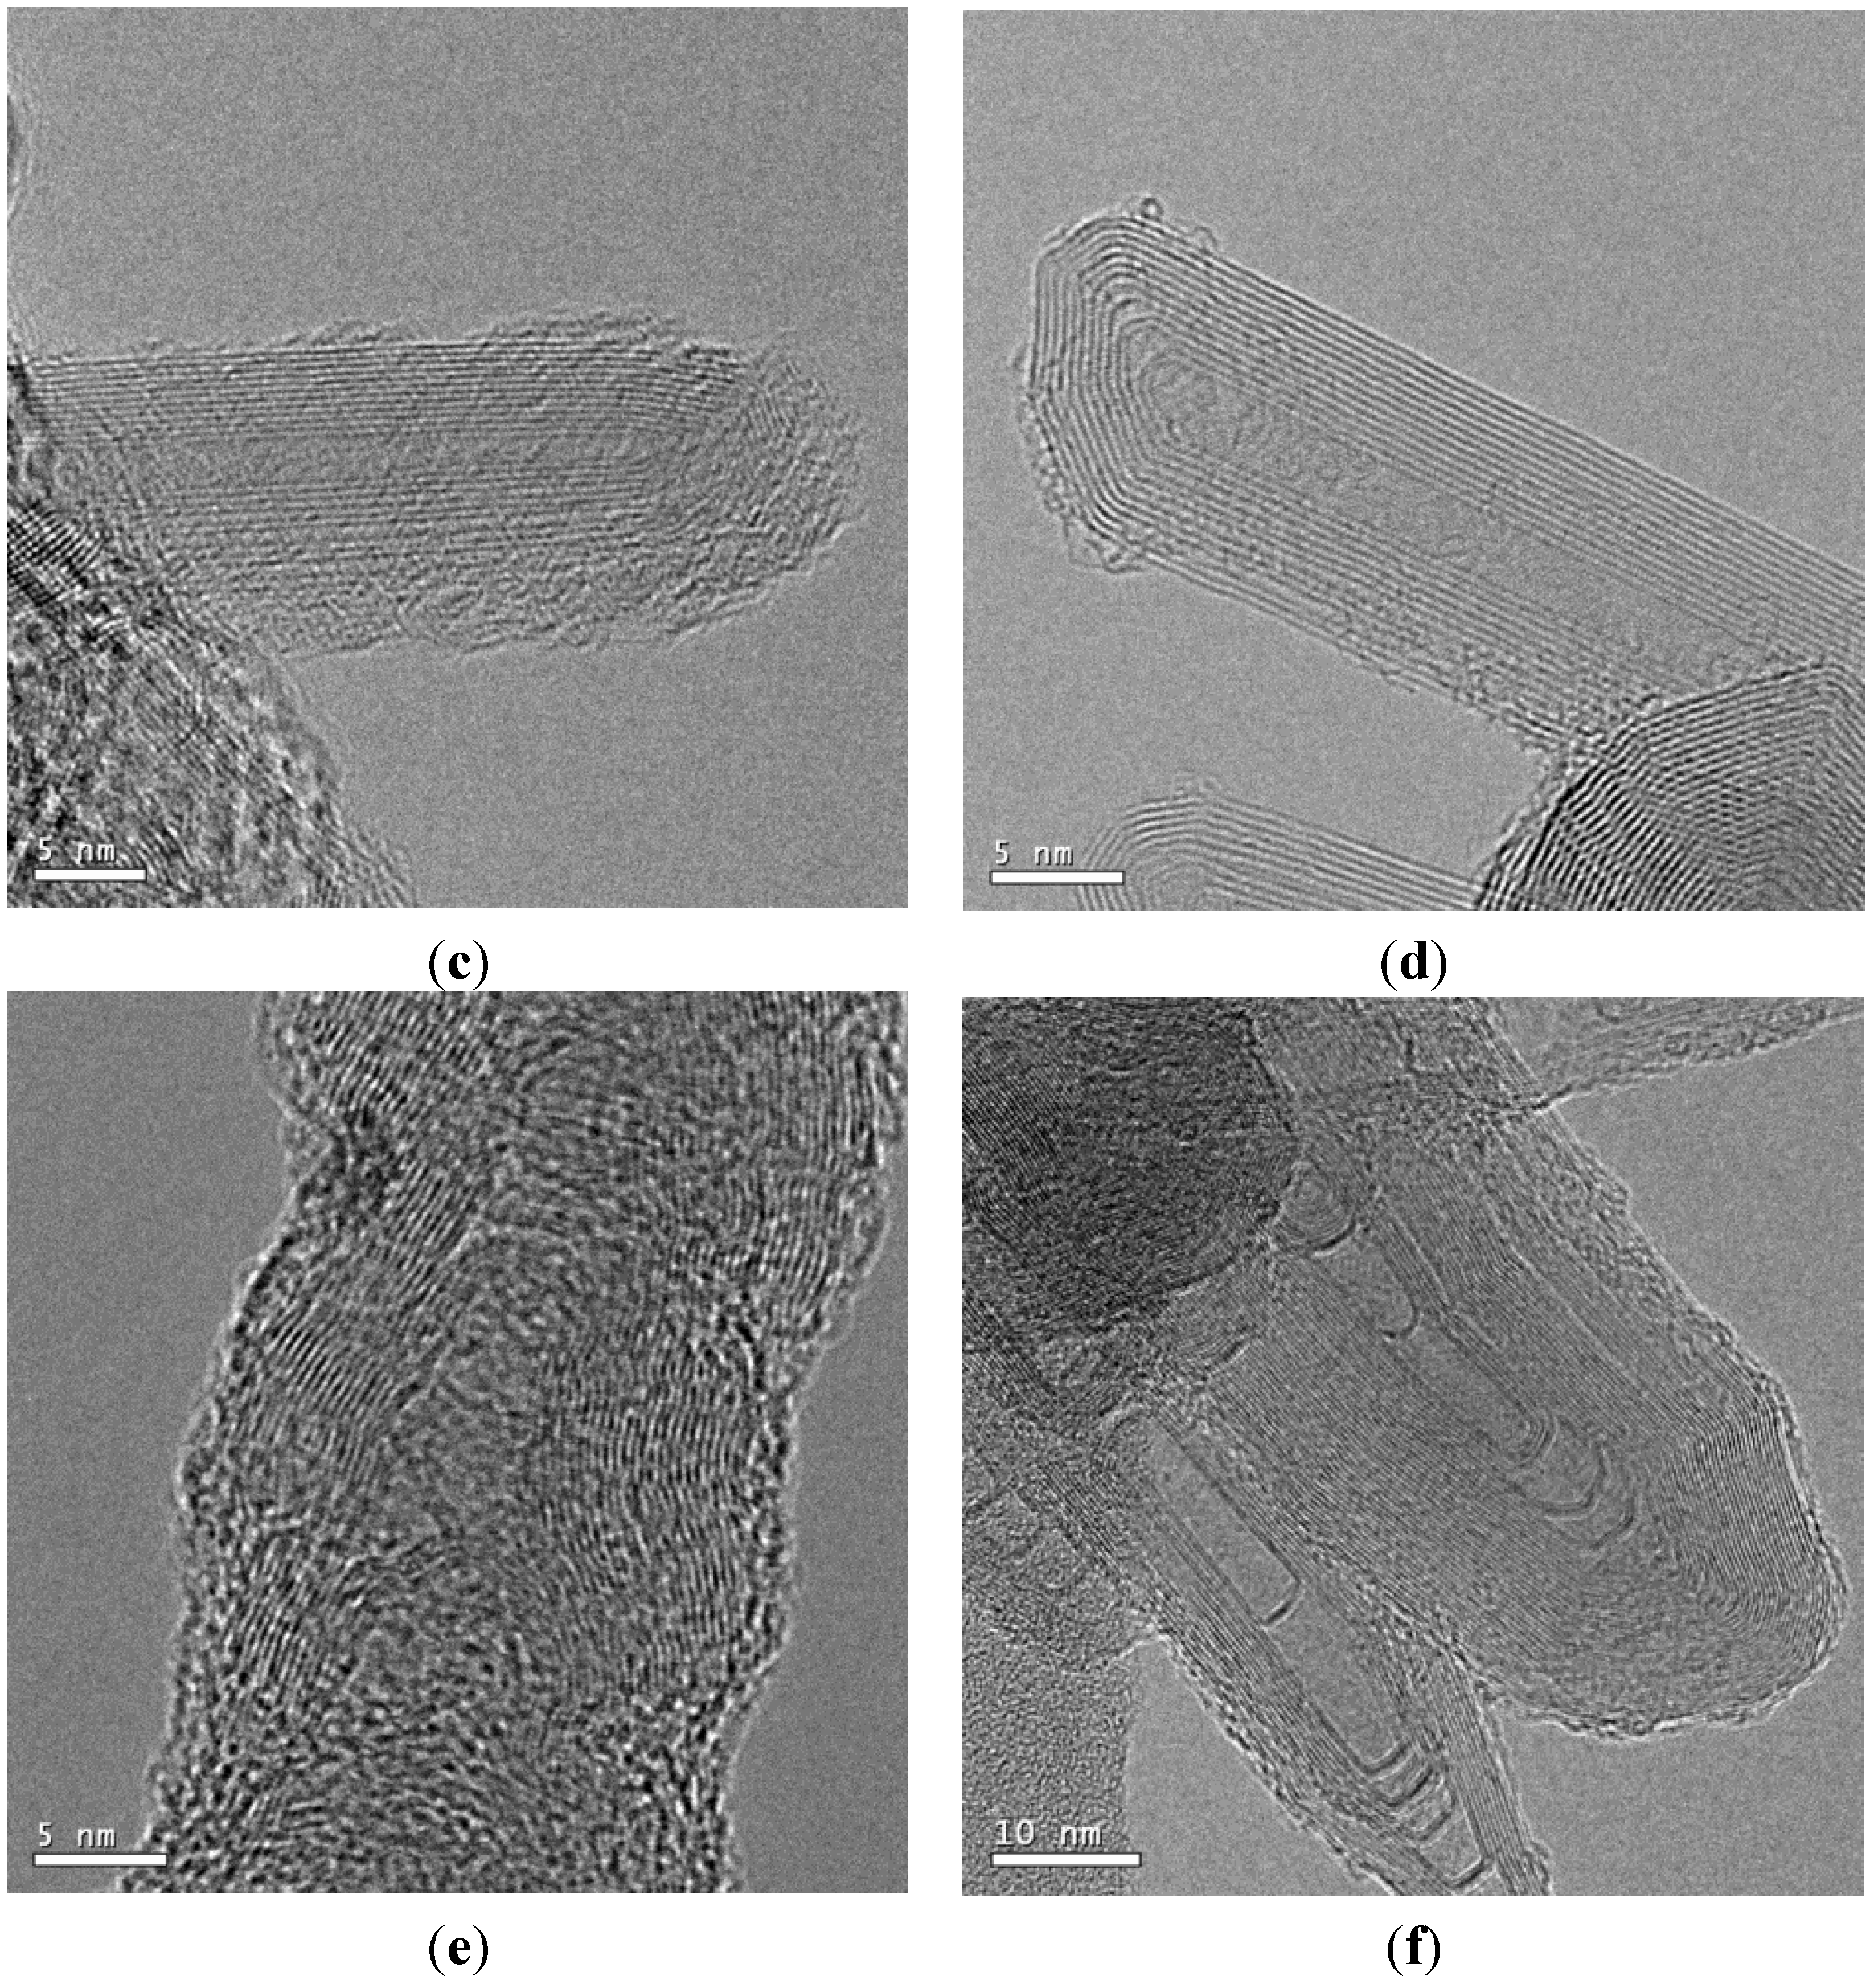
Figure 6 shows TEM images of carbon nanomaterials synthesized at
z = 10 mm for
f = 20, 70, 80, 85, 90, and 95 Hz.
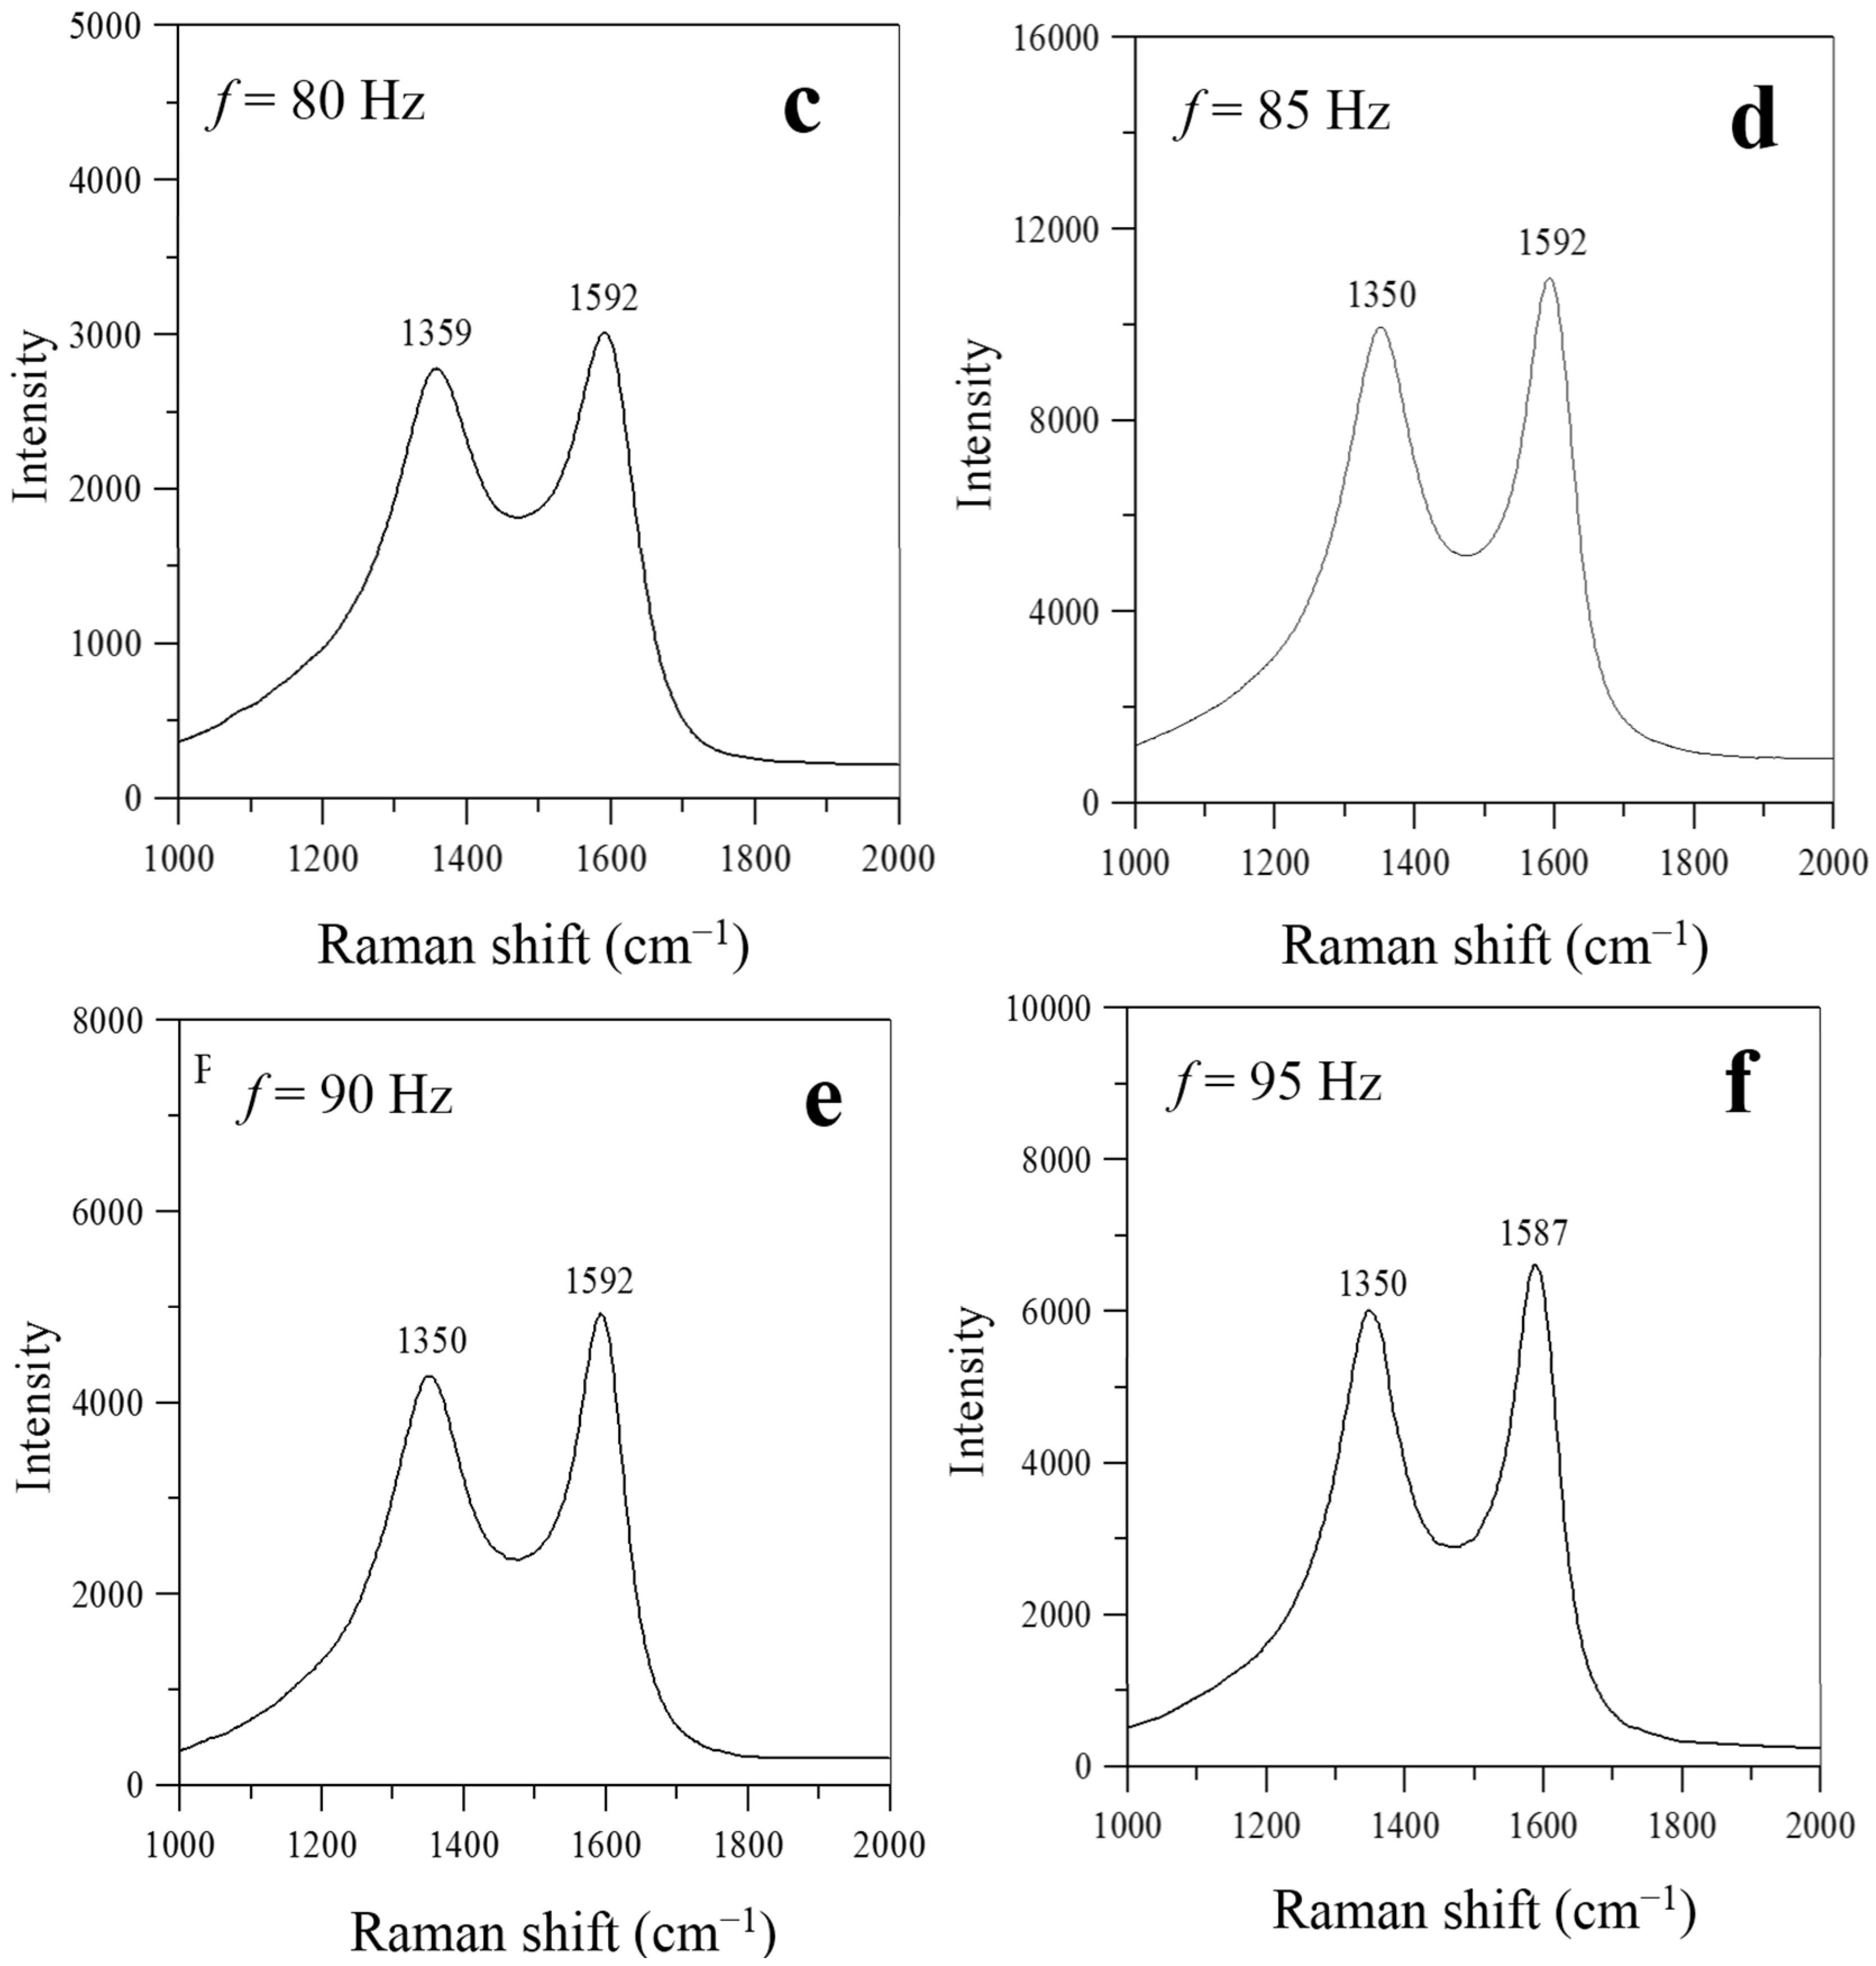
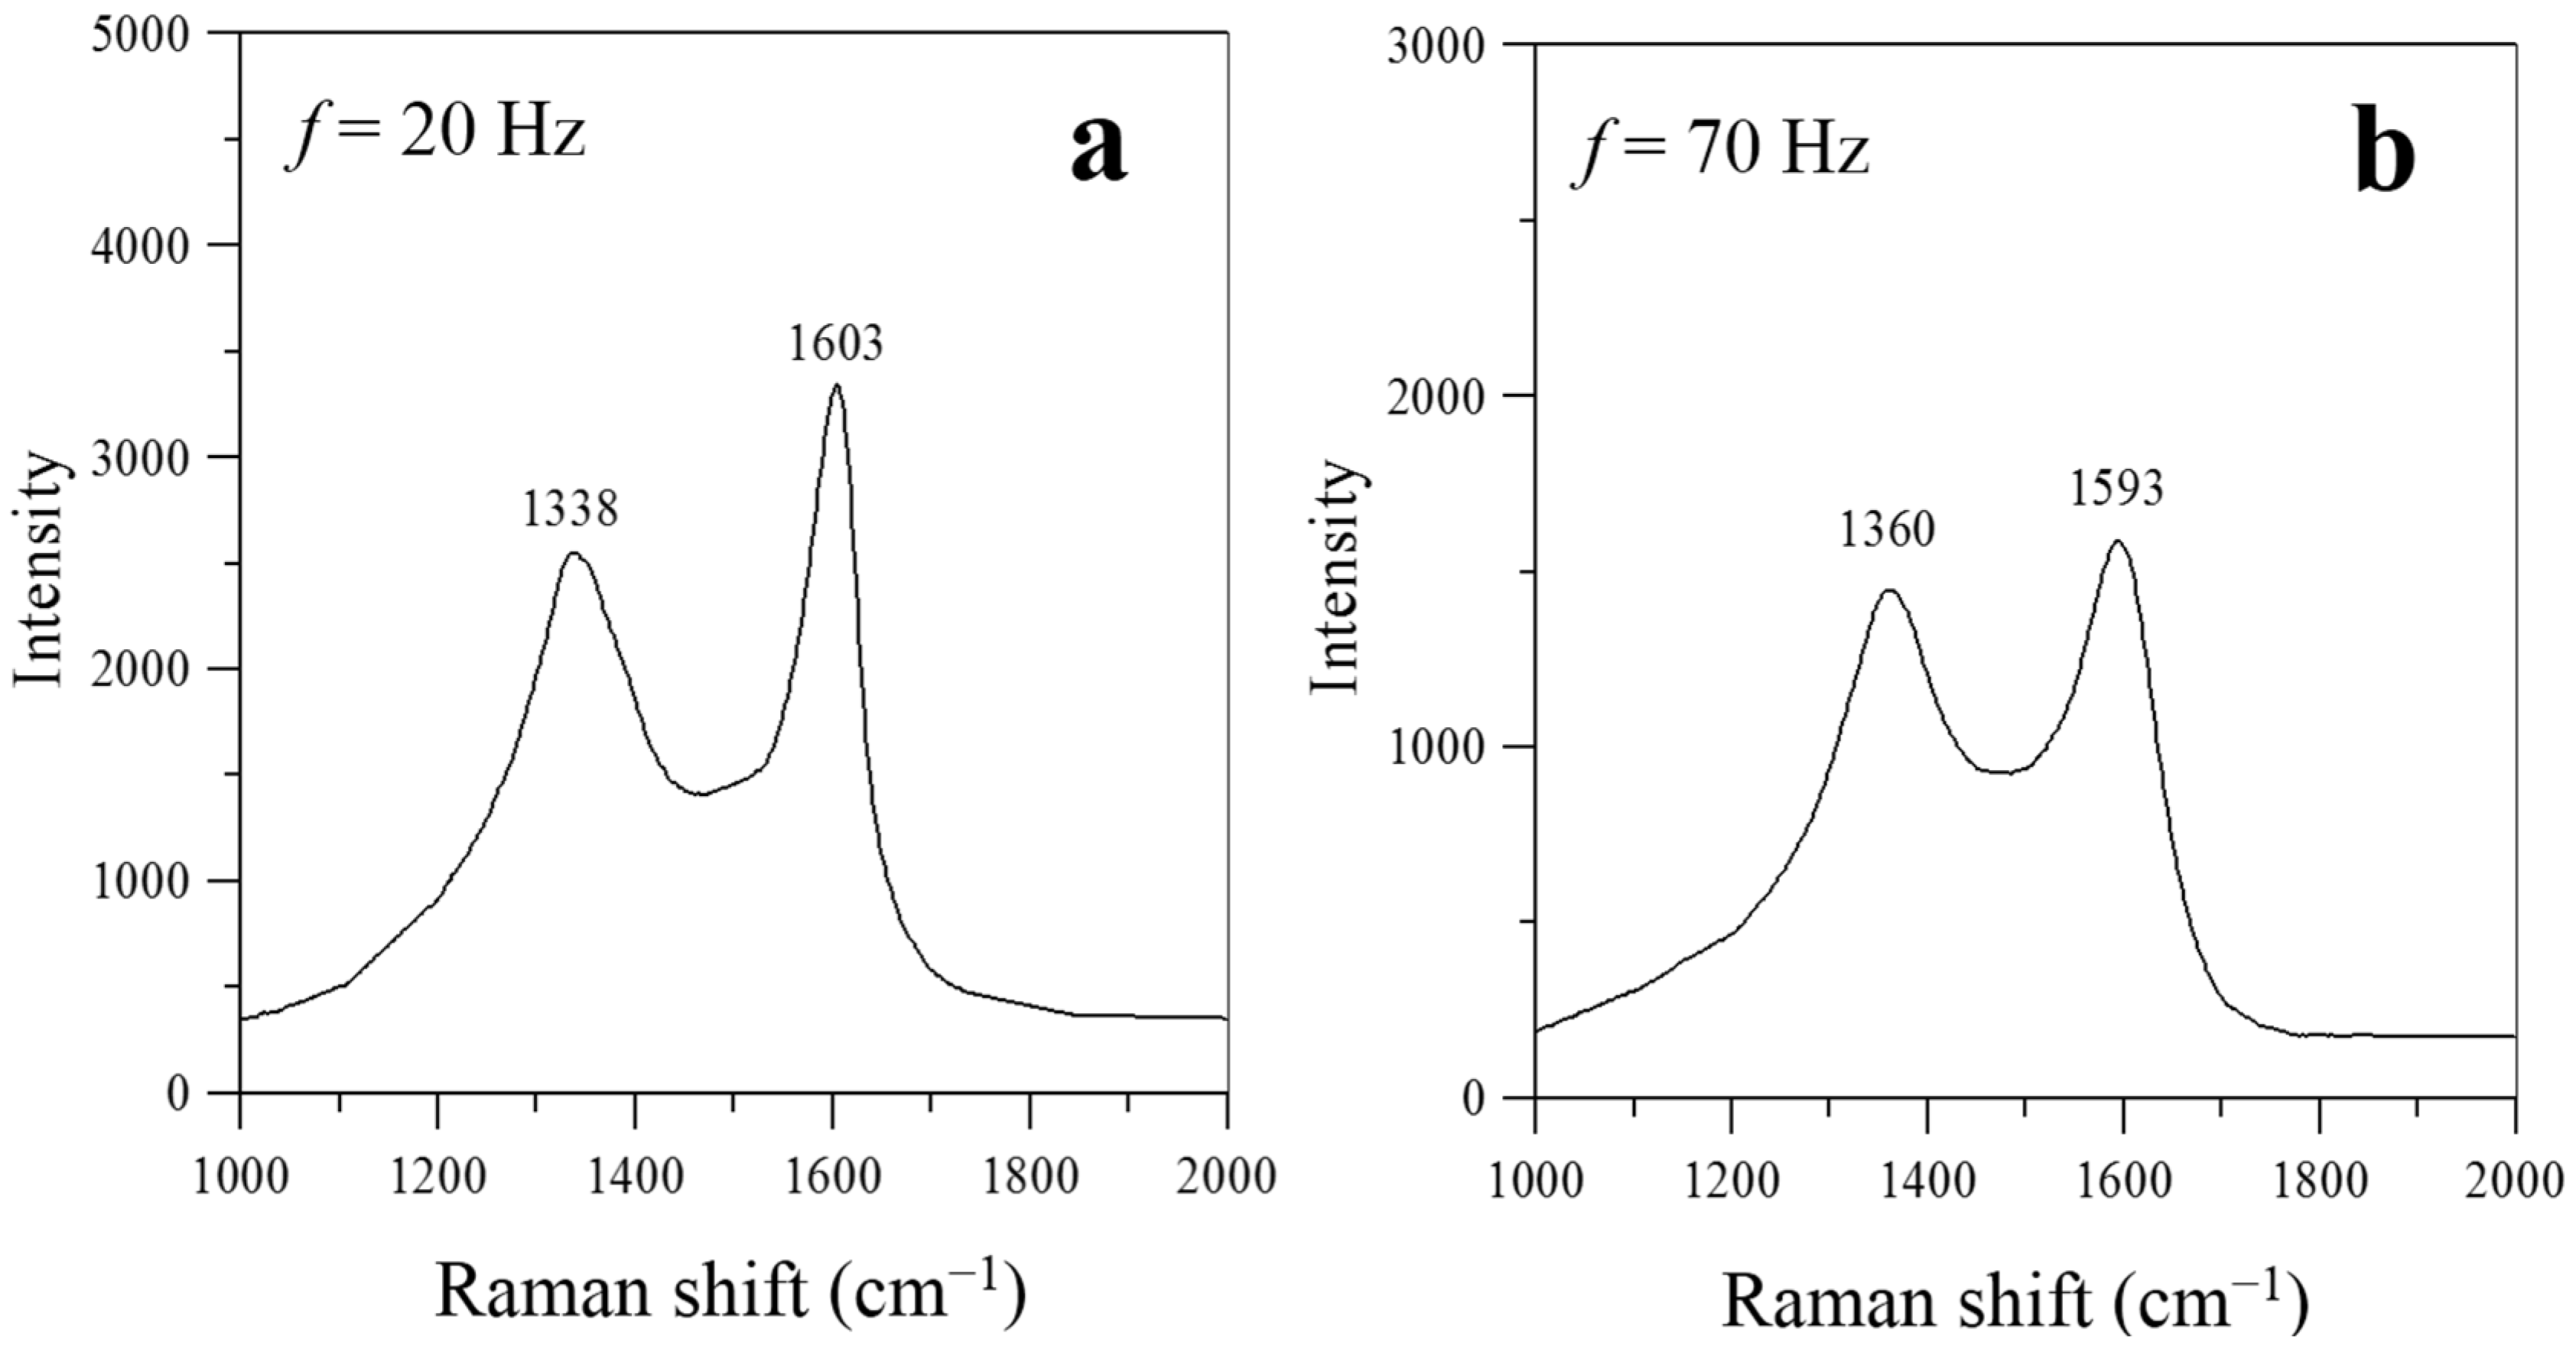
Figure 7 shows Raman spectra of carbon nanomaterials synthesized at
z = 10 mm for
f = 20, 70, 80, 85, 90, and 95 Hz. As shown in
Figure 6a, a typical spherical CNO, which consists of a concentric arrangement of carbon layers, with a diameter of about 30 nm formed at
f = 20 Hz. It had a hollow core wrapped in layers of well-crystallized graphitic sheets (32 layers). Similarly, the inter-layer spacing of the CNO was about 0.34 nm, which is consistent with the Raman spectrum (shown in
Figure 7a). Two different types of CNT were found in the deposit materials on the Ni substrate.
Figure 6c,d show HR-TEM images of CNTs with a straight and tubular structure, and
Figure 6e,f show CNTs with a bamboo-like structure.
Figure 6b shows that tubular and bamboo-like structures can co-exist. It has been suggested that spherical catalyst particles catalyze the formation of straight and tubular CNTs without any internal compartment caps, whereas non-spherical catalyst particles tend to form bamboo-like CNTs with an internal compartment cap [
13,
17].
As shown in
Figure 7, two prominent peaks, at ~1590 cm
−1 (G-band) and ~1330 cm
−1 (D-band), respectively, appear in the Raman spectra at frequencies near the natural flickering frequency (
f = 20 Hz) or the acoustically resonant frequency (
f = 70–95 Hz). No prominent peaks of G- and D-bands were observed simultaneously in the Raman spectra for the flame without acoustic excitation (
f =0 Hz) and for the flames experiencing non-resonant acoustic modulation at frequencies of
f = 30–60 Hz. This is because nearly no carbon nanostructures were produced under these conditions.
Figure 7 also shows that the intensity ratios of the D- and G-bands were lower than one (I
D/I
G < 1) for the flames with acoustic excitation at frequencies close to the natural flickering frequency (
f = 20 Hz) and near the acoustically resonant frequency (
f = 70, 80, 85, 90, and 95 Hz). Therefore, the characteristics of the Raman spectra in
Figure 7 show that the CNOs synthesized at frequencies near the natural flickering frequency and the CNTs synthesized at frequencies near the acoustically resonant frequency had a high degree of graphitization.
Figure 6.
TEM images of carbon nanomaterials synthesized at z = 10 mm for f values of (a) 20; (b) 70; (c) 80; (d) 85; (e) 90; and (f) 95 Hz.
Figure 6.
TEM images of carbon nanomaterials synthesized at z = 10 mm for f values of (a) 20; (b) 70; (c) 80; (d) 85; (e) 90; and (f) 95 Hz.
Figure 7.
Raman spectra of carbon nanomaterials synthesized at z = 10 mm and P = 5 W for f values of (a) 20; (b) 70; (c) 80; (d) 85; (e) 90; and (f) 95 Hz.
Figure 7.
Raman spectra of carbon nanomaterials synthesized at z = 10 mm and P = 5 W for f values of (a) 20; (b) 70; (c) 80; (d) 85; (e) 90; and (f) 95 Hz.


