
Experimental Study on Artificial Cemented Sand Prepared with Ordinary Portland Cement with Different Contents

Abstract
:1. Introduction
2. Experimental
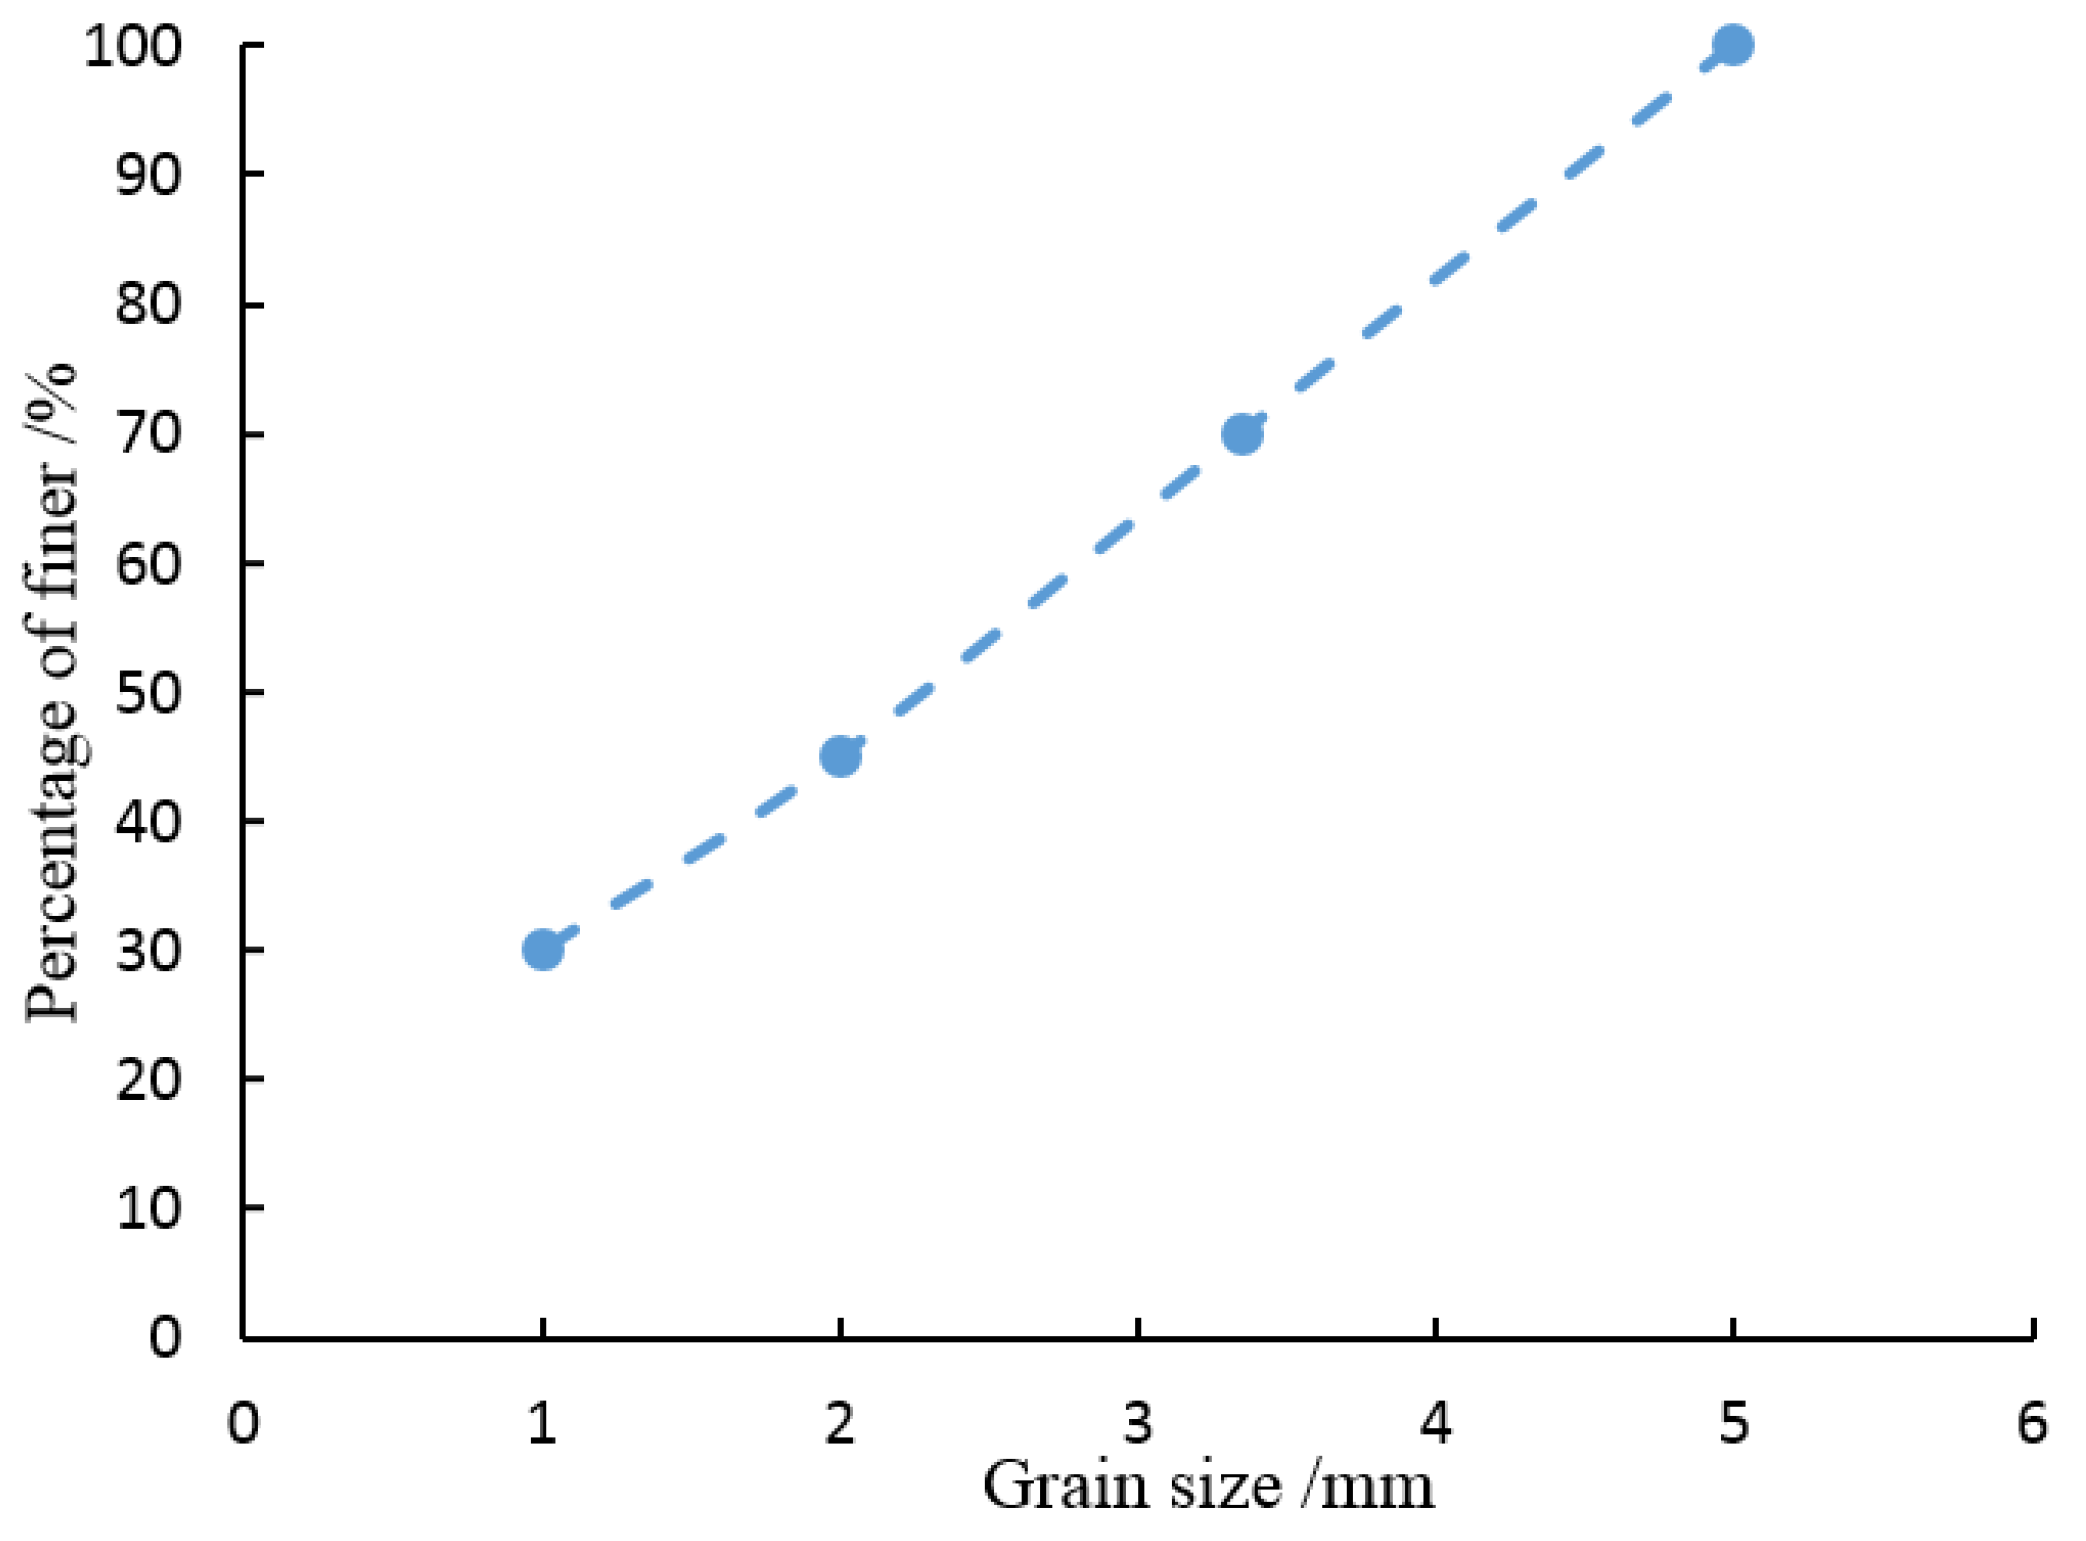
2.1. Raw Materials
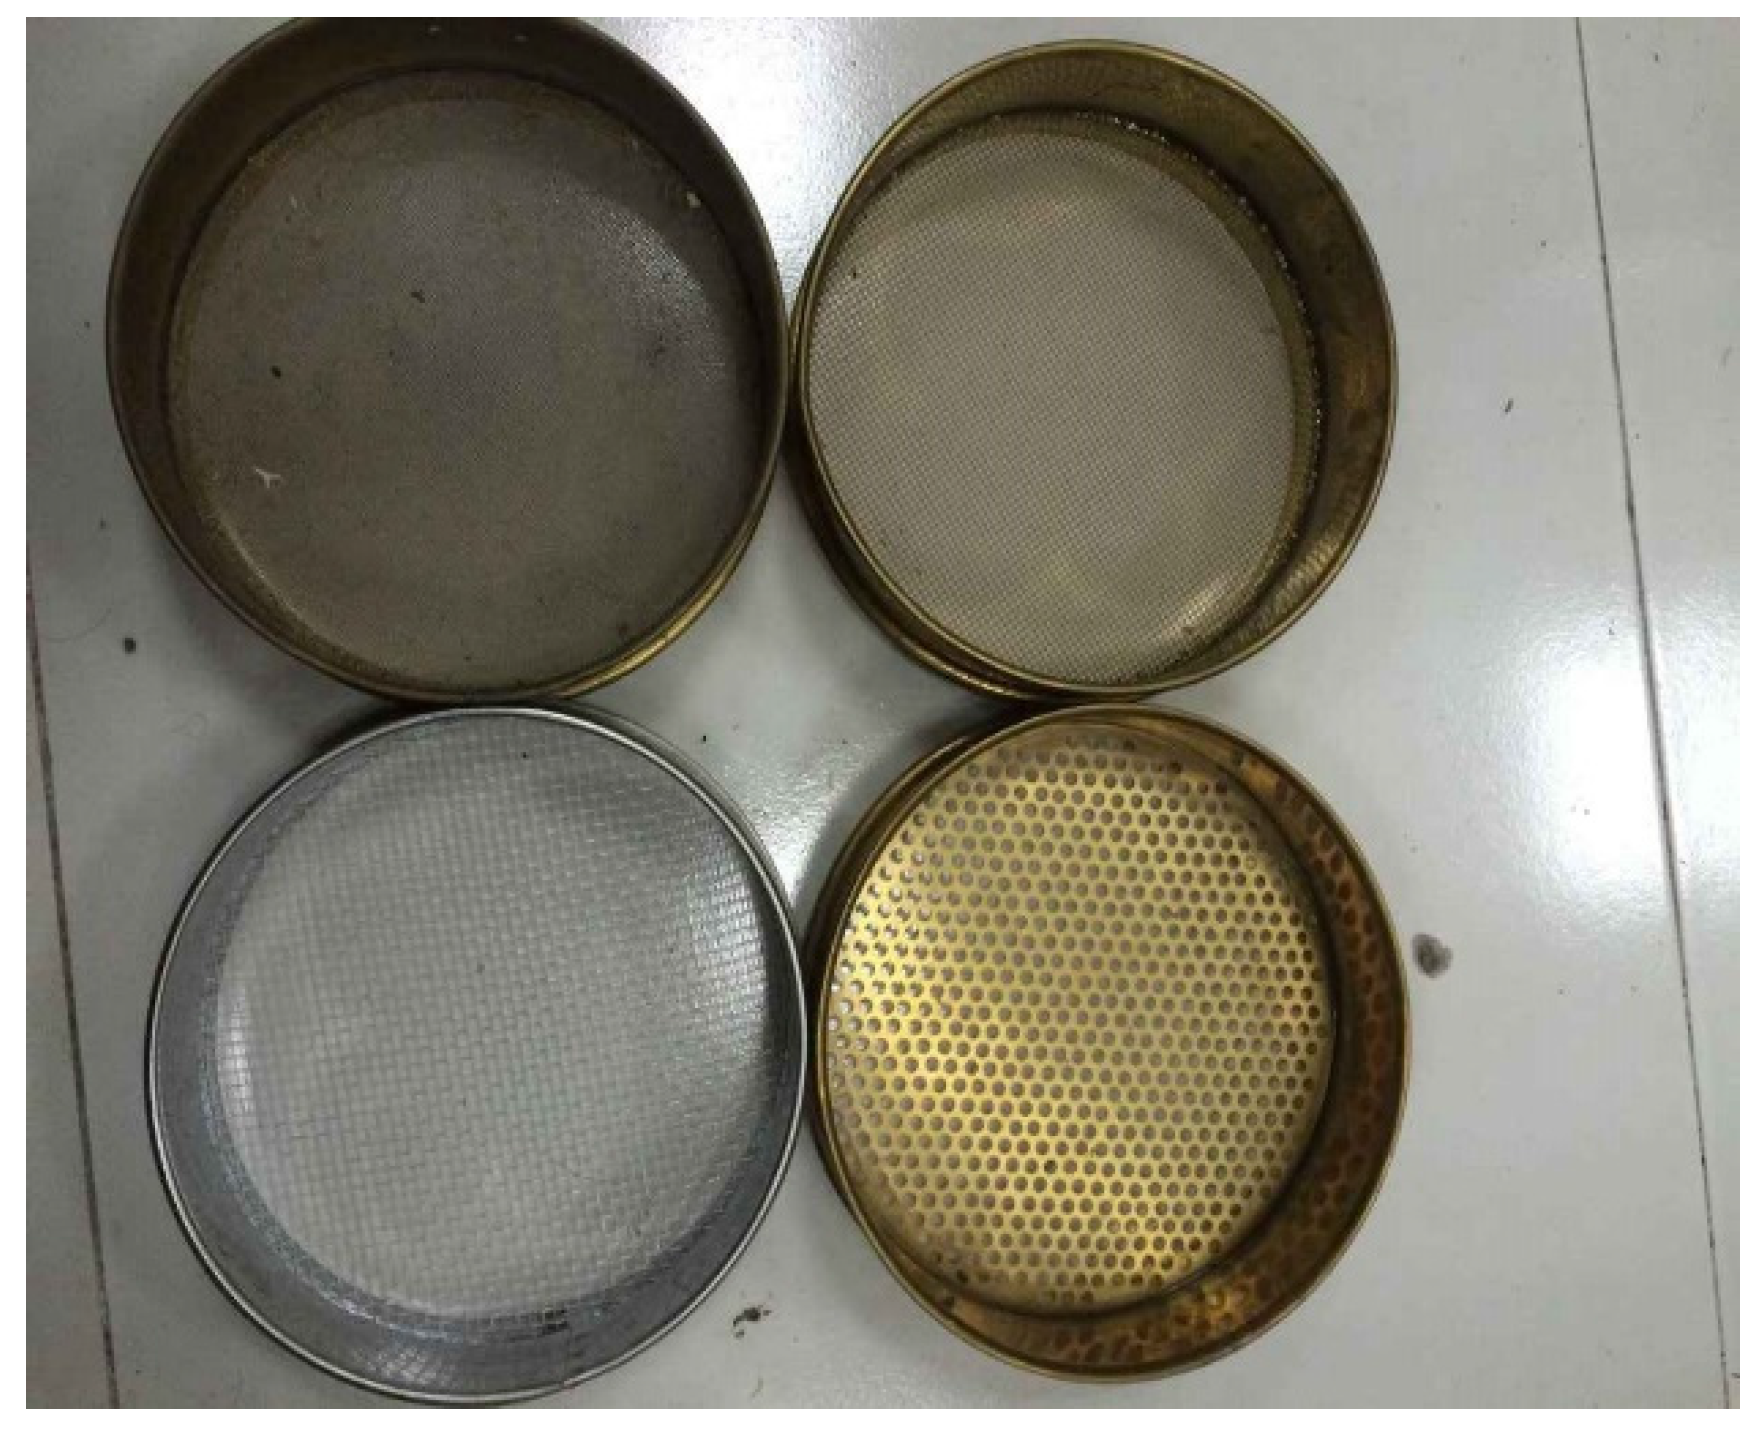
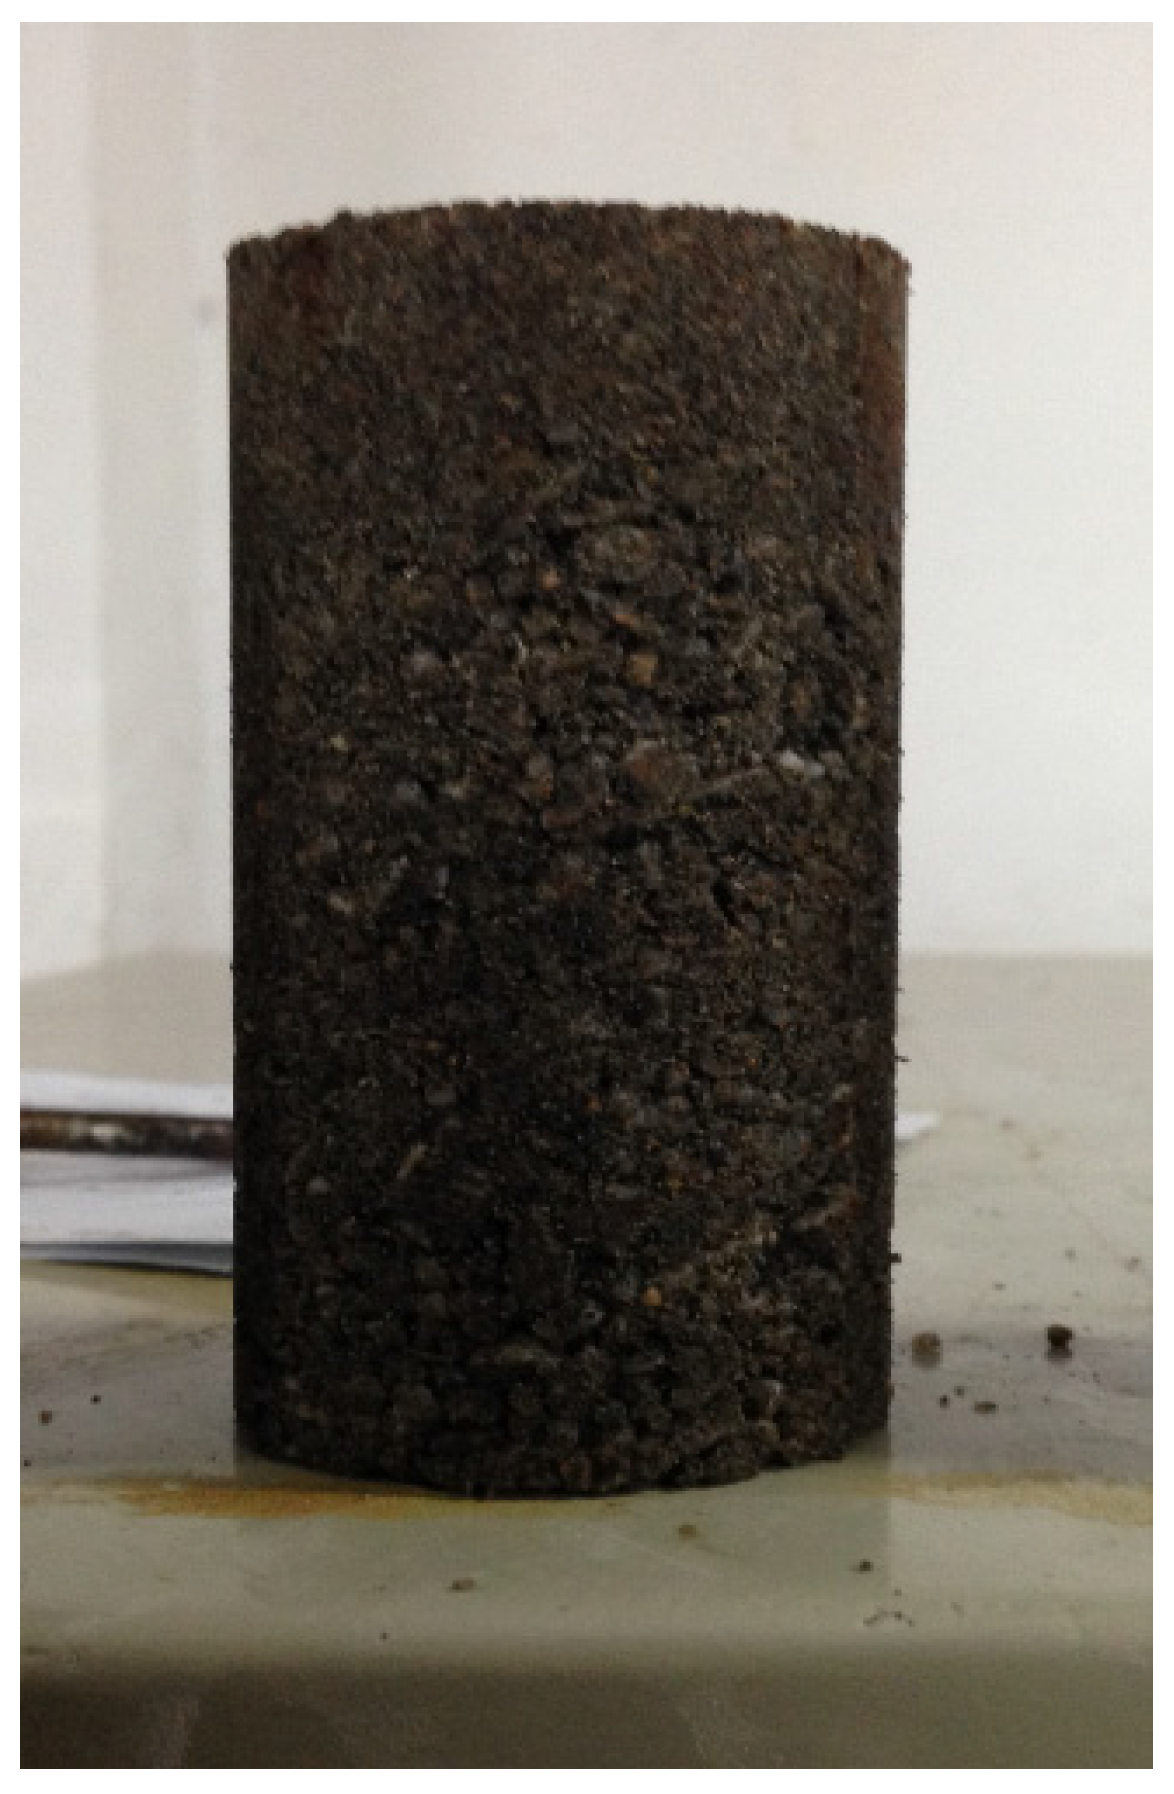
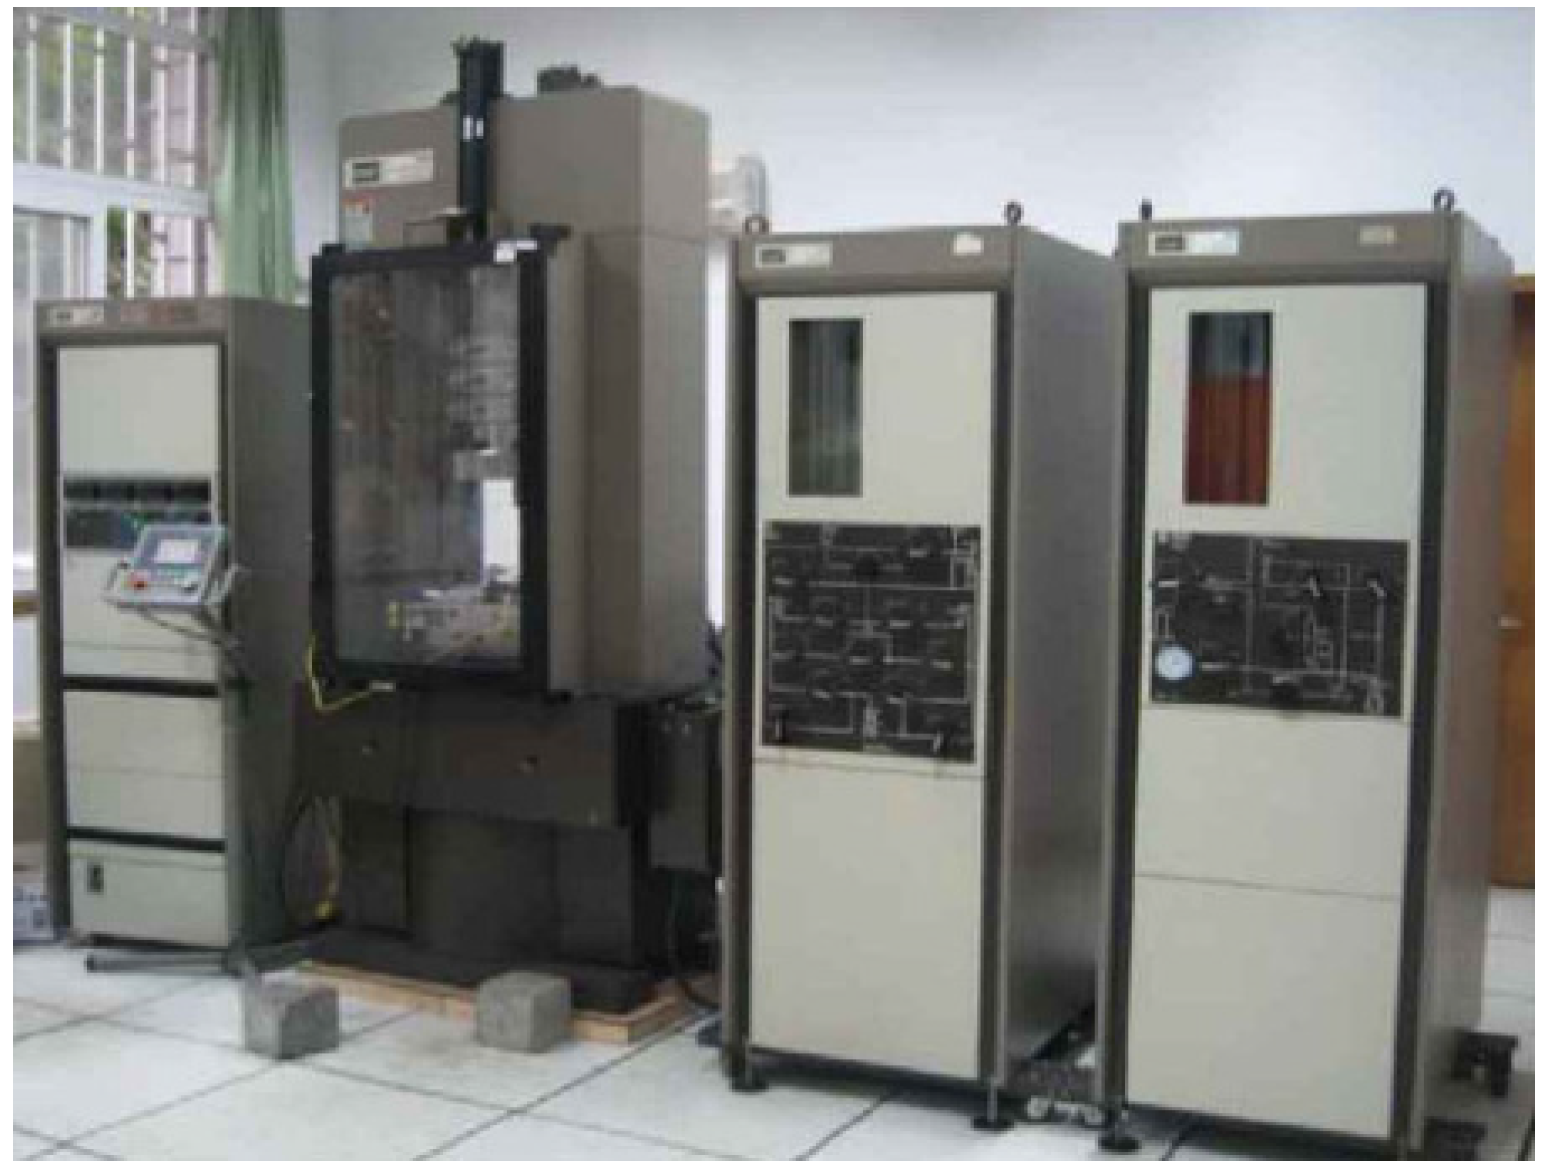
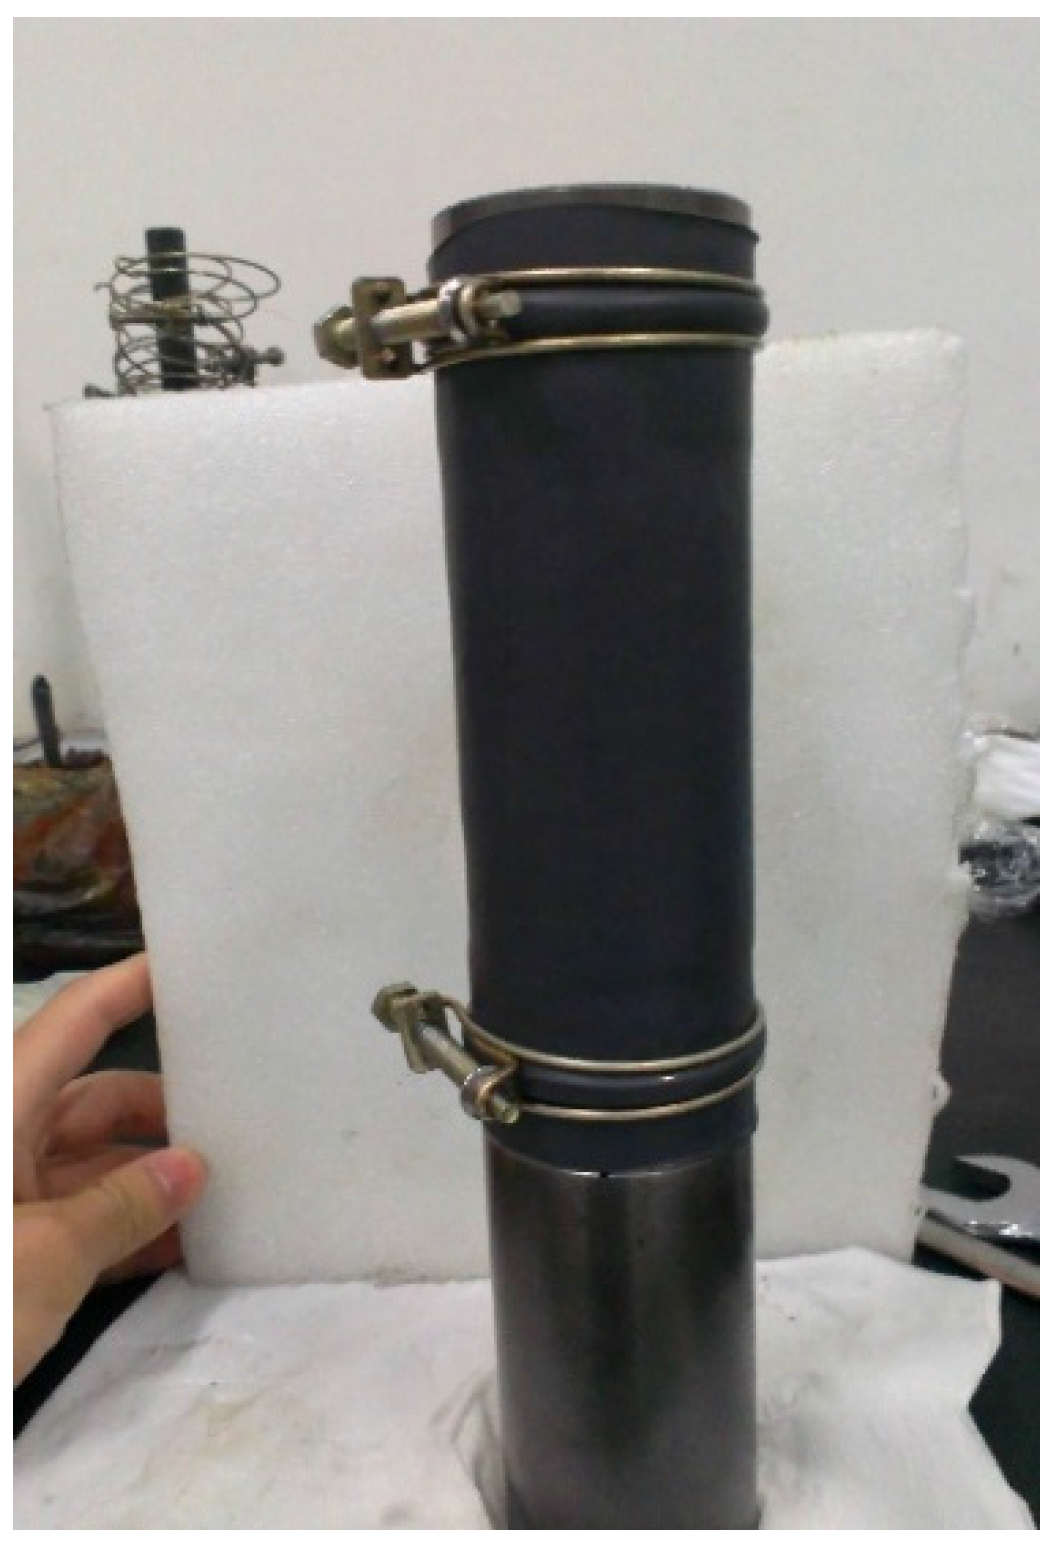
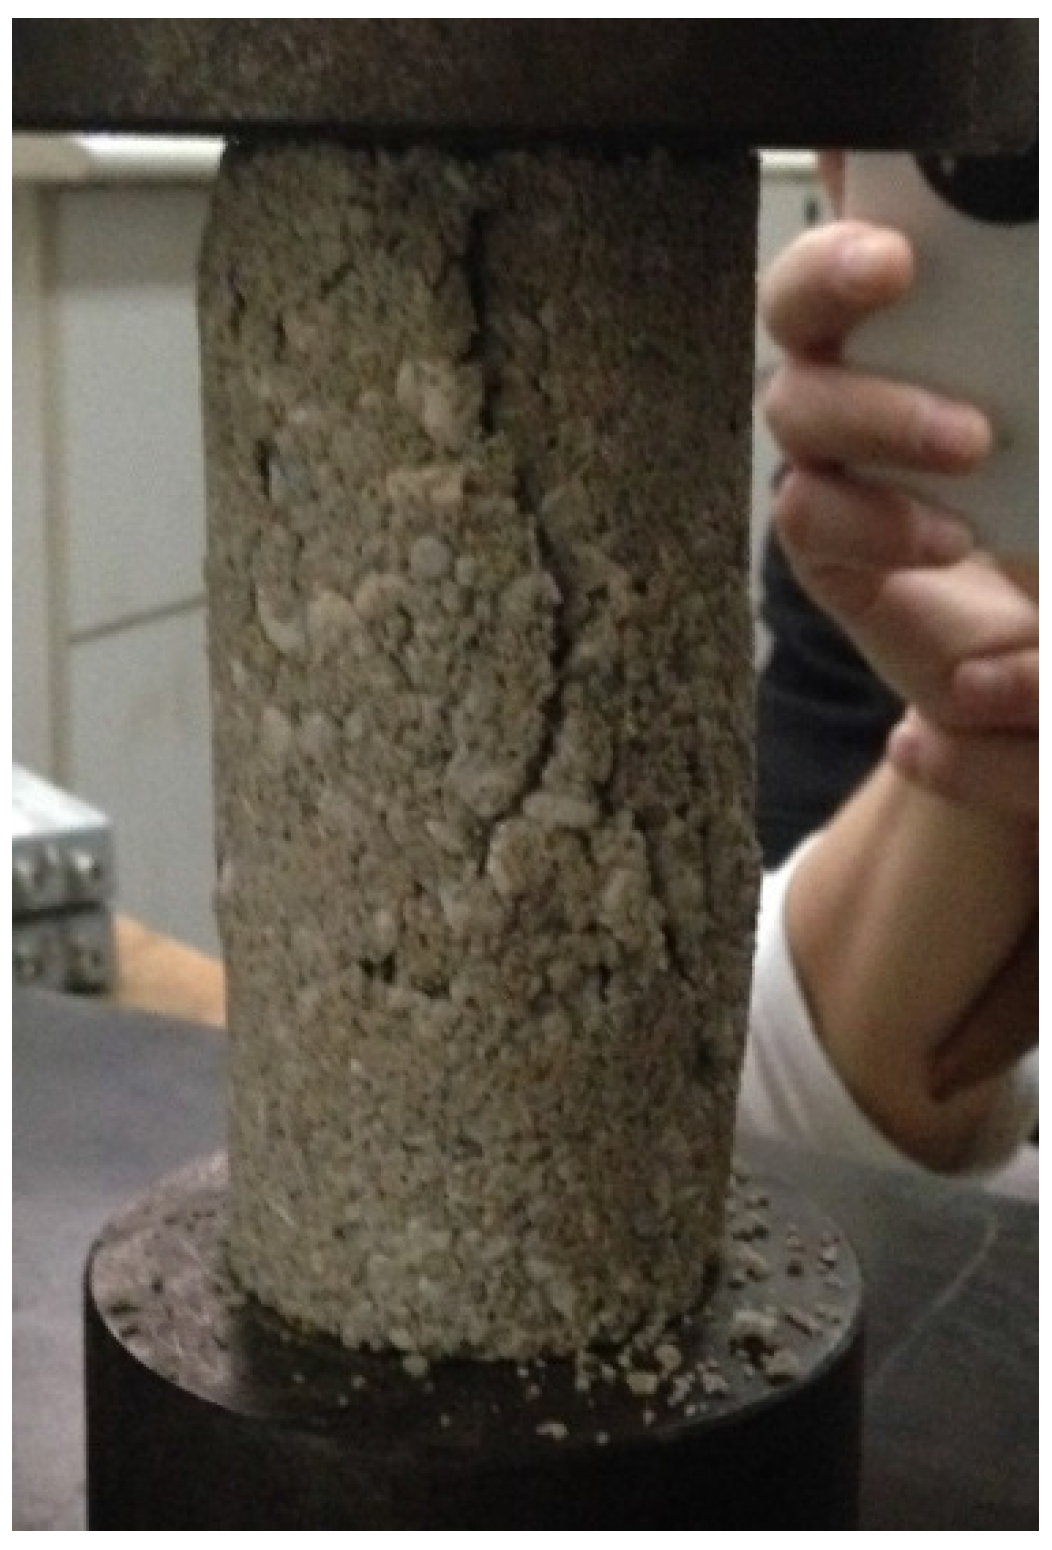
2.2. Sample Preparation

| Relative Density Dr | Dry Density ρd/(g/cm3) | Void Ratio e |
|---|---|---|
| 1.0 | 1.77 | 0.50 |
| 0.8 | 1.58 | 0.62 |
| 0.0 | 1.11 | 0.70 |

| Relative Density Dr | Dry Density ρd/(g/cm3) | Dry Mass (g) | Mass of Quartz Sand (g) | Cv | Mass of Cementing Agent (g) | Mass of Water (g) |
|---|---|---|---|---|---|---|
| 0.8 | 1.58 | 310 | 306.9 | 0.01 | 3.1 | 3.1 |
| 301.0 | 0.03 | 9.0 | 9.0 | |||
| 295.2 | 0.05 | 14.8 | 14.8 | |||
| 287.0 | 0.08 | 23.0 | 23.0 |
2.3. Testing Method
3. Results and Discussion
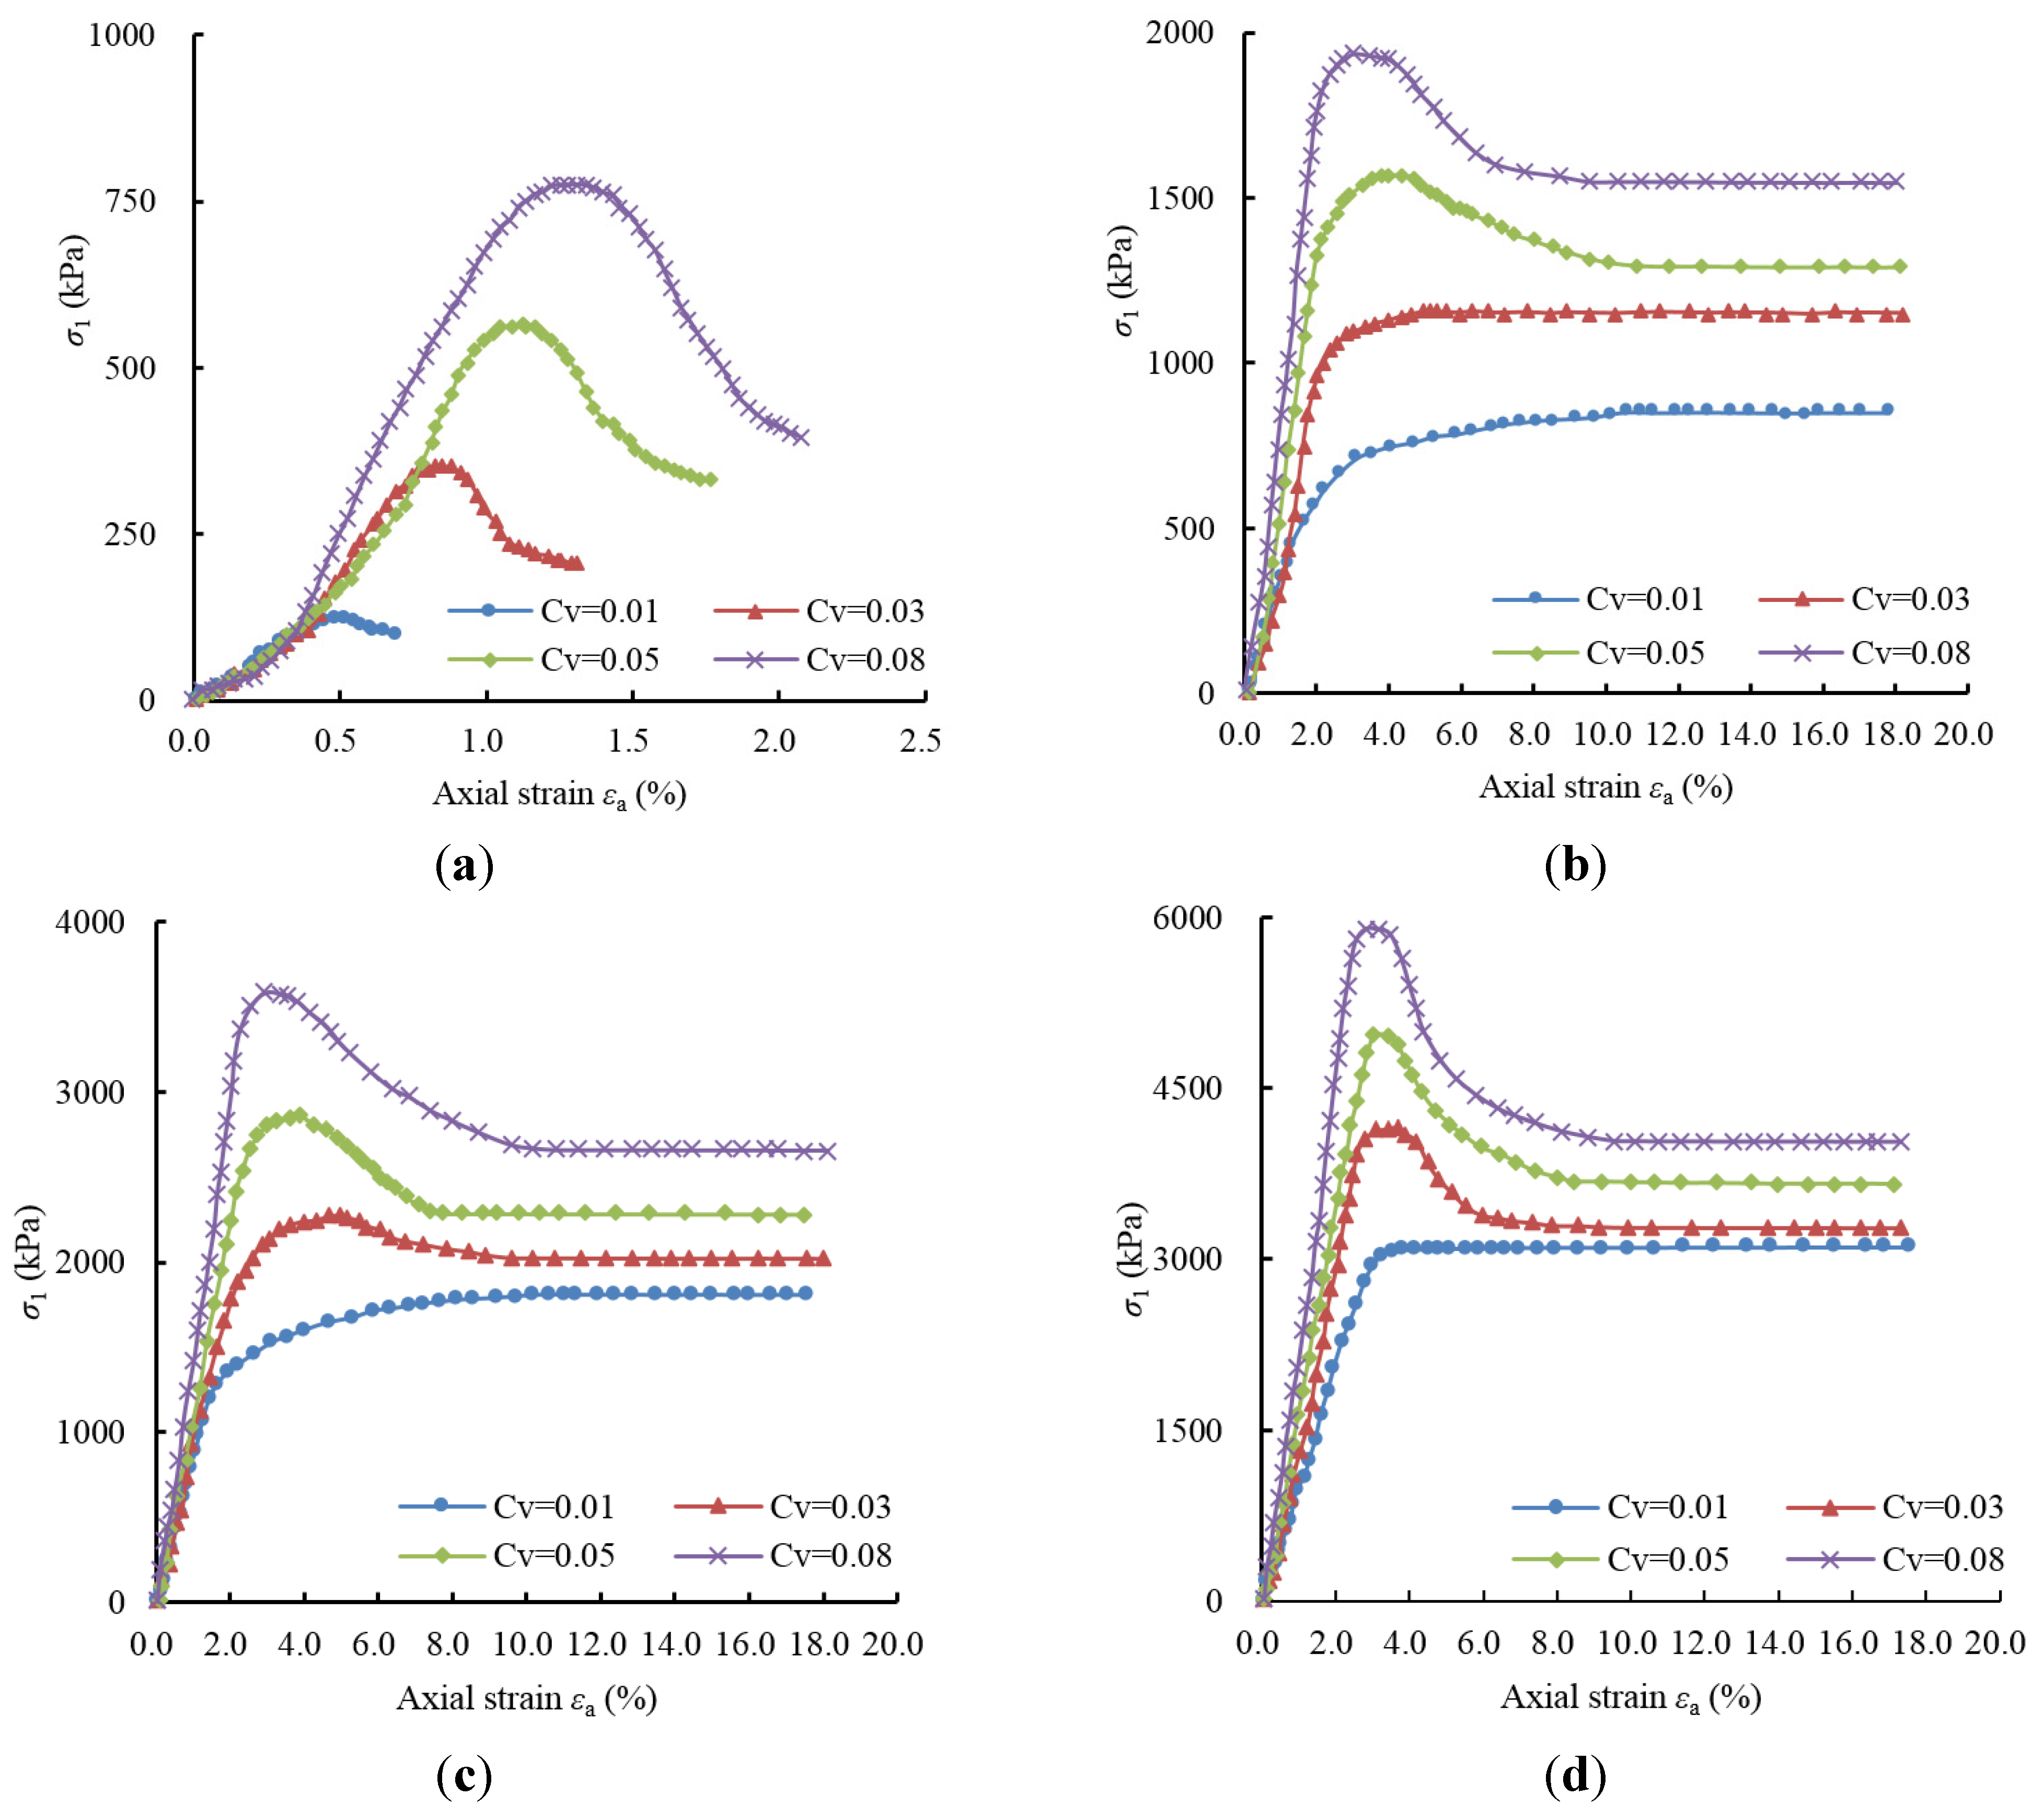
3.1. Stress-Strain Curve

3.2. Relationship between Shear Strength Index and Cementing Agent Content
| Cv | Confining Pressure (MPa) | Peak Stress σ1 (MPa) |
|---|---|---|
| 0.01 | 0.00 | 0.1232 |
| 0.25 | 0.8518 | |
| 0.50 | 1.8123 | |
| 1.00 | 3.1034 | |
| 0.03 | 0.00 | 0.3520 |
| 0.25 | 1.1557 | |
| 0.50 | 2.2732 | |
| 1.00 | 4.1578 | |
| 0.05 | 0.00 | 0.5643 |
| 0.25 | 1.5732 | |
| 0.50 | 2.8576 | |
| 1.00 | 4.9673 | |
| 0.08 | 0.00 | 0.7752 |
| 0.25 | 1.9371 | |
| 0.50 | 3.5839 | |
| 1.00 | 5.8936 |
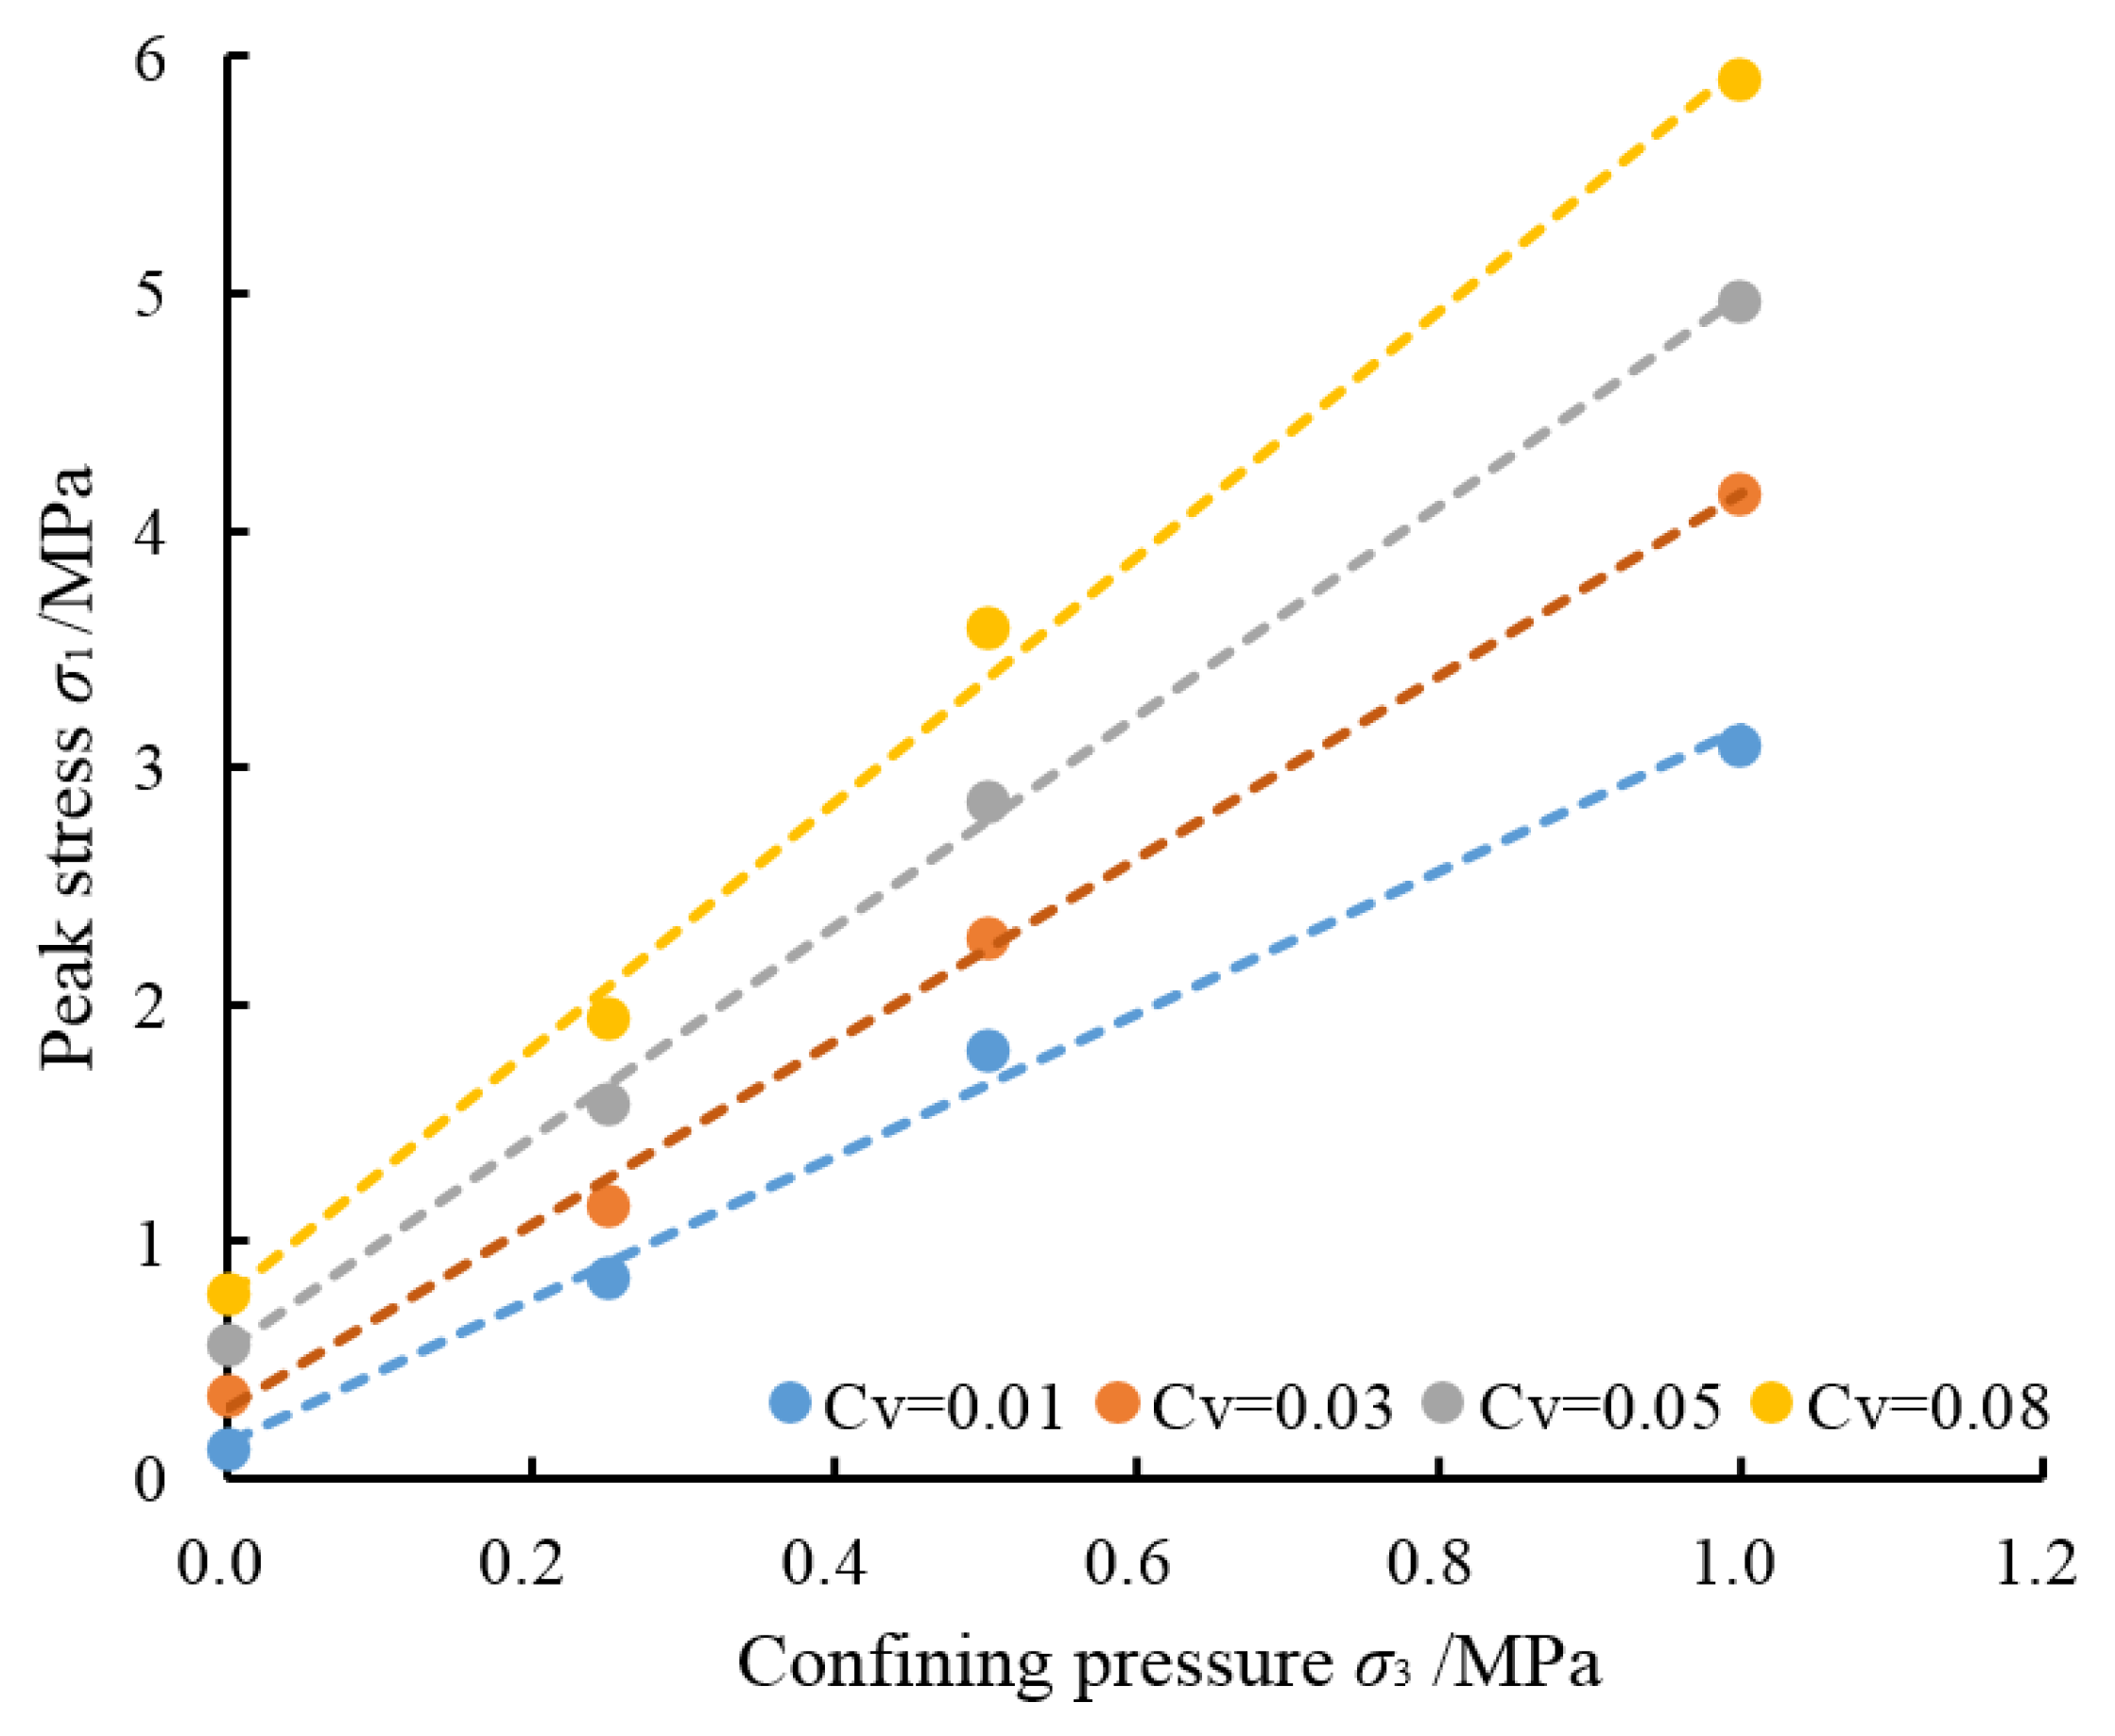
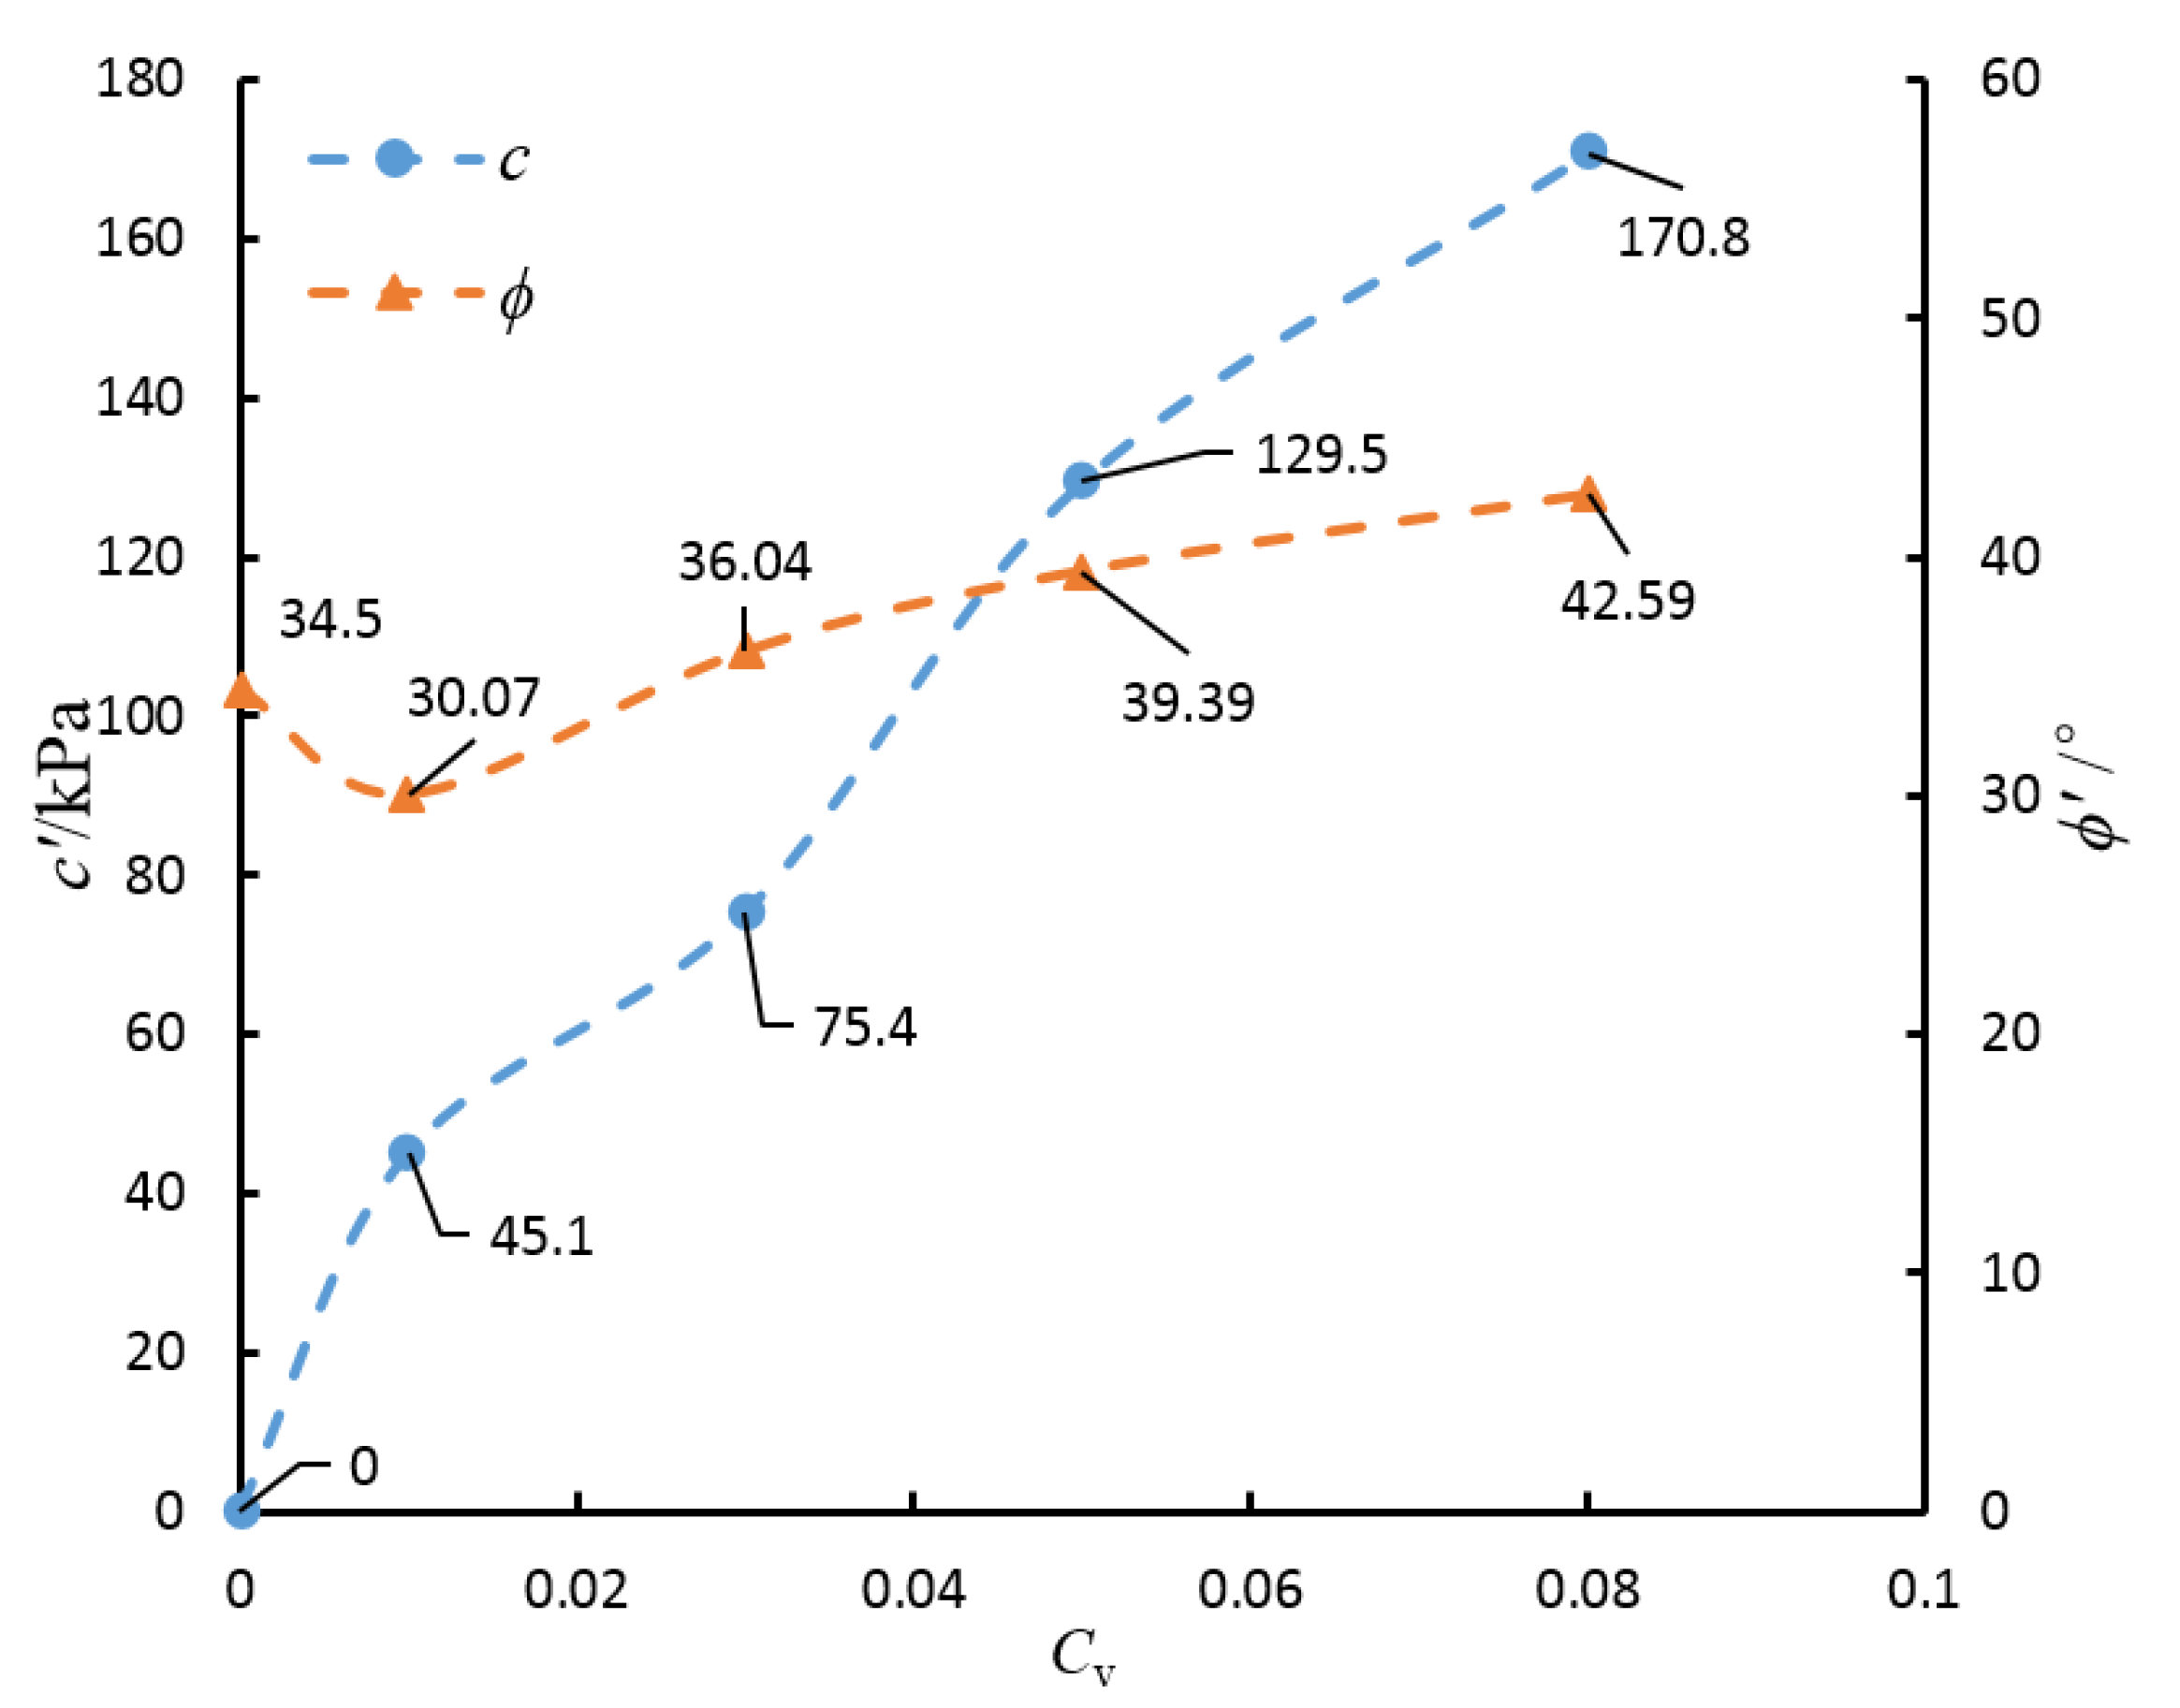
| Cv | Formula | Correlation Coefficient R2 | Cohesion Force c′ (MPa) | Angle of Shearing Resistance ϕ′(°) |
|---|---|---|---|---|
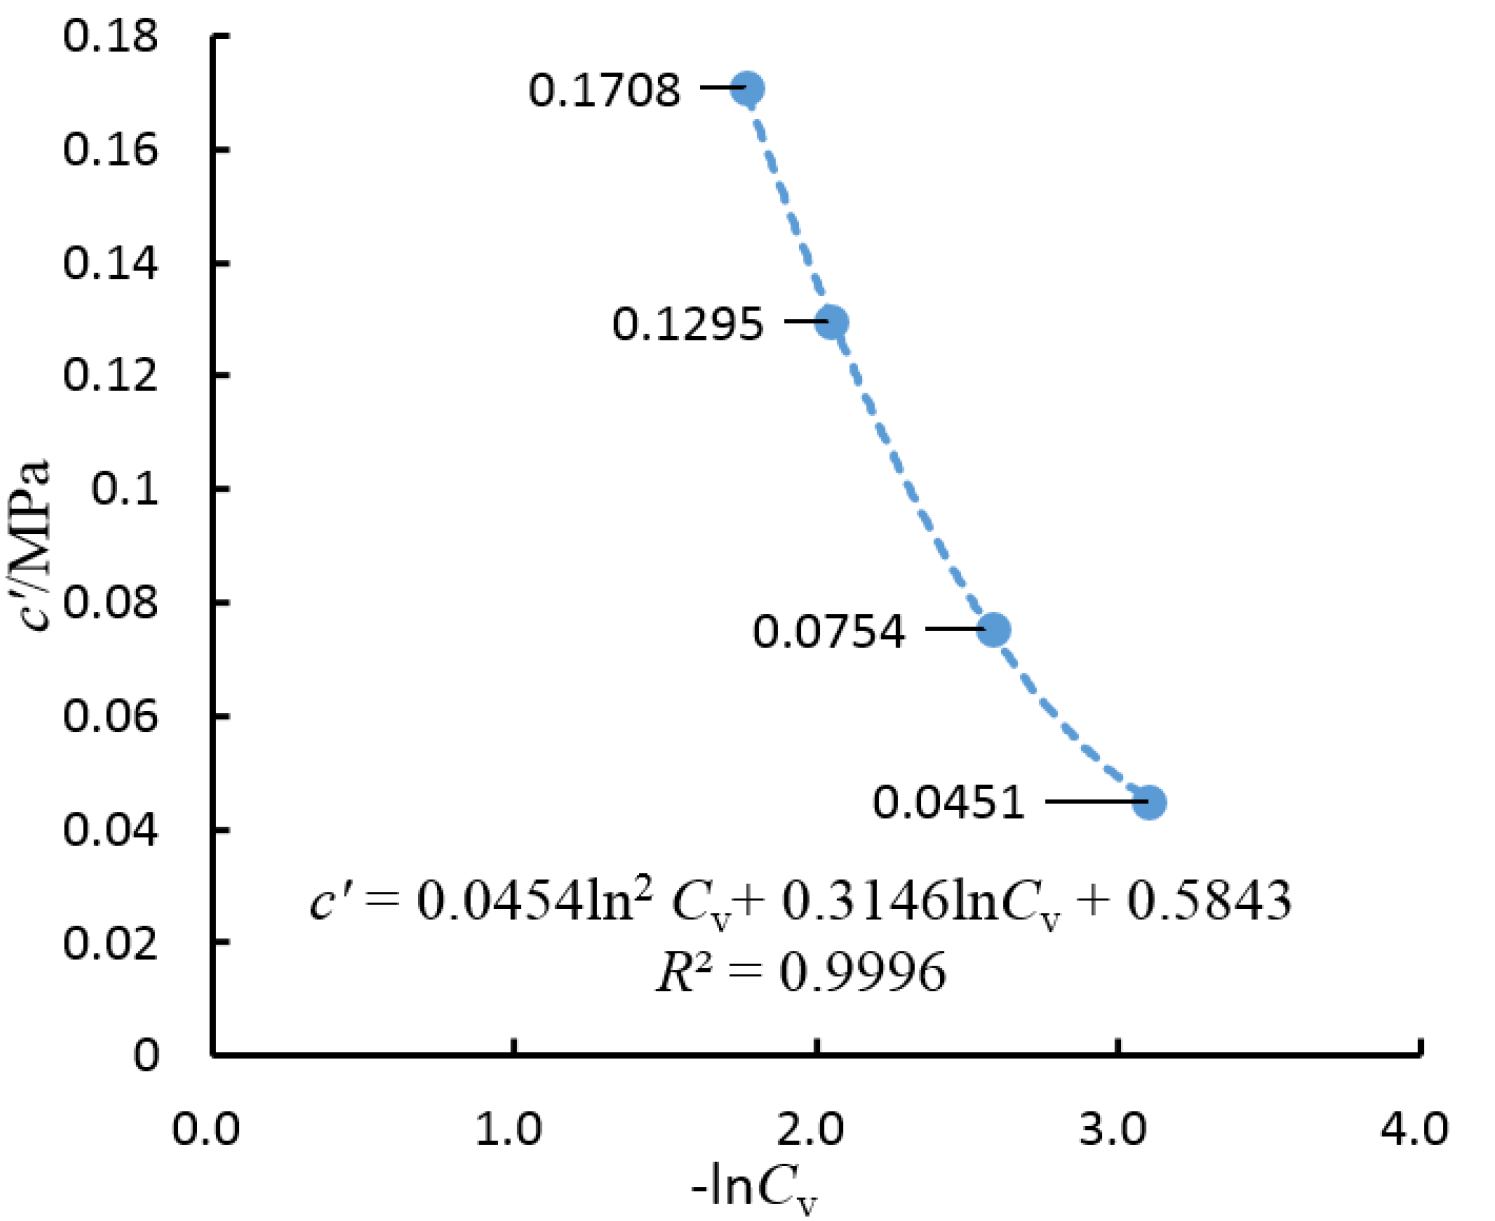
| 0.01 | σ1 = 3.0086σ3 + 0.1564 | 0.9938 | 0.0451 | 30.07 |
| 0.03 | σ1 = 3.8585σ3 + 0.2966 | 0.9980 | 0.0754 | 36.04 |
| 0.05 | σ1 = 4.4450σ3 + 0.9459 | 0.9985 | 0.1295 | 39.39 |
| 0.08 | σ1 = 0.1873σ3 + 0.7780 | 0.9953 | 0.1708 | 42.59 |
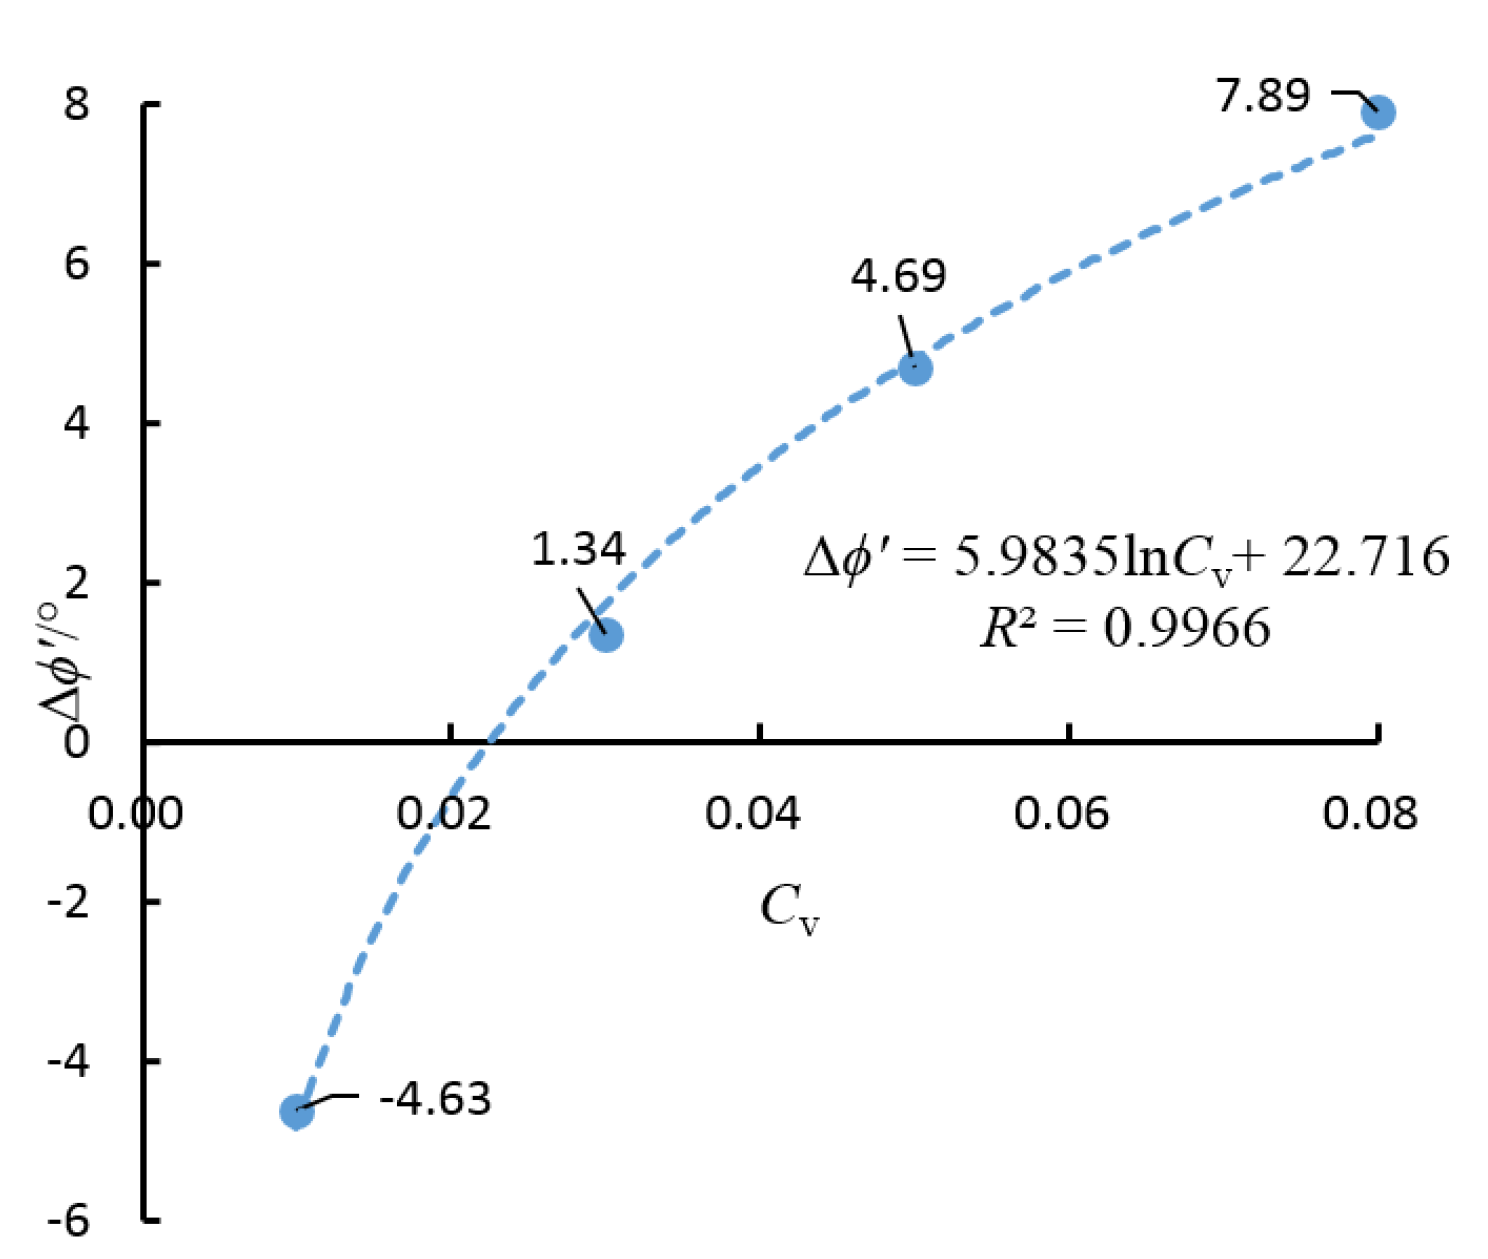
| Cv | Δc′ (MPa) | ic′ (%) | Δϕ′ (°) | iϕ′ (%) |
|---|---|---|---|---|
| 0.03 | 0.0303 | 67.18 | 5.97 | 19.85 |
| 0.05 | 0.0844 | 187.14 | 9.32 | 30.99 |
| 0.08 | 0.1257 | 278.71 | 12.52 | 41.64 |
4. Conclusions
- (1)
- The added amount of OPC Cv has an effect on the physical and mechanical properties of artificial cemented sand. When Cv is high (e.g., Cv = 0.03, 0.05 or 0.08), the stress-strain curve indicates a strain softening behavior of the samples; under the same confining pressure, as Cv increases, both the peak strength and residual strength of the samples show a significant increase. When Cv is low (e.g., Cv = 0.01), the stress-strain curve indicates the strain hardening behavior of the samples.
- (2)
- With the increase of Cv, the cohesion force c′ and Δϕ′ gradually increase. The angle of shearing resistance of the artificial cemented sand is smaller than that of the uncemented sample when Cv is low; as Cv increases, it increases as well, but in a moderate manner. c′ is much more sensitive than ϕ′ to the change in the cementing agent content.
- (3)
- For the artificial cemented sand prepared with OPC, Δϕ′ and Cv conform to the rule of logarithmic function, while c′ and −lnCv conform to the rule of quadratic polynomial function. The correlation coefficients of both functions are greater than 0.9965, indicating an extremely strong correlation.
- (4)
- Given the effect of Cv on the shear strength of the artificial cemented sand, the Mohr-Coulomb strength theory was modified and an expression based on this theory appropriate for artificial cemented sand with different levels of cementing agent content is presented.
Acknowledgments
Author Contributions
Conflicts of Interest
References
- Mitchell, J.K.; Soga, K. Fundamentals of Soil Behavior; John Wiley & Sons: New York, NY, USA, 2005. [Google Scholar]
- Obermayr, M.; Dressler, K.; Vrettos, C.; Eberhard, P. A bonded-particle model for cemented sand. Comput. Geotech. 2013, 49, 299–313. [Google Scholar] [CrossRef]
- Huang, J.T.; Airey, D.W. Effects of cement and density on an artificially cemented sand. In Geotechnical Engineering of Soft Rocks-Hard Soils; Balkema: Rotterdam, The Netherland, 1993. [Google Scholar]
- Kongsukprasert, L.; Kuwano, R.K.; Tatsuoka, F. Effects of ageing on stress-strain behaviour of cement-mixed sand. In Advanced Laboratory Stress-Strain Testing of Geomaterials; Tatsuoka, Shibuya & Kuwano BV: Rotterdam, The Netherlands, 2001. [Google Scholar]
- Usluogullari, F.; Vipulanandan, C. Stress-strain behavior and California bearing ratio of artificially cemented sand. J. Test. Eval. 2011, 39, 1–9. [Google Scholar]
- Trads, N.; Lade, P.V. Experimental evidence of truly elastic behavior of artificial sandstone inside the cementation yield surface. Rock Mech. Rock Eng. 2014, 47, 335–345. [Google Scholar] [CrossRef]
- Thian, S.Y.; Lee, C.Y. The effect of low confining pressures on cemented sand. J. Res. Archit. Civ. Eng. 2013, 1, 1–4. [Google Scholar]
- Coop, M.R.; Atkinson, J.H. The mechanics of cemented carbonate sands. Geotechnique 1993, 43, 53–67. [Google Scholar] [CrossRef]
- Coop, M.R.; Cuccovillo, T. On the mechanics of structured sands. Geotechnique 1999, 49, 741–760. [Google Scholar]
- Wang, X.M.; Zhao, C.; Chen, S.X.; Zhuang, X.S. Experimental study of physico-mechanical properties of artificially cemented sand. Rock Soil Mech. 2013, 34, 3134–3140. [Google Scholar]
- Nardelli, V.; Coop, M.R. An experimental investigation of the micromechanical behaviour of cemented sand particles. In Proceedings of the International Symposium on Geomechanics from Micro to Macro, IS-Cambridge 2014, Cambridge, UK, 1–3 September 2014.
- Ravi, S.; Christopher, B.; Michael, J. Relationship between shear wave velocity and stresses at failure for weakly cemented sands during drained triaxial compression. Soils Found. 2011, 51, 761–771. [Google Scholar]
- Asghari, E.; Toll, D.G.; Haeri, S.M. Triaxial behaviour of a cemented gravely sand, Tehran alluvium. Geotech. Geol. Eng. 2003, 21, 1–28. [Google Scholar] [CrossRef]
- Rios, S.; da Fonseca, A.V.; Baudet, B. On the shearing behaviour of an artificially cemented soil. Acta Geotech. 2014, 9, 215–226. [Google Scholar] [CrossRef]
- Rios, S.; da Fonseca, A.V.; Baudet, B. The effect of the porosity/cement ratio on the compression behaviour of cemented soil. J. Geotech. Environ. Eng. 2012, 138, 1422–1426. [Google Scholar] [CrossRef]
- Kasama, K.; Zen, K.; Iwataki, K. Undrained shear strength of cement-treated soils. Soils Found. 2006, 46, 221–232. [Google Scholar] [CrossRef]
- Saxena, S.K.; Lastrico, R.M. Static properties of lightly cemented sand. J. Geotech. Eng. Div. 1978, 104, 1449–1465. [Google Scholar]
- Consoli, N.C.; da Fonseca, A.V.; Rios, S.; Cruz, R.; Fonini, A. Parameters controlling stiffness and strength of artificially cemented soils. Geotechnique 2012, 62, 177–183. [Google Scholar] [CrossRef]
- Kuwano, J.; Boon, T.W. Effects of curing time and stress on the strength and deformation characteristics of cement-mixed sand in soil stress-strain behavior: Measurement, modeling and analysis. In A Collection of Papers of the Geotechnical Symposium in Rome; Springer: Dordrecht, The Netherlands, 2007. [Google Scholar]
- Acar, Y.; El-Tahir, A. Low strain dynamic properties of artificially cemented sands. J. Geotech. Eng. 1986, 112, 1001–1015. [Google Scholar] [CrossRef]
- Da Fonseca, A.V.; Amaral, M.F.; Panico, F.; Rios, S. Indexation of dynamic and static geomechanical properties of a cemented aggregate for transportation engineering. J. Transp. Geotech. 2014, 1, 31–44. [Google Scholar] [CrossRef]
- Da Fonseca, A.V.; Rios, S.; Amaral, M.F.; Panico, F. Fatigue cyclic tests on artificially cemented soil. ASTM Geotech. Test. J. 2013, 36, 227–235. [Google Scholar] [CrossRef]
- Rios, S.; da Fonseca, A.V.; Consoli, N.; Floss, M.; Cristelo, N. Influence of grain size and mineralogy on the porosity/cement ratio. Geotech. Lett. 2013, 3, 130–136. [Google Scholar] [CrossRef]
- Maghous, S.; Consoli, N.C.; Fonini, A.; Pasa Dutra, V.F. A theoretical-experimental approach to elastic and strength properties of artificially cemented sand. Comput. Geotech. 2014, 62, 40–50. [Google Scholar] [CrossRef]
- Consoli, N.C.; de Moraes, R.R.; Festugato, L. Variables controlling strength of fibre-reinforced cemented soils. Proc. Inst. Civ. Eng. Ground Improv. 2013, 166, 221–232. [Google Scholar] [CrossRef]
- Consoli, N.C.; Caberlon, C.R.; Consoli, B.S.; Maghous, S. Failure envelope of artificially cemented sand. Geotechnique 2012, 62, 543–547. [Google Scholar] [CrossRef]
- Consoli, N.C.; Cruz, R.C.; Floss, M.F. Variables controlling strength of artificially cemented soil: Influence of curing time. Mater. Civ. Eng. 2011, 136, 692–696. [Google Scholar] [CrossRef]
- Consoli, N.C.; da Fonseca, A.V.; Caberlon, C.; Rios, S. Voids/cement ratio controlling tensile strength of cement treated soils. J. Geotech. Geoenviron. Eng. 2011, 137, 1126–1131. [Google Scholar] [CrossRef]
- Consoli, N.C.; Caberlon, C.; da Fonseca, A.V.; Coop, M.R. Influence of voids-cement ration on stress-dilatancy-strength behavior of artificially cemented sand. J. Geotech. Geoenviron. Eng. 2012, 138, 100–109. [Google Scholar] [CrossRef]
- Puppala, A.J.; Acar, Y.B.; Tumay, M.T. Cone penetration in very weakly cemented sand. J. Geotech. Eng. 1995, 121, 589–600. [Google Scholar] [CrossRef]
- Dupas, J.M.; Pecker, A. Static and dynamic properties of sand-cement. J. Geotech. Eng. Div. 1979, 105, 419–436. [Google Scholar]
- Clough, G.; Sitar, N.; Bachus, R.; Rad, N. Cemented sands under static loading. J. Geotech. Eng. Div. 1981, 107, 799–817. [Google Scholar]
- Lee, M.J.; Hong, S.J.; Choi, Y.M.; Lee, W.J. Evaluation of deformation modulus of cemented sand using CPT and DMT. Eng. Geol. 2010, 115, 28–35. [Google Scholar] [CrossRef]
- Wang, Y.H.; Leung, S.C. A particulate-scale investigation of cemented sand behavior. Can. Geotech. J. 2008, 45, 29–43. [Google Scholar] [CrossRef]
- Schnaid, F.; Prietto, P.D.M.; Consoli, N.C. Characterization of cemented sand in triaxial compression. J. Geotech. Geoenviron. Eng. 2001, 127, 857–868. [Google Scholar] [CrossRef]
- Ismail, M.A.; Joer, H.A.; Sim, W.H.; Randolph, M.F. Effect of cement type on shear behavior of cemented calcareous soil. J. Geotech. Geoenviron. Eng. 2002, 128, 520–529. [Google Scholar] [CrossRef]
- Stracke, F.; Jung, J.G.; Korf, E.P.; Consoli, N.C. The influence of moisture content on tensile and compressive strength of artificially cemented sand. Soils Rocks 2012, 35, 303–308. [Google Scholar]
© 2015 by the authors; licensee MDPI, Basel, Switzerland. This article is an open access article distributed under the terms and conditions of the Creative Commons Attribution license (http://creativecommons.org/licenses/by/4.0/).
Share and Cite
Li, D.; Liu, X.; Liu, X. Experimental Study on Artificial Cemented Sand Prepared with Ordinary Portland Cement with Different Contents. Materials 2015, 8, 3960-3974. https://doi.org/10.3390/ma8073960
Li D, Liu X, Liu X. Experimental Study on Artificial Cemented Sand Prepared with Ordinary Portland Cement with Different Contents. Materials. 2015; 8(7):3960-3974. https://doi.org/10.3390/ma8073960
Chicago/Turabian StyleLi, Dongliang, Xinrong Liu, and Xianshan Liu. 2015. "Experimental Study on Artificial Cemented Sand Prepared with Ordinary Portland Cement with Different Contents" Materials 8, no. 7: 3960-3974. https://doi.org/10.3390/ma8073960