2. Results
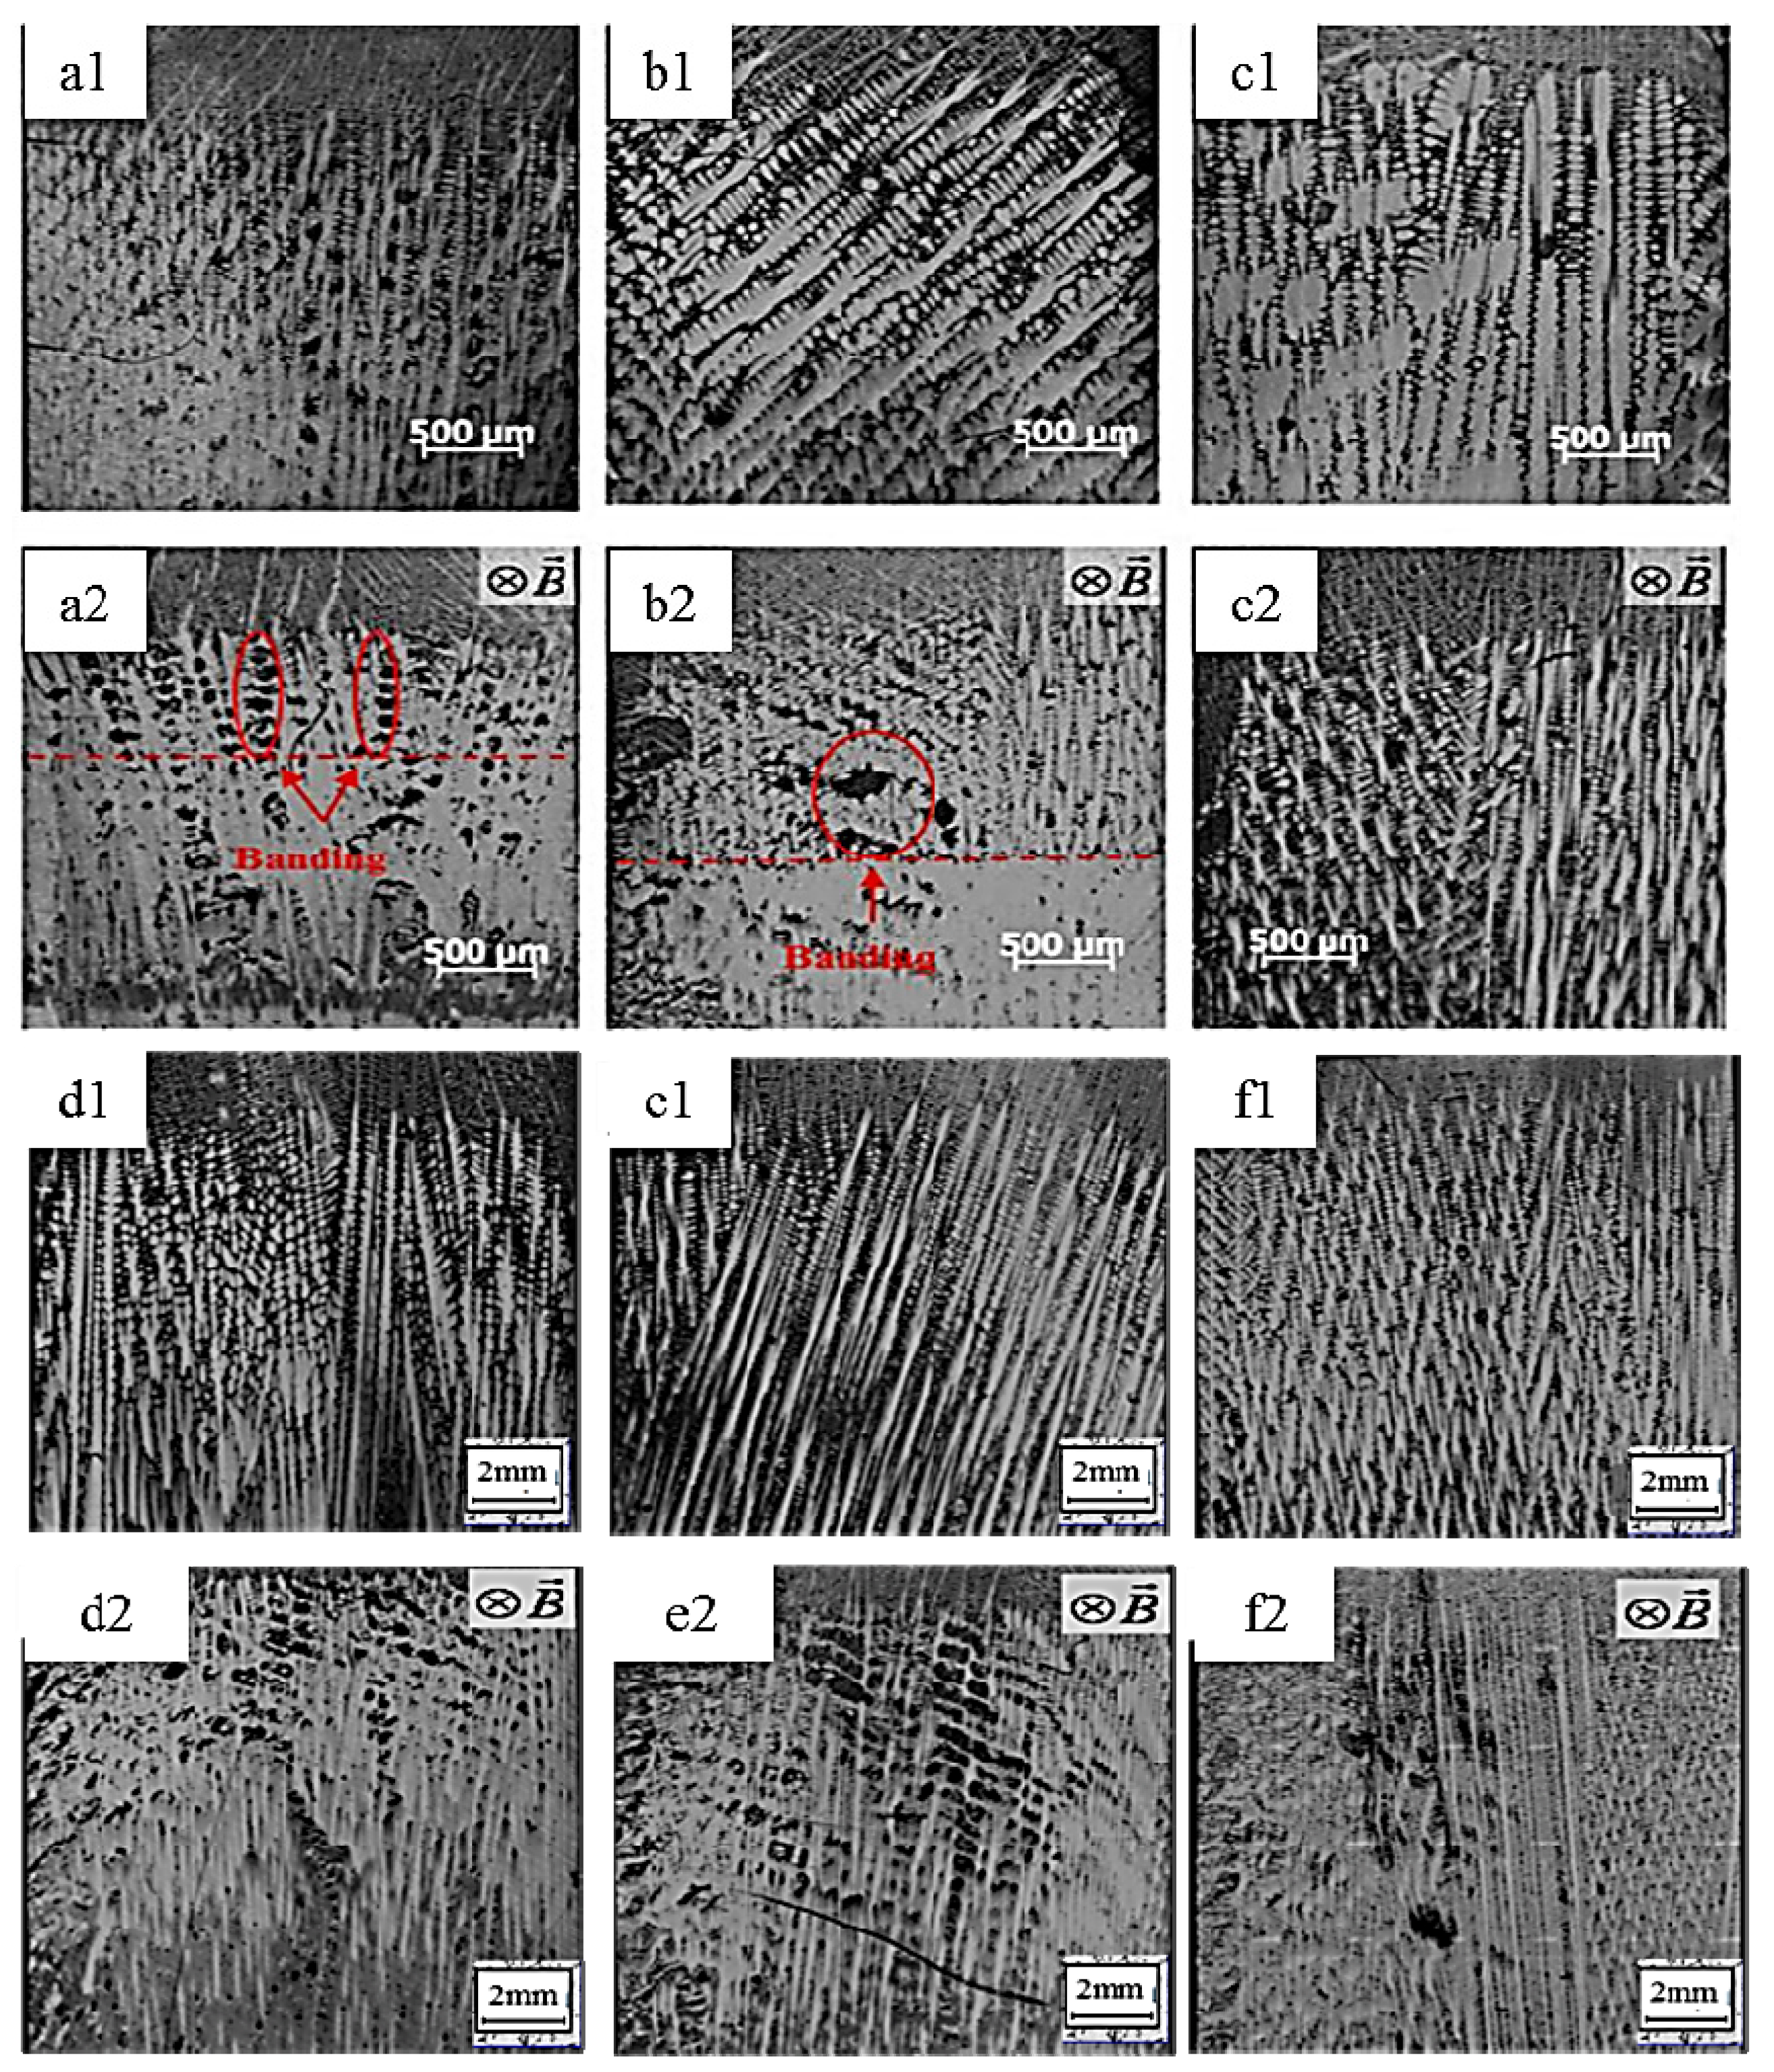
Figure 1 shows the influence of a 0.5 T magnetic field on the longitudinal microstructures of superalloy CMSX-6 with diameter of 4 mm and 12 mm directionally solidified at a temperature gradient of 80 K·cm
−1 and at various drawing speeds. It is observed that the typical dendritic crystals grow and regularly align without the magnetic field as shown in
Figure 1a1–f1. When a 0.5 T magnetic field is applied in the solidification, the appearance of banding-like macro-segregation is induced. It was also found that the quantity of channel macro-segregation depends on the drawing speed. The channel macro-segregation is small at a drawing speed of 5 μm·s
−1 and diameter of 4 mm as shown in
Figure 1a2. When the drawing speed is increased to 10 μm·s
−1, the macro-segregation reaches the maximum as shown in
Figure 1b2. Then the macro-segregation disappears if the drawing speed is further increased to 20 μm·s
−1, as shown in
Figure 1c2. In
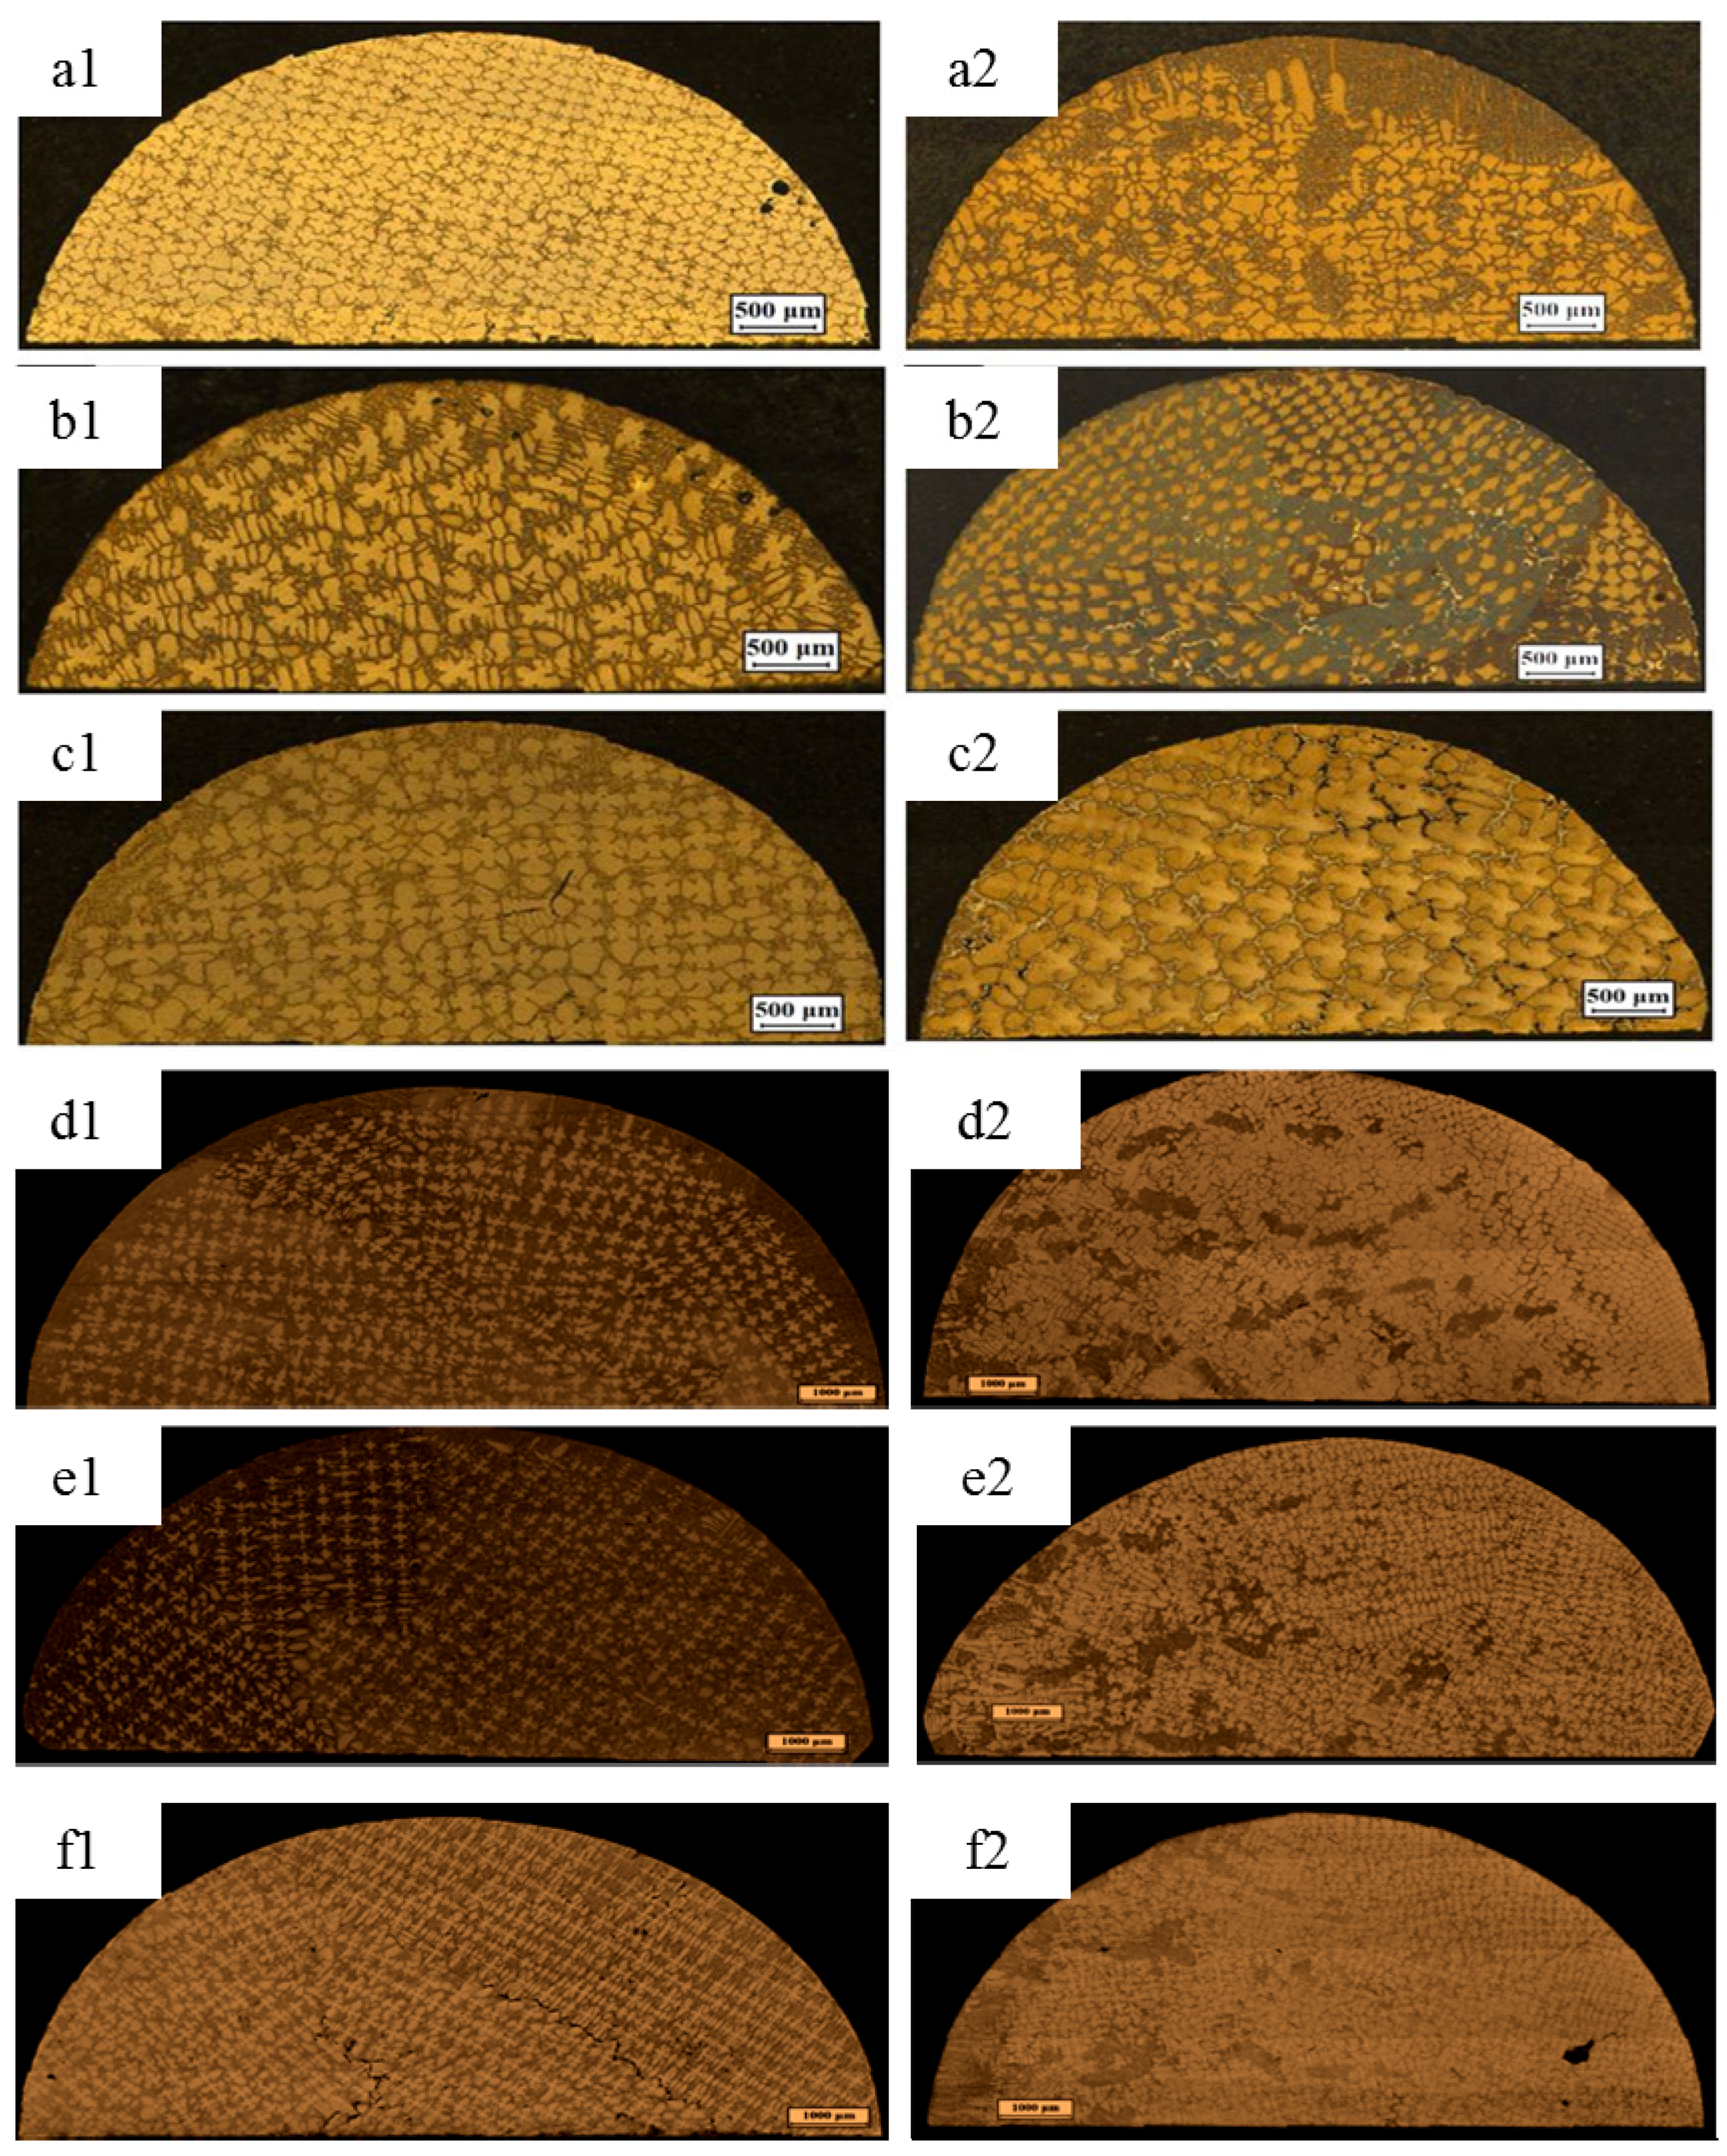
Figure 1d2–e2, with the application of a 0.5 T magnetic field in the solidification, some channel macro-segregation appears in the center of the specimen with the diameter of 12 mm and its quantity is gradually increased with increasing drawing speed. The transverse microstructures of superalloy CMSX-6 with a diameter of 4 mm and 12 mm directionally solidified as mentioned above are shown in
Figure 2. As seen in the
Figure 2a1–f1, without the magnetic field, the dendrite morphology is typically columnar. However, when a 0.5 T magnetic field is applied, channel macro-segregations form on the samples in
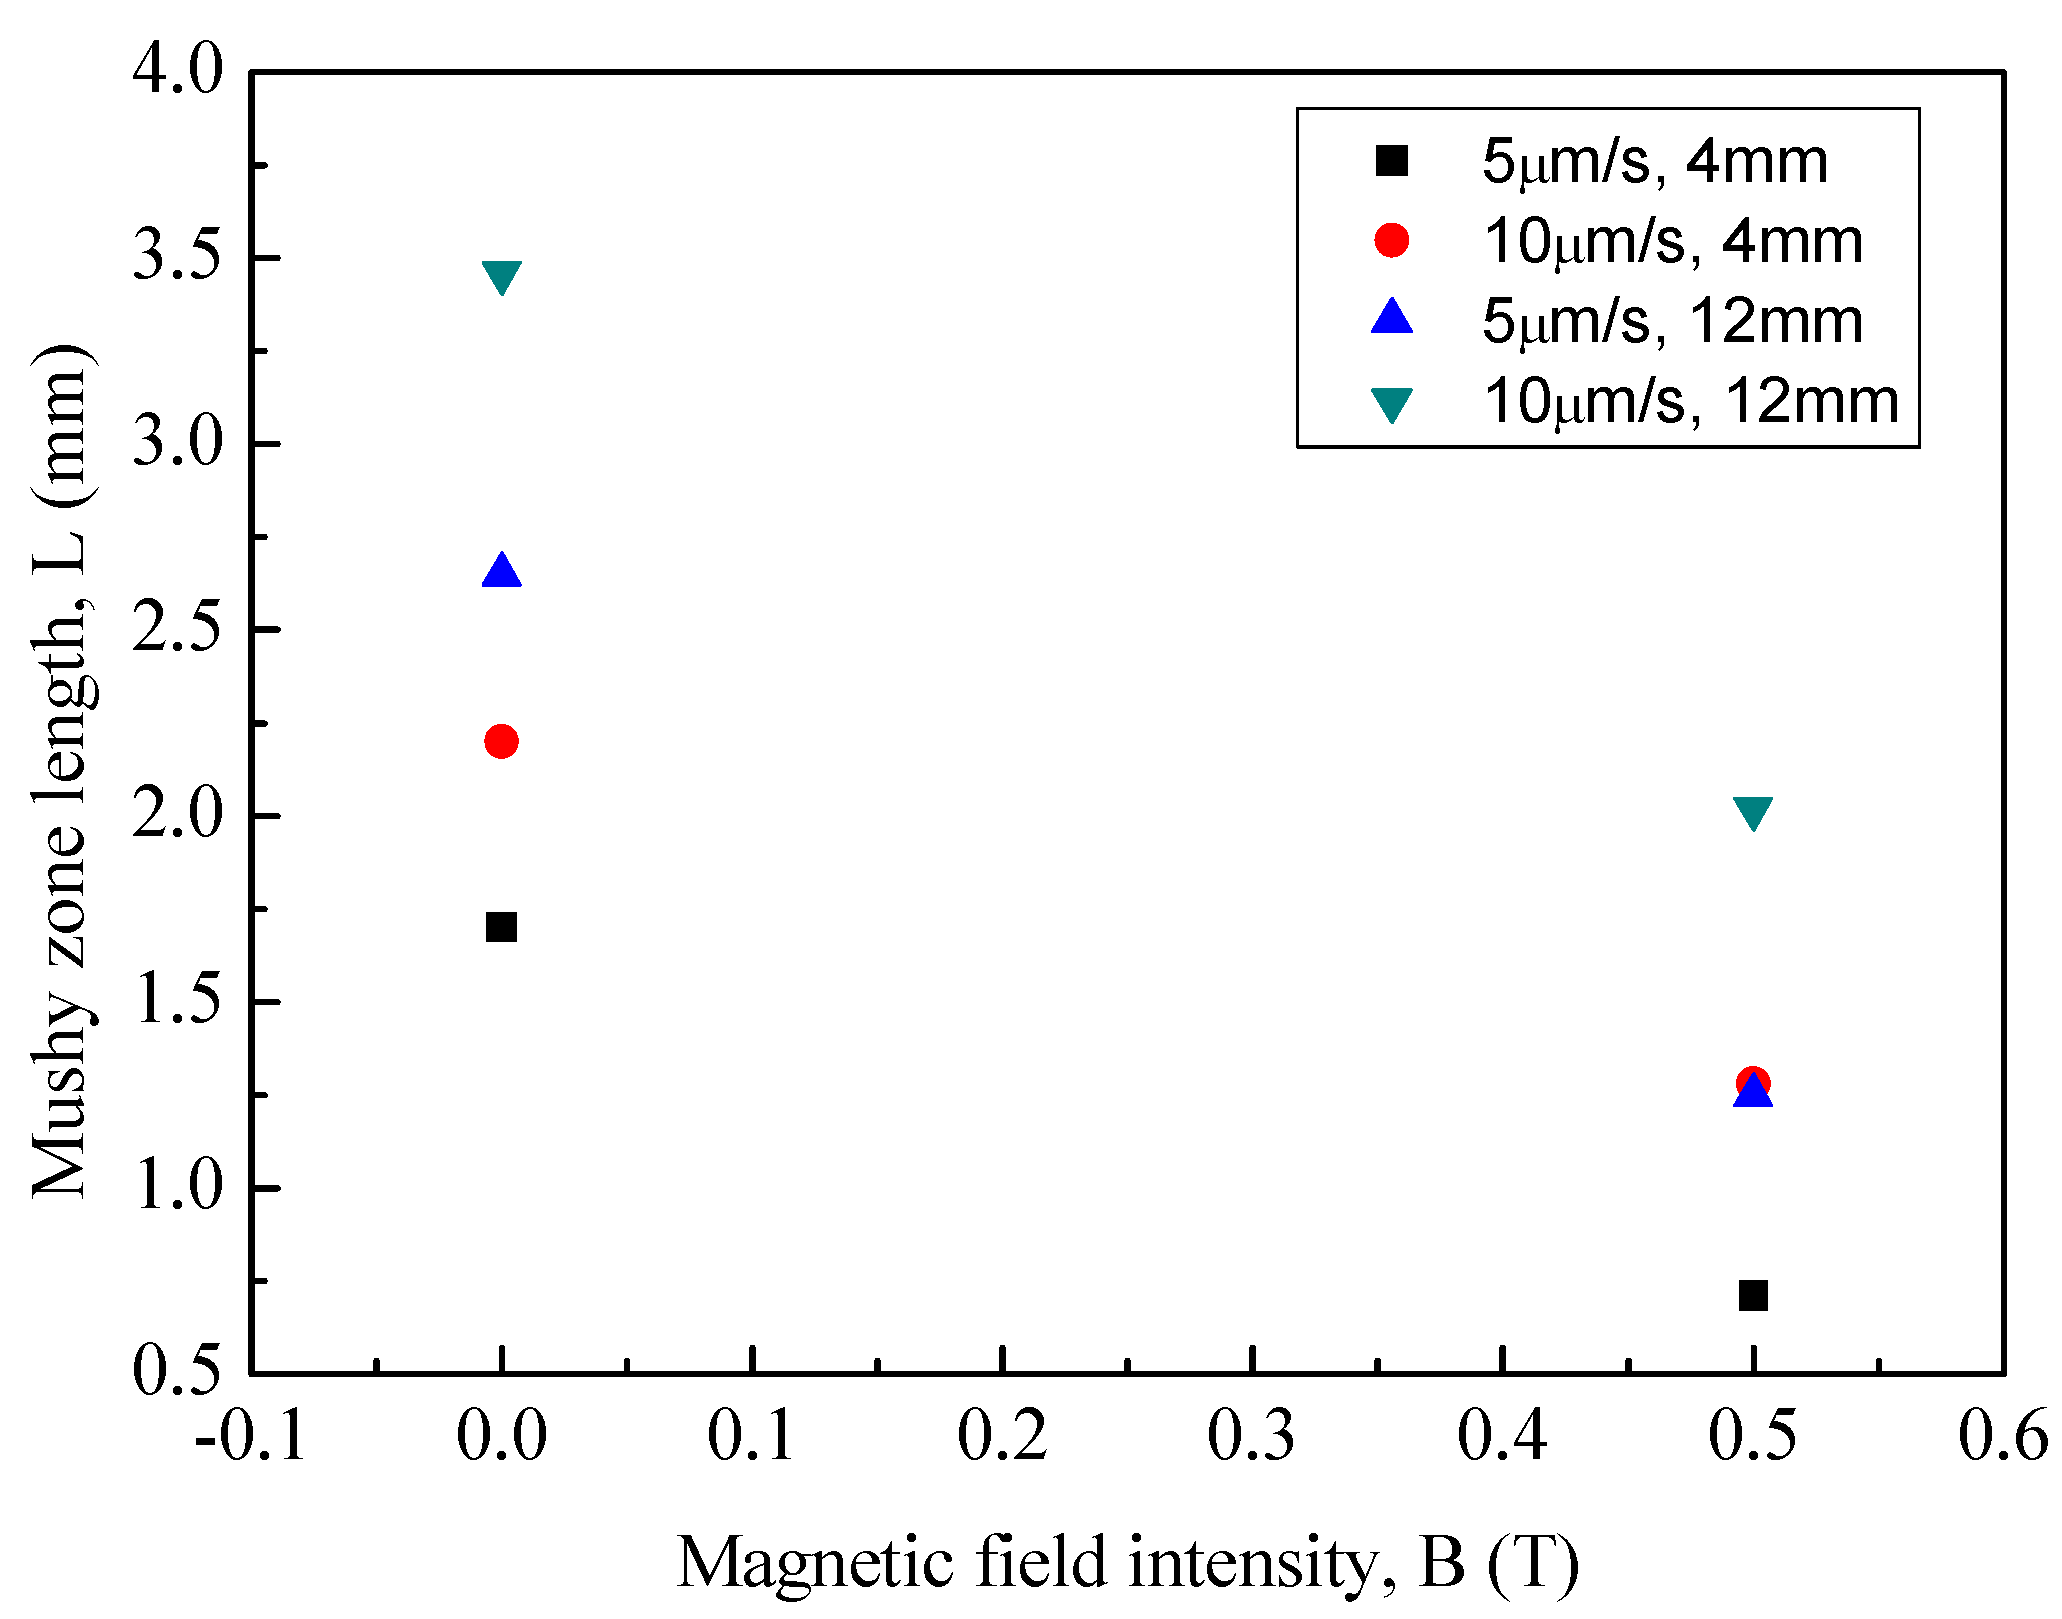
Figure 2a2–f2. We can clearly find the appearance of channel macro-segregation when a 0.5 T magnetic field is applied. Furthermore, the macro-segregation in the samples with a diameter of 12 mm is much more severe than that in the samples with a diameter of 4 mm. Additionally, it was noticed that the length of mushy zone is decreased with application of the magnetic field. The length of mushy zone under various growth speeds and diameters as a function of the magnetic field intensity is shown in
Figure 3.
Figure 1.
Longitudinal microstructure of directionally solidified superalloy at a temperature gradient of 80 K·cm−1 without and with a 0.5 T transverse magnetic field (): (a1) 0 T, 5 μm·s−1, diameter of 4 mm; (a2) 0.5 T, 5 μm·s−1, diameter of 4 mm; (b1) 0 T, 10 μm·s−1, diameter of 4 mm; (b2) 0.5 T, 10 μm·s−1, diameter of 4 mm; (c1) 0 T, 20 μm·s−1, diameter of 4 mm; (c2) 0.5 T, 20 μm·s−1, diameter of 4 mm; (d1) 0 T, 5 μm·s−1, diameter of 12 mm; (d2) 0.5 T, 5 μm·s−1, diameter of 12 mm; (e1) 0 T, 10 μm·s−1, diameter of 12 mm; (e2) 0.5 T, 10 μm·s−1, diameter of 12 mm; (f1) 0 T, 20 μm·s−1, diameter of 12 mm; (f2) 0.5 T, 20 μm·s−1, diameter of 12 mm.
Figure 2.
Transverse microstructure of directionally solidified superalloy at a temperature gradient of 80 K·cm−1 without and with a 0.5 T transverse magnetic field (): (a1) 0 T, 5 μm·s−1, diameter of 4 mm; (a2) 0.5 T, 5 μm·s−1, diameter of 4 mm; (b1) 0 T, 10 μm·s−1, diameter of 4 mm; (b2) 0.5 T, 10 μm·s−1, diameter of 4 mm; (c1) 0 T, 20 μm·s−1, diameter of 4 mm; (c2) 0.5 T, 20 μm·s−1, diameter of 4 mm; (d1) 0 T, 5 μm·s−1, diameter of 12 mm; (d2) 0.5 T, 5 μm·s−1, diameter of 12 mm; (e1) 0 T, 10 μm·s−1, diameter of 12 mm; (e2) 0.5 T, 10 μm·s−1, diameter of 12 mm; (f1) 0 T, 20 μm·s−1, diameter of 12 mm; (f2) 0.5 T, 20 μm·s−1, diameter of 12 mm.
Figure 3.
Mushy zone length as a function of magnetic field intensity.
Figure 3.
Mushy zone length as a function of magnetic field intensity.
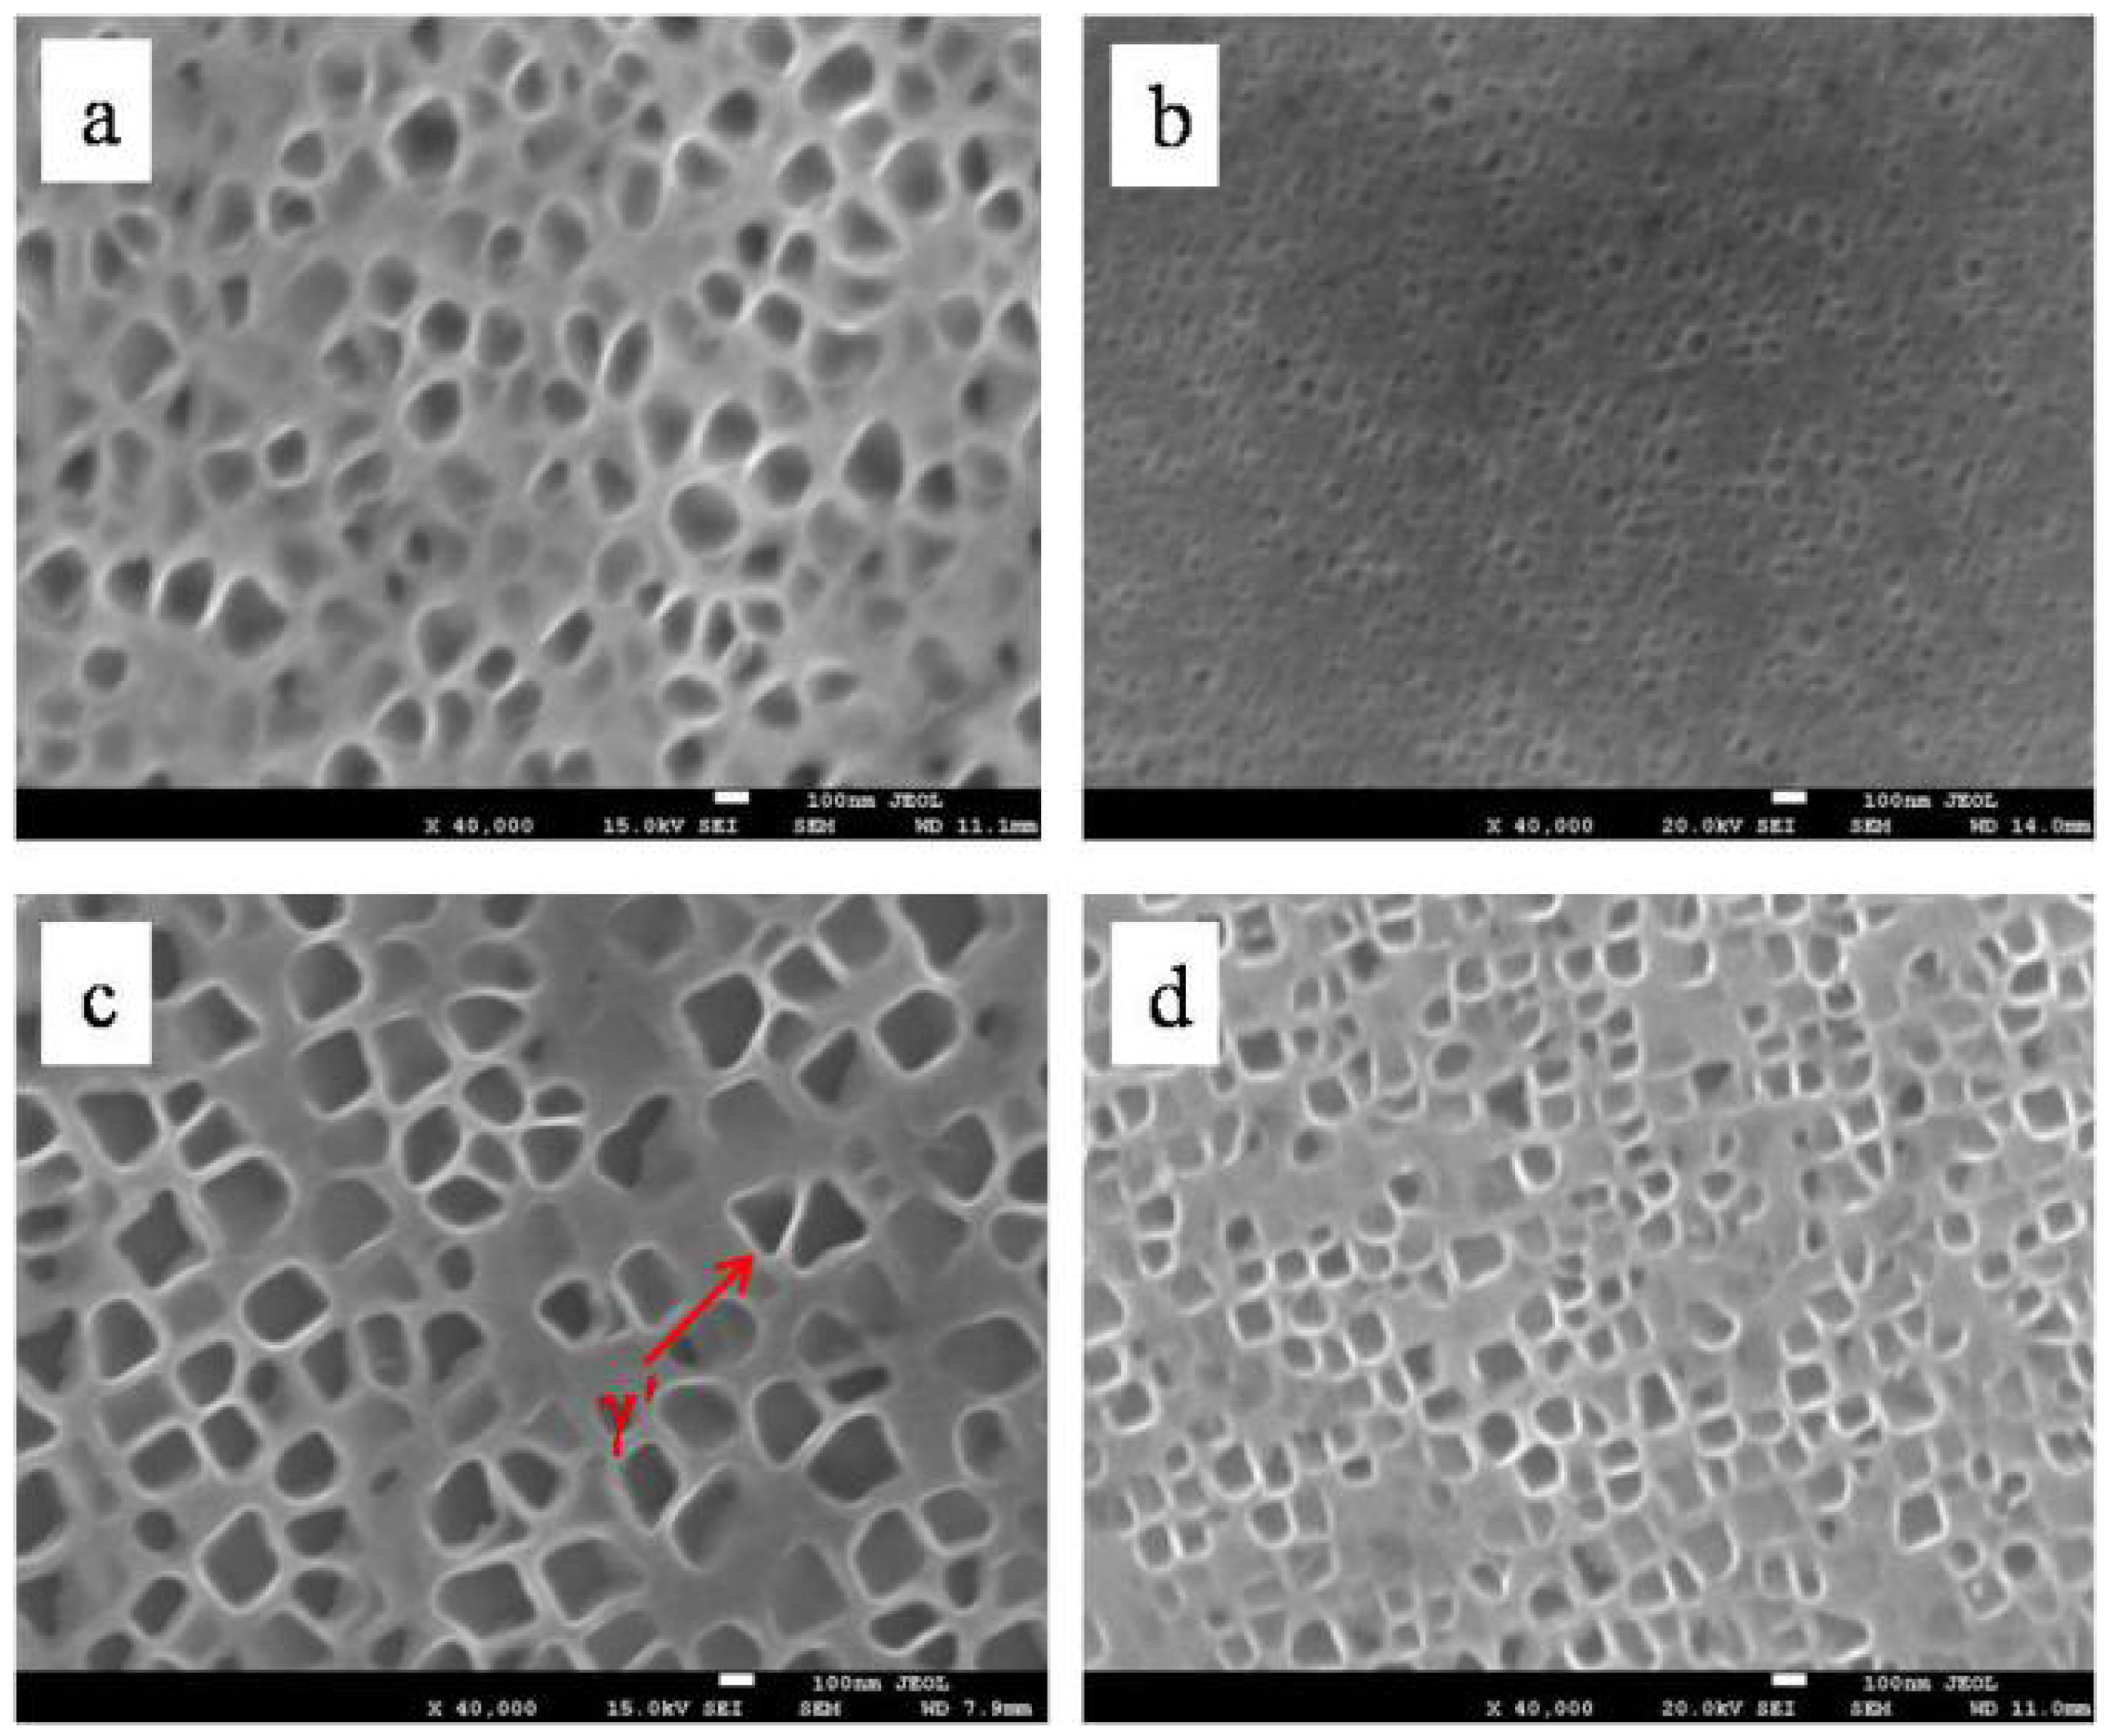
Figure 4 shows the γ’ morphology in the dendrite core of specimens at the bottom of the liquid-solid mushy zone at a drawing speed of 10 μm·s
−1 without and with 0.5 T magnetic field. It can be seen that the magnetic field dramatically reduces the size of the γ’ phase.
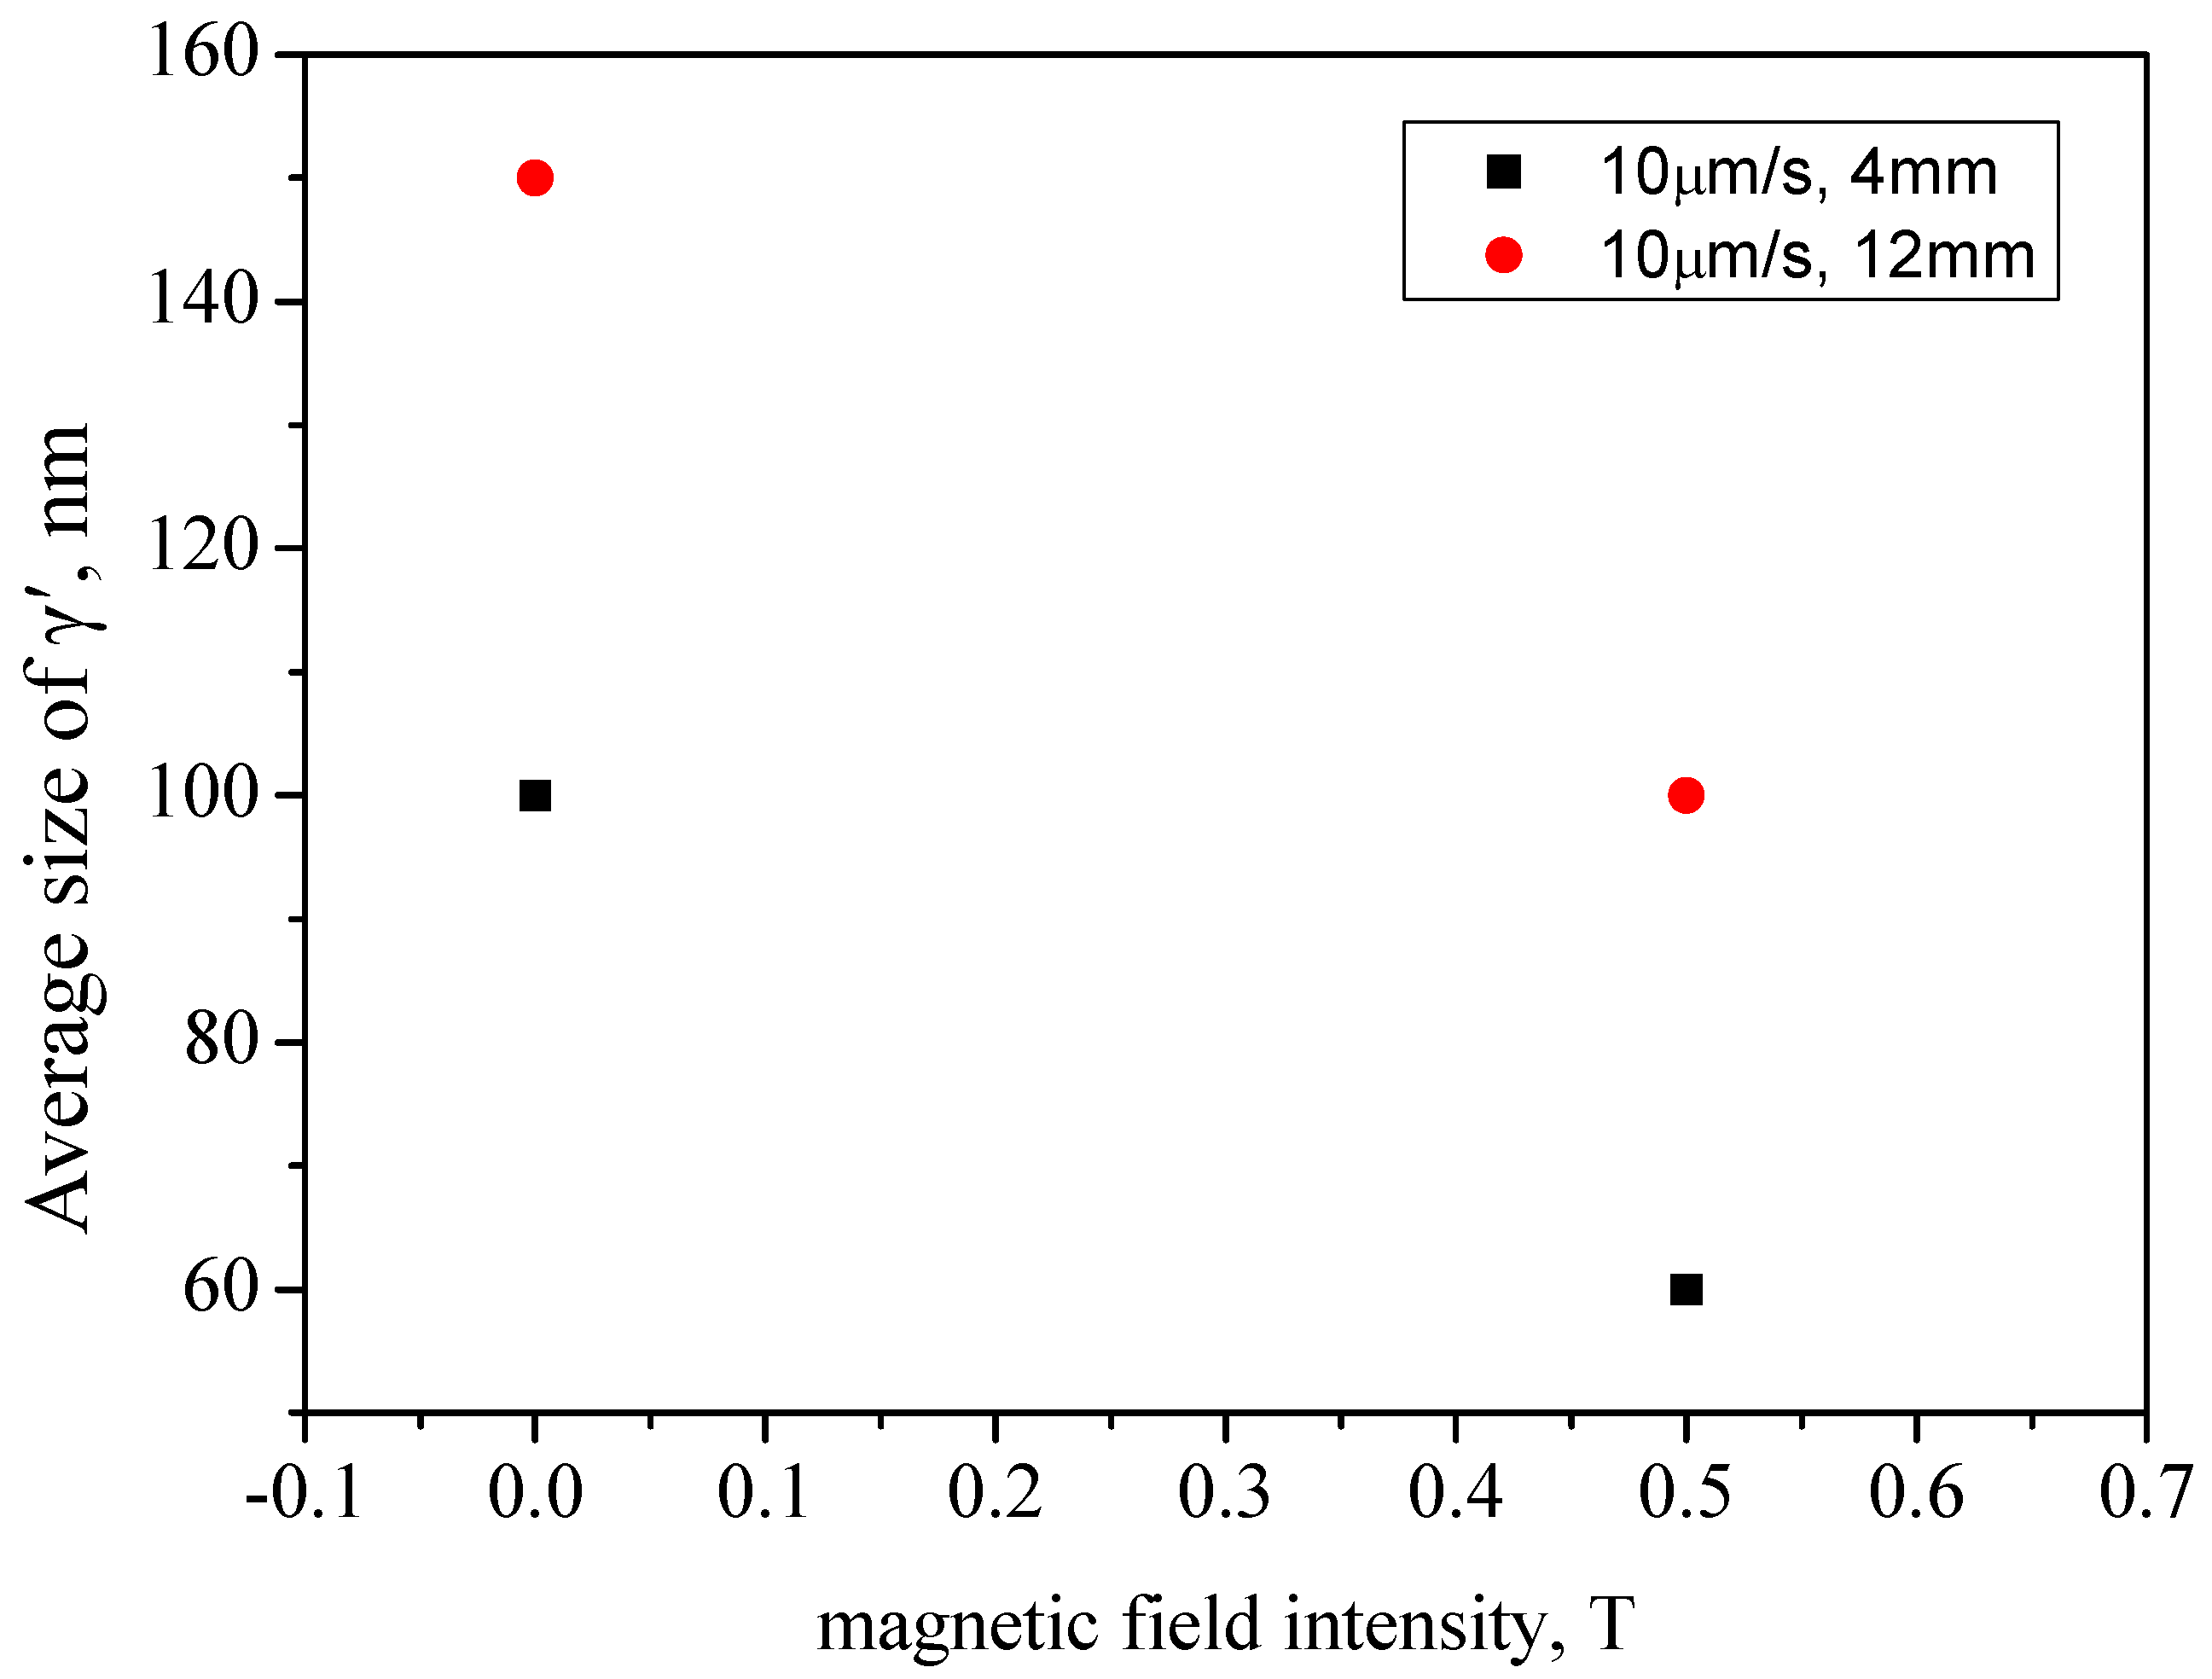
Figure 5 shows the γ’ size of specimens with 10 μm·s
−1 drawing speed and various magnetic field intensities. Compared to that without magnetic field, the γ’ size in the samples at diameters of 4 mm and 12 mm with 0.5 T magnetic field is decreased by 40% and 33%, respectively.
Figure 4.
The morphology of γ’ of directionally solidified superalloy at a temperature gradient of 80 K·cm−1, drawing speed of 10 μm·s−1: (a) 0 T, diameter of 4 mm; (b) 0.5 T, diameter of 4 mm; (c) 0 T, diameter of 12 mm; (d) 0.5 T, diameter of 12 mm.
Figure 4.
The morphology of γ’ of directionally solidified superalloy at a temperature gradient of 80 K·cm−1, drawing speed of 10 μm·s−1: (a) 0 T, diameter of 4 mm; (b) 0.5 T, diameter of 4 mm; (c) 0 T, diameter of 12 mm; (d) 0.5 T, diameter of 12 mm.
Figure 5.
The γ’ size in the dendrite core of Ni-based specimens with various diameters at a temperature gradient of 80 K·cm−1.
Figure 5.
The γ’ size in the dendrite core of Ni-based specimens with various diameters at a temperature gradient of 80 K·cm−1.
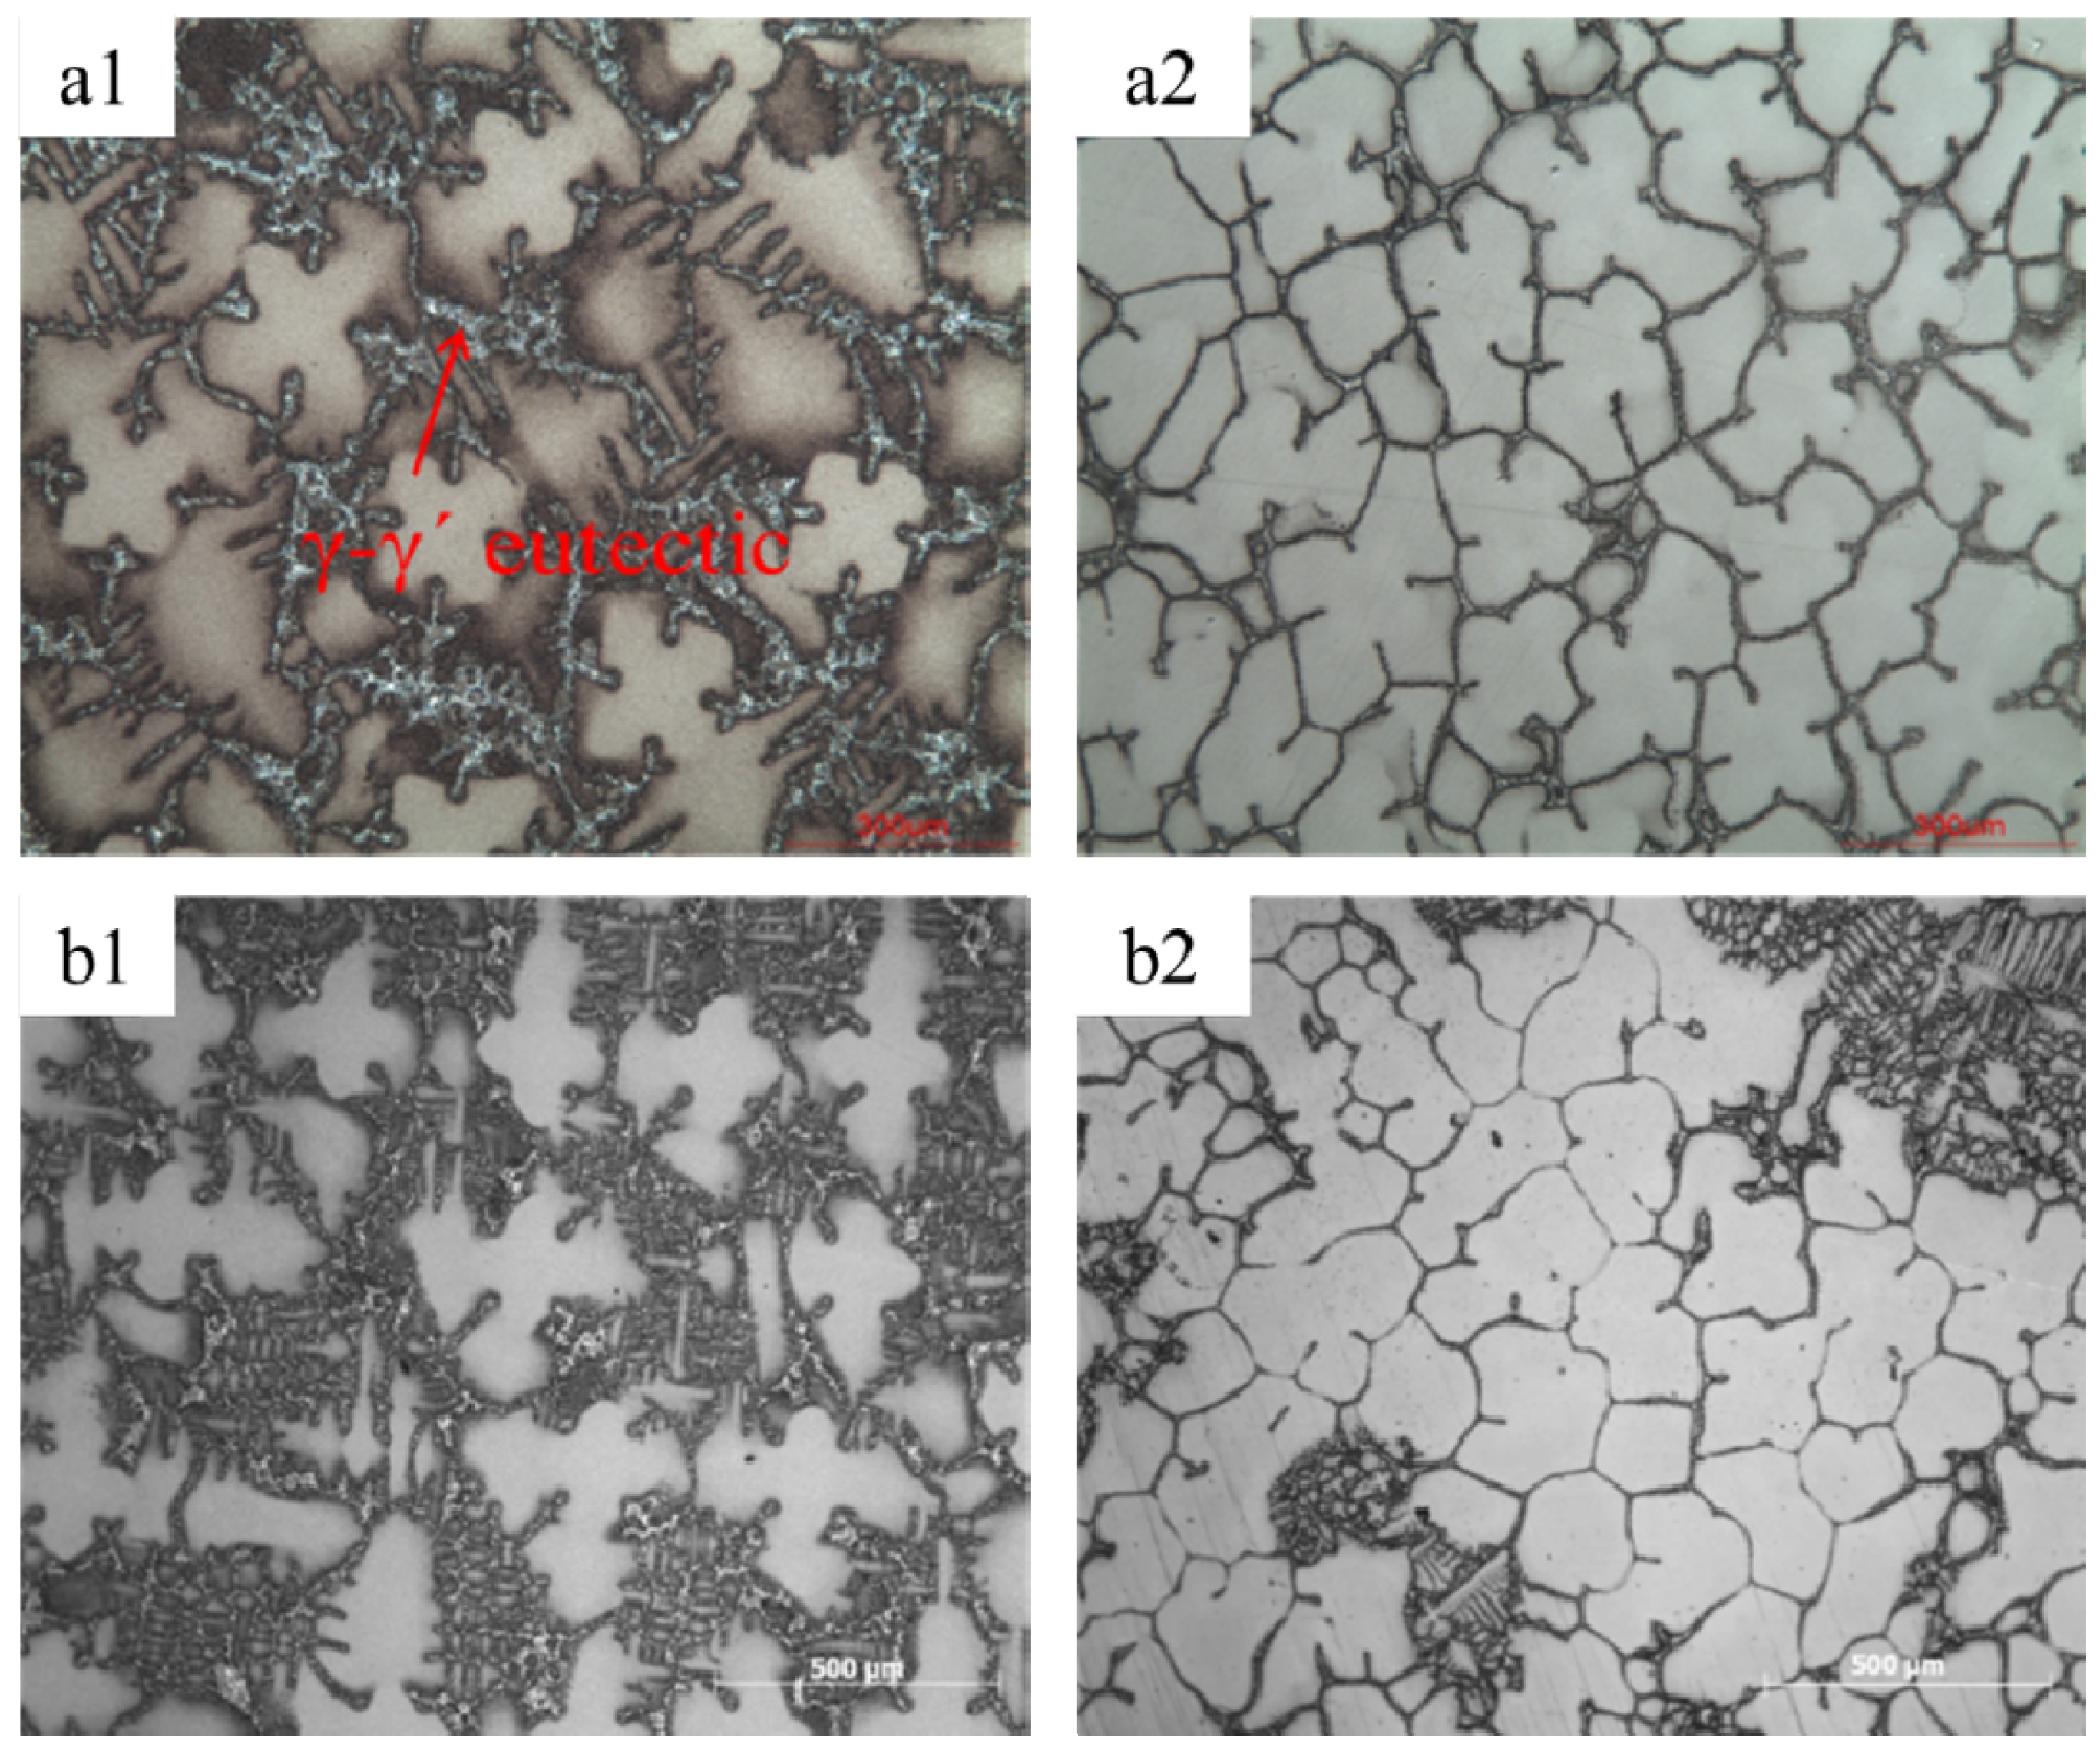
Another striking modification by the magnetic field is the decrease of eutectic volume. Either metallographic observation or DSC test confirms the decrement of the eutectic phase.
Figure 6 shows the transverse microstructure of directionally solidified superalloy CMSX-6 with and without a 0.5 T magnetic field at a temperature gradient of 80 K·cm
−1, drawing speed of 10 μm·s
−1 and diameter of 4 mm and 12 mm. It can be observed that γ-γ’ eutectic is dispersed in the interdendritic regions without magnetic field. With the application of 0.5 T magnetic field, the quantity of γ-γ’ eutectic phase is significantly decreased. The γ-γ’ eutectic volume is reduced from 5.22% to 1.52% for the superalloy CMSX-6 of 4 mm in diameter as listed in
Table 1. The effect of the magnetic field on the γ-γ’ eutectic phase was magnified when the diameter of the sample was expanded to 12 mm. The γ-γ’ eutectic volume in the sample was reduced from 5.72% to 1.95%.
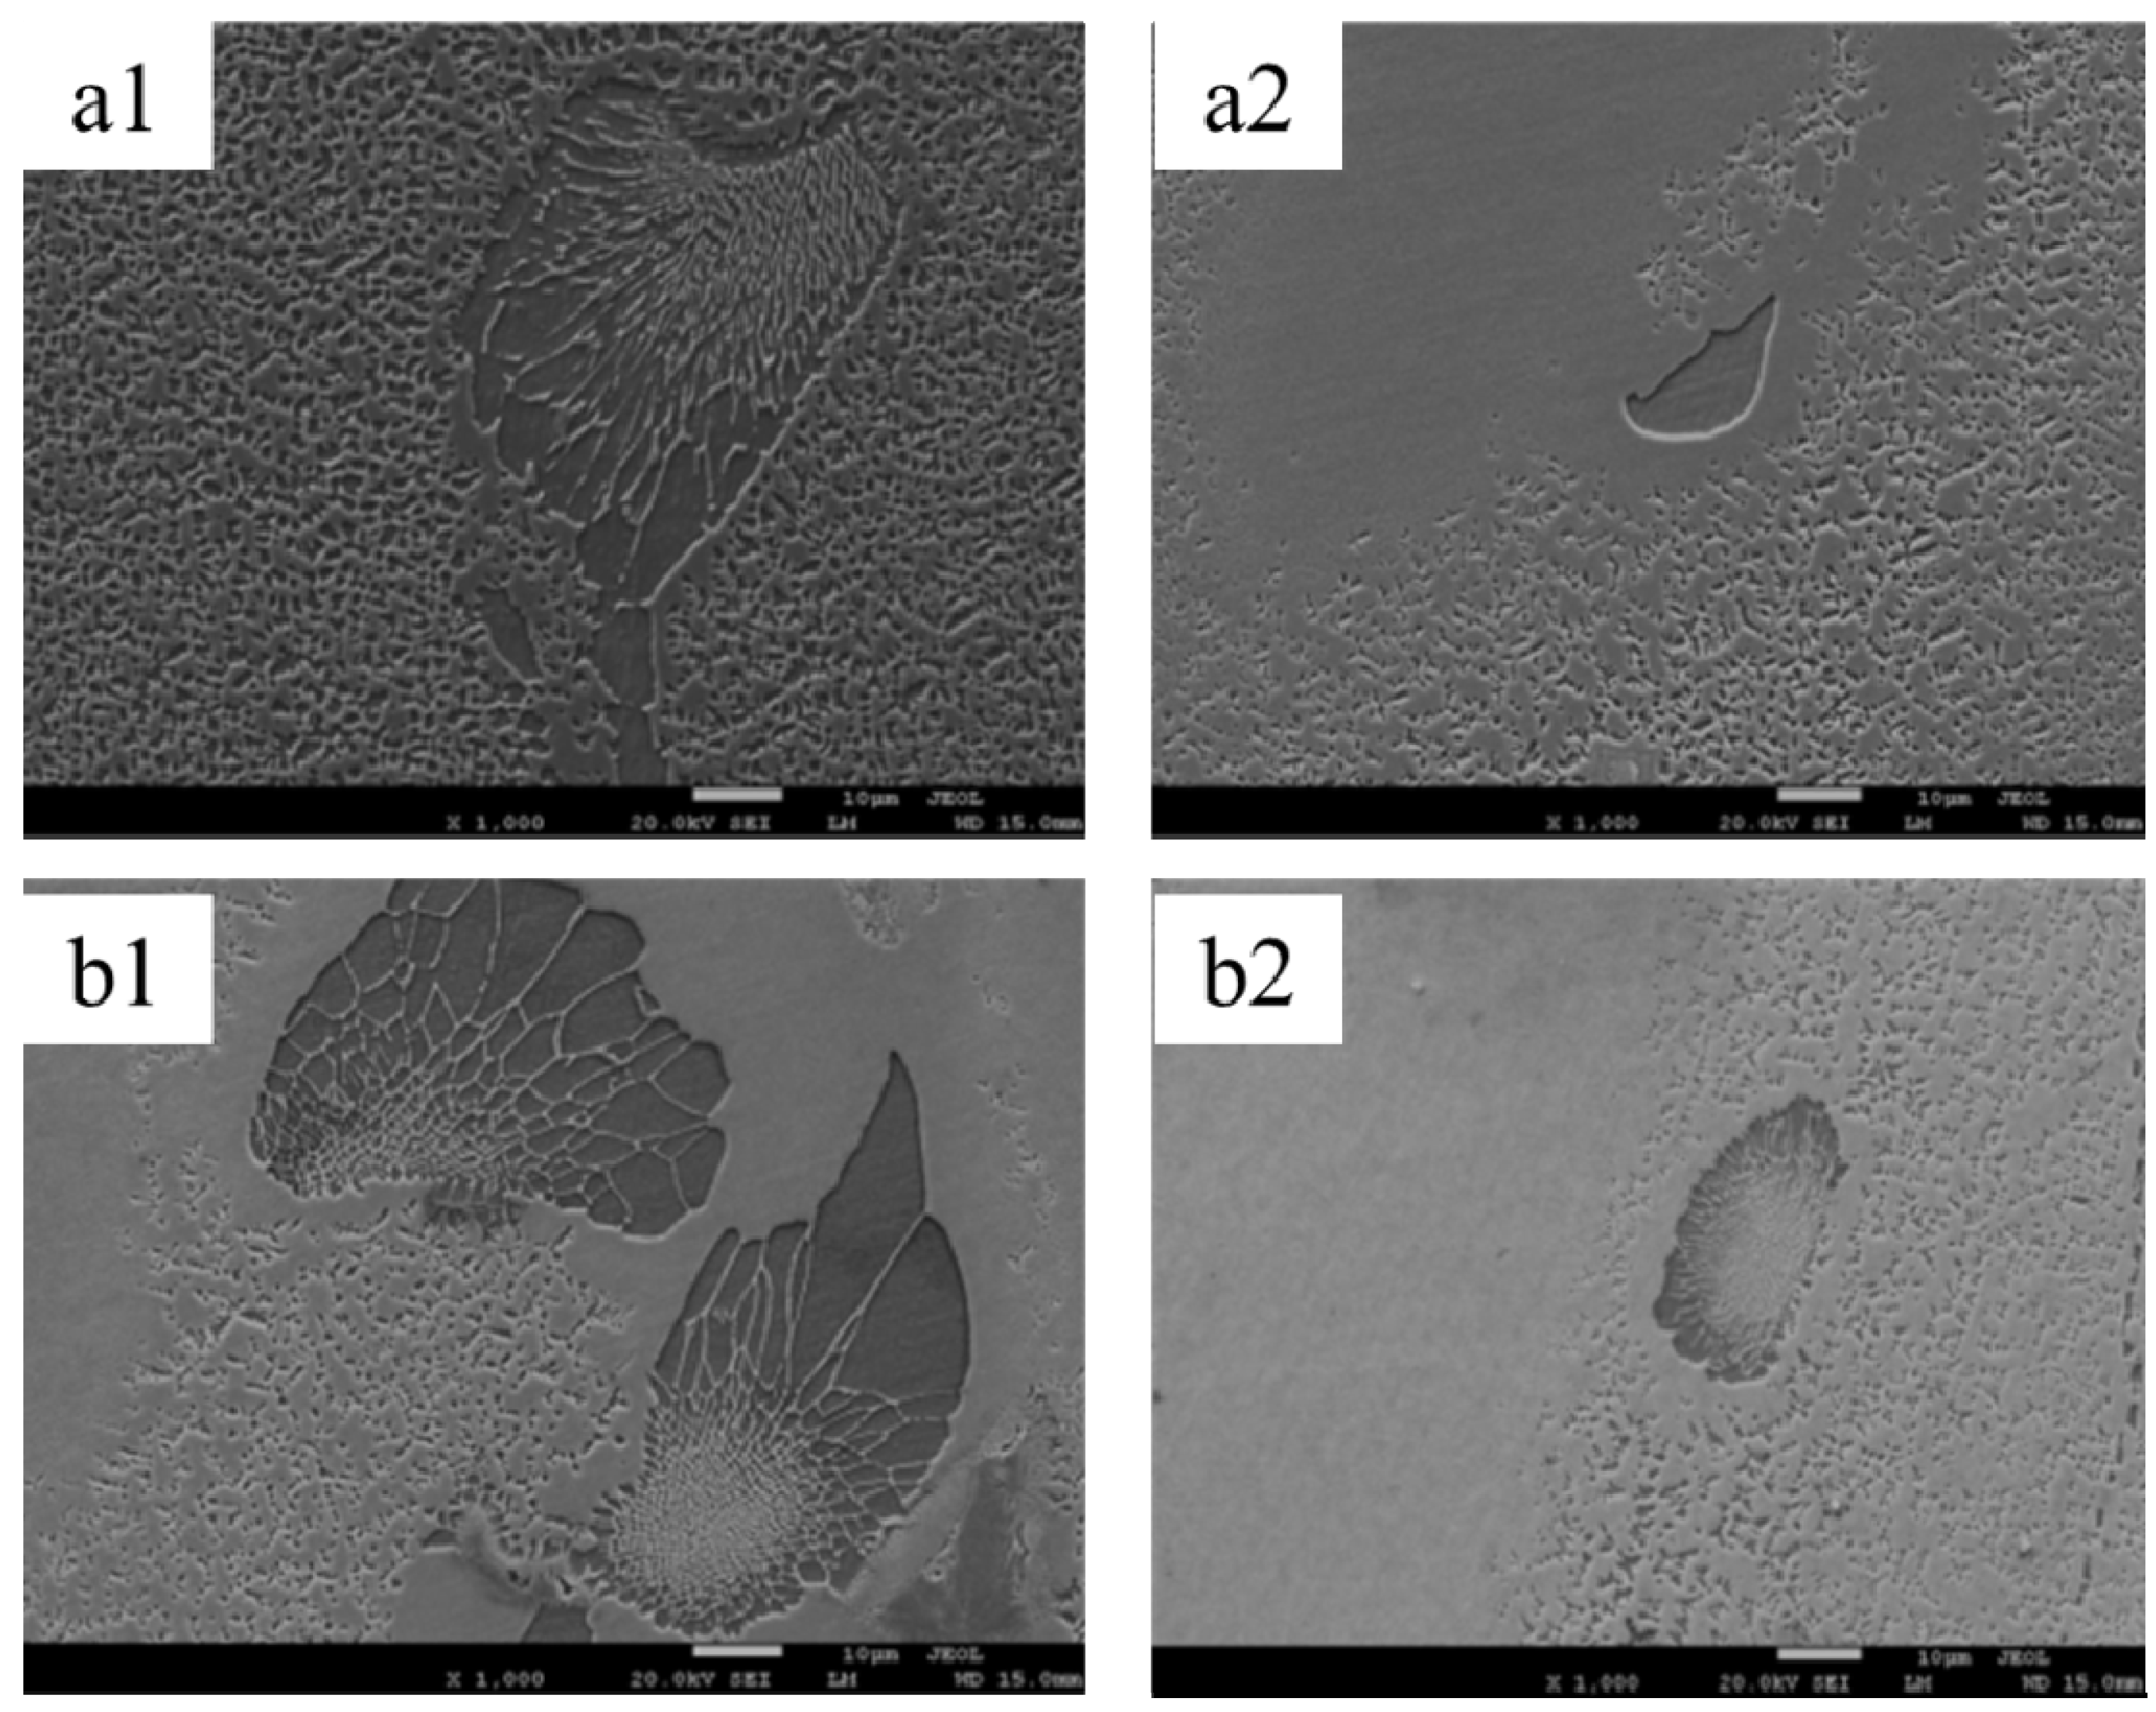
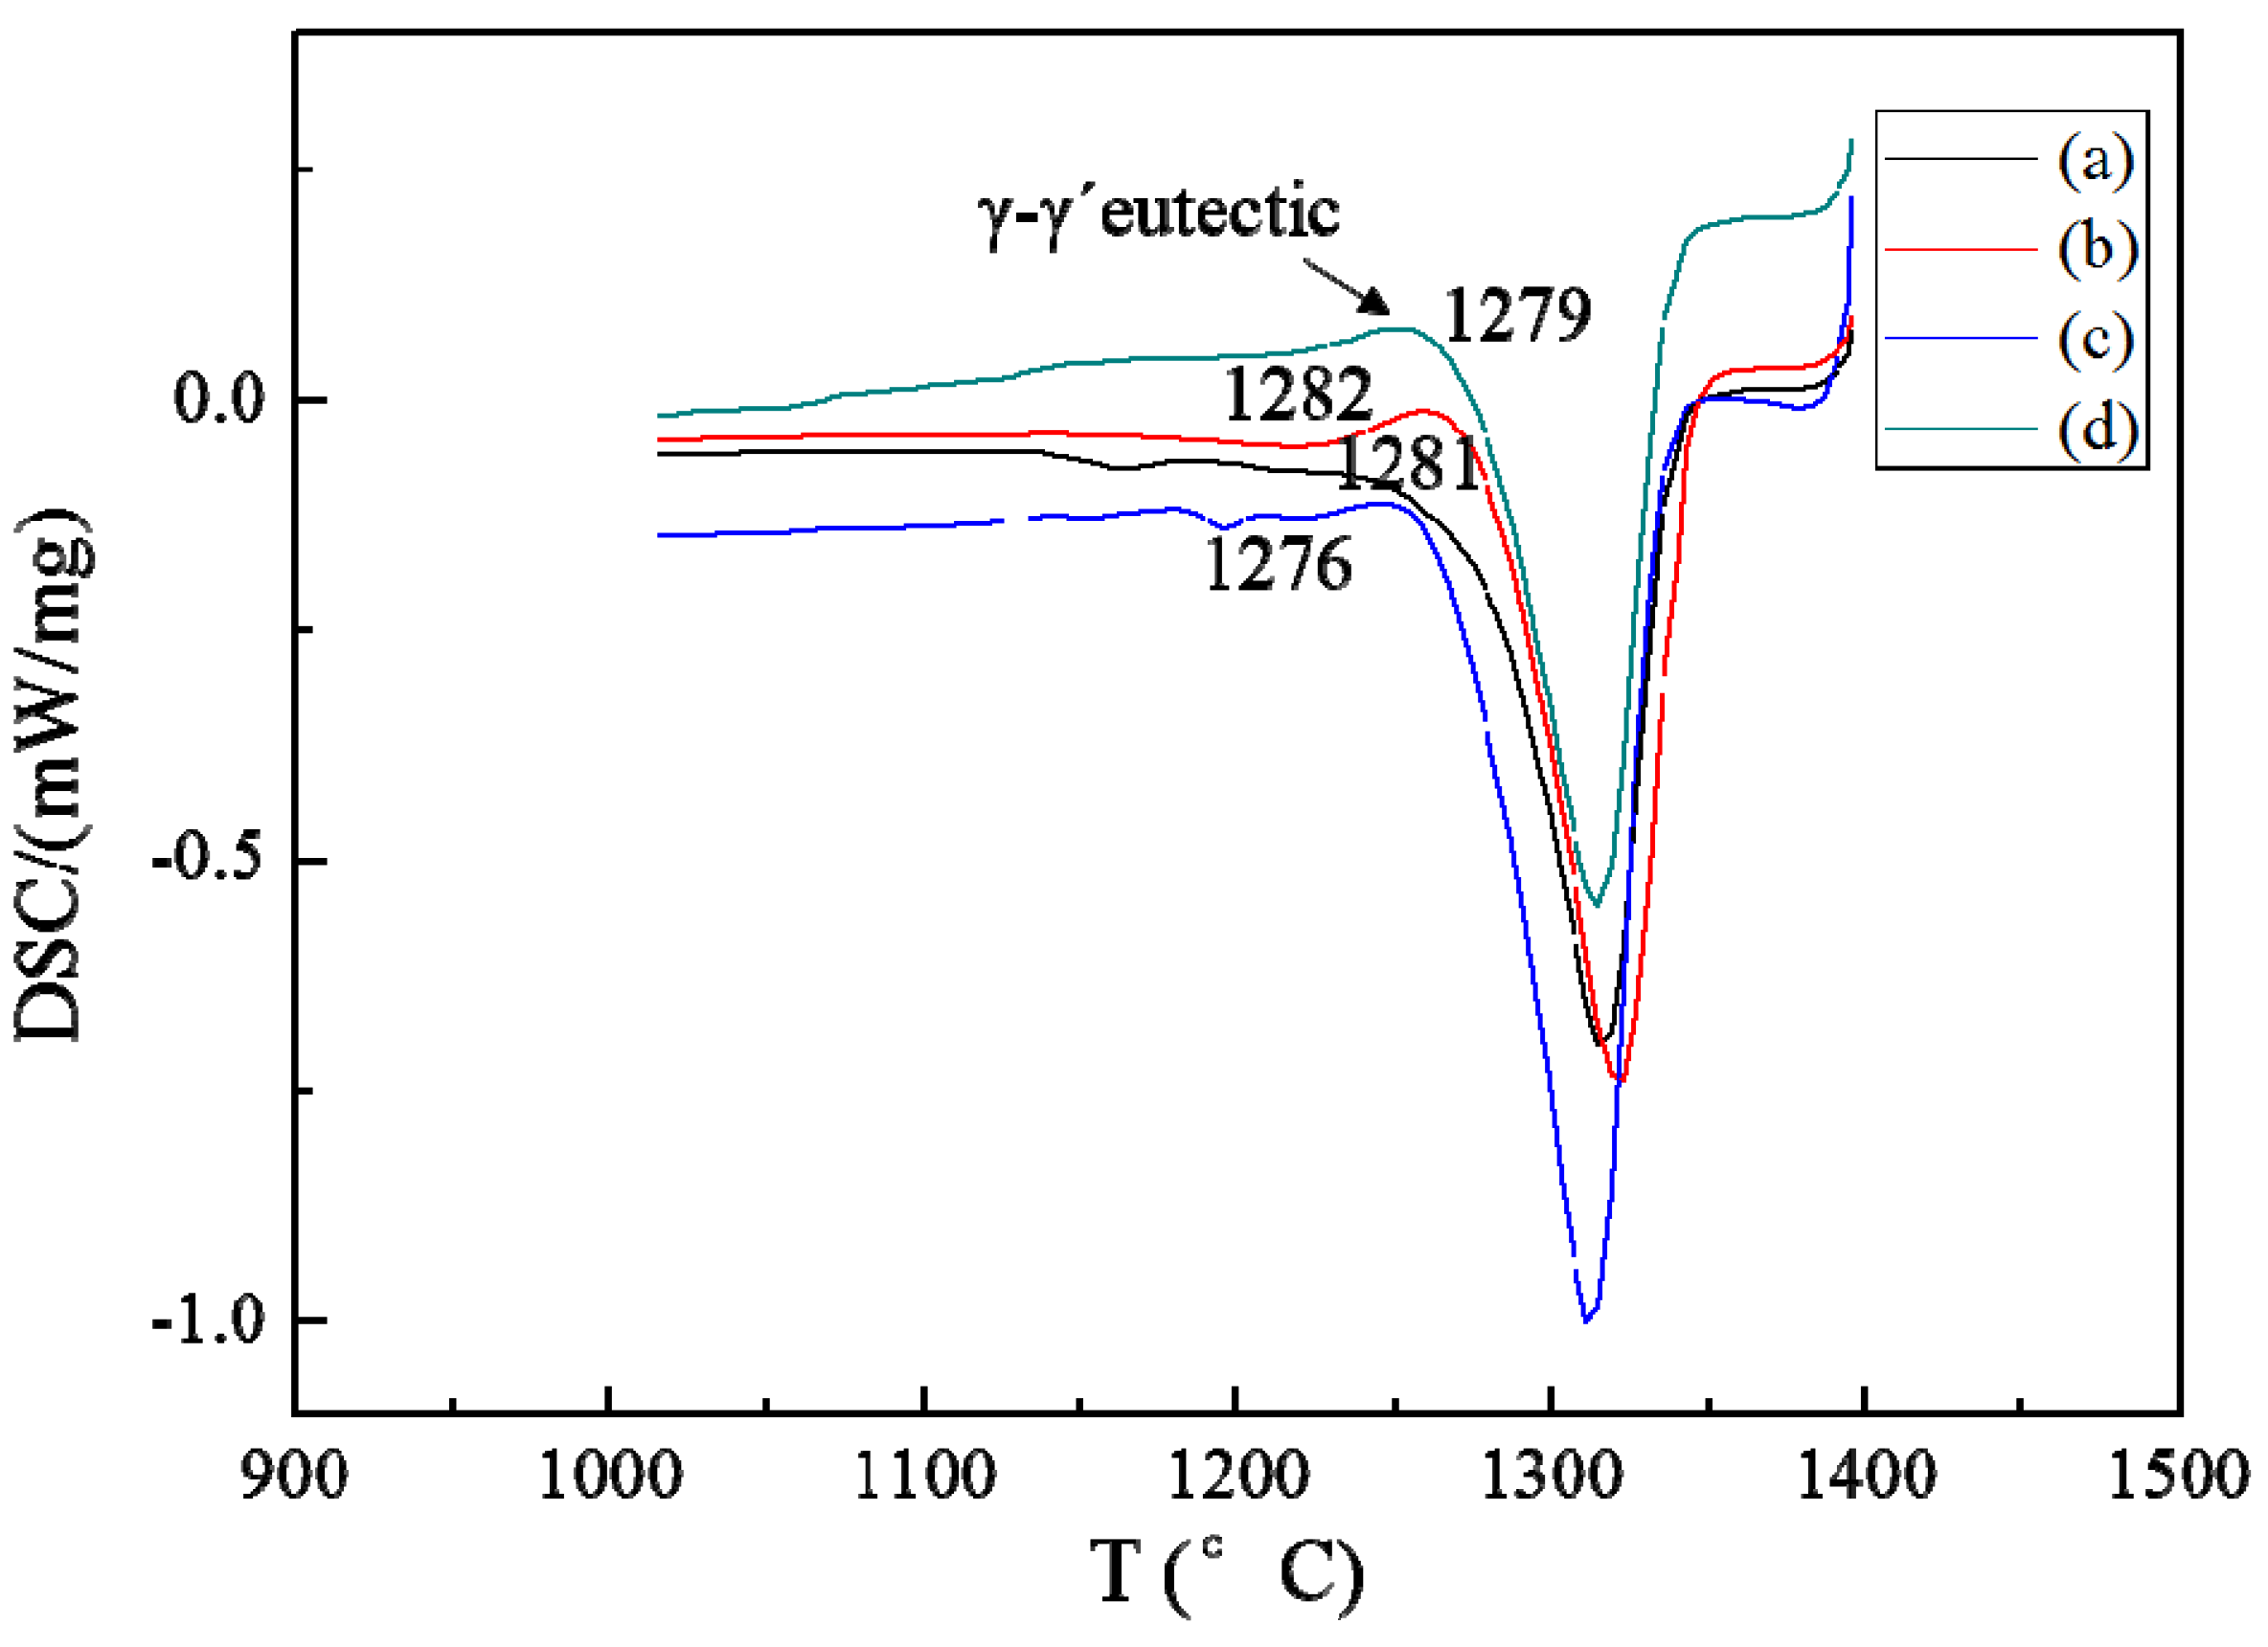
Figure 7 shows that at a temperature gradient of 80 K·cm
−1, drawing speed of 10 μm·s
−1 and diameter of 4 mm and 12 mm, the size of the γ-γ’ eutectic was decreased remarkably with a 0.5 T magnetic field. It was shown that a DSC test could confirm the change of eutectic [
13]. As shown in
Figure 8, both liquidus and solidus are encouraged slightly with the magnetic field; however, the solidification interval is not affected remarkably.
Table 1.
Influence of magnetic field on eutectic formation of directionally solidified superalloy at a temperature gradient of 80 K·cm−1, drawing speed of 10 μm·s−1.
Table 1.
Influence of magnetic field on eutectic formation of directionally solidified superalloy at a temperature gradient of 80 K·cm−1, drawing speed of 10 μm·s−1.
| Samples | Area fraction (%) |
|---|
| 0 T, diameter of 4 mm | 5.22 |
| 0.5 T, diameter of 4 mm | 1.52 |
| 0 T, diameter of 12 mm | 5.72 |
| 0.5 T, diameter of 12 mm | 1.95 |
Figure 6.
The morphology of γ-γ’ of directionally solidified superalloy at a temperature gradient of 80 K·cm−1, drawing speed of 10 μm·s−1: (a1) 0 T, diameter of 4 mm; (a2) 0.5 T, diameter of 4 mm; (b1) 0 T, diameter of 12 mm; (b2) 0.5 T, diameter of 12 mm.
Figure 6.
The morphology of γ-γ’ of directionally solidified superalloy at a temperature gradient of 80 K·cm−1, drawing speed of 10 μm·s−1: (a1) 0 T, diameter of 4 mm; (a2) 0.5 T, diameter of 4 mm; (b1) 0 T, diameter of 12 mm; (b2) 0.5 T, diameter of 12 mm.
Figure 7.
Scanning electron microscopy (SEM) image revealing the morphology of γ-γ’ eutectic of directionally solidified superalloy at a temperature gradient of 80 K·cm−1, drawing speed of 10 μm·s−1: (a1) 0 T, diameter of 4 mm; (a2) 0.5 T, diameter of 4 mm; (b1) 0 T, diameter of 12 mm; (b2) 0.5 T, diameter of 12 mm.
Figure 8.
DSC heating curve (1000–1400 °C, 20 °C·min−1) of directionally solidified superalloy at a temperature gradient of 80 K·cm−1, drawing speed of 10 μm·s−1: (a) 0 T, diameter of 4 mm; (b) 0.5 T, diameter of 4 mm; (c) 0 T, diameter of 12 mm; (d) 0.5 T, diameter of 12 mm.
Figure 8.
DSC heating curve (1000–1400 °C, 20 °C·min−1) of directionally solidified superalloy at a temperature gradient of 80 K·cm−1, drawing speed of 10 μm·s−1: (a) 0 T, diameter of 4 mm; (b) 0.5 T, diameter of 4 mm; (c) 0 T, diameter of 12 mm; (d) 0.5 T, diameter of 12 mm.
4. Experimental Section
The chemical composition of the used Ni-based superalloy CMSX-6 in this study is 0.0032 wt% C, 10.10 wt% Cr, 2.99 wt% Mo, 4.95 wt% Co, 1.98 wt% Ta, 4.84 wt% Al, 4.72 wt% Ti, 0.021 wt% Fe, 0.0018 wt% S, 0.056 wt% Si, 0.01 wt% Mn, 0.088 wt% Hf, 0.0006 wt% Mg and Ni as balance. The raw alloy was melted in an induction furnace under vacuum conditions and cast into an ingot with a diameter of 200 mm. The directional solidification samples with 4 mm and 12 mm in diameter and 80 mm in length, were electro-discharge machined from the cast ingots. Then they were enveloped in high purity corundum tubes with inner diameters of 4 mm and 12 mm and length of 100 mm.
The directional solidification was carried out in a Bridgman-Stockbarge type furnace. The temperature in the furnace was controlled with a precision of ±0.1 °C. A water-cooled cylinder containing liquid Ga-In-Sn metal (LMC) was used to cool down the specimen. The temperature gradient in the specimen was controlled by adjusting the temperature of the hot zone in the furnace, which was insulated from the LMC by a corundum disc. The static superconductor magnet used could produce a horizontal static magnetic field with a maximum adjustable intensity of 0.7 T.
During the experiment, the samples in the corundum crucibles were melted at 1500 °C and directionally solidified in the Bridgman apparatus by pulling the crucible assembly into the LMC cylinder at various velocities. After 60 mm steady-state growth of the specimen, the quenching experiment was carried out by quickly withdrawing the crucible into the LMC cylinder. The temperature gradient was 80 K·cm−1, and the drawing speed were 5, 10, 20 μm·s−1 in this study. The specimen for microstructure analysis was polished, etched in a solution of HCl and H2O2 at a proportion of 1:1. Then the microstructure was observed on an Imager A1m optical microscope (Zeiss, Oberkochen, Germany) and JSM7600F scanning electron microscope (SEM) (JEOL, Tokyo, Japan). The compositions of these minor phases were investigated via an energy dispersive X-ray spectroscope (EDS) (JEOL, Tokyo, Japan). The eutectic volume was counted using the DT2000 V2.0 image analysis system (DT East Image, Nanjing, China). The differential scanning calorimeter (DSC) of NETZSCH DSC404 (NETZSCH, Bavarian Asia, Germany) was used for thermal analysis. The DSC error of measurements of the equipment we used was ±0.2 °C.


