
Structural, Surface, in vitro Bacterial Adhesion and Biofilm Formation Analysis of Three Dental Restorative Composites


Abstract
:
1. Introduction
2. Results
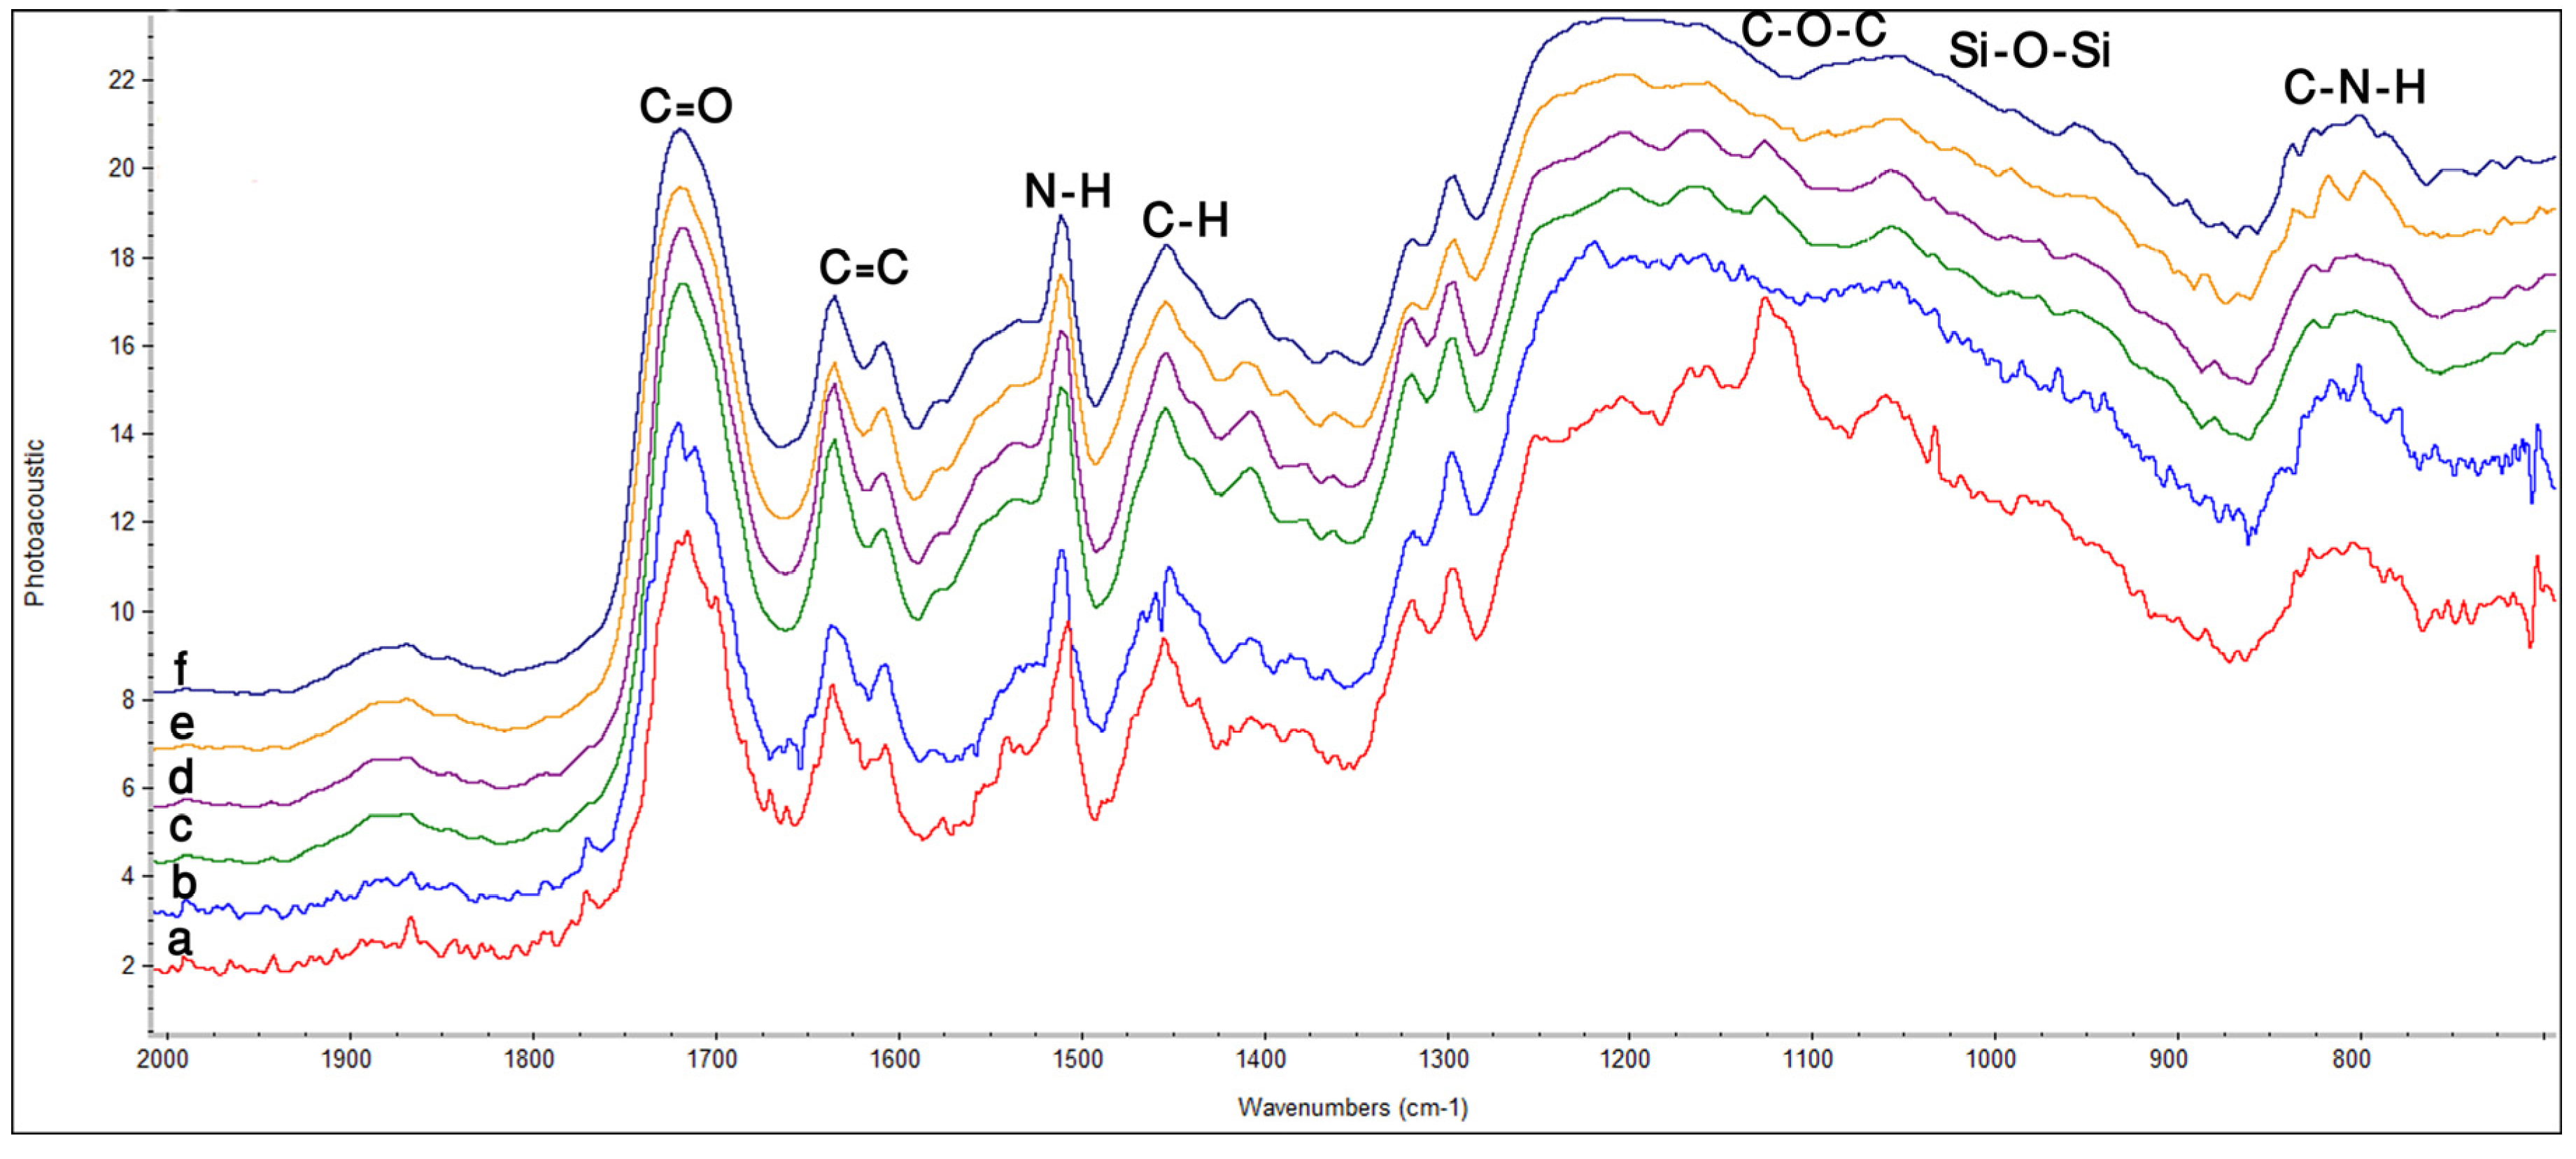
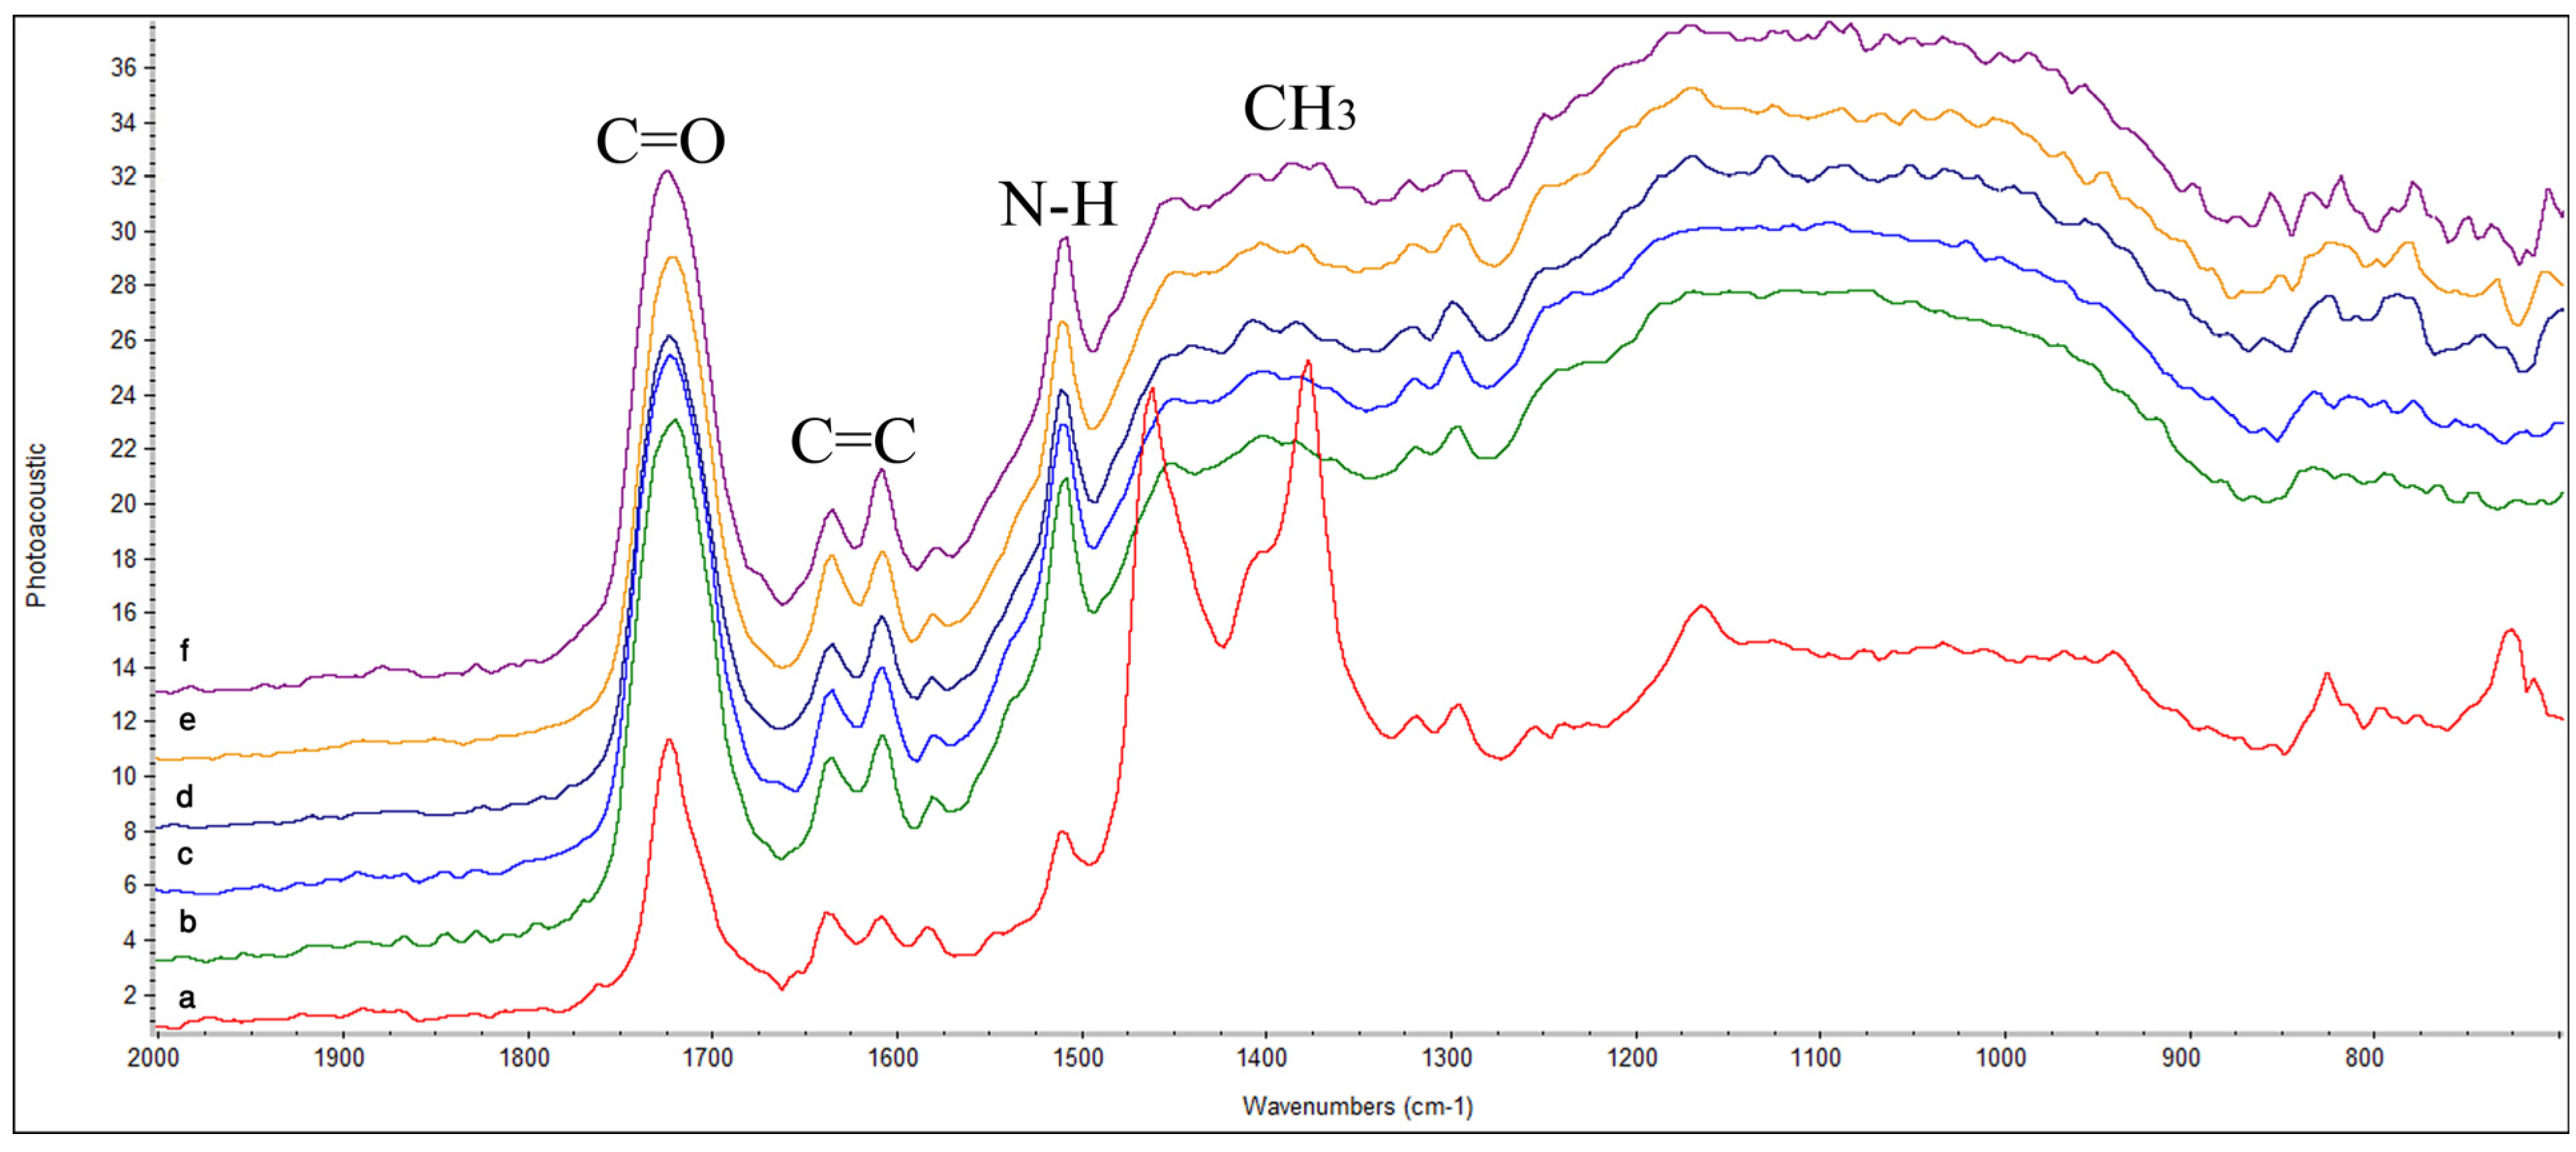
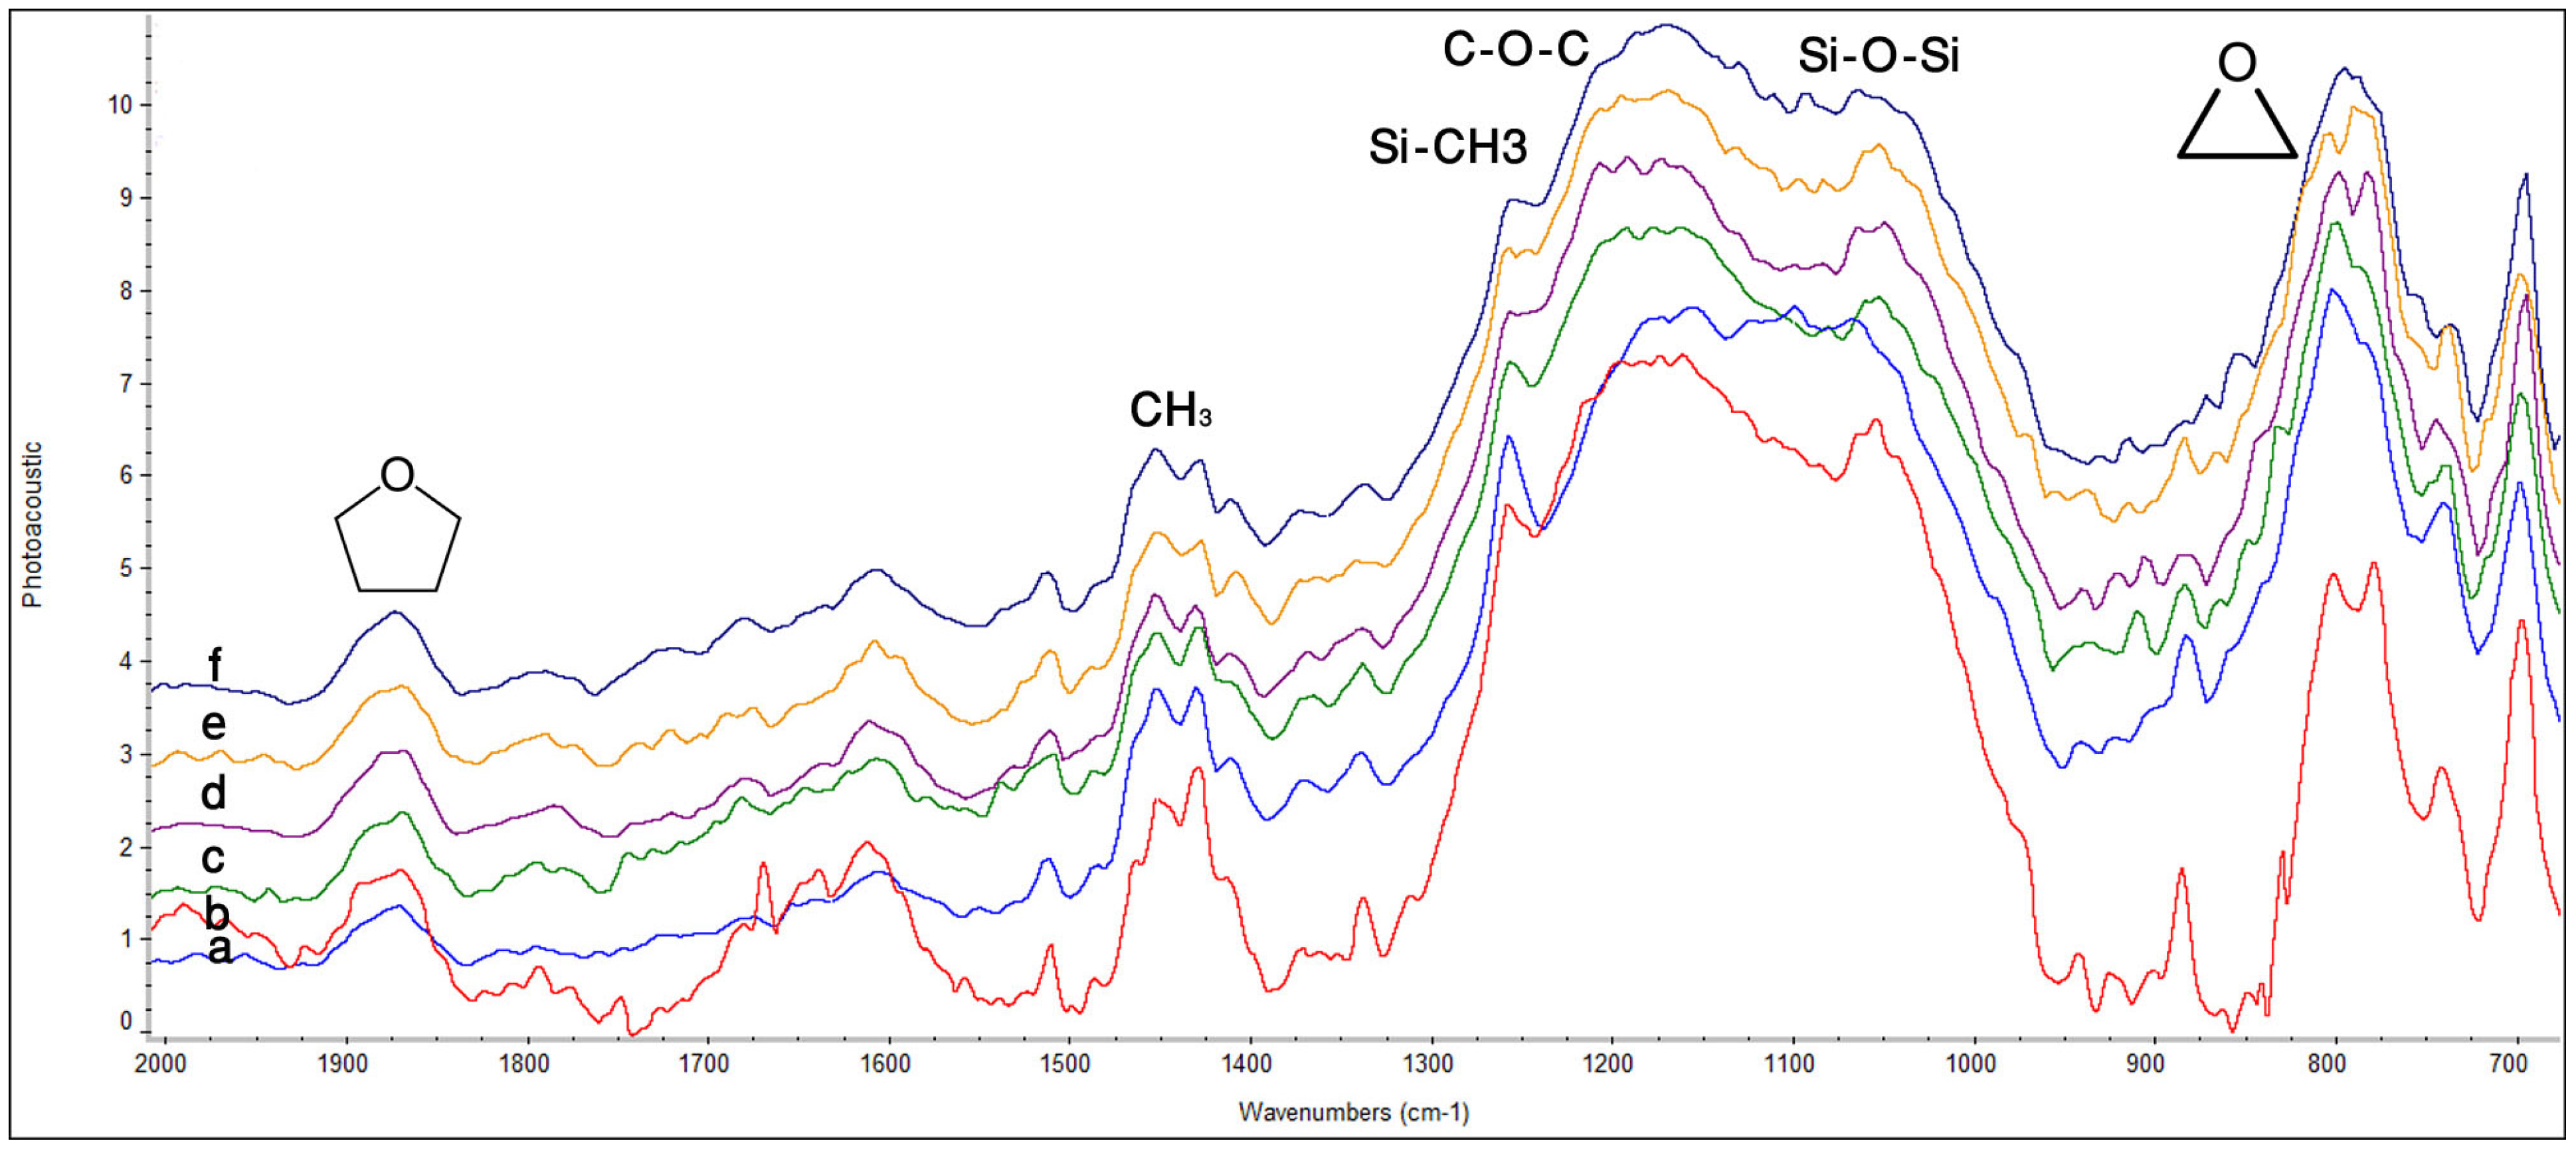
2.1. Fourier Transform Infrared Spectroscopy (FTIR)

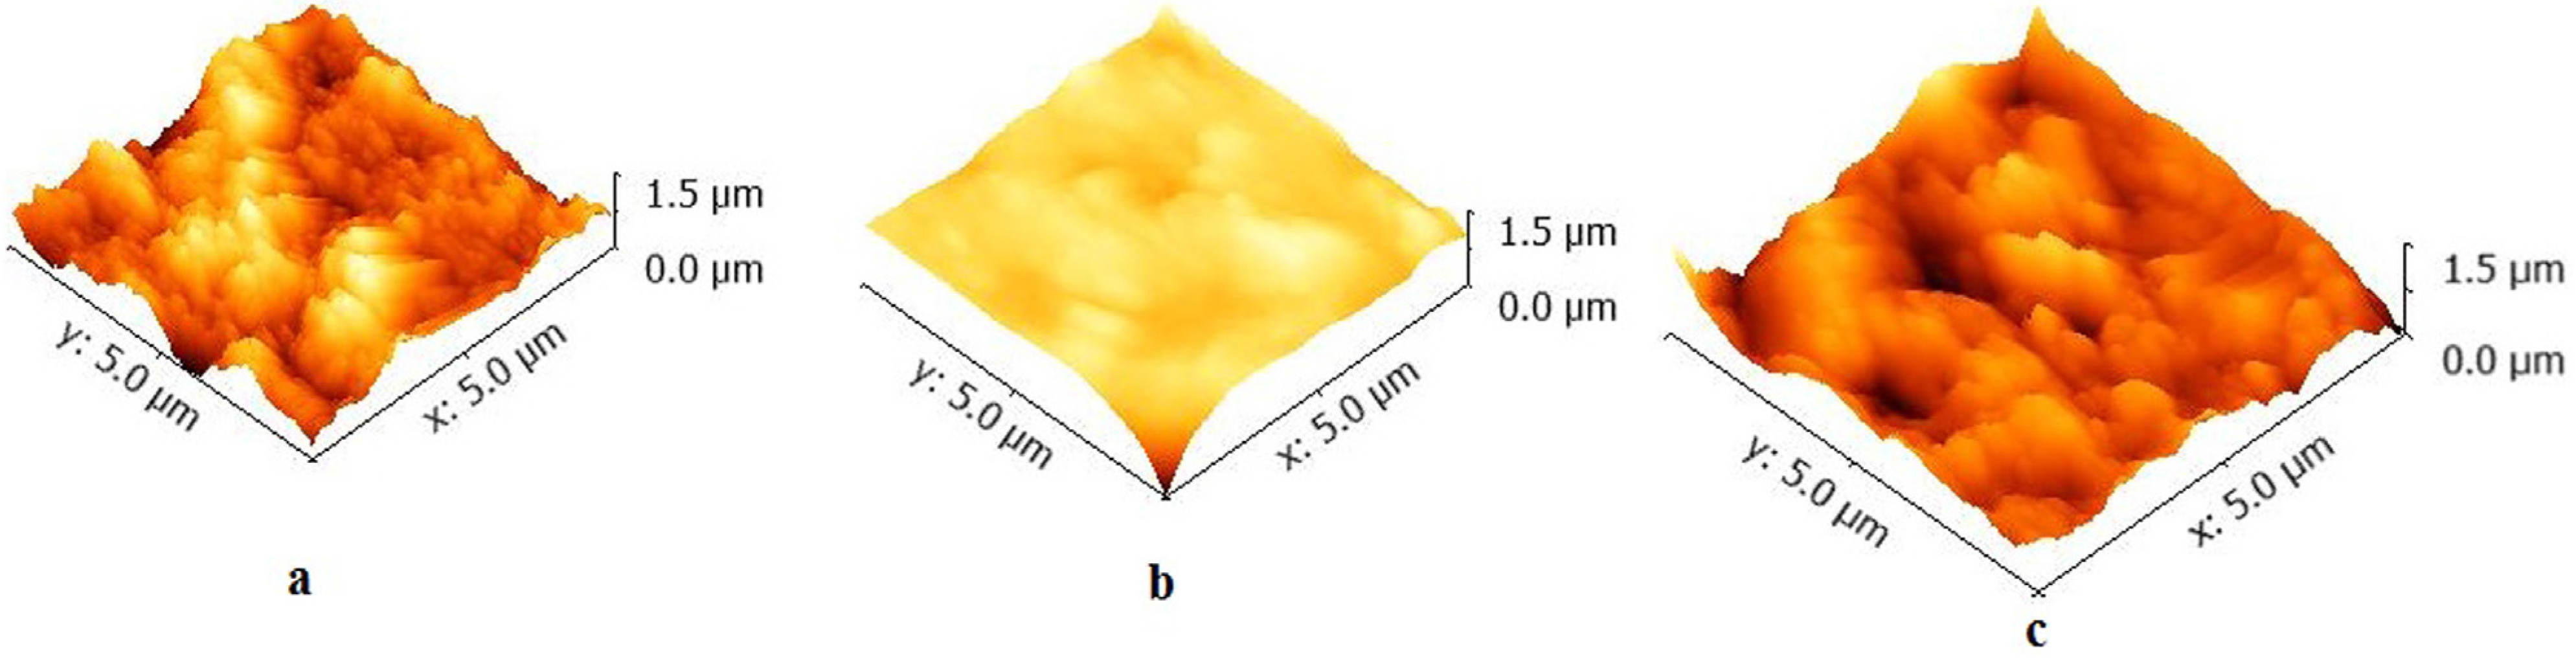
2.2. Atomic Force Microscopy (AFM)


| Samples | Surface Roughness (nm) Ra/Rms | Minimum grain size (µm) |
|---|---|---|
| Z350 | 64.1/89.1 | 0.24 |
| TPH | 166/235 | 0.27 |
| P90 | 54.4/66.4 | 0.32 |
2.3. Contact Angle Measurement
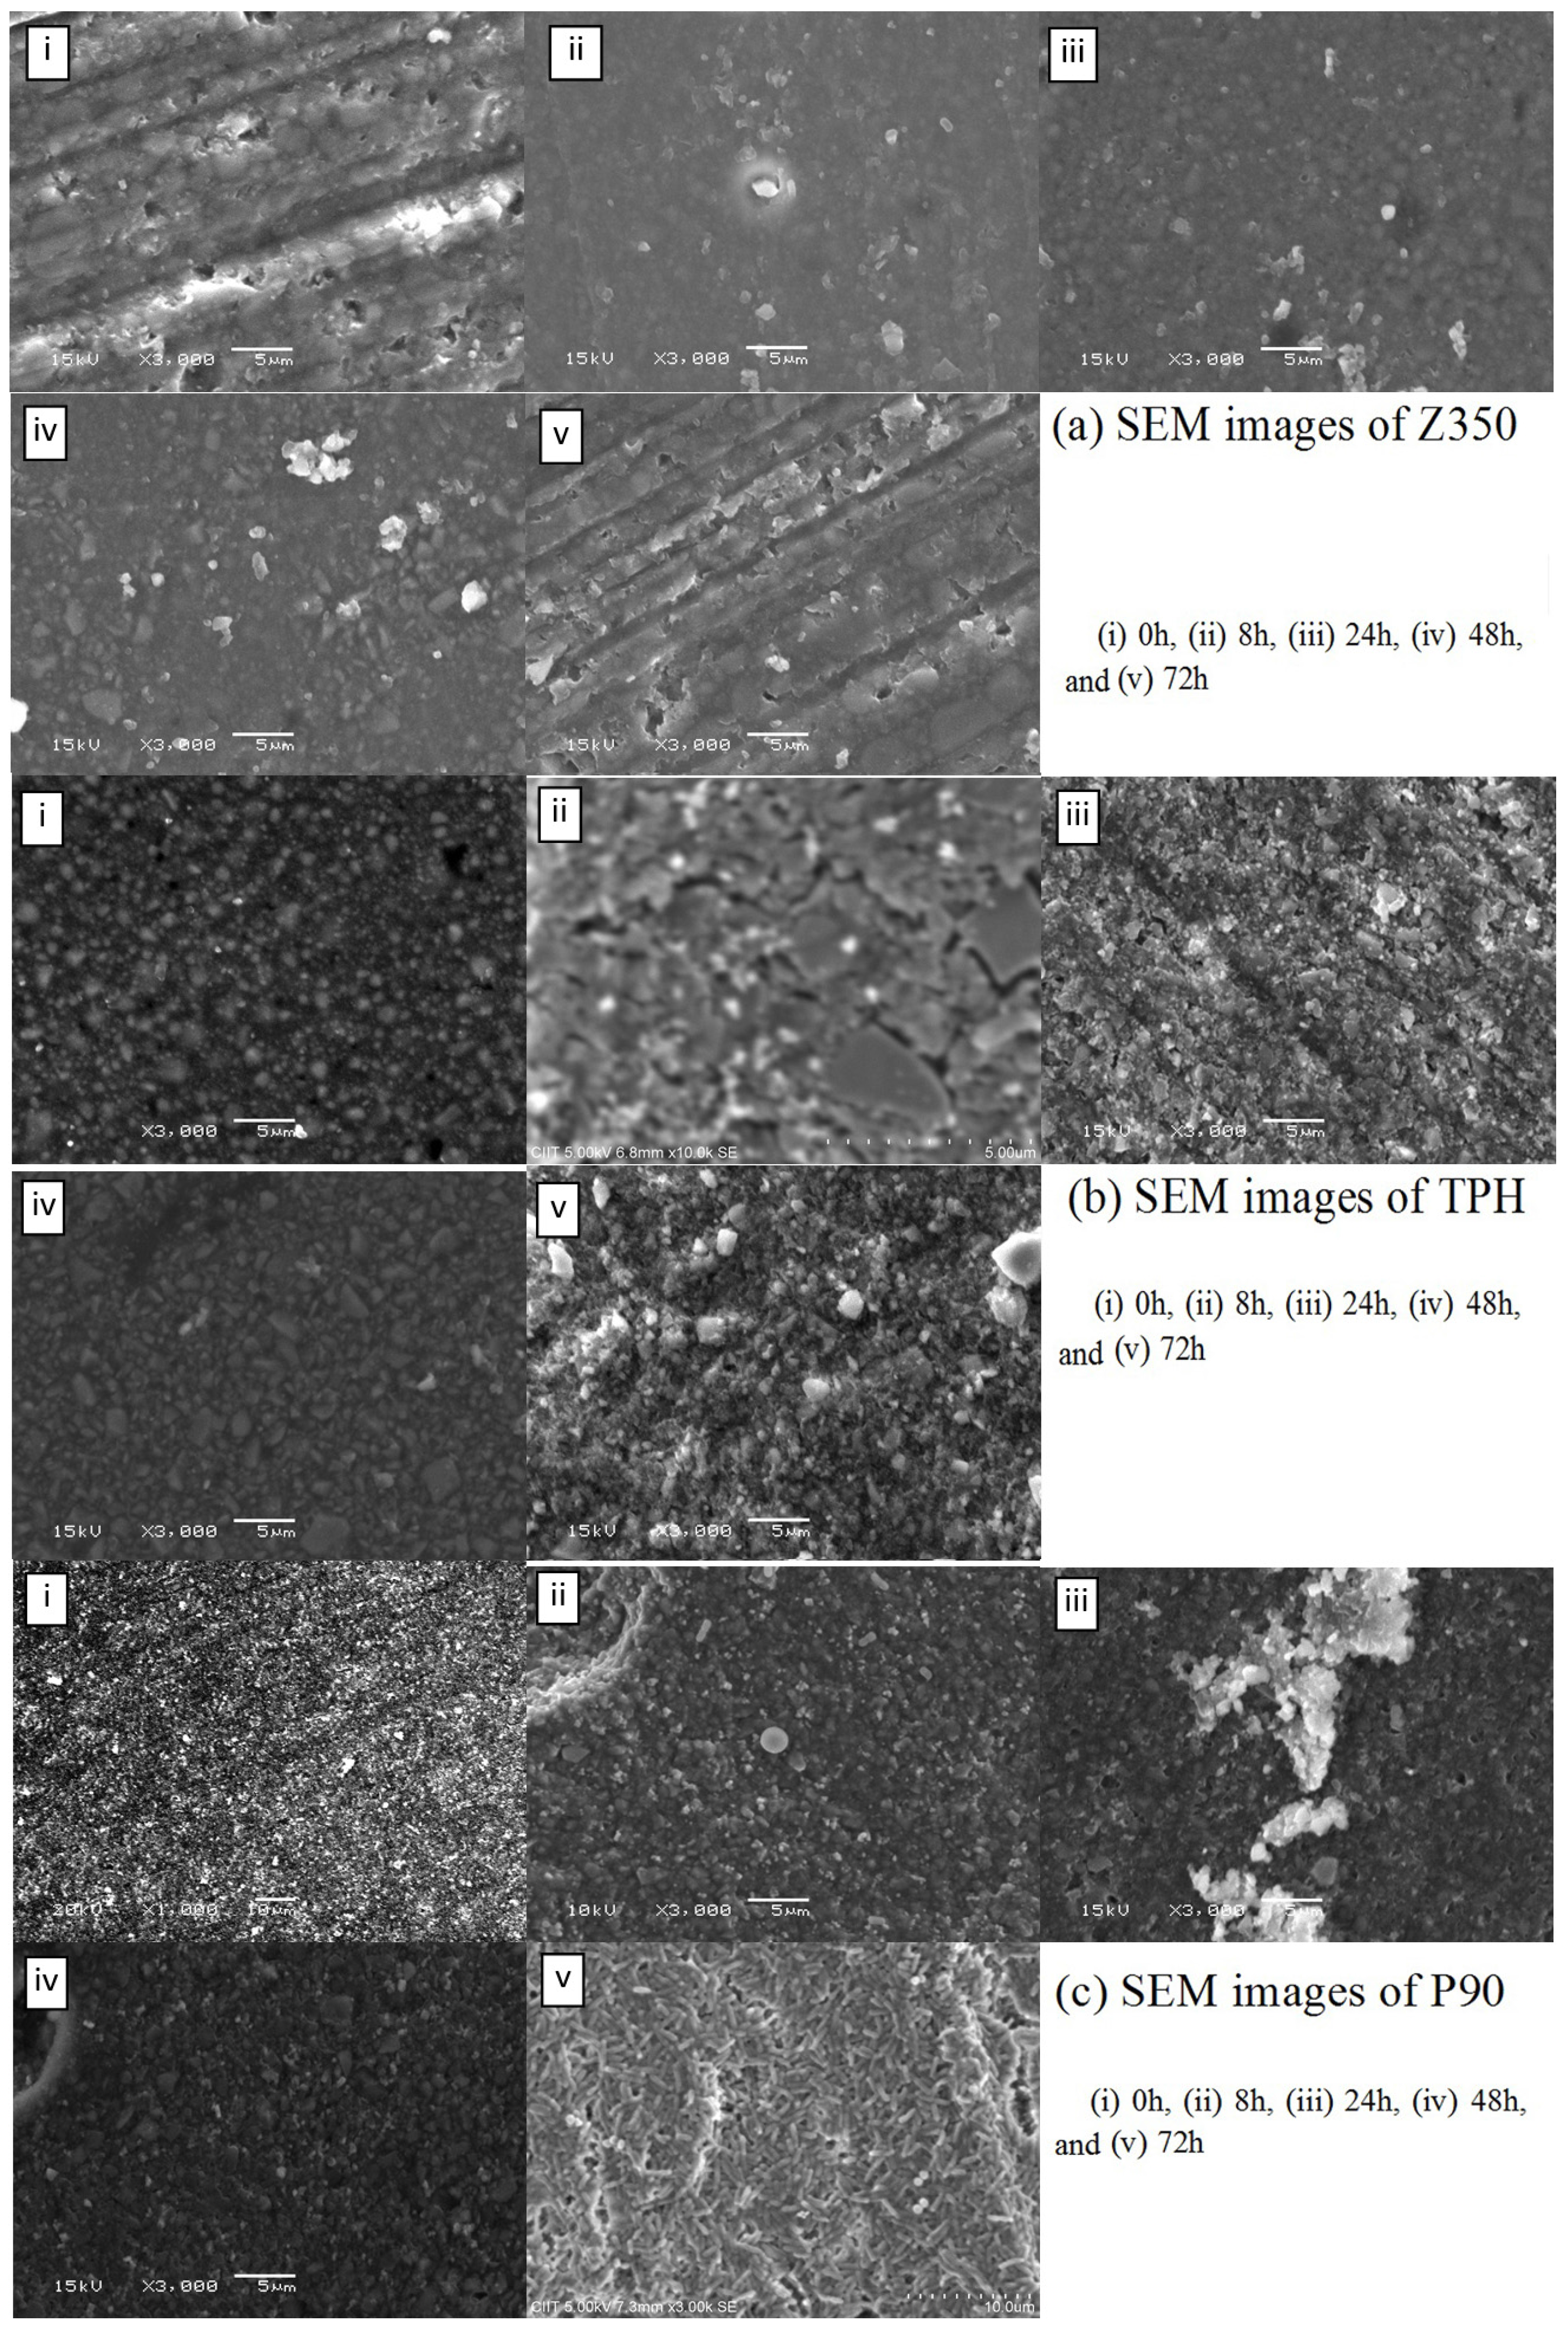
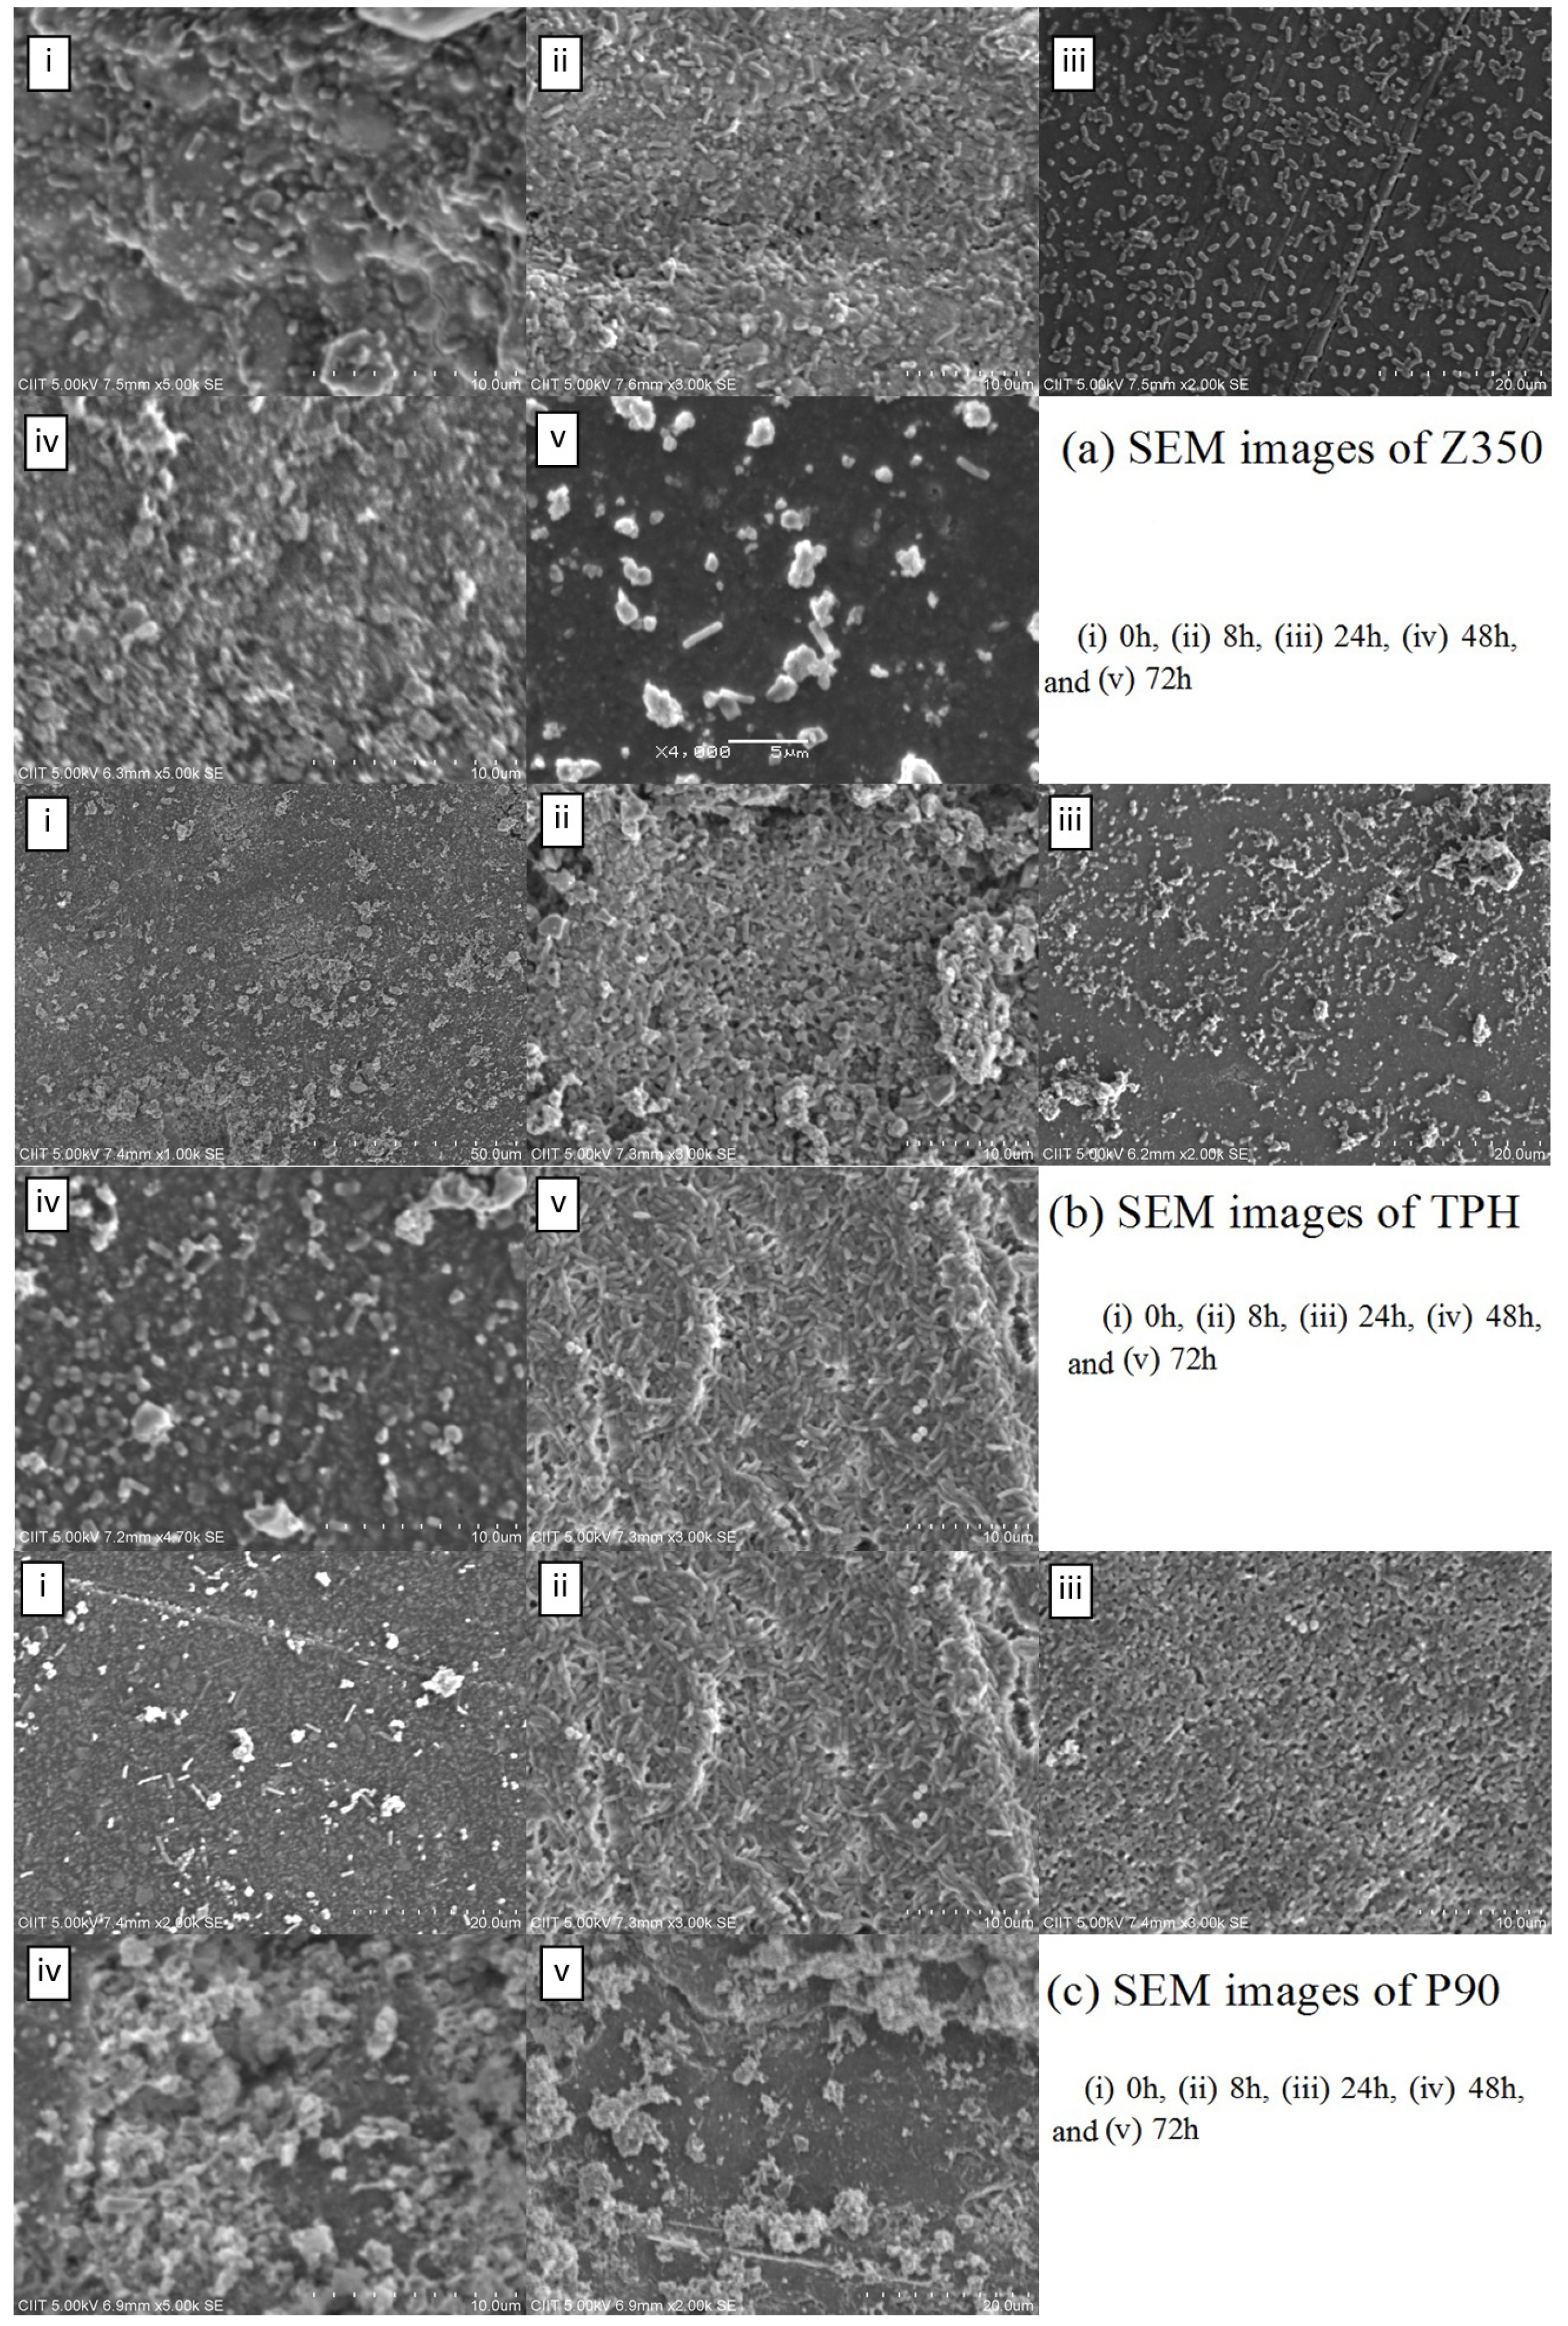
2.4. Bacterial Adhesion
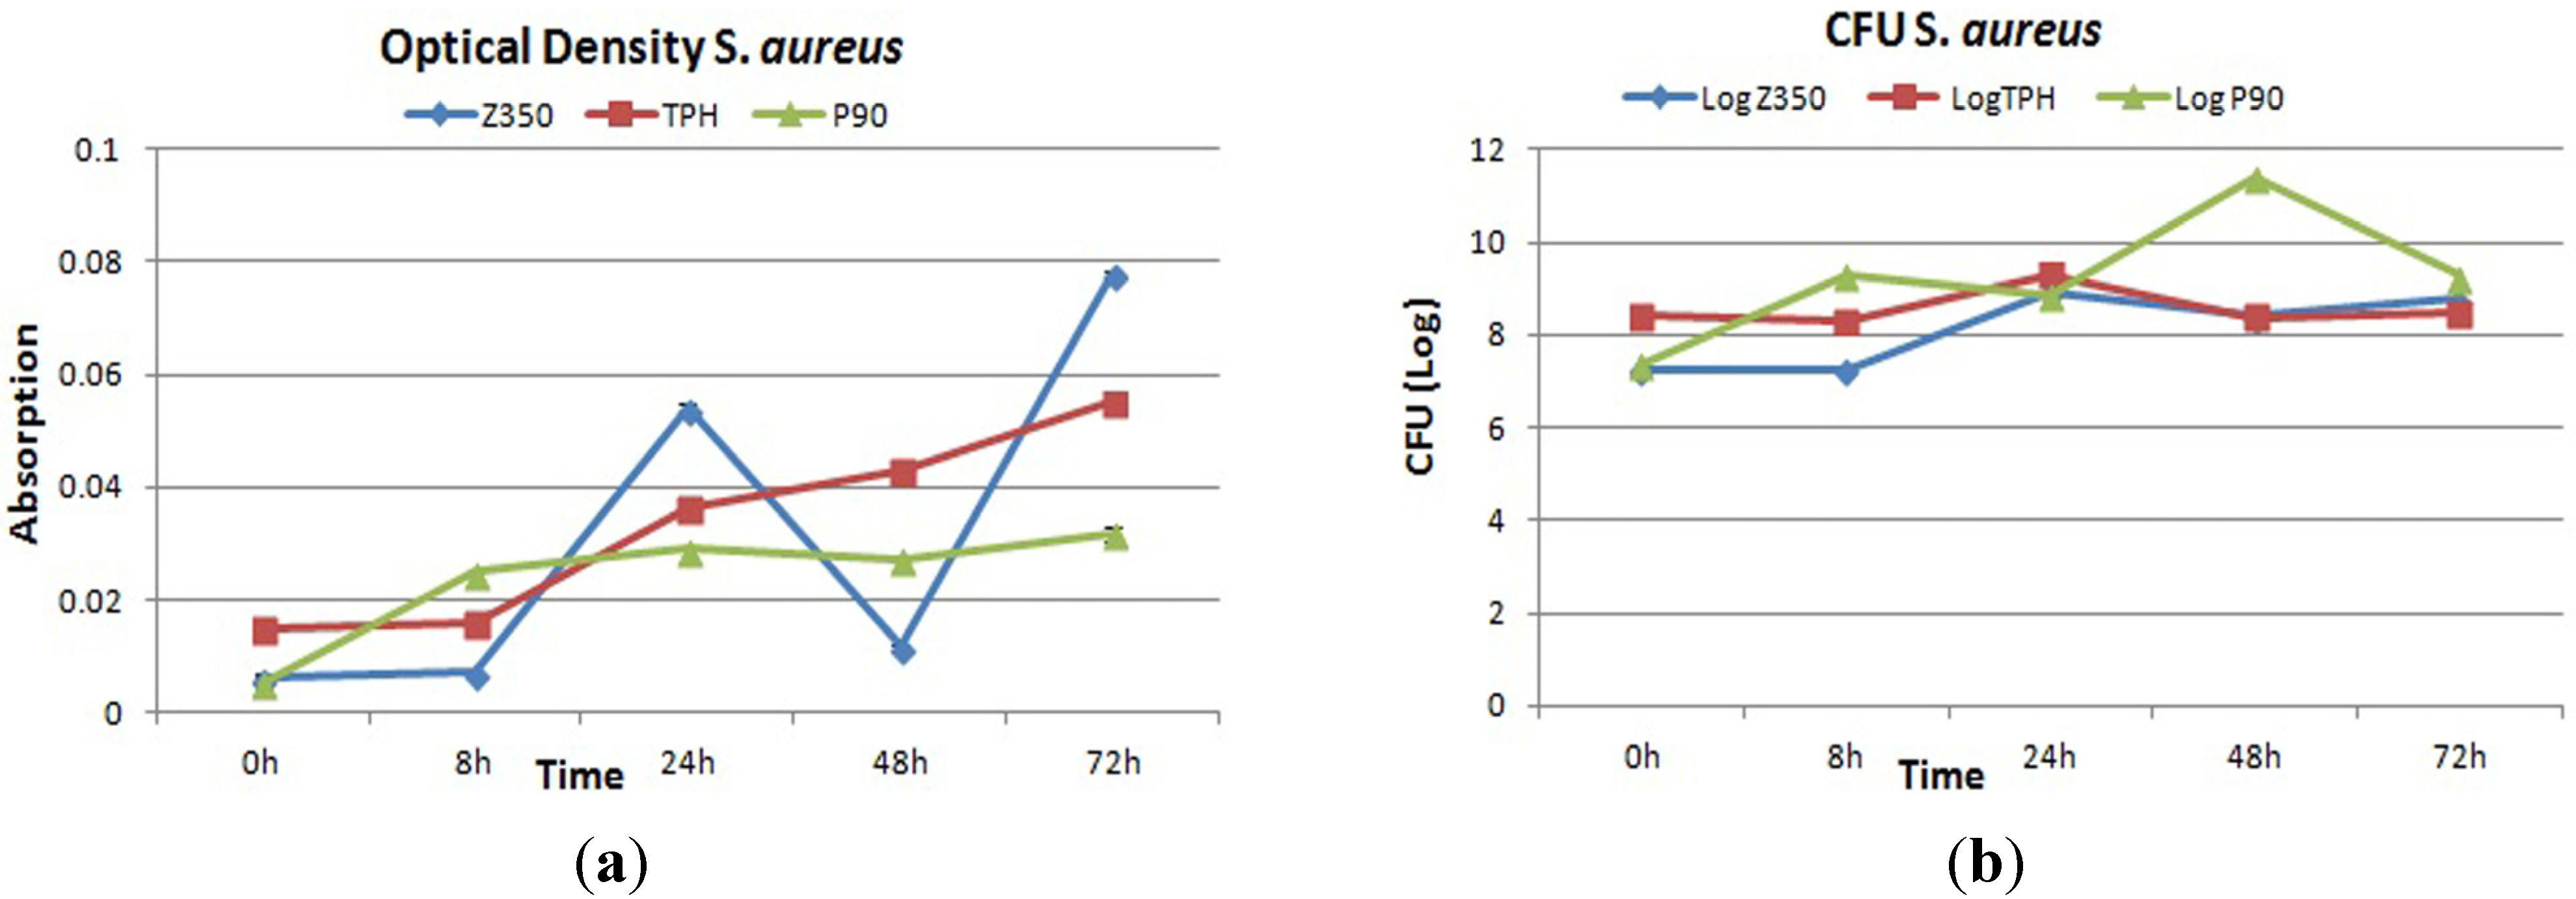
2.4.1. S. aureus
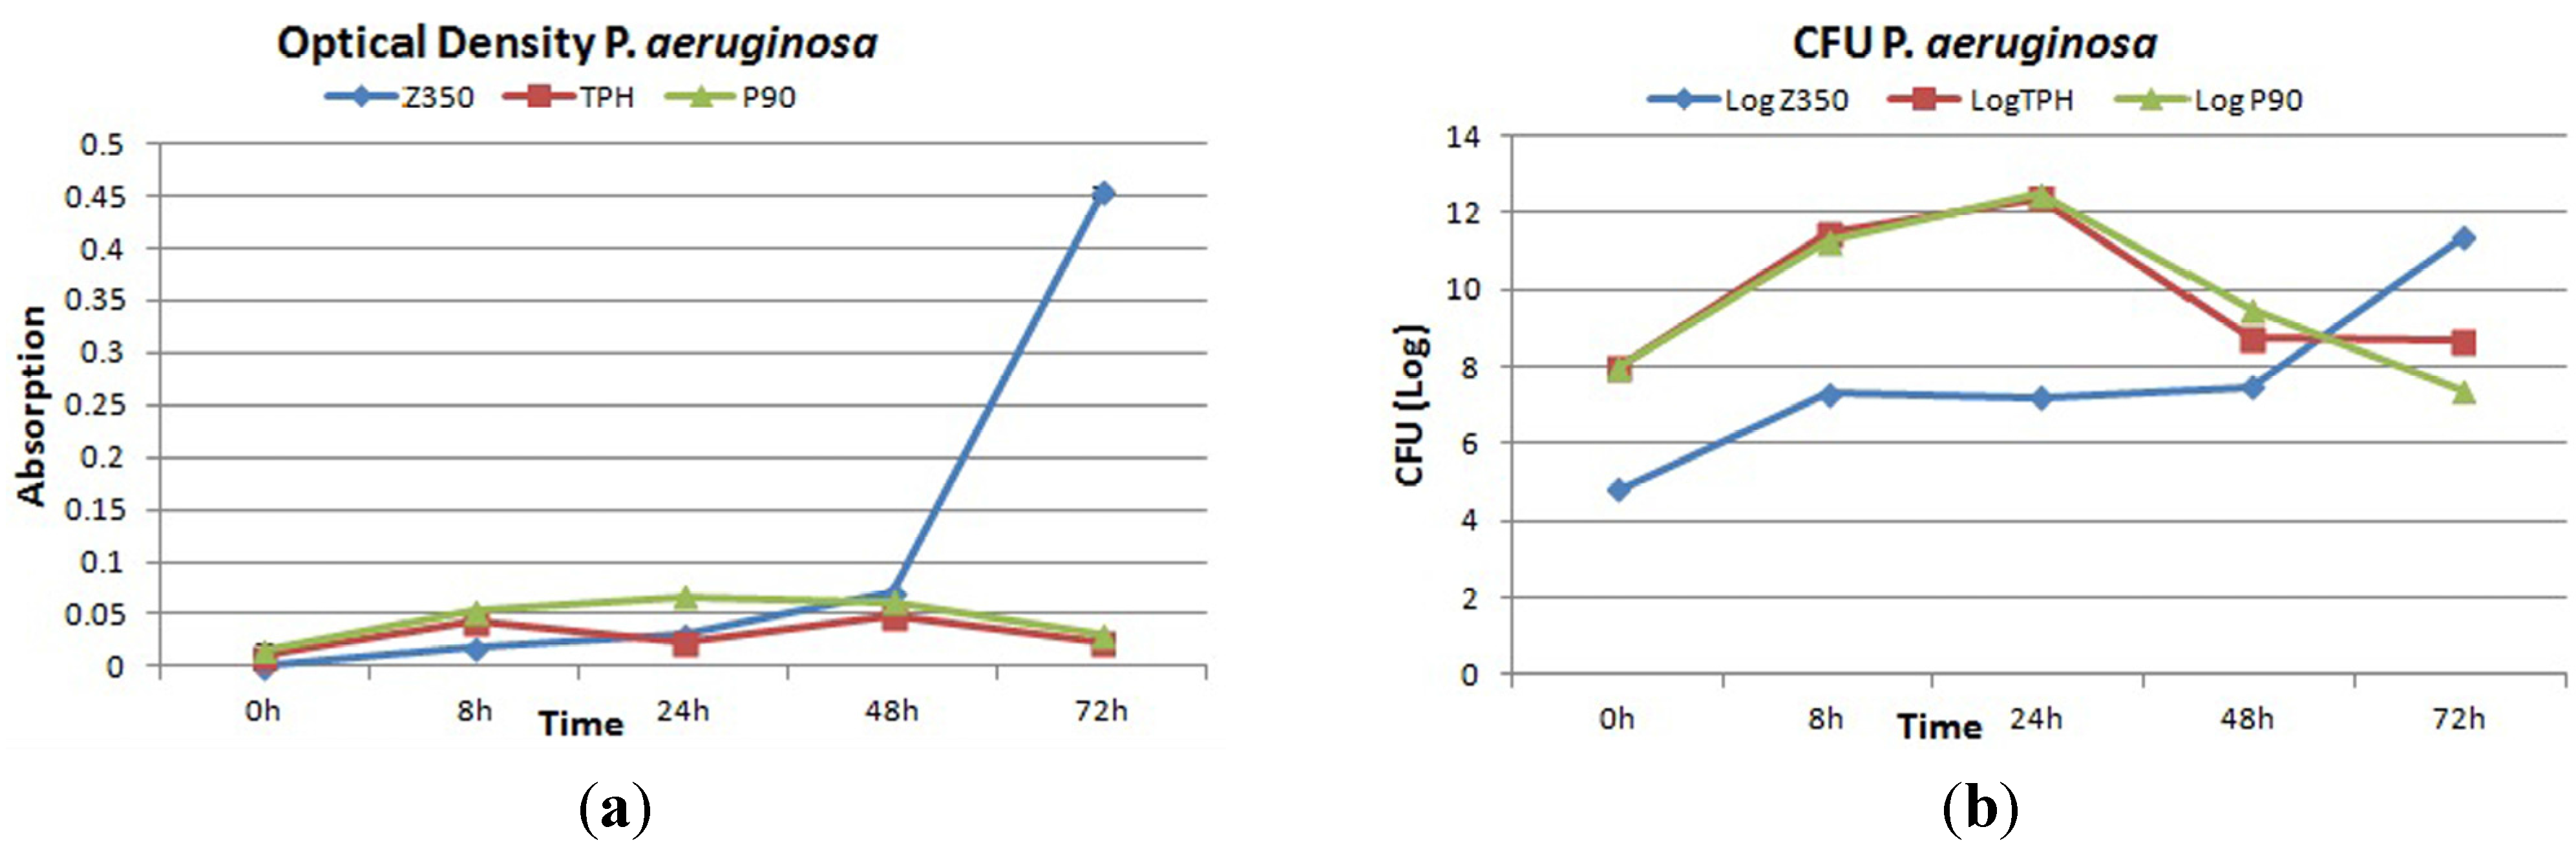
2.4.2. P. aeruginosa

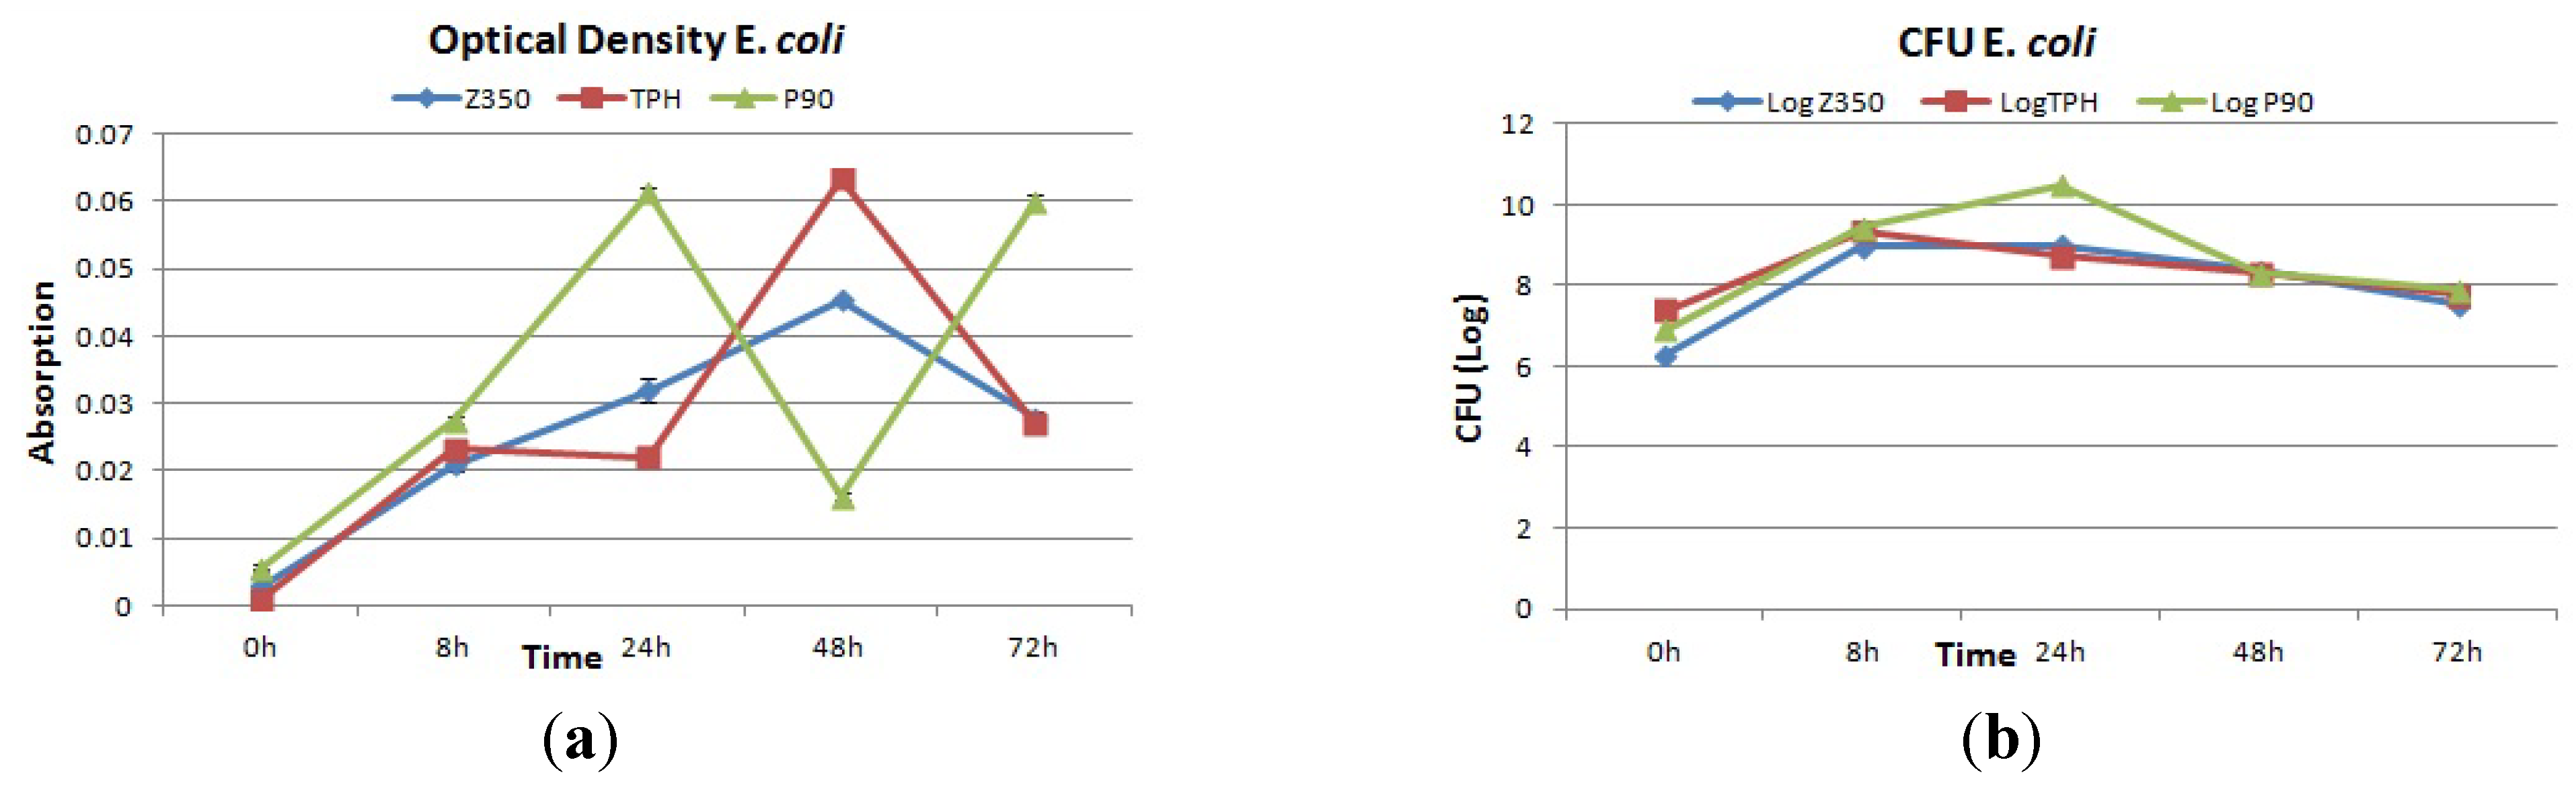
2.4.3. E. coli

3. Discussion
4. Materials and Methods
4.1. Sample Preparation
4.2. Characterization
4.2.1. Fourier Transform Infrared Spectroscopy (FTIR)
| Composite Material | Manufacturer | Composition* |
|---|---|---|
| Filtek™ Z350 | 3M ESPE Filtek, Germany | Resins: Bis-GMA, UDMA, TEGDMA and Bis-EMA.Filler: zirconia, nano-silica particles59.5% vol. 82% wt |
| Spectrum®TPH® | Dentsply, Germany | Resins: Bis-GMA-adduct TEGDMA and Bis-EMA.Fillers: barium aluminiumborosilicate |
| Filtek™ P90 | 3 M ESPE Filtek, Germany | Resins: siloxane and oxirane polymersFiller: silanized fine quartz particles and radiopaque yttrium fluoride.55% vol. 76% wtSilane coupling agent with epoxy layer |
4.2.2. Atomic Force Microscopy (AFM)
4.2.3. Contact Angle Measurements
4.2.4. Bacterial Strains and Growth Conditions
4.2.5. Adhesion Testing
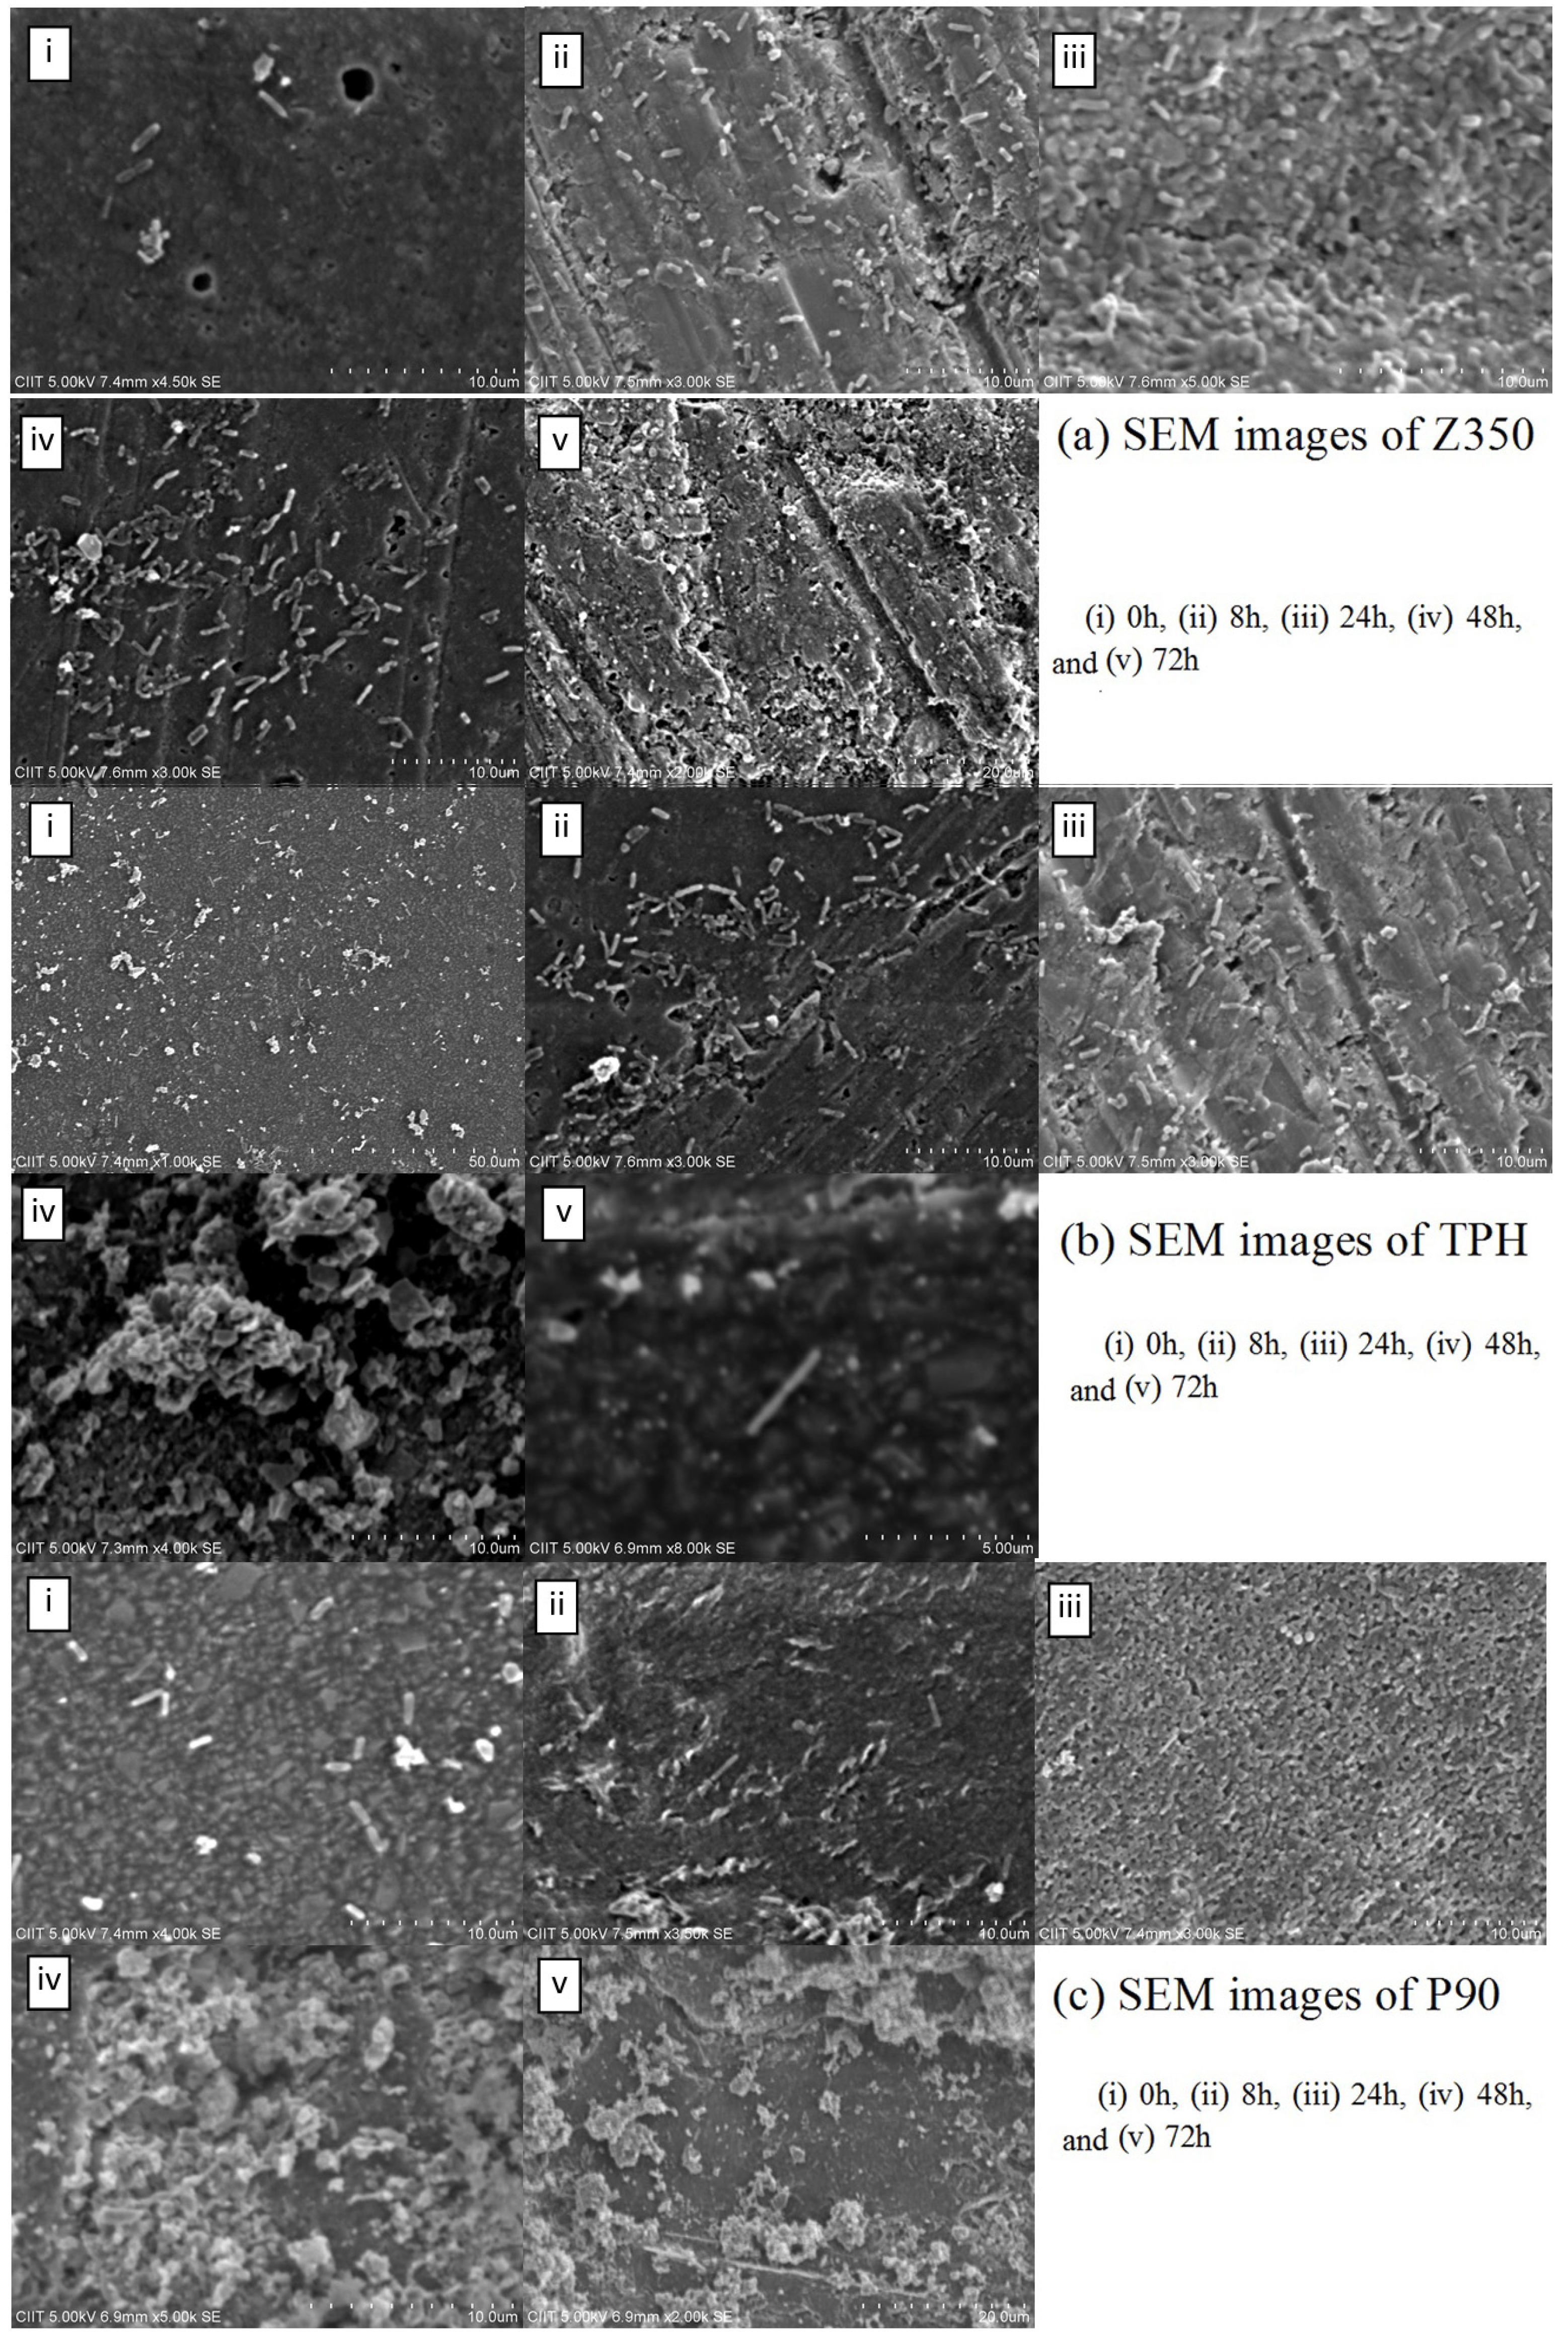
4.2.6. Scanning Electron Microscopy (SEM)
5. Conclusions
Acknowledgments
Author Contributions
Conflicts of Interest
References
- Khan, A.S.; Tahir, M.T.; Khan, M.; Mian, S.A.; Rehman, I.U. An update on glass fiber dental restorative composites: A systematic review. Mater. Sci. Eng. C 2015, 47, 26–39. [Google Scholar] [CrossRef] [PubMed]
- Grossman, E.; Matejka, J. Amalgam restoration and in vitro caries formation. J. Prosthet. Dent. 1995, 73, 199–209. [Google Scholar] [CrossRef]
- Mejare, B.; Mejare, I.; Edwardsson, S. Bacteria beneath composite restorations—A culturing and histobacteriological study. Acta. Odontol. Scand. 1979, 37, 267–275. [Google Scholar] [CrossRef] [PubMed]
- Mjor, I. The reasons for replacement and the age of failed restorations in general dental practice. Acta. Odontol. Scand. 1997, 55, 58–63. [Google Scholar] [CrossRef] [PubMed]
- Merrett, M.; Elderton, R. An in vitro study of restorative dental treatment decisions and dental caries. Br. Dent. J. 1984, 157, 128–133. [Google Scholar] [CrossRef] [PubMed]
- Mjor, I.; Moorhead, J.; Dahl, J. Reasons for replacement of restorations in permanent teeth in general dental practice. Int. Dent. J. 2000, 50, 361–366. [Google Scholar] [CrossRef] [PubMed]
- Mjor, I.; Toffenetti, F. Placement and replacement of resin-based composite restorations in Italy. Oper. Dent. 1992, 17, 82–85. [Google Scholar] [PubMed]
- Mo, S-S.; Bao, W.; Lai, G-Y.; Wang, J.; Li, M-Y. The Microfloral Analysis of Secondary Caries Biofilm around Class I and Class II Composite and Amalgam Fillings. BMC Infec. Dis. 2010, 10, 241–246. [Google Scholar] [CrossRef] [PubMed]
- Lovegrove, J.M. Dental plaque revisited: Bacteria associated with periodontal disease. J. N. Z. Soc. Periodontol. 2004, 87, 7–21. [Google Scholar] [PubMed]
- Mack, D.; Becker, P.; Chaterjee, I.; Dobinsky, S.; Knoblock, J.K.M.; Peters, G.; Rohde, H.; Hermann, M. Mechanisms of biofilm formation in Staphylococcus epidermidis and Staphylococcus aureus: Functional molecules, regulatory circuits, and adaptive responses. Int. J. Med. Microb. 2004, 294, 203–212. [Google Scholar] [CrossRef] [PubMed]
- Orstavik, D.; Orstavik, J. In vitro attachment of Streptococcus sanguis to dental crown and bridge cements. J. Oral. Rehabil. 1976, 3, 139–144. [Google Scholar] [CrossRef] [PubMed]
- Hansel, C.; Leyhausen, G.; Mai, U.E.H.; Geurtsen, W. Effects of various resin composite (co)monomers and extracts on two caries-associated micro-organisms in vitro. J. Dent. Res. 1998, 77, 60–67. [Google Scholar] [CrossRef] [PubMed]
- Fang, L.; Jihua, C.; Zhiguo, C.; Ling, Z.; Yuhong, X.; Ming, F.; Sai, M. Effects of a dental adhesive incorporating antibacterial monomer on the growth, adherence and membrane integrity of Streptococcus mutans. J. Dent. 2009, 37, 289–296. [Google Scholar]
- Bollen, C.M.L.; Lambrechts, P.; Quirynen, M. Comparison of surface roughness of oral hard materials to the threshold surface roughness for bacterial plaque retention: A review of the literature. Dent. Mater. 1997, 13, 258–269. [Google Scholar] [CrossRef]
- Beighton, D. The complex oral microflora of high-risk individuals and groups and its role in the caries process. Commun. Dent. Oral Epidemiol. 2005, 33, 248–255. [Google Scholar] [CrossRef] [PubMed]
- Oluremi, B.B.; Osungunna, M.O.; Idowu, O.A.; Adebolu, O.O. Evaluation of anticaries activity of selected mouthwash marketed in Nigeria. Trop. J. Pharm. Res. 2010, 9, 581–586. [Google Scholar] [CrossRef]
- Scheie, A.A. Mechanisms of Dental Plaque Formation. Adv. Dent. Res. 1994, 8, 246–253. [Google Scholar] [PubMed]
- Castro, P.; Tovar, J.A.; Jaramillo, L. Adhesion of Streptococcus mutans to salivary proteins in caries-free and caries-susceptible individuals. Acta. Odontol. Latinoam. 2006, 19, 59–66. [Google Scholar] [PubMed]
- Ilie, N.; Hickel, R. Resin composite restorative materials. Aus. Dent. J. 2011, 56, 59–66. [Google Scholar] [CrossRef] [PubMed]
- Harris, L.G.; Foster, S.J.; Richard, R.G. An introduction to Staphylococcus aureus, and techniques for identifying and quantifying S. aureus adhesions in relation to adhesion to biomaterials: Review. Eur. Cell. Mater. 2002, 4, 39–60. [Google Scholar] [PubMed]
- Hassan-Olajokun, R.E.; Folarin, A.A.; Olaniran, O.; Umo, A.N. The prevalent bacterial isolates of dental caries in school age children attending the dental clinic of oauthc, ile-ife. Afr. J. Cln. Exper. Microbiol. 2008, 9, 103–108. [Google Scholar]
- Rothbaum, R.; McAdams, A.J.; Giannella, R.; Partin, J.C. A clinicopathologic study of enterocyte-adherent Escherichia coli: A cause of protracted diarrhea in infants. Gastroenterology 1982, 83, 441–454. [Google Scholar] [PubMed]
- Loesche, W.; Syed, S. The predominant cultivable flora of carious plaque and carious dentine. Caries Res. 1973, 7, 201–216. [Google Scholar] [CrossRef] [PubMed]
- Marshall, S.J.; Marshall, G.W., Jr. Dental amalgam: The materials. Adv. Dent. Res. 1992, 6, 94–99. [Google Scholar] [PubMed]
- Drucker, D.; Lilley, J.; Tucker, D.; Gibbs, A. The endodontic microflora revisited. Microbios 1992, 71, 225–234. [Google Scholar] [PubMed]
- Imazato, S.; McCabe, J.F.; Tarumi, H.; Ehara, A.; Ebisu, S. Degree of conversion of composites measured by DTA and FTIR. Dent. Mater. 2001, 17, 178–183. [Google Scholar] [CrossRef]
- Younas, B.; Khan, A.S.; Muzaffar, D.; Hussain, I.; Chaudhry, A.A.; Rehman, I.U. In situ reaction kinetic analysis of dental restorative materials. Eur. Phys. J. Appl. Phys. 2013, 64, 30701. [Google Scholar] [CrossRef]
- Meenakshi, K.; Sudhan, E.; Kumar, S.; Umpapathy, M. Development of siloxane based tetraglycidyl epoxy nanocomposites for high performance applications—Study of the mechanical, thermal, water absorption and flame retardant behaviour. Silicon 2011, 3, 45–52. [Google Scholar] [CrossRef]
- Lee, M.H.; Brass, D.; Morris, R.; Composto, R.J.; Ducheyne, P. The effect of non-specific interactions on cellular adhesion using model surfaces. Biomaterials 2005, 26, 1721–1730. [Google Scholar] [CrossRef] [PubMed]
- Hamadi, F.; Latrache, H. Comparison of contact angle measurement and microbial adhesion to solvents for assaying electron donor and electron acceptor (acid-base) properties of bacterial surface. Coll. Surf. B Biointer. 2008, 65, 134–136. [Google Scholar] [CrossRef] [PubMed]
- An, Y.H.; Friedman, R.J. Concise review of mechanisms of bacterial adhesion to biomaterial surfaces. J. Biomed. Mater. Res. 1998, 43, 338–348. [Google Scholar] [CrossRef]
- Matasa, C. Microbial attack of orthodontic adhesives. Am. J. Orthod. Dentofacial. Orthop. 1995, 108, 132–141. [Google Scholar] [CrossRef]
- Kidd, E.A.M.; Beighton, D. Prediction of Secondary Caries around Tooth-colored Restorations: A Clinical and Microbiological Study. J. Dent. Res. 1996, 75, 1942–1946. [Google Scholar] [CrossRef] [PubMed]
- Katsikogianni, M.G.; Missirlis, Y.F. Interactions of bacteria with specific biomaterial surface chemistries under flow conditions. Acta. Biomater. 2010, 6, 1107–1118. [Google Scholar] [CrossRef] [PubMed]
- Truong, V.K.; Lapovok, R.; Estrin, Y.S.; Rundell, S.; Wang, J.Y.; Fluke, C.J.; Crawford, R.J.; Ivanova, E.P. The influence of nano-scale surface roughness on bacterial adhesion to ultrafine-grained titanium. Biomaterials 2010, 31, 3674–3683. [Google Scholar] [CrossRef] [PubMed]
- Van Dijk, J.; Herkstroter, F.; Busscher, H.; Weerkamp, A.; Jansen, H.; Arends, J. Surface-Free Energy and Bacterial Adhesion: An in vivo study in beagle dogs. J. Clin. Periodontol. 1987, 14, 300–304. [Google Scholar] [CrossRef] [PubMed]
- Katsikogianni, M.; Missirlis, Y.F. Concise review of mechanisms of bacterial adhesion to biomaterials and of techniques used in estimating bacteriamaterial interactions. Eurp. Cells Mater. 2004, 8, 37–57. [Google Scholar]
© 2015 by the authors; licensee MDPI, Basel, Switzerland. This article is an open access article distributed under the terms and conditions of the Creative Commons Attribution license (http://creativecommons.org/licenses/by/4.0/).
Share and Cite
Azam, M.T.; Khan, A.S.; Muzzafar, D.; Faryal, R.; Siddiqi, S.A.; Ahmad, R.; Chauhdry, A.A.; Rehman, I.U. Structural, Surface, in vitro Bacterial Adhesion and Biofilm Formation Analysis of Three Dental Restorative Composites. Materials 2015, 8, 3221-3237. https://doi.org/10.3390/ma8063221
Azam MT, Khan AS, Muzzafar D, Faryal R, Siddiqi SA, Ahmad R, Chauhdry AA, Rehman IU. Structural, Surface, in vitro Bacterial Adhesion and Biofilm Formation Analysis of Three Dental Restorative Composites. Materials. 2015; 8(6):3221-3237. https://doi.org/10.3390/ma8063221
Chicago/Turabian StyleAzam, Maria T., Abdul S. Khan, Danish Muzzafar, Rani Faryal, Saadat A. Siddiqi, Riaz Ahmad, Aqif A. Chauhdry, and Ihtesham U. Rehman. 2015. "Structural, Surface, in vitro Bacterial Adhesion and Biofilm Formation Analysis of Three Dental Restorative Composites" Materials 8, no. 6: 3221-3237. https://doi.org/10.3390/ma8063221