
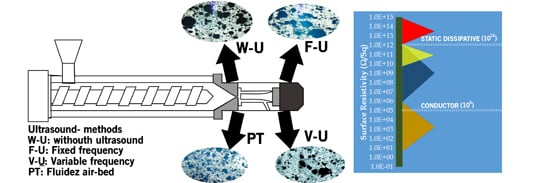
Ultrasound-Assist Extrusion Methods for the Fabrication of Polymer Nanocomposites Based on Polypropylene/Multi-Wall Carbon Nanotubes

 , , , , ,
Abstract
:
1. Introduction
2. Results and Discussion
2.1. Melt Flow Index

| Sample | Fabrication Method | ||||
|---|---|---|---|---|---|
| As Received | W-U | F-U | V-U | PT | |
| iPPMFI = 2.5 | 2.70 | 3.00 | 2.91 | 2.85 | 3.00 |
| iPPMFI = 34 | 34.34 | 35.60 | 37.57 | 35.73 | 35.60 |
| iPPMFI = 1200 | 1208.87 | 1013.27 | 1250.85 | 1281.86 | 1013.27 |
| iPPMFI = 2.5/MNT | - | 1.49 | 1.59 | 1.55 | 1.42 |
| iPPMFI = 34/MNT | - | 17.53 | 18.63 | 18.50 | 18.40 |
| iPPMFI = 1200/MNT | - | 179.40 | 159.12 | 171.61 | 160.01 |
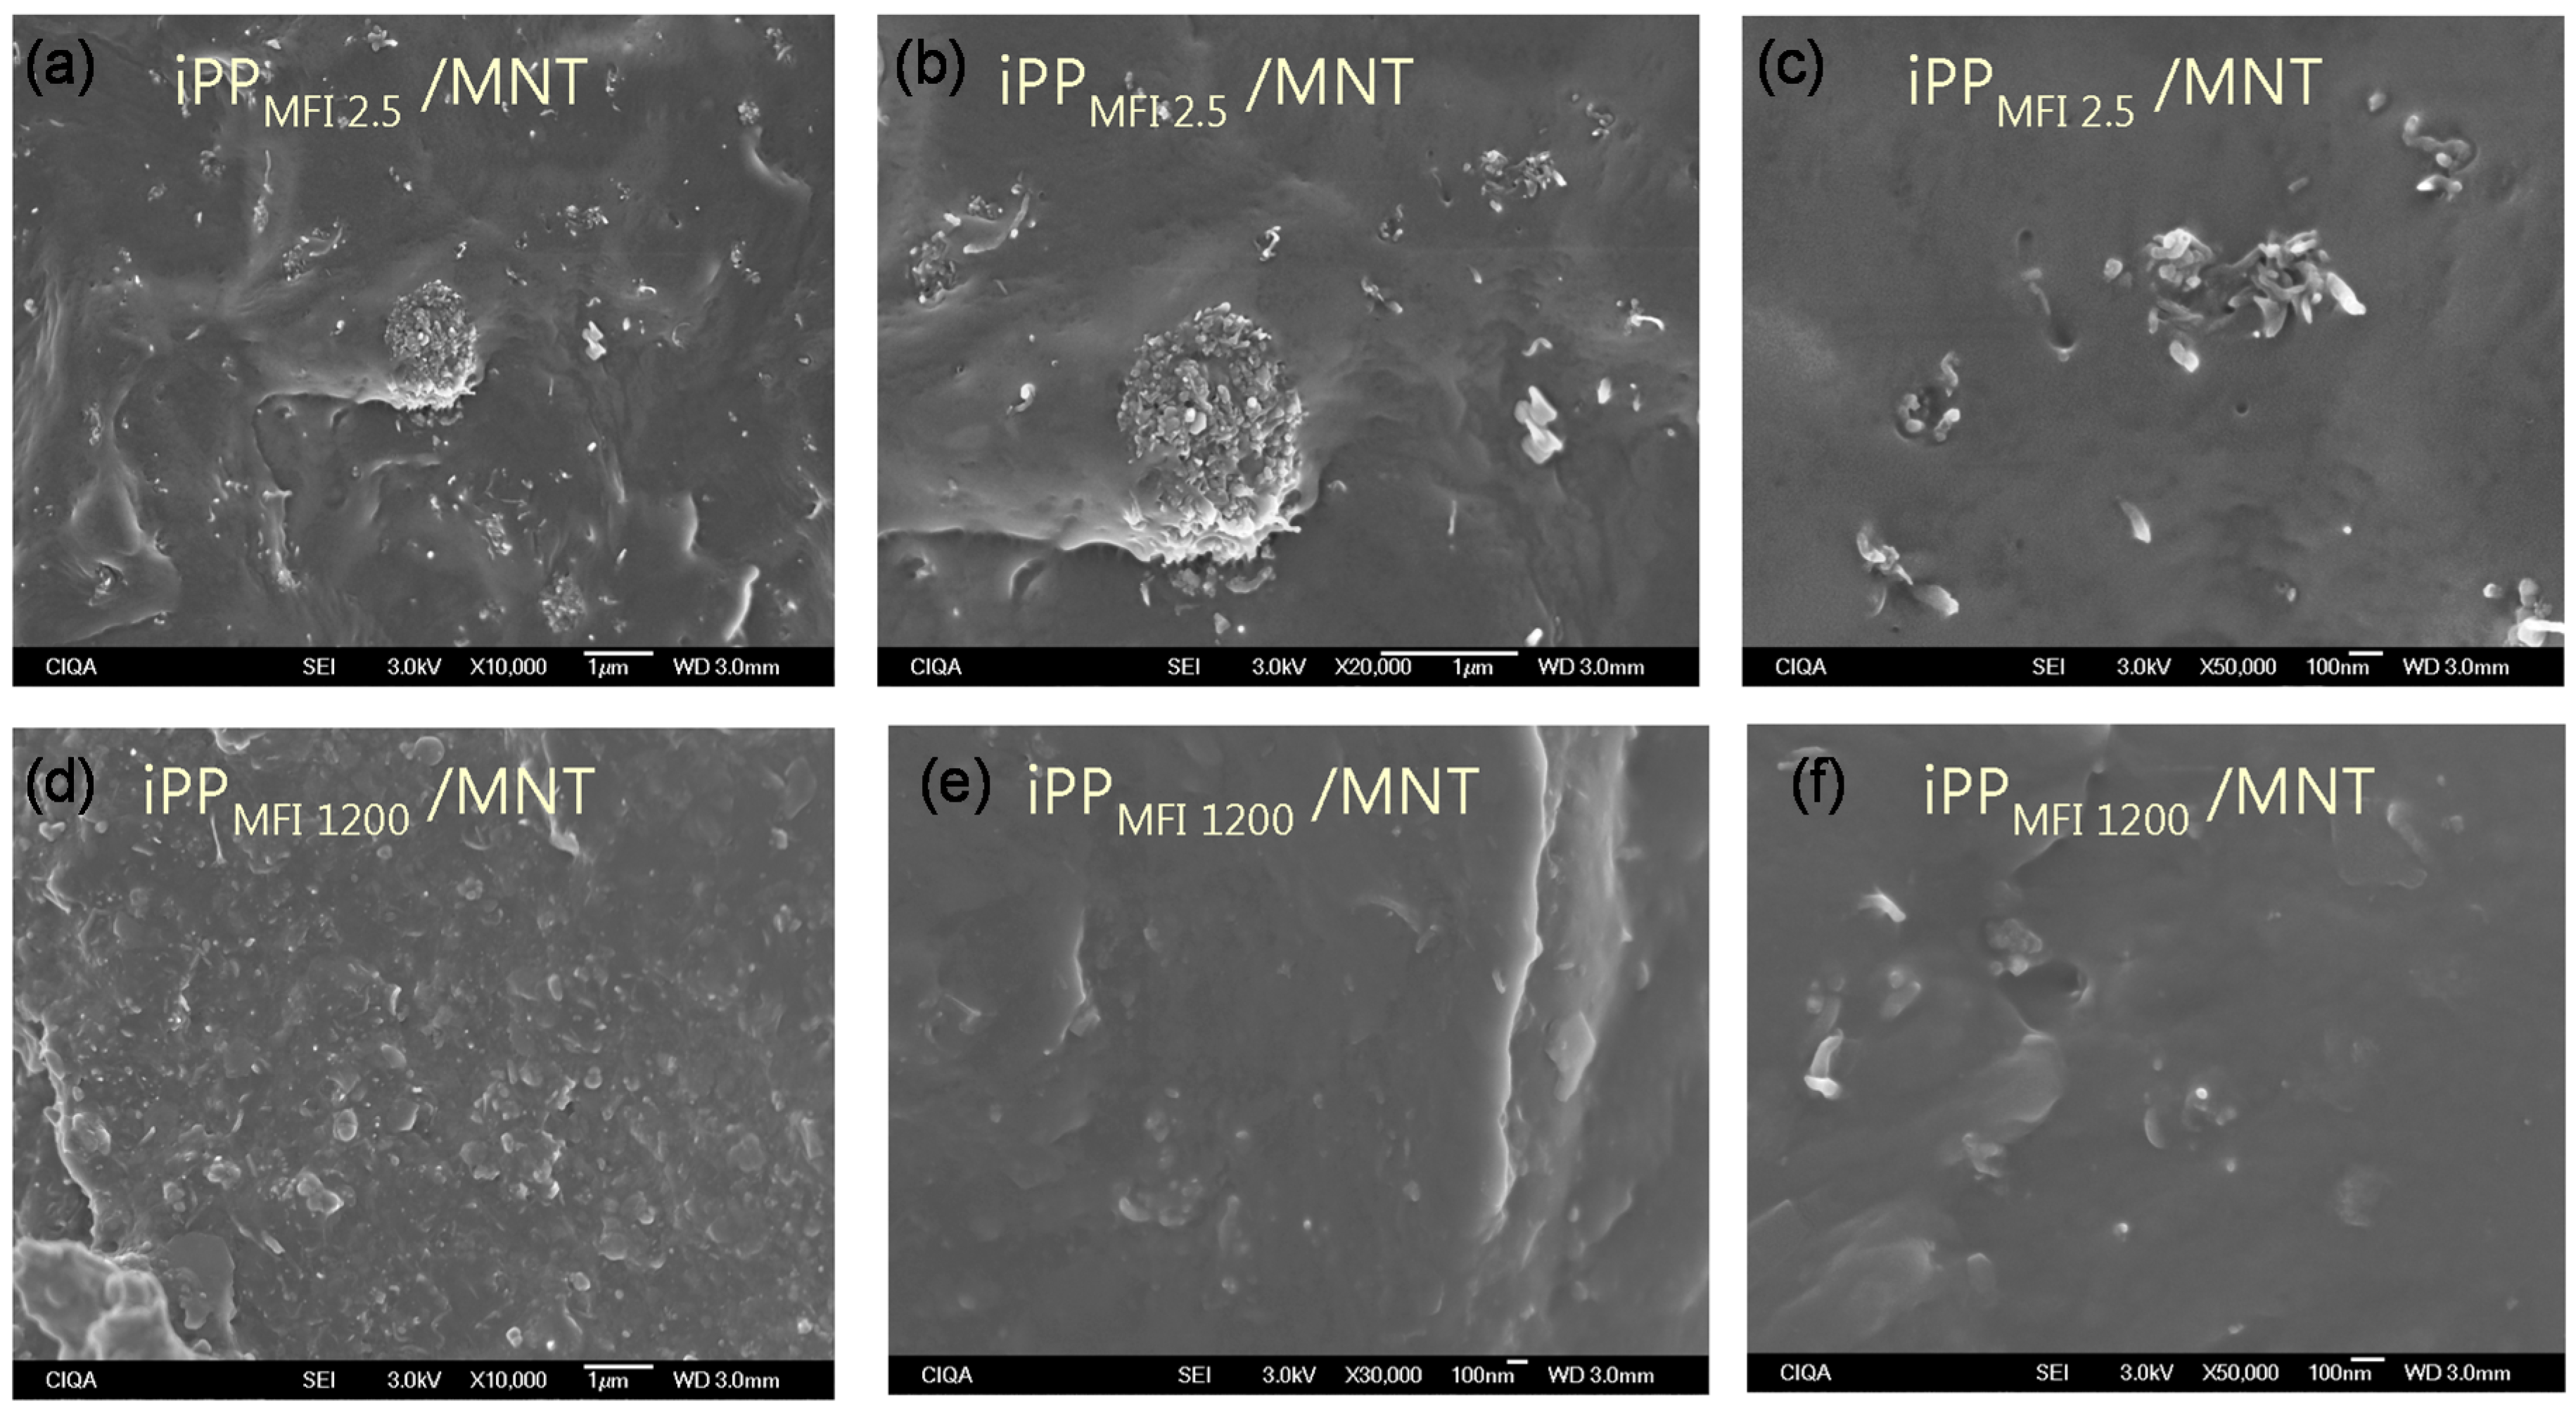
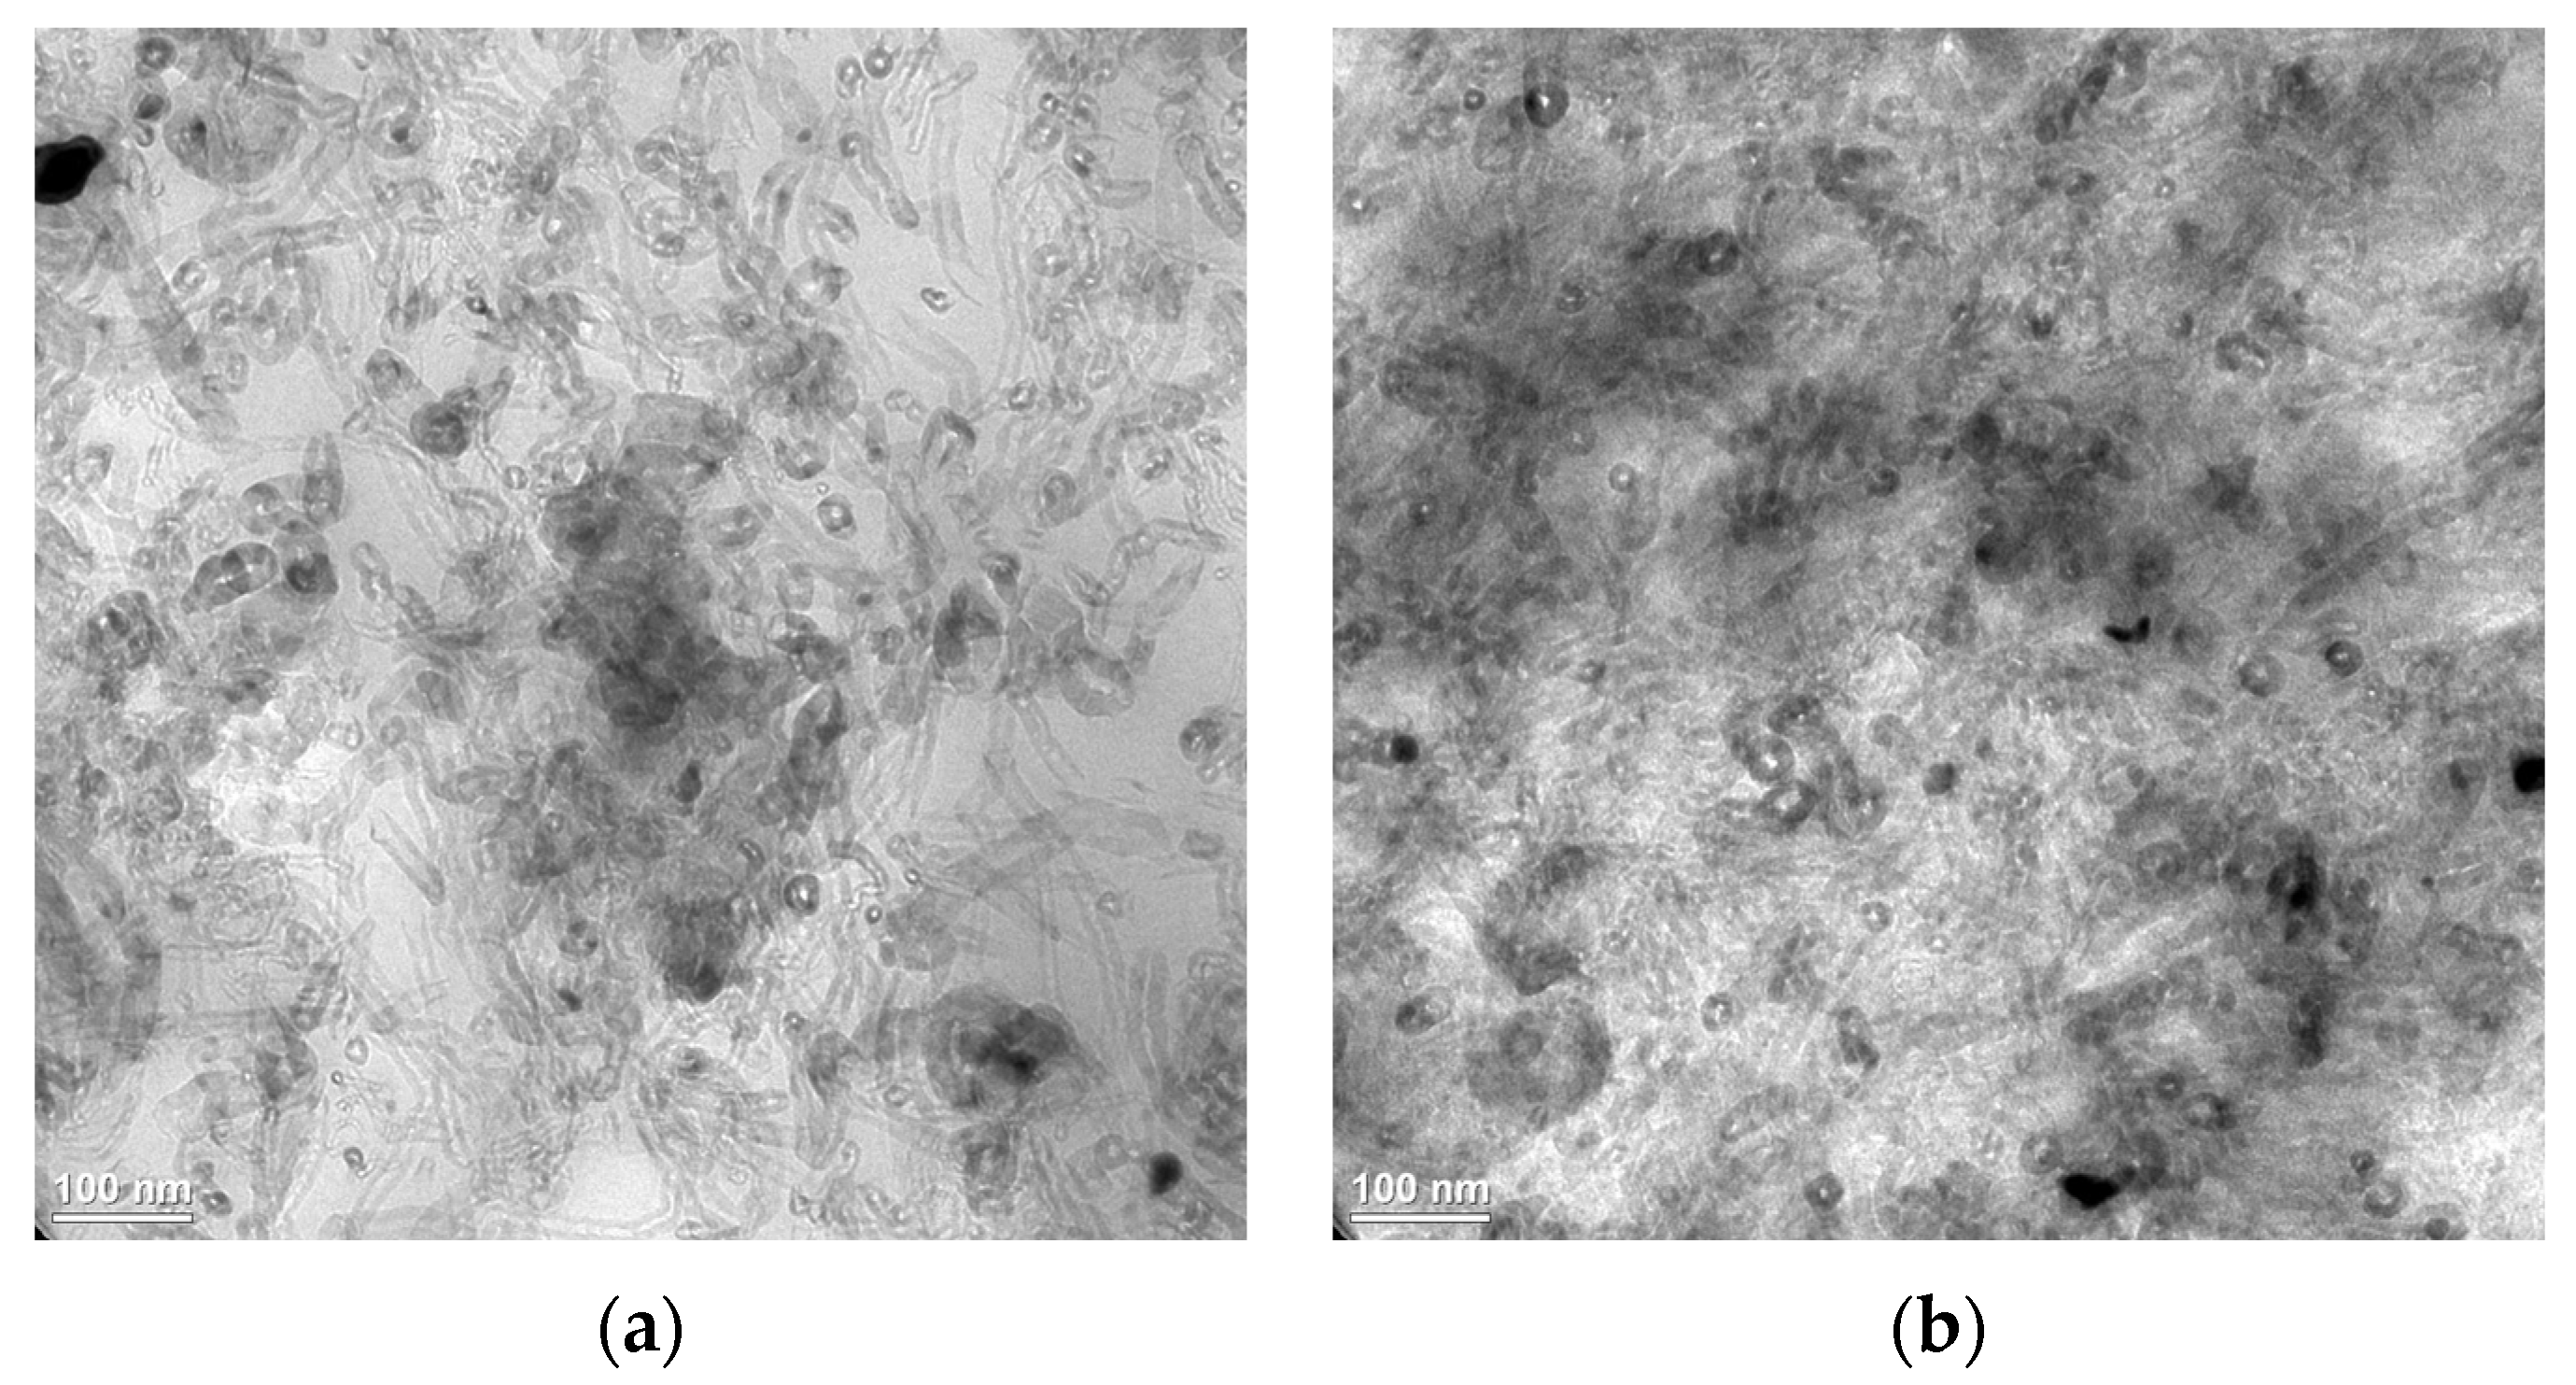
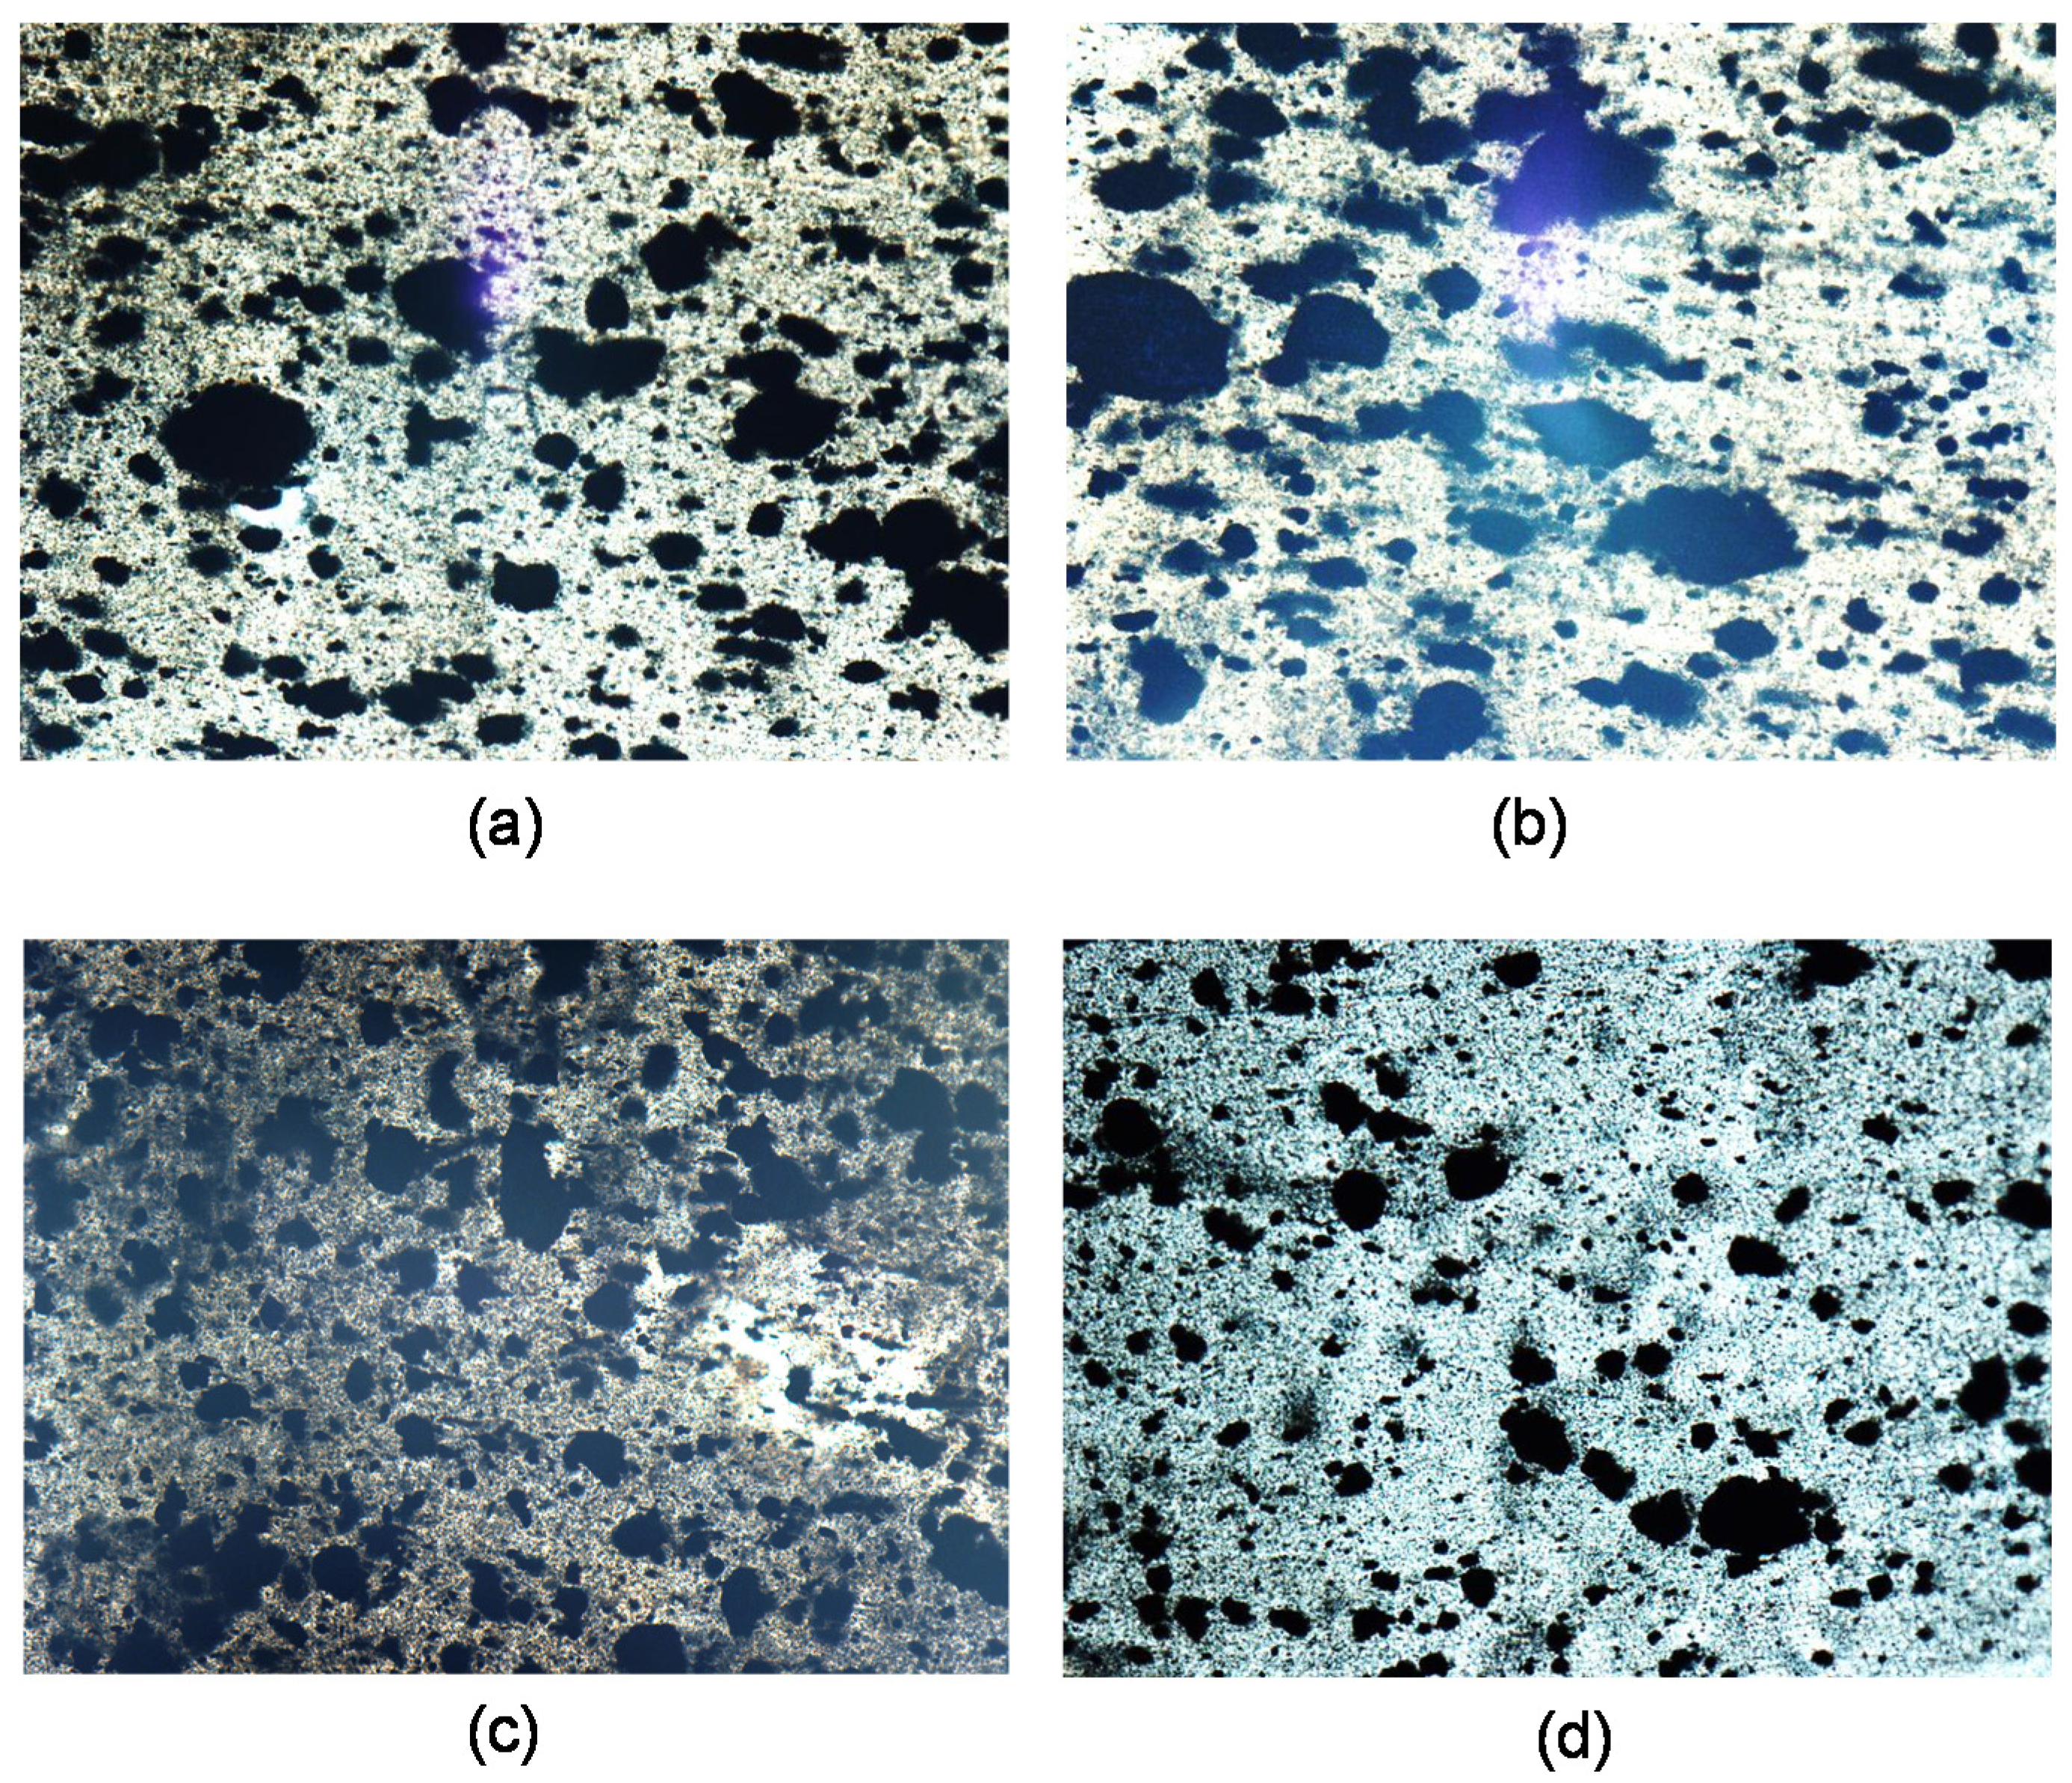
2.2. Morphology
| iPPMFI/MNT MFI (g/10 min) | Fabrication Method | |||
|---|---|---|---|---|
| W-U | F-U | V-U | PT | |
| 2.5 | 10.14 (±2.12) | 9.19 (±2.51) | 8.56 (±5.40) | 9.47 (±2.73) |
| 34 | 9.60 (±1.02) | 9.70 (±2.15) | 10.63 (±1.21) | 12.95 (±0.80) |
| 1200 | 10.09 (±0.76) | 10.35 (±1.46) | 12.02 (±2.69) | 10.11 (±2.98) |
| iPPMFI/MNT MFI (g/10 min) | Fabrication Method | |||
|---|---|---|---|---|
| W-U | F-U | V-U | PT | |
| 2.5 | 37.96 (±9.89) | 33.97 (±10.01) | 11.18 (±6.78) | 57.34 (±7.95) |
| 34 | 41.16 (±7.69) | 35.22 (±8.30) | 17.45 (±2.07) | 31.46 (±13.06) |
| 1200 | 33.79 (±5.42) | 35.48 (±6.27) | 22.65 (±4.24) | 24.29 (±2.41) |

2.3. Electrical Behavior
2.3.1. Surface Resistivity
| Sample | Fabrication Method | |||
|---|---|---|---|---|
| W-U | F-U | V-U | PT | |
| iPPMFI = 2.5 | ≥1013 | - | - | - |
| iPPMFI = 34 | ≥1013 | - | - | - |
| iPPMFI = 1200 | ≥1013 | - | - | - |
| iPPMFI = 2.5/MNT | 1012/(I) | 1012/(I) | 1012/(I) | 1012/(I) |
| iPPMFI = 34/MNT | 1012/(I) | 109/(SD) | 106/(SD) | 105/(C) |
| iPPMFI = 1200/MNT | 105/(C) | 106/(SD) | 108/(SD) | 105/(C) |
2.3.2. Electrical Charge
| Sample | Fabrication Method | |||
|---|---|---|---|---|
| W-U | F-U | V-U | PT | |
| iPPMFI = 2.5 | 0.00/−0.40 | - | - | - |
| iPPMFI = 34 | 0.33/−0.48 | - | - | - |
| iPPMFI = 1200 | −0.02/−1.22 | - | - | - |
| iPPMFI = 2.5/MNT | 0.00/−0.25 | 0.04/−0.10 | −0.01/−1.04 | 0.00/−0.03 |
| iPPMFI = 34/MNT | 0.00/0.00 | 0.00/0.00 | 0.00/0.00 | 0.00/0.00 |
| iPPMFI = 1200/MNT | 0.00/0.00 | 0.00/0.00 | 0.00/0.00 | 0.00/0.00 |

3. Experimental Section
3.1. Characterization Techniques
3.2. Complementary Characterization Techniques.
4. Conclusions
Supplementary Materials
Acknowledgments
Author Contributions
Conflicts of Interest
References
- Fairley, P. The start of something big. Chem. Week 2001, 163, 23–26. [Google Scholar]
- Breuer, O.; Sundararaj, U. Big returns from small fibers: A review of polymer/carbon nanotube composites. Polym. Compos. 2004, 25, 630–645. [Google Scholar] [CrossRef]
- Spitalsky, Z.; Tasis, D.; Papagelis, K.; Galiotis, C. Carbon nanotube-polymer composites: Chemistry, processing, mechanical and electrical properties. Prog. Polym. Sci. 2010, 35, 357–401. [Google Scholar] [CrossRef]
- Min, C.; Shen, X.; Shi, Z.; Chen, L.; Xu, Z. The electrical properties and conducting mechanisms of carbon nanotube/polymer nanocomposites: A review. Polym. Plast. Technol. Eng. 2010, 49, 1172–1181. [Google Scholar] [CrossRef]
- Byrne, M.T.; Gun’ko, Y.K. Recent advances in research on carbon nanotube-polymer composites. Adv. Mater. 2010, 22, 1672–1688. [Google Scholar] [CrossRef] [PubMed]
- Gulrez, S.K.H.; Mohsin, M.E.A.; Shaikh, H.; Anis, A.; Pulose, A.M.; Yadav, M.K.; Qua, E.H.P.; Al-Zahrani, S.M. A review on electrically conductive polypropylene and polyethylene. Polym. Compos. 2014, 35, 900–914. [Google Scholar] [CrossRef]
- Mičušík, M.; Omastová, M.; Krupa, I.; Prokeš, J.; Pissis, P.; Logakis, E.; Pandis, C.; Pötschke, P.; Pionteck, J. A comparative study on the electrical and mechanical behaviour of multi-walled carbon nanotube composites prepared by diluting a masterbatch with various types of polypropylenes. J. Appl. Polym. Sci. 2009, 113, 2536–2551. [Google Scholar] [CrossRef]
- Haque, M.A.; Mina, M.F.; Alam, A.; Rahman, M.J.; Bhuiyan, M.A.; Asano, T. Multiwalled carbon nanotubes-reinforced isotactic polypropylene nanocomposites: Enhancement of crystallization and mechanical, thermal, and electrical properties. Polym. Compos. 2012, 33, 1094–1104. [Google Scholar] [CrossRef]
- Kashiwagi, T.; Grulke, E.; Hilding, J.; Groth, K.; Harris, R.; Butler, K.; Shields, J.; Kharchenko, S.; Douglas, J. Thermal and flammability properties of polypropylene/carbon nanotube nanocomposites. Polymer 2004, 45, 4227–4239. [Google Scholar] [CrossRef]
- Kashiwagi, T.; Mu, M.F.; Winey, K.; Cipriano, B.; Raghavan, S.R.; Pack, S.; Rafailovich, M.; Yang, Y.; Grulke, E.; Shields, J.; et al. Relation between the viscoelastic and flammability properties of polymer nanocomposites. Polymer 2008, 49, 4358–4368. [Google Scholar] [CrossRef]
- Seo, M.K.; Park, S.J. Electrical resistivity and rheological behaviors of carbon nanotubes-filled polypropylene composites. Chem. Phys. Lett. 2004, 395, 44–48. [Google Scholar] [CrossRef]
- Jafariesfad, N.; Ramazani, S.A.; Azinfar, B. Property investigation of polypropylene/multiwall carbon nanotube nanocomposites prepared via in situ polymerization. Polym. Int. 2014, 63, 689–694. [Google Scholar] [CrossRef]
- Kaminsky, W. Metallocene based polyolefin nanocomposites. Materials 2014, 7, 1995–2013. [Google Scholar] [CrossRef]
- Mayoral, B.; Garrett, G.; McNally, T. Influence of screw profile employed during melt mixing on the micro-scale dispersion of MWCNTS in poly(propylene). Macromol. Mater. Eng. 2014, 299, 748–756. [Google Scholar] [CrossRef]
- Mayoral, B.; Lopes, J.; McNally, T. Influence of processing parameters during small-scale batch melt mixing on the dispersion of MWCNTS in a poly(propylene) matrix. Macromol. Mater. Eng. 2014, 299, 609–621. [Google Scholar] [CrossRef]
- Avila-Orta, C.A.; Medellín-Rodríguez, F.J.; Dávila-Rodríguez, M.V.; Aguirre-Figueroa, Y.A.; Yoon, K.; Hsiao, B.S. Morphological features and melting behavior of nanocomposites based on isotactic polypropylene and multiwalled carbon nanotubes. J. Appl. Polym. Sci. 2007, 106, 2640–2647. [Google Scholar] [CrossRef]
- Xu, D.; Wang, Z. Role of multi-wall carbon nanotube network in composites to crystallization of isotactic polypropylene matrix. Polymer 2008, 49, 330–338. [Google Scholar] [CrossRef]
- Ávila-Orta, C.A.; Raudry-López, C.E.; Dávila-Rodríguez, M.V.; Aguirre-Figueroa, Y.A.; Cruz-Delgado, V.J.; Neira-Velázquez, M.G.; Medellín-Rodríguez, F.J.; Hsiao, B.S. Morphology, thermal stability, and electrical conductivity of polymer nanocomposites of isotactic polypropylene/multi-walled carbon nanotubes. Int. J. Polym. Mater. Polym. Biomater. 2013, 62, 635–641. [Google Scholar] [CrossRef]
- Ávila-Orta, C.A.; Valdéz-Garza, J.A.; Neira-Velázquez, M.G.; Borjas-Ramos, J.J.; González-Morones, P.; Espinoza-Gonzalez, C.J.; España-Sánchez, B.L. Proceso de desaglomeración, fragmentación y reducción de tamaño de los aglomerados de nanopartículas mediante la aplicación de ultrasonido en fase gas. Mx. Patent MX/a/2010/014326, 20 December 2010. [Google Scholar]
- España-Sánchez, B.L.; Ávila-Orta, C.A.; Padilla-Vaca, F.; Neira-Velázquez, M.G.; González-Morones, P.; Rodríguez-González, J.A.; Hernández-Hernández, E.; Rangel-Serrano, A.; Barriga, E.D.; Yate, L.; et al. Enhanced antibacterial activity of melt processed poly(propylene) Ag and Cu nanocomposites by argon plasma treatment. Plasma Process. Polym. 2014, 11, 353–365. [Google Scholar] [CrossRef]
- Isayev, A.I.; Kumar, R.; Lewis, T.M. Ultrasound assisted twin screw extrusion of polymer-nanocomposites containing carbon nanotubes. Polymer 2009, 50, 250–260. [Google Scholar] [CrossRef]
- Yang, L.; Zhang, Z.; Wang, X.; Chen, J.; Li, H. Effect of ultrasonic irradiation on the microstructure and the electric property of PP/CPP/MWNT composites. J. Appl. Polym. Sci. 2013, 128, 1510–1520. [Google Scholar] [CrossRef]
- Mata-Padilla, J.M.; Ávila-Orta, C.A.; Medellín-Rodríguez, F.J.; Hernández-Hernández, E.; Jiménez-Barrera, R.M.; Crúz-Delgado, V.J.; Valdéz-Garza, J.; Solís-Rosales, S.G.; Torres-Martínez, A.; Lozano-Estrada, M.; et al. Structural and morphological studies on the deformation behavior of polypropylene/multi-walled carbon nanotubes nanocomposites prepared through ultrasound-assisted melt extrusion process. J. Polym. Sci. Part B Polym. Phys. 2015, 53, 475–491. [Google Scholar] [CrossRef]
- Ávila-Orta, C.A.; Martínez-Colunga, J.G.; Bueno-Baqués, D.; Raudry-López, C.E.; Cruz-Delgado, V.J.; González-Morones, P.; Valdéz-Garza, J.A.; Esparza-Juárez, M.E.; Espinoza-González, C.J.; Rodríguez-González, J.A. Proceso continuo asistido por ultrasonido de frecuencia y amplitud variable, para la preparación de nanocompuestos a base de polímeros y nanopartículas. Mx. Patent MX/a/2009/003842, 19 September 2014. [Google Scholar]
- Avila-Orta, C.; Espinoza-Gonzalez, C.; Martinez-Colunga, G.; Bueno-Baques, D.; Maffezzoli, A.; Lionetto, F. An overview of progress and current challenges in ultrasonic treatment of polymer melts. Adv. Polym. Technol. 2013, 32, E582–E602. [Google Scholar] [CrossRef]
- Espinoza-Gonzalez, C. Ultrasound effects mechanism in molten state polymer matrices and in the dispersion of nanostructures. Model system: Nylon-n and multi-walled carbon nanotubes. Ph.D. Thesis, Centro de Investigación en Química Aplicada, Saltillo, Coahuila, Mexico, December 2012. [Google Scholar]
- Bremner, T.; Cook, D.G.; Rudin, A. Further comments on the relations between melt flow index values and molecular weight distributions of commercial plastics. J. Appl. Polym. Sci. 1991, 43, 1773–1773. [Google Scholar] [CrossRef]
- Besco, S.; Lorenzetti, A.; Hrelja, D.; Boaretti, C.; Roso, M.; Ferri, D.; Modesti, M. Influence of melt viscosity on the structure and properties of electrically conductive nanocomposites produced by masterbatch process. Macromol. Mater. Eng. 2014, 299, 814–824. [Google Scholar] [CrossRef]
- Ferg, E.E.; Bolo, L.L. A correlation between the variable melt flow index and the molecular mass distribution of virgin and recycled polypropylene used in the manufacturing of battery cases. Polym. Test. 2013, 32, 1452–1459. [Google Scholar] [CrossRef]
- Menzer, K.; Krause, B.; Boldt, R.; Kretzschmar, B.; Weidisch, R.; Pötschke, P. Percolation behaviour of multiwalled carbon nanotubes of altered length and primary agglomerate morphology in melt mixed isotactic polypropylene-based composites. Compos. Sci. Technol. 2011, 71, 1936–1943. [Google Scholar] [CrossRef]
- Steinmann, W.; Vad, T.; Weise, B.; Wulfhorst, J.; Seide, G.; Gries, T.; Heidelmann, M.; Weirich, T. Extrusion of CNT-modified polymers with low viscosity-influence of crystallization and CNT orientation on the electrical properties. Polym. Polym. Compos. 2013, 21, 473–482. [Google Scholar]
- Wang, B.; Sun, G.; Sun, G.; He, X.; Liu, J. The thermal characterization and rheology behavior of PP/MWNTs nanocomposites. Acta Polym. Sin. 2006, 1, 408–413. [Google Scholar] [CrossRef]
- Xin, F.; Li, L. Decoration of carbon nanotubes with silver nanoparticles for advanced CNT/polymer nanocomposites. Compos. Part A Appl. Sci. Manuf. 2011, 42, 961–967. [Google Scholar] [CrossRef]
- Wang, Z.; Fan, X.; Wang, K.; Deng, H.; Chen, F.; Fu, Q. Fabrication of polypropylene/carbon nanotubes composites via a sequential process of (rotating solid-state mixing)-plus-(melt extrusion). Compos. Sci. Technol. 2011, 71, 1397–1403. [Google Scholar] [CrossRef]
- Hom, S.; Bhattacharyya, A.R.; Khare, R.A.; Kulkarni, A.R.; Saroop, M.; Biswas, A. Blends of polypropylene and ethylene octene comonomer with conducting fillers: Influence of state of dispersion of conducting fillers on electrical conductivity. Polym. Eng. Sci. 2009, 49, 1502–1510. [Google Scholar] [CrossRef]
- Pan, Y.; Cheng, H.K.F.; Li, L.; Chan, S.H.; Zhao, J.; Juay, Y.K. Annealing induced electrical conductivity jump of multi-walled carbon nanotube/polypropylene composites and influence of molecular weight of polypropylene. J. Polym. Sci. Part B Polym. Phys. 2010, 48, 2238–2247. [Google Scholar] [CrossRef]
- American Society for Testing Materials. Standard Test Method for Melt Flow Rates of Thermoplastics by Extrusion Plastometer; ASTM D1238-13; ASTM International: West Conshohocken, PA, USA, 2013. [Google Scholar]
© 2015 by the authors; licensee MDPI, Basel, Switzerland. This article is an open access article distributed under the terms and conditions of the Creative Commons by Attribution (CC-BY) license (http://creativecommons.org/licenses/by/4.0/).
Share and Cite
Ávila-Orta, C.A.; Quiñones-Jurado, Z.V.; Waldo-Mendoza, M.A.; Rivera-Paz, E.A.; Cruz-Delgado, V.J.; Mata-Padilla, J.M.; González-Morones, P.; Ziolo, R.F. Ultrasound-Assist Extrusion Methods for the Fabrication of Polymer Nanocomposites Based on Polypropylene/Multi-Wall Carbon Nanotubes. Materials 2015, 8, 7900-7912. https://doi.org/10.3390/ma8115431
Ávila-Orta CA, Quiñones-Jurado ZV, Waldo-Mendoza MA, Rivera-Paz EA, Cruz-Delgado VJ, Mata-Padilla JM, González-Morones P, Ziolo RF. Ultrasound-Assist Extrusion Methods for the Fabrication of Polymer Nanocomposites Based on Polypropylene/Multi-Wall Carbon Nanotubes. Materials. 2015; 8(11):7900-7912. https://doi.org/10.3390/ma8115431
Chicago/Turabian StyleÁvila-Orta, Carlos A., Zoe V. Quiñones-Jurado, Miguel A. Waldo-Mendoza, Erika A. Rivera-Paz, Víctor J. Cruz-Delgado, José M. Mata-Padilla, Pablo González-Morones, and Ronald F. Ziolo. 2015. "Ultrasound-Assist Extrusion Methods for the Fabrication of Polymer Nanocomposites Based on Polypropylene/Multi-Wall Carbon Nanotubes" Materials 8, no. 11: 7900-7912. https://doi.org/10.3390/ma8115431
APA StyleÁvila-Orta, C. A., Quiñones-Jurado, Z. V., Waldo-Mendoza, M. A., Rivera-Paz, E. A., Cruz-Delgado, V. J., Mata-Padilla, J. M., González-Morones, P., & Ziolo, R. F. (2015). Ultrasound-Assist Extrusion Methods for the Fabrication of Polymer Nanocomposites Based on Polypropylene/Multi-Wall Carbon Nanotubes. Materials, 8(11), 7900-7912. https://doi.org/10.3390/ma8115431