2.1. Raw Materials
Raw materials used in this paper include cement, glass, water and standard sand. The cement is 42.5 Portland cement, whose chemical compositions are listed in
Table 1.
Soda-lime glass is employed in this work due to its popularity all over the world. WG aggregate is prepared by collected green glass after being cleaned, dried, crushed, and taken for a screening test according to GB/T14684-2001 Sand for construction [
9]. The mass content of all sizes is listed in
Table 2. The smaller particles (0.16–0.315 mm) occupy a certain proportion,
i.e., 15%.
Table 1.
Chemical compositions of cement and glass (mass, %).
Table 1.
Chemical compositions of cement and glass (mass, %).
| Compositions | SiO2 | Al2O3 | CaO | Fe2O3 | MgO | BaO | F | SO3 |
| cement | 21.25 | 2.91 | 63.09 | 3.24 | 0.68 | - | - | 3.36 |
| glass | 68.41 | 2.58 | 9.52 | 0.39 | 0.39 | 0.50 | 0.30 | 0.13 |
| Compositions | K2O | Na2O | TiO2 | MnO | P2O5 | Cr2O3 | ZnO | Loss |
| cement | 1.12 | 0.31 | 0.31 | 0.04 | 0.17 | - | - | 3.52 |
| glass | 2.14 | 14.10 | 0.11 | 0.31 | 0.07 | 0.12 | 0.89 | 0.04 |
Table 2.
Gradation of glass aggregate.
Table 2.
Gradation of glass aggregate.
| Sieve Diameter (mm) | 5–2.5 | 2.5–1.25 | 1.25–0.63 | 0.63–0.315 | 0.315–0.16 |
| Mass percentage (%) | 10 | 25 | 25 | 25 | 15 |
WGP refers to the glass particles with a maximum particle size below 300 μm in this work. WGP is prepared by grinding the WG fine aggregate in ball mill. Furthermore, WGP is divided into seven finenesses, named GA, GB, GC, GD, GE, GF and GG by controlling the grinding time. Its chemical compositions are also presented in
Table 1. The main chemical compositions are 68.41% SiO
2, 14.10% Na
2O and 10.52% CaO, and it is a typical soda-lime glass (71% SiO
2, 13%–15% Na
2O and 10% CaO). WGP may have pozzolanic activity even cementing property due to high lime and silicon content. Meanwhile, it may also raise ASR risk of concrete due to the high alkali and silicon content.
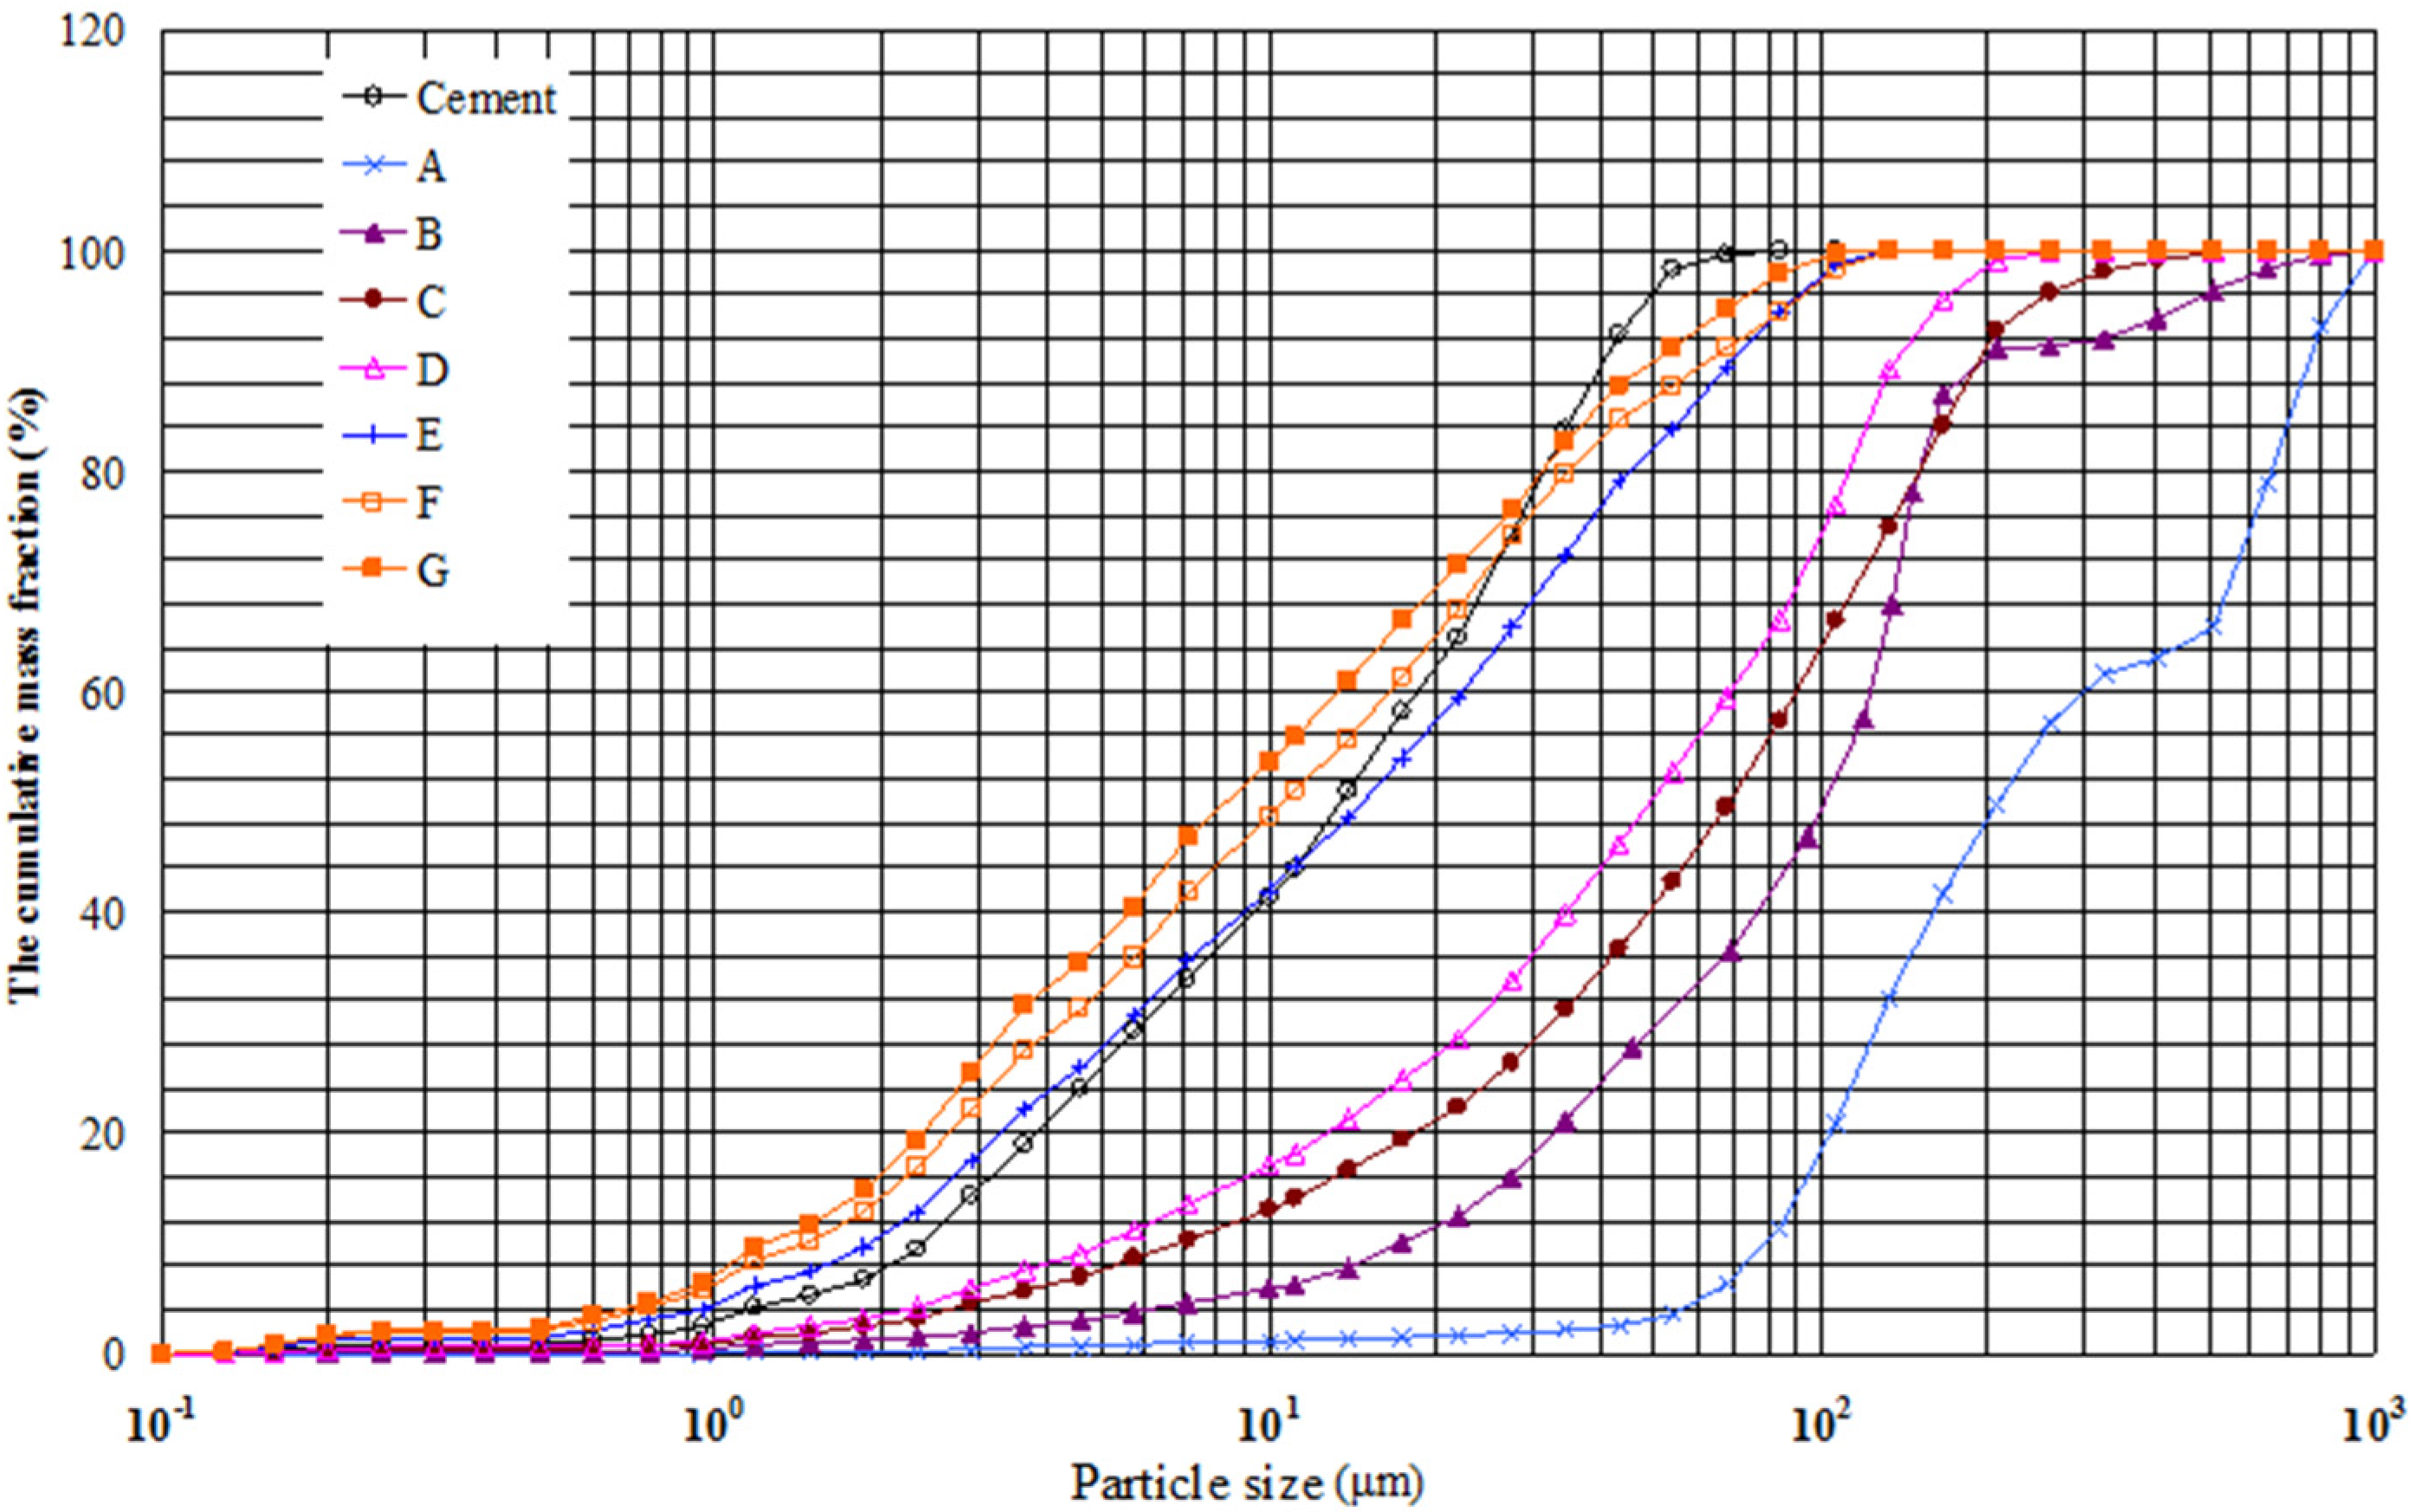
Figure 1 shows the particle size distribution of the seven WGPs and cement. The seven WGPs become finer in turn. The gradation of GA and GB has larger leap and lacks particles with certain size,
i.e., 300–500 μm and 200–400 μm, respectively. The size distribution of GC is similar to that of GD. The particle size distribution of GE, GF and GG are similar to that of cement. No cement particle is larger than 100 μm, while the three WGPs contain small amounts of particles with a size higher than 100 μm. Furthermore, the specific surface area of the three WGPs is greater than that of cement because specific surface area depends on both particle size and particle shape of WGP. WGP contains more slender angular particles due to its fragile features, which leads to a higher specific surface area. Compared with cement, GF and GG have more particles below 20 μm and fewer particles with the size over 30 μm.
The density of WGP is about 2.5 g/cm
3 (
Table 3), which is less than that of cement (about 3.1 g/cm
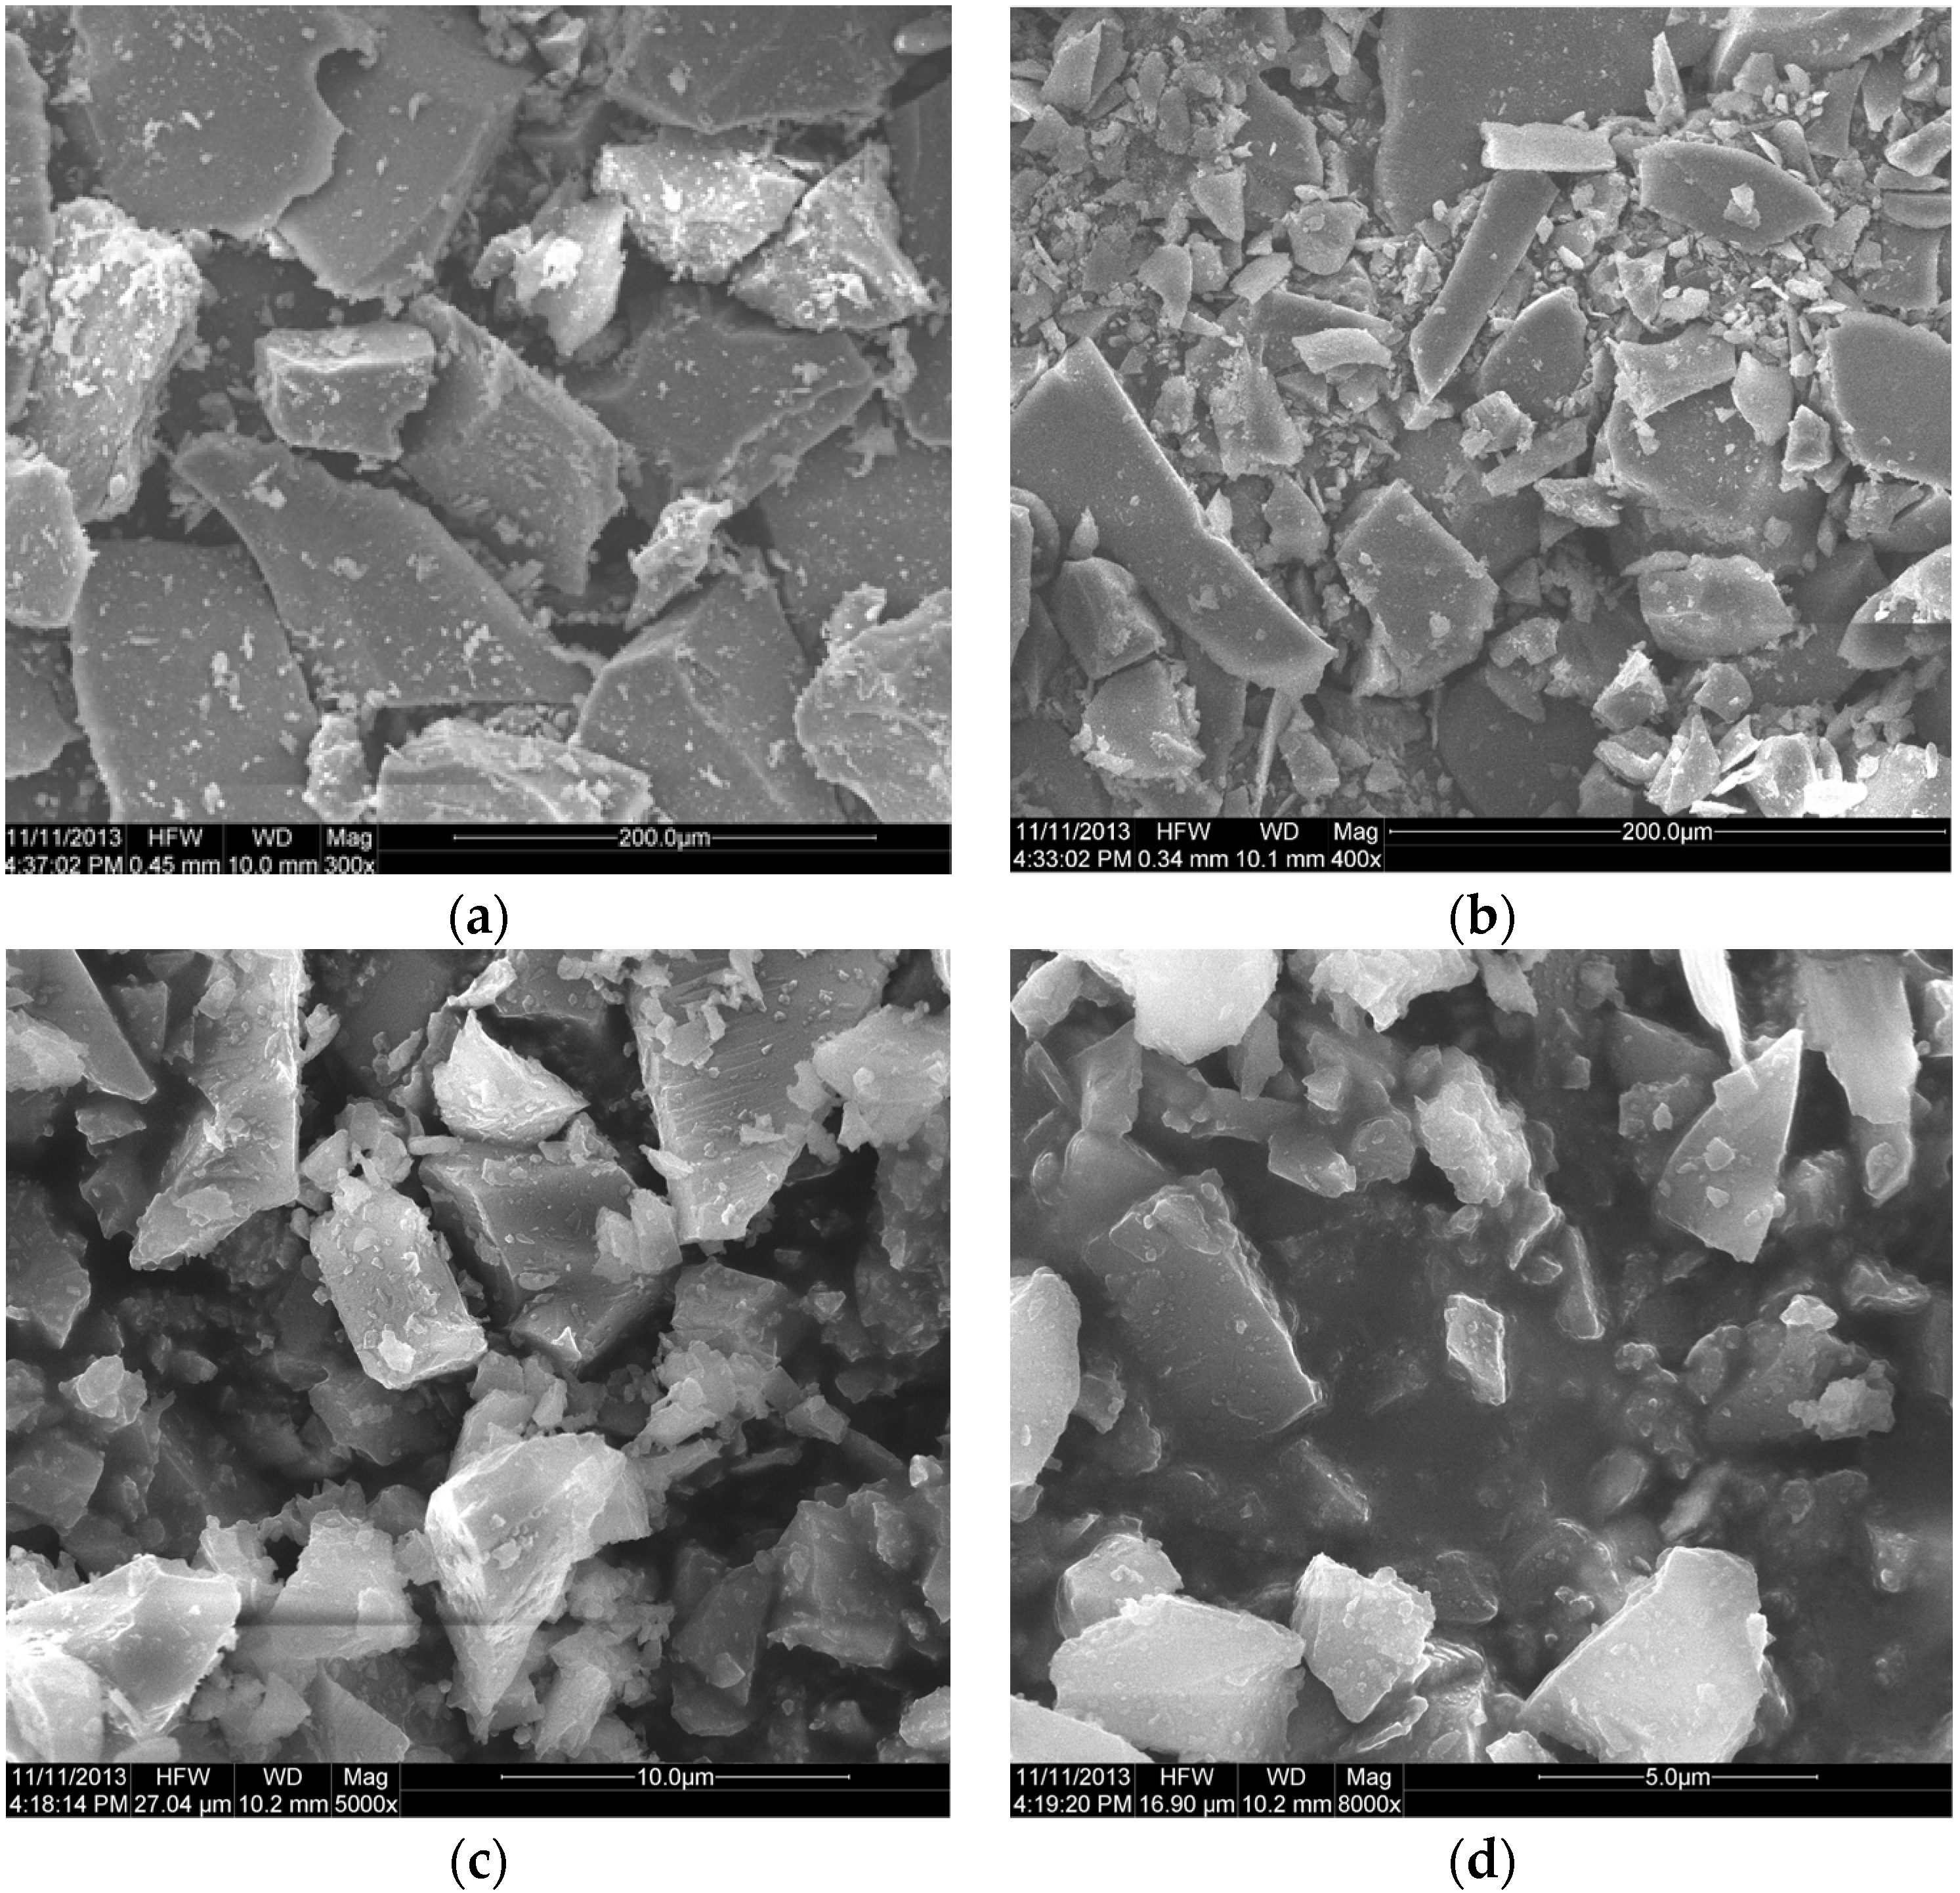
3). The particle morphology of WGP is shown in
Figure 2. The surface of WGP particles is relatively smooth, and its shape is irregularly angular. WGP particle size is consistent with the above analysis: the coarsest is GA, while the finest is GG.
Figure 1.
Particle size distribution of cement and the seven waste glass powders (WGPs).
Figure 1.
Particle size distribution of cement and the seven waste glass powders (WGPs).
Figure 2.
Particle morphology of WGPs: (a) GA, (b) GB, (c) GE and (d) GG.
Figure 2.
Particle morphology of WGPs: (a) GA, (b) GB, (c) GE and (d) GG.
Table 3.
Physical characteristics of the seven waste glass powders (WGPs).
Table 3.
Physical characteristics of the seven waste glass powders (WGPs).
| Samples | Average Particle Size (μm) | Specific Surface Area (m2/kg) | ≥65 μm (%) | ≥80 μm (%) | Density (g/cm3) |
|---|
| GA | 209.2 | 31.00 | 94.33 | 89.97 | 2.48 |
| GB | 111.1 | 121.00 | 55.06 | 45.05 | 2.53 |
| GC | 68.29 | 217.00 | 51.58 | 44.53 | 2.49 |
| GD | 49.08 | 289.00 | 37.09 | 30.05 | 2.49 |
| GE | 14.94 | 658.00 | 11.55 | 6.63 | 2.49 |
| GF | 10.64 | 837.00 | 9.37 | 6.55 | 2.50 |
| GG | 8.20 | 903.00 | 5.92 | 2.75 | 2.48 |
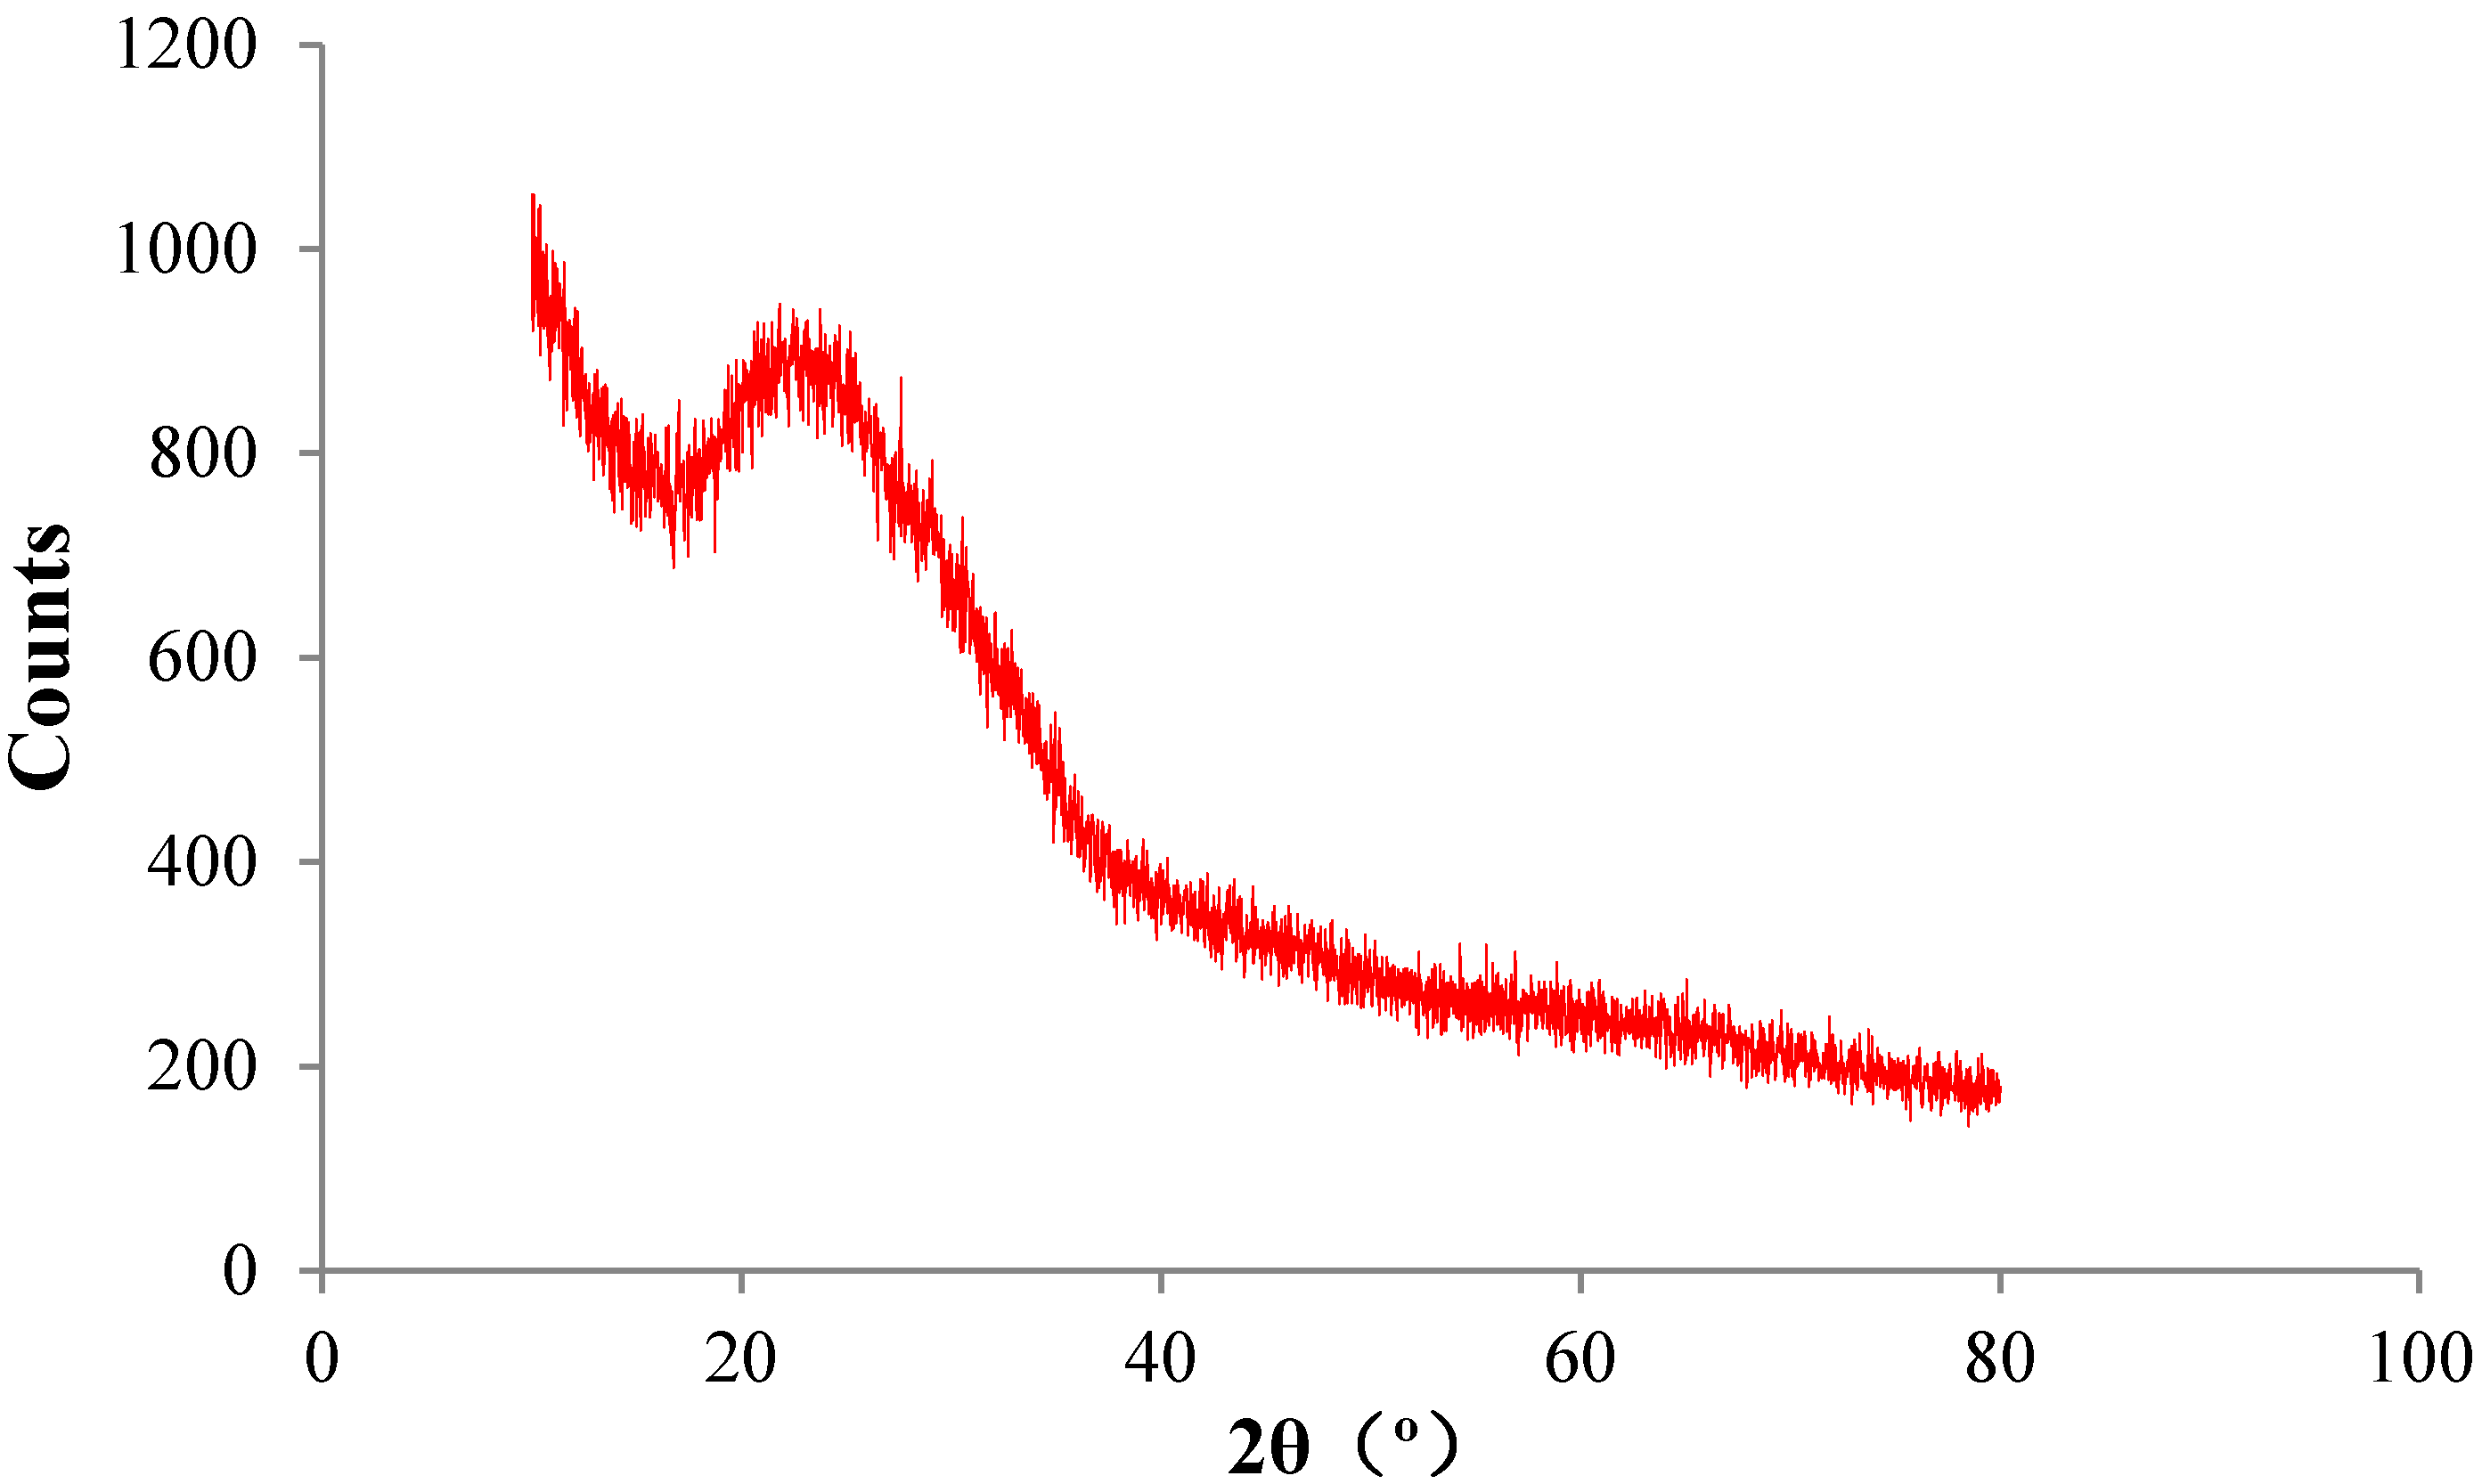
As can be seen from
Figure 3, the X-ray diffraction (XRD) pattern of WGP is dispersive and exhibits a wide diffraction peak, named “bread peak”, near 25° different from the sharp peak of crystal, which indicates WGP is almost amorphous. WGP has great activity theoretically, and it is also related to its chemical construction,
i.e., the amorphous silica.
Figure 3.
X-ray diffraction (XRD) pattern of WGP.
Figure 3.
X-ray diffraction (XRD) pattern of WGP.
2.2. Experiments
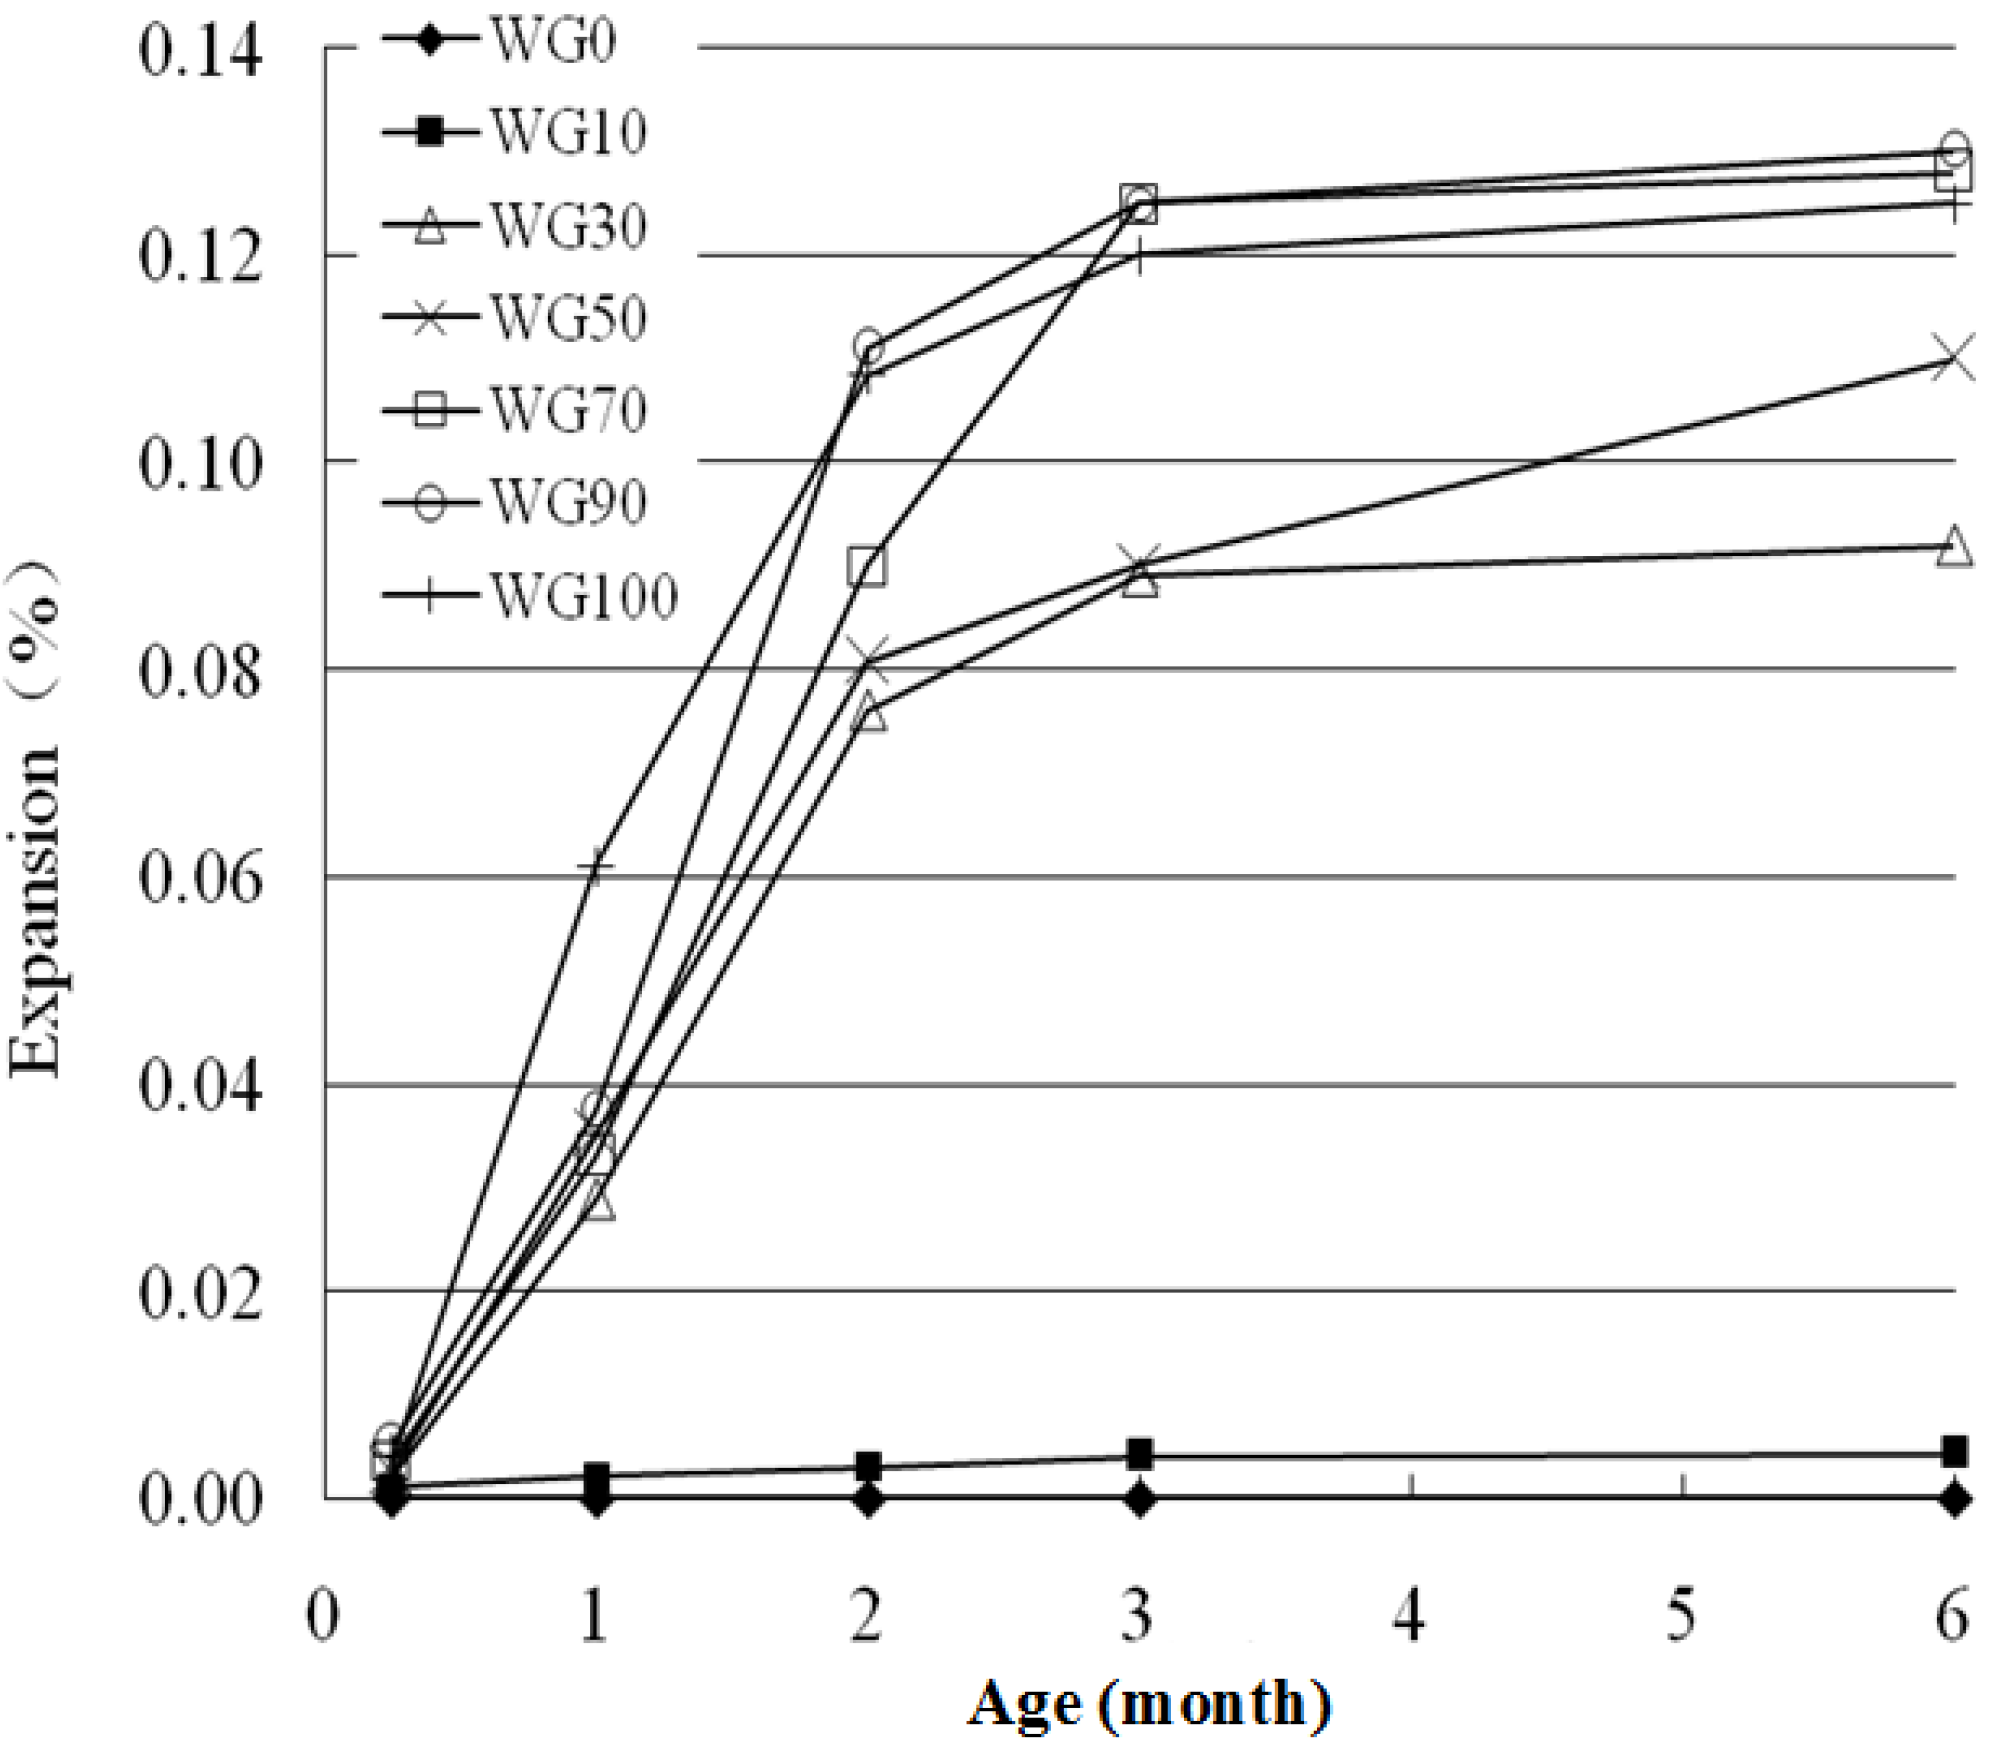
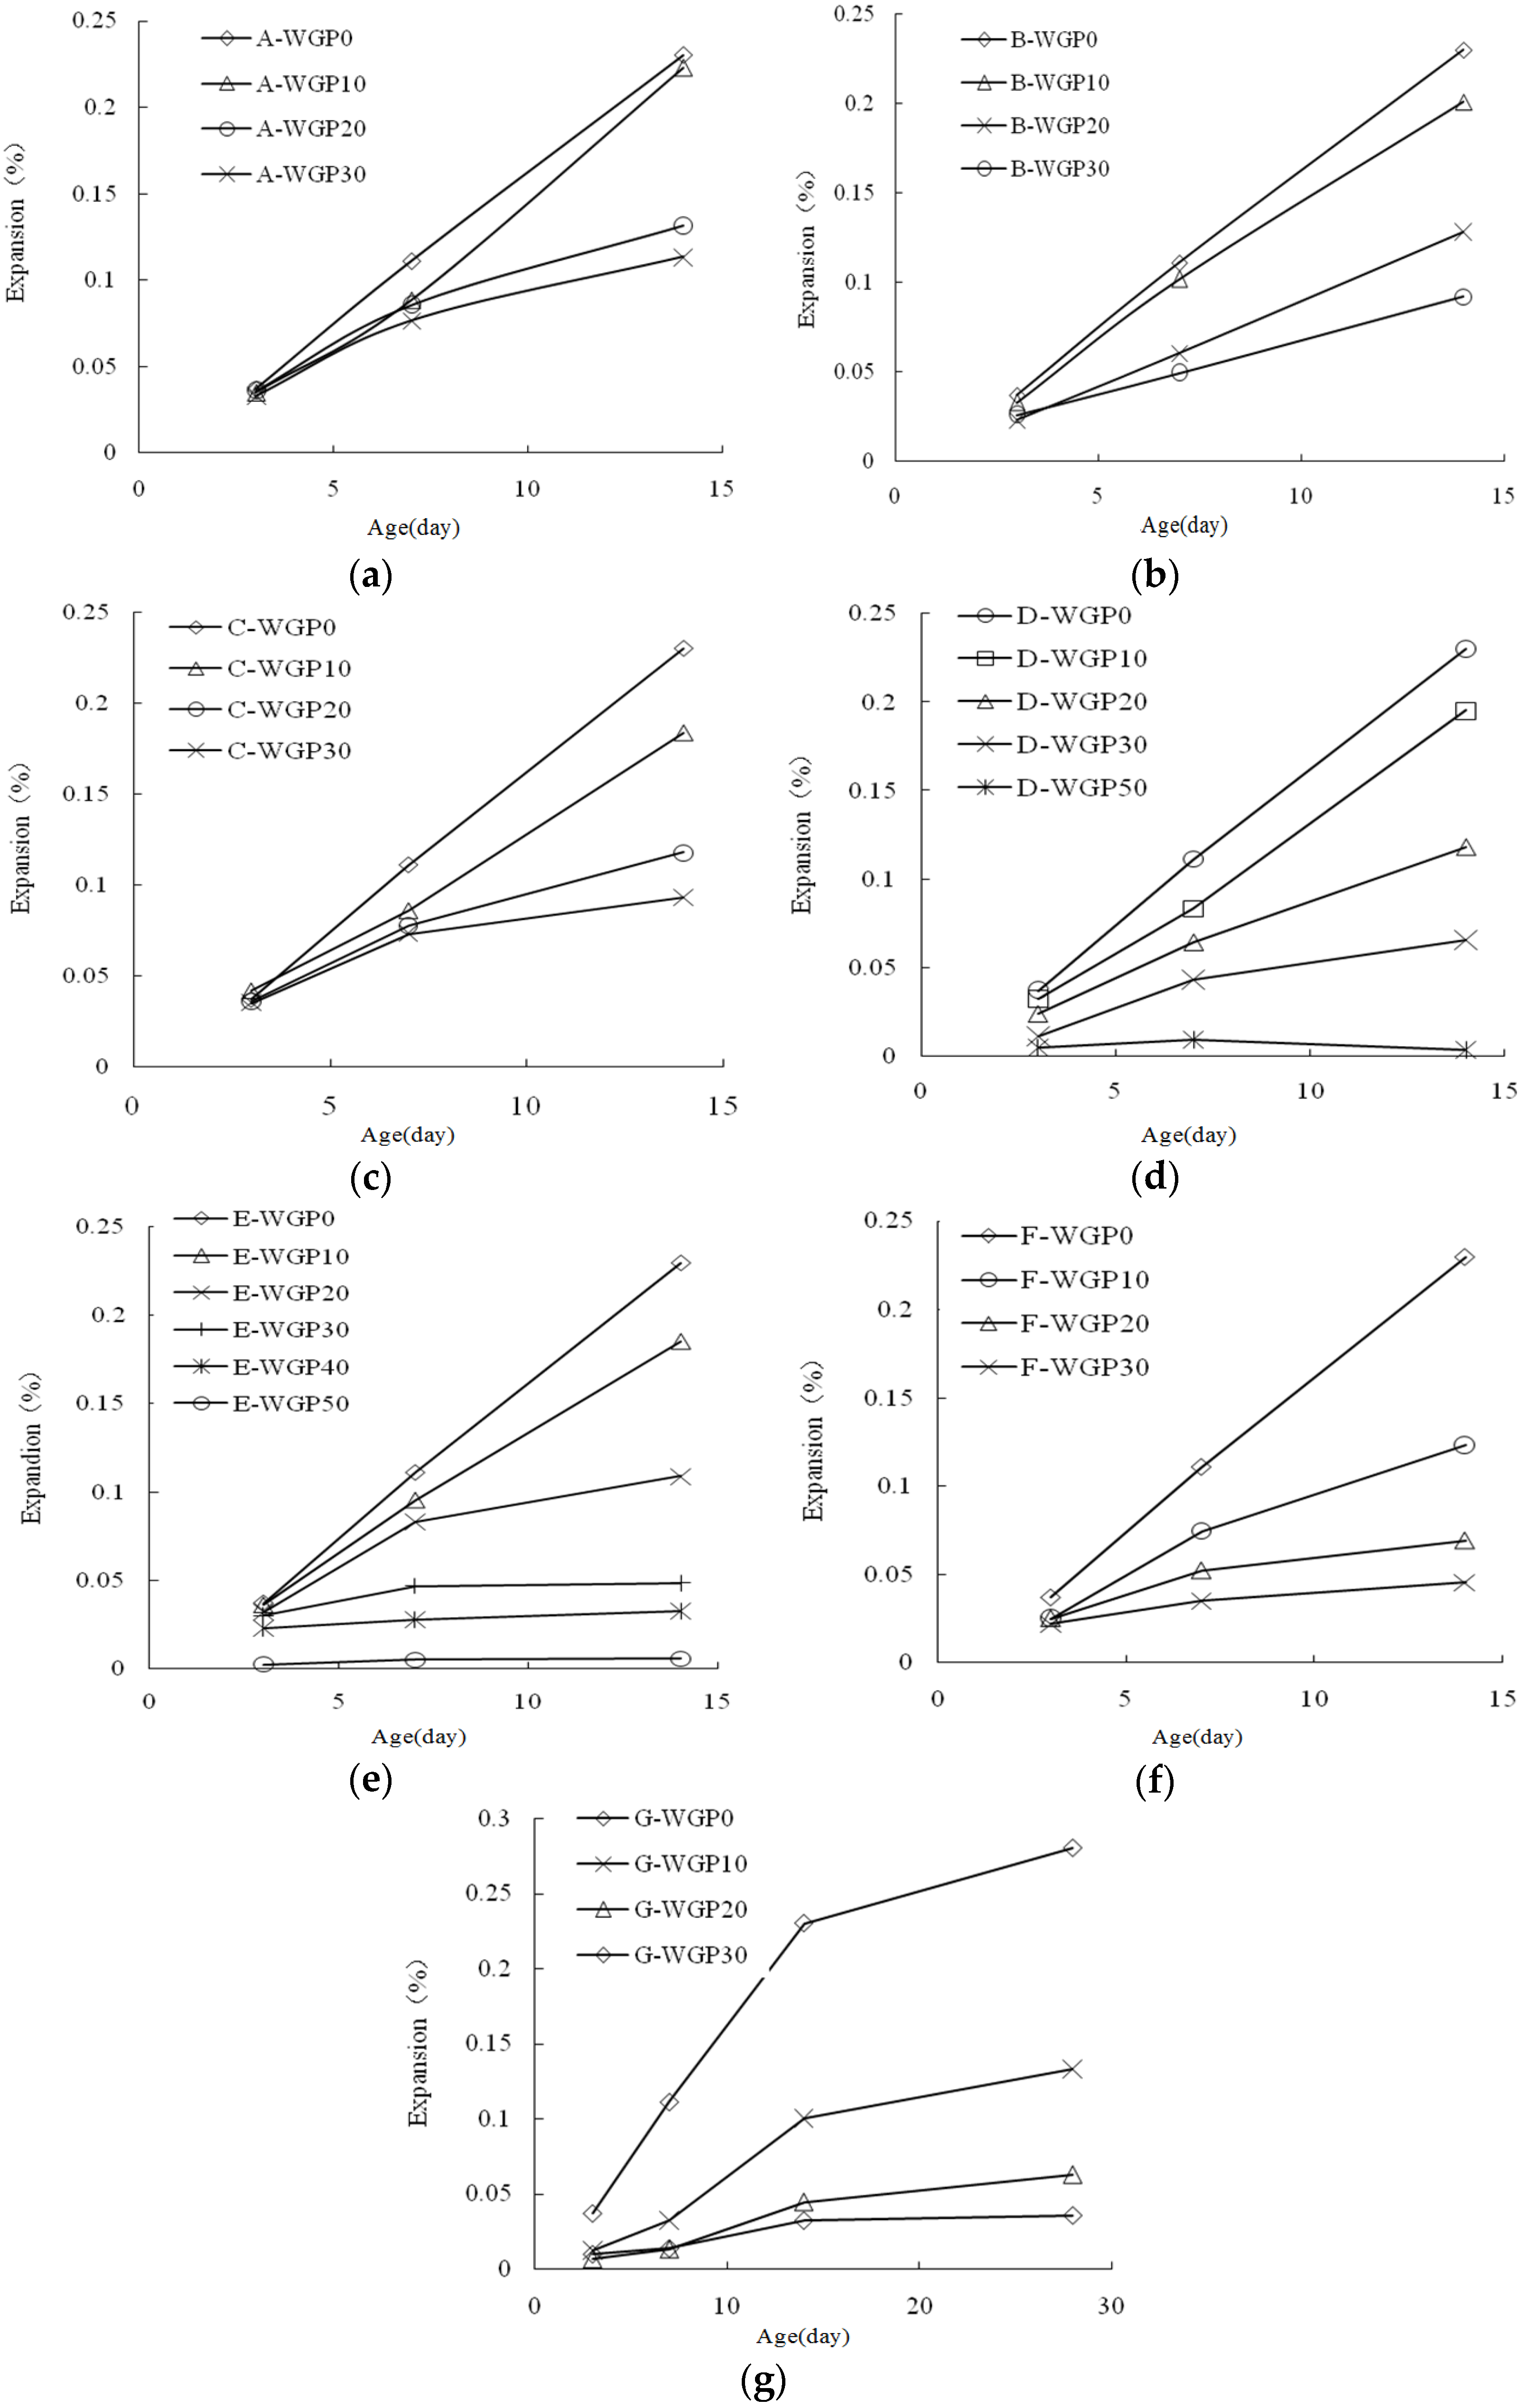
In order to study the ASR activity and expansion development induced by WG aggregate, the mortar bar method (equivalent to ASTM C227 [
10]) and the accelerated mortar bar method (equivalent to ASTM C1260 [
11]) are used. The alkali content of cement is adjusted to be 0.6%. Mortars with water to cementitious materials ratio of 0.47 are prepared whose size is 25.4 × 25.4 × 285 mm
3. The mix proportions are shown in
Table 4. As for the accelerated mortar bar method, the specimens are demolded after 24 h and then placed in 1N NaOH solution at 80 °C to be totally immersed for 3, 7, 14 and 28 days. As for the mortar bar method, the specimens are demolded after 24 h and then stored in NaOH solution at 38 °C for 2 weeks, 1, 2, 3 and 6 months. According to the accelerated mortar bar method, the expansion rate less than 0.10% at 14 days is indicative of innocuous behavior, and the expansion rate larger than 0.20% is indicative of potentially deleterious expansion. According to the mortar bar method, the expansion rate less than 0.10% at 6 months is indicative of innocuous behavior. Tests are conducted according to regulations for aggregate alkali activity in test code SL352-2006 hydraulic concrete.
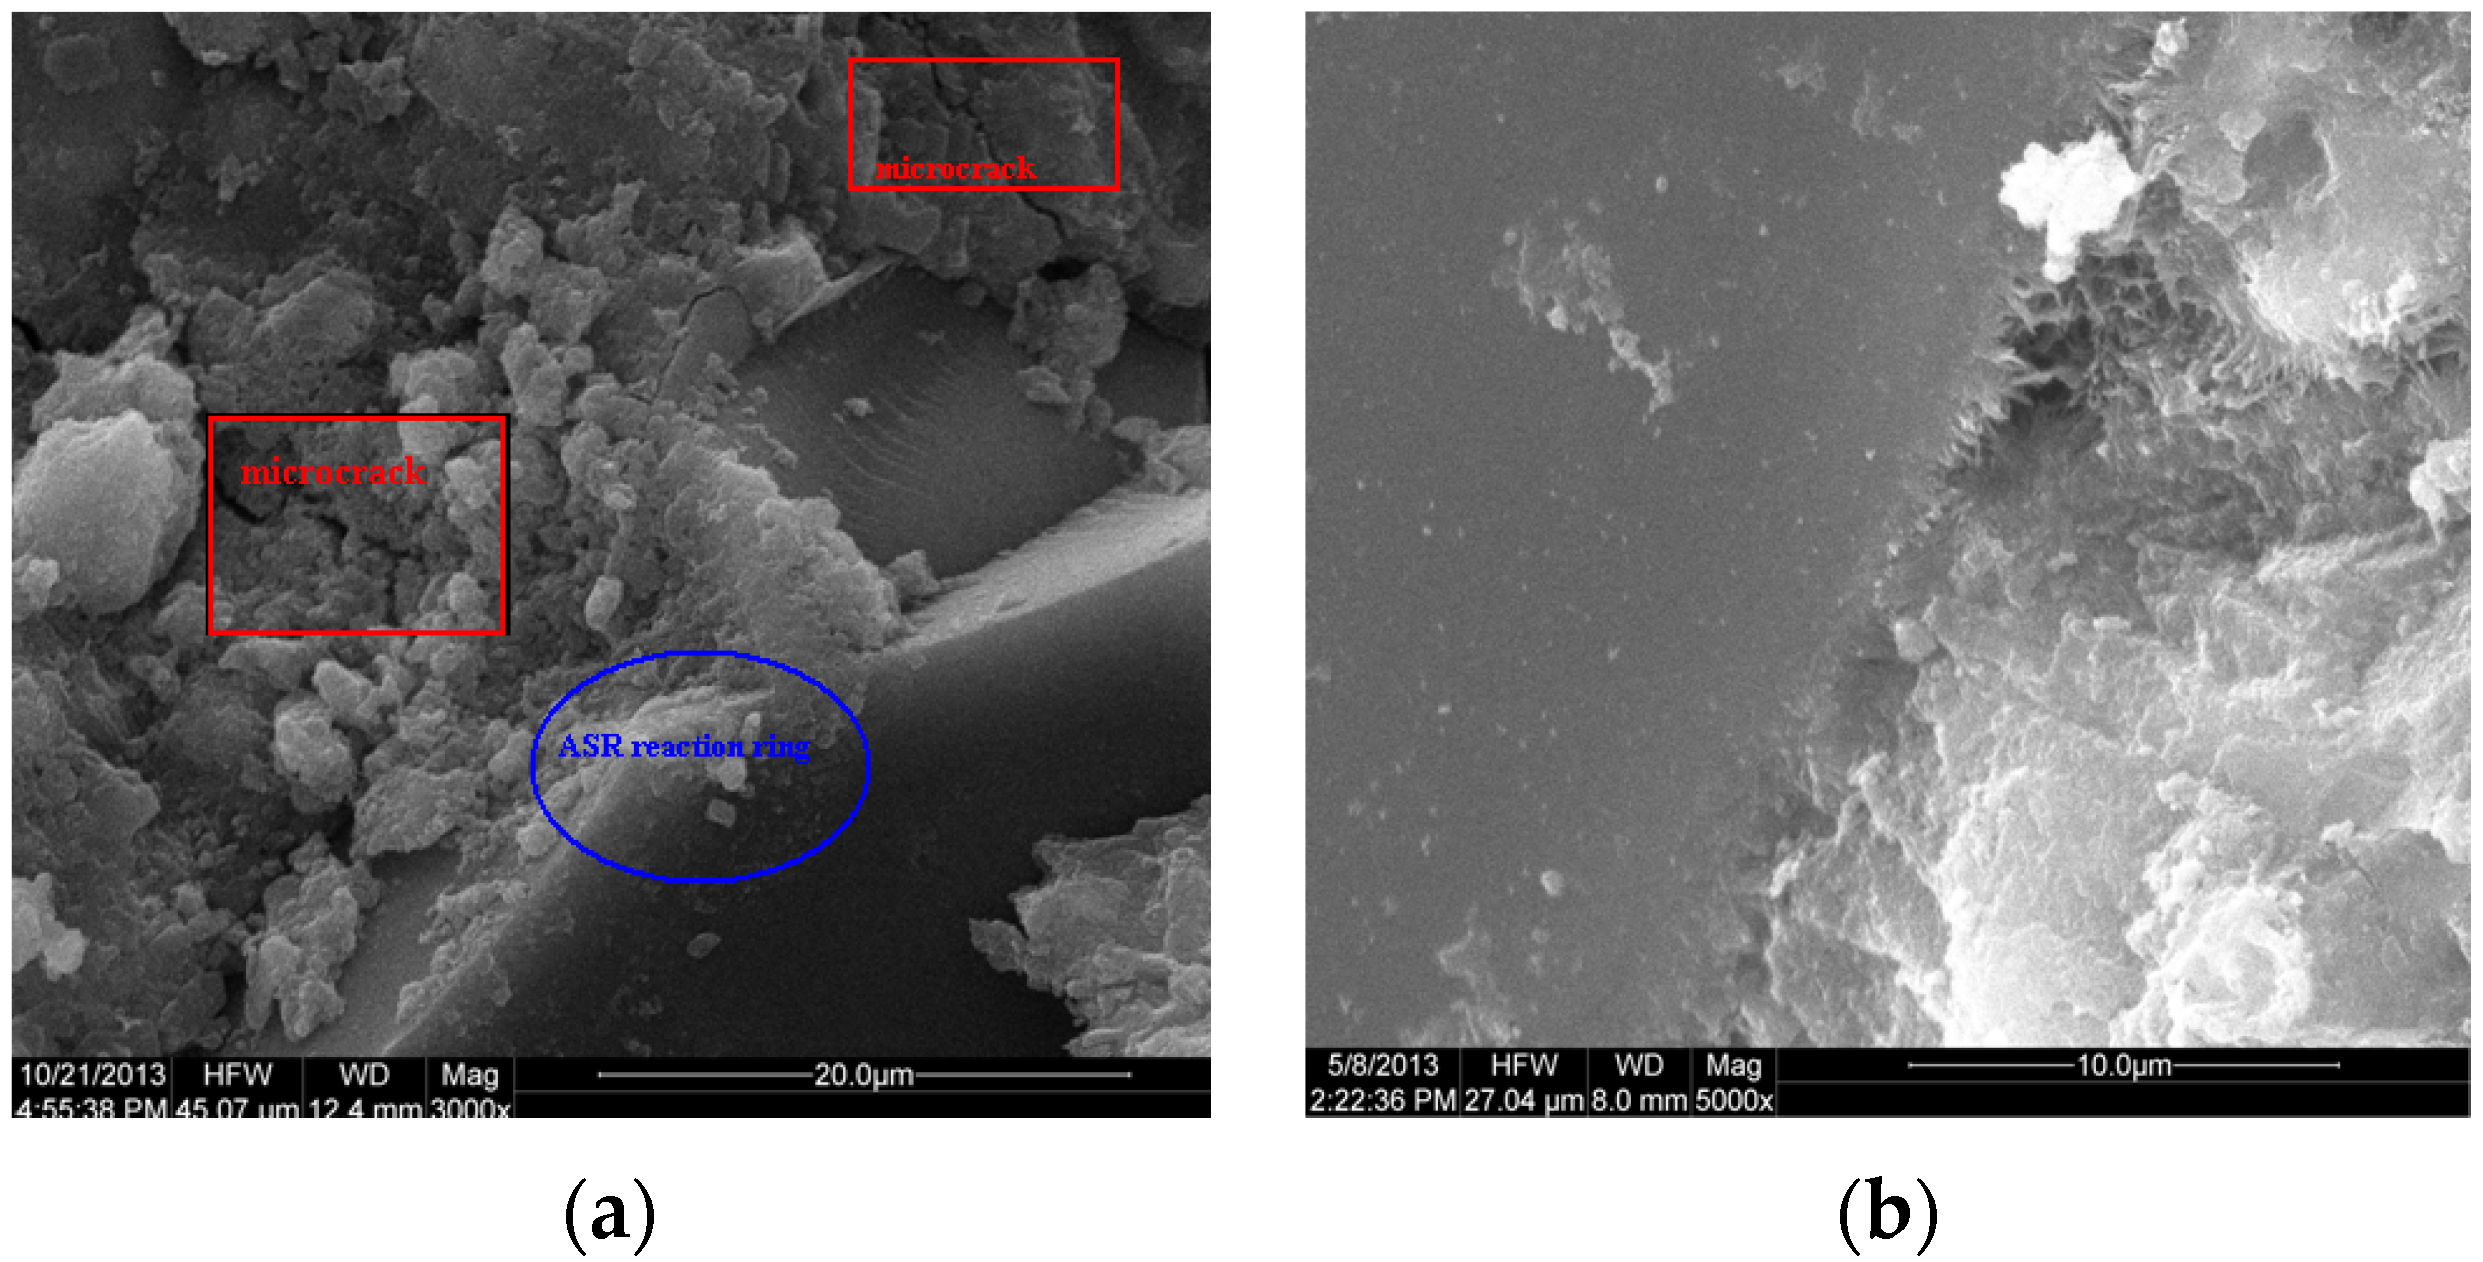
After ASR test, small clean specimens are taken out from the central of the mortars by a hammer and soaked in anhydrous ethanol to avoid carbonization before SEM observation, less than two weeks. The samples are dried for 2–3 h at 60 °C in a vacuum drying oven and placed in a vacuum coating machine for dehumidifying and gilding treatment.
Table 4.
Mix proportions of mortar.
Table 4.
Mix proportions of mortar.
| Samples | Cement (g) | Glass Powder (g) | Water (g) | Glass Aggregate (g) | Standard Sand (g) | NaOH (g) |
|---|
| *-WGP0 | 400 | 0 | 188 | 810 | 90 | 0.00 |
| *-WGP10 | 360 | 40 | 188 | 810 | 90 | 0.00 |
| *-WGP20 | 320 | 80 | 188 | 810 | 90 | 0.31 |
| *-WGP30 | 280 | 120 | 188 | 810 | 90 | 0.85 |


