2.1. Surface Analysis and Bulk Structure
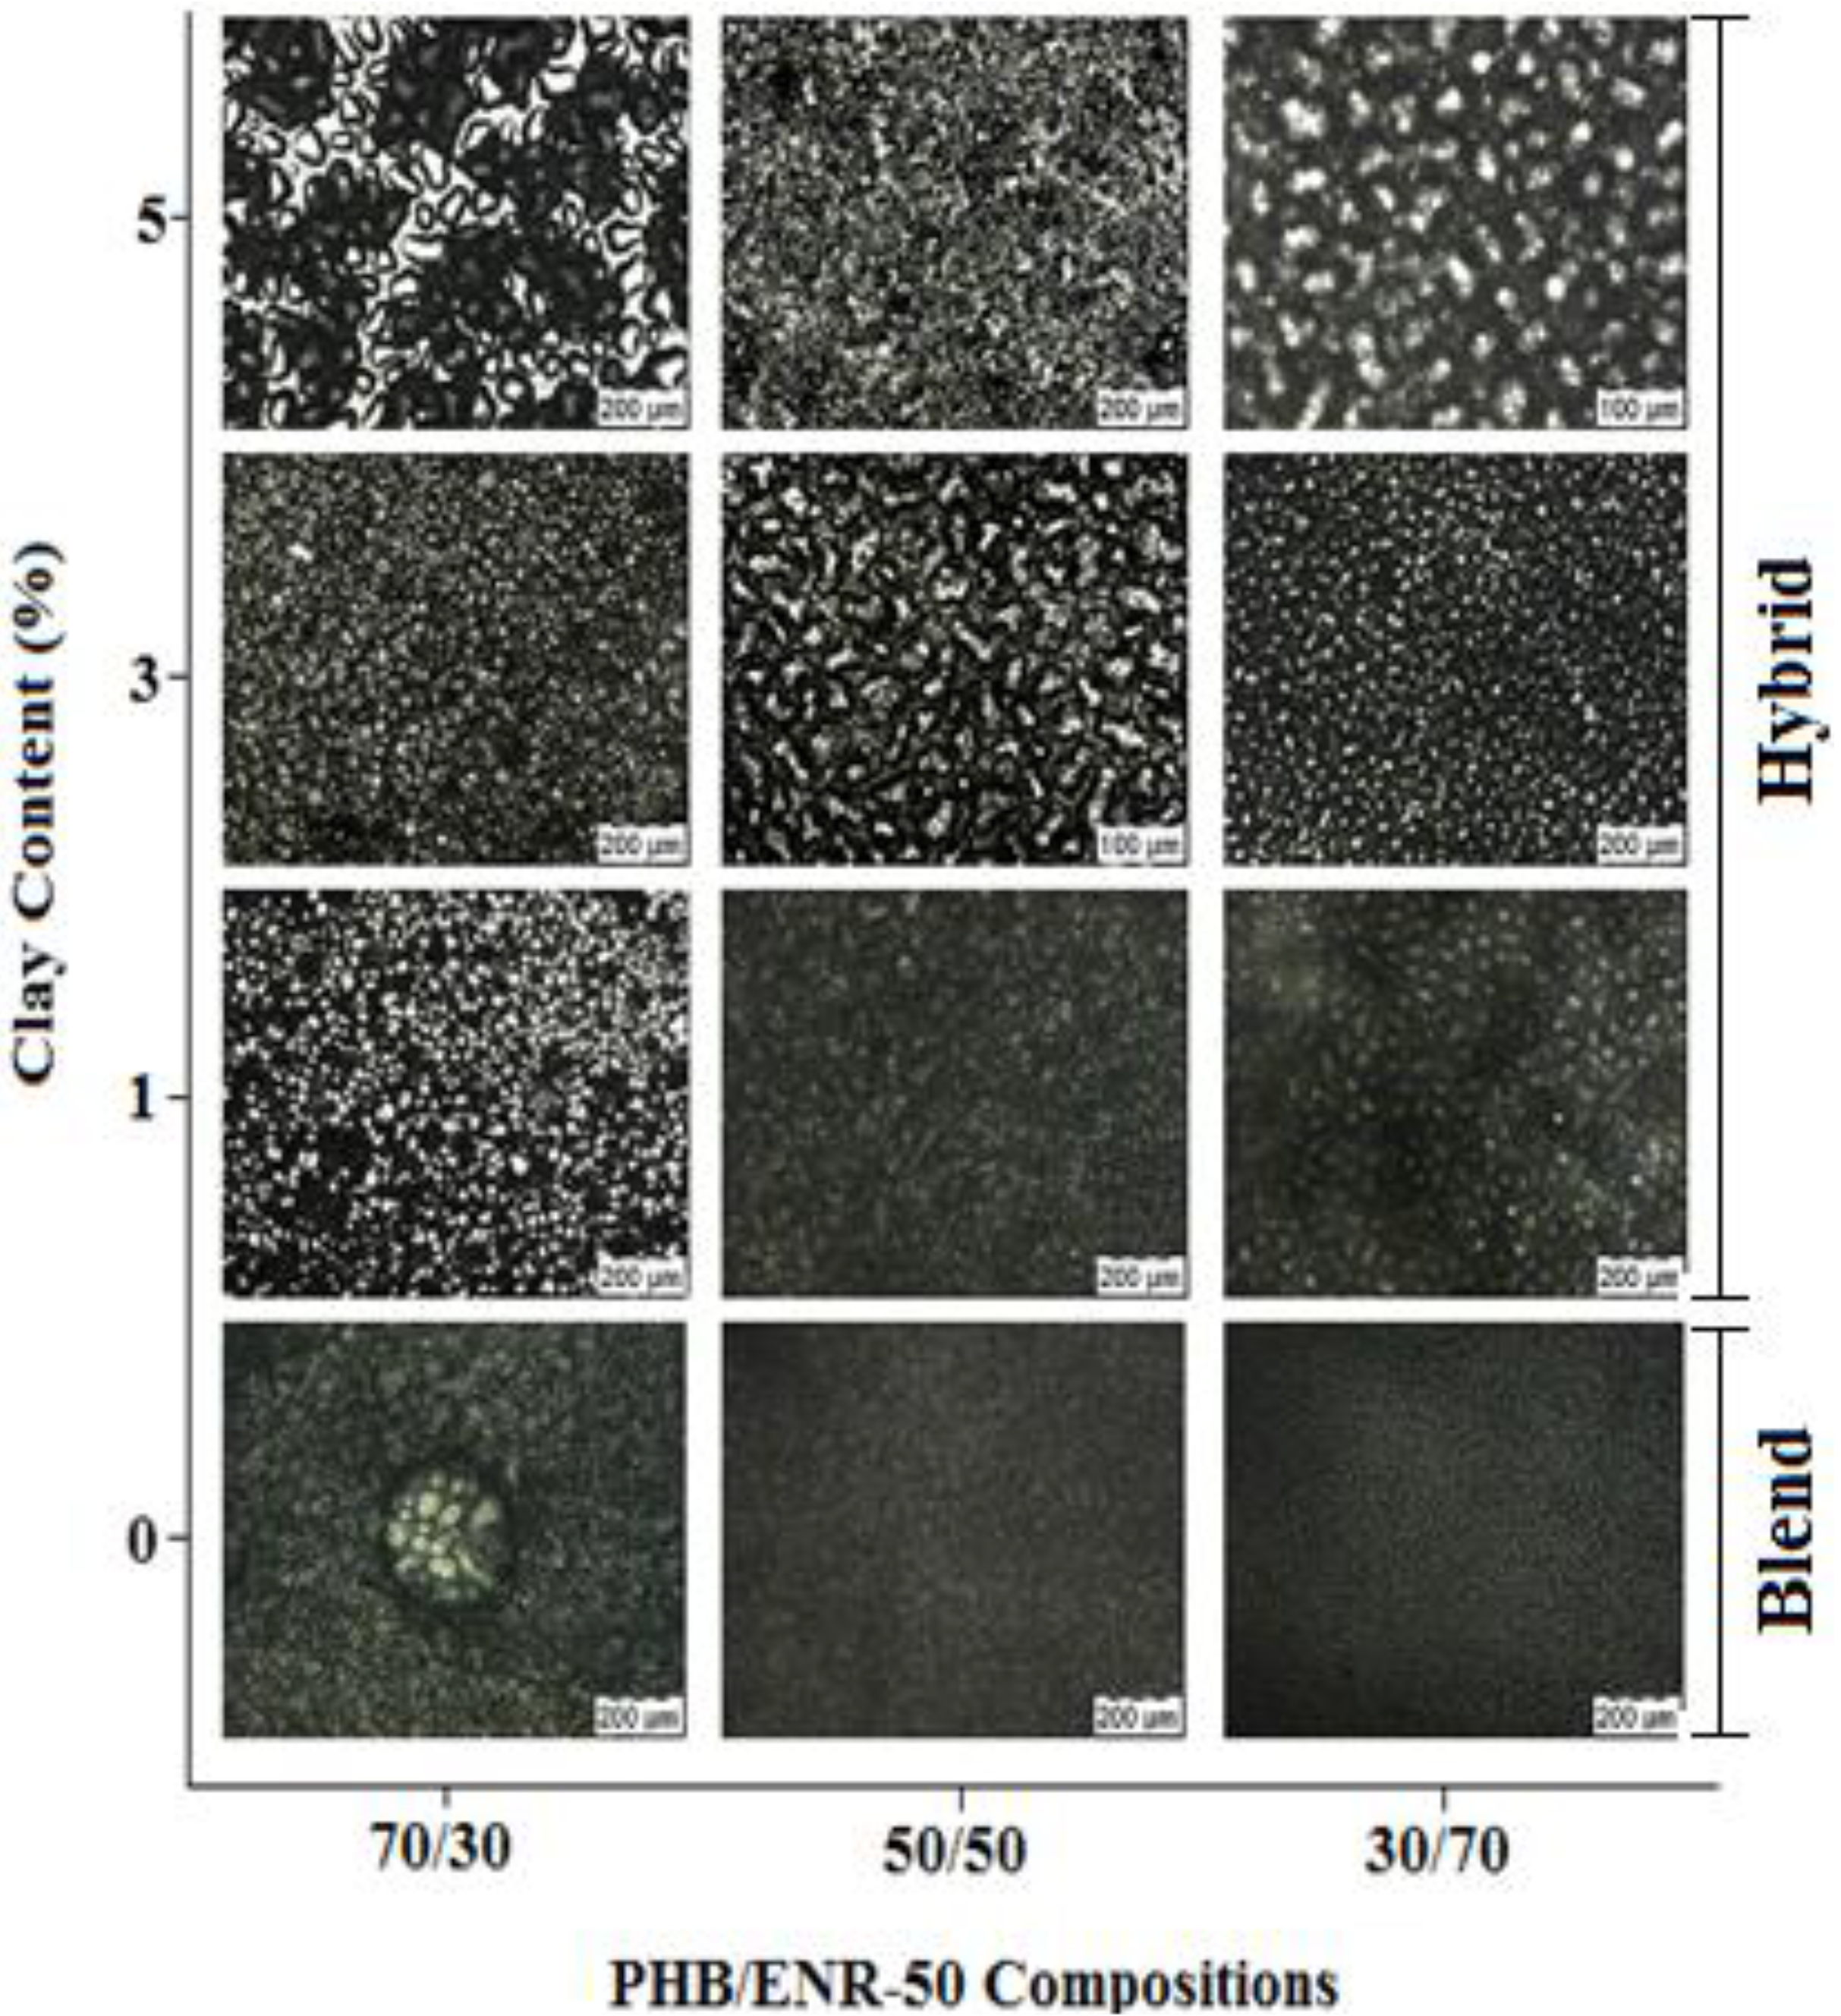
Figure 1 shows POM images of various compositions of PHB/ENR-50 blends and the various blends containing 1, 3 and 5 wt% MMT. The PHB/ENR-50 blends show different optical characteristics. When the 30/70 PHB/ENR-50 blend was tested, fraction of PHB is still observed. However, upon increasing the fraction of PHB in the polymer blend (
i.e., 50/50 blend), a regular but co-continuous morphology is obtained. Further increase in the fraction of PHB (as in 70/30 blend) causes a phase inversion whereby the PHB assumes the matrix and ENR-50 is the dispersed phase. Thus, by increasing the PHB fraction in the blends, clusters of PHB crystals occur especially in the 70/30 composition of PHB/ENR-50. In contrast, upon increasing the fraction of ENR progressively, the morphology of the blend shows a homogeneous structure due to the surface covering of the PHB crystals by ENR-50 domains.
Figure 1.
Polarized Optical Micrographs of various PHB/ENR-50 blends and the respective blends containing various wt% MMT at room temperature.
Figure 1.
Polarized Optical Micrographs of various PHB/ENR-50 blends and the respective blends containing various wt% MMT at room temperature.
When MMT is incorporated into the blend with a lower fraction of PHB, uneven distribution of nanoclay in the polymer matrix is observed. This is attributed to the agglomerations of clay particles in the blend. This phenomenon is more apparent in PHB/ENR-50 blends containing 5 wt% MMT. However, when equal fraction of amorphous and crystalline domain is employed, the 1 wt% MMT is dispersed homogeneously with narrow distribution of nanoclay within the polymer matrix. It seems at this blend composition and low MMT content, the extent of interaction of blend-MMT is less. As a result, the MMT particles were distributed freely within the blend. A packed and uneven morphology are instead observed for blends containing 3 and 5 wt% MMT respectively. On the other hand, by increasing the PHB fraction, the blend becomes more brittle, the MMT agglomerates into islands and the continuous surface are cracked. An obvious appearance of crack can be observed in the 70/30 composition of PHB/ENR-50 containing 5 wt% MMT.
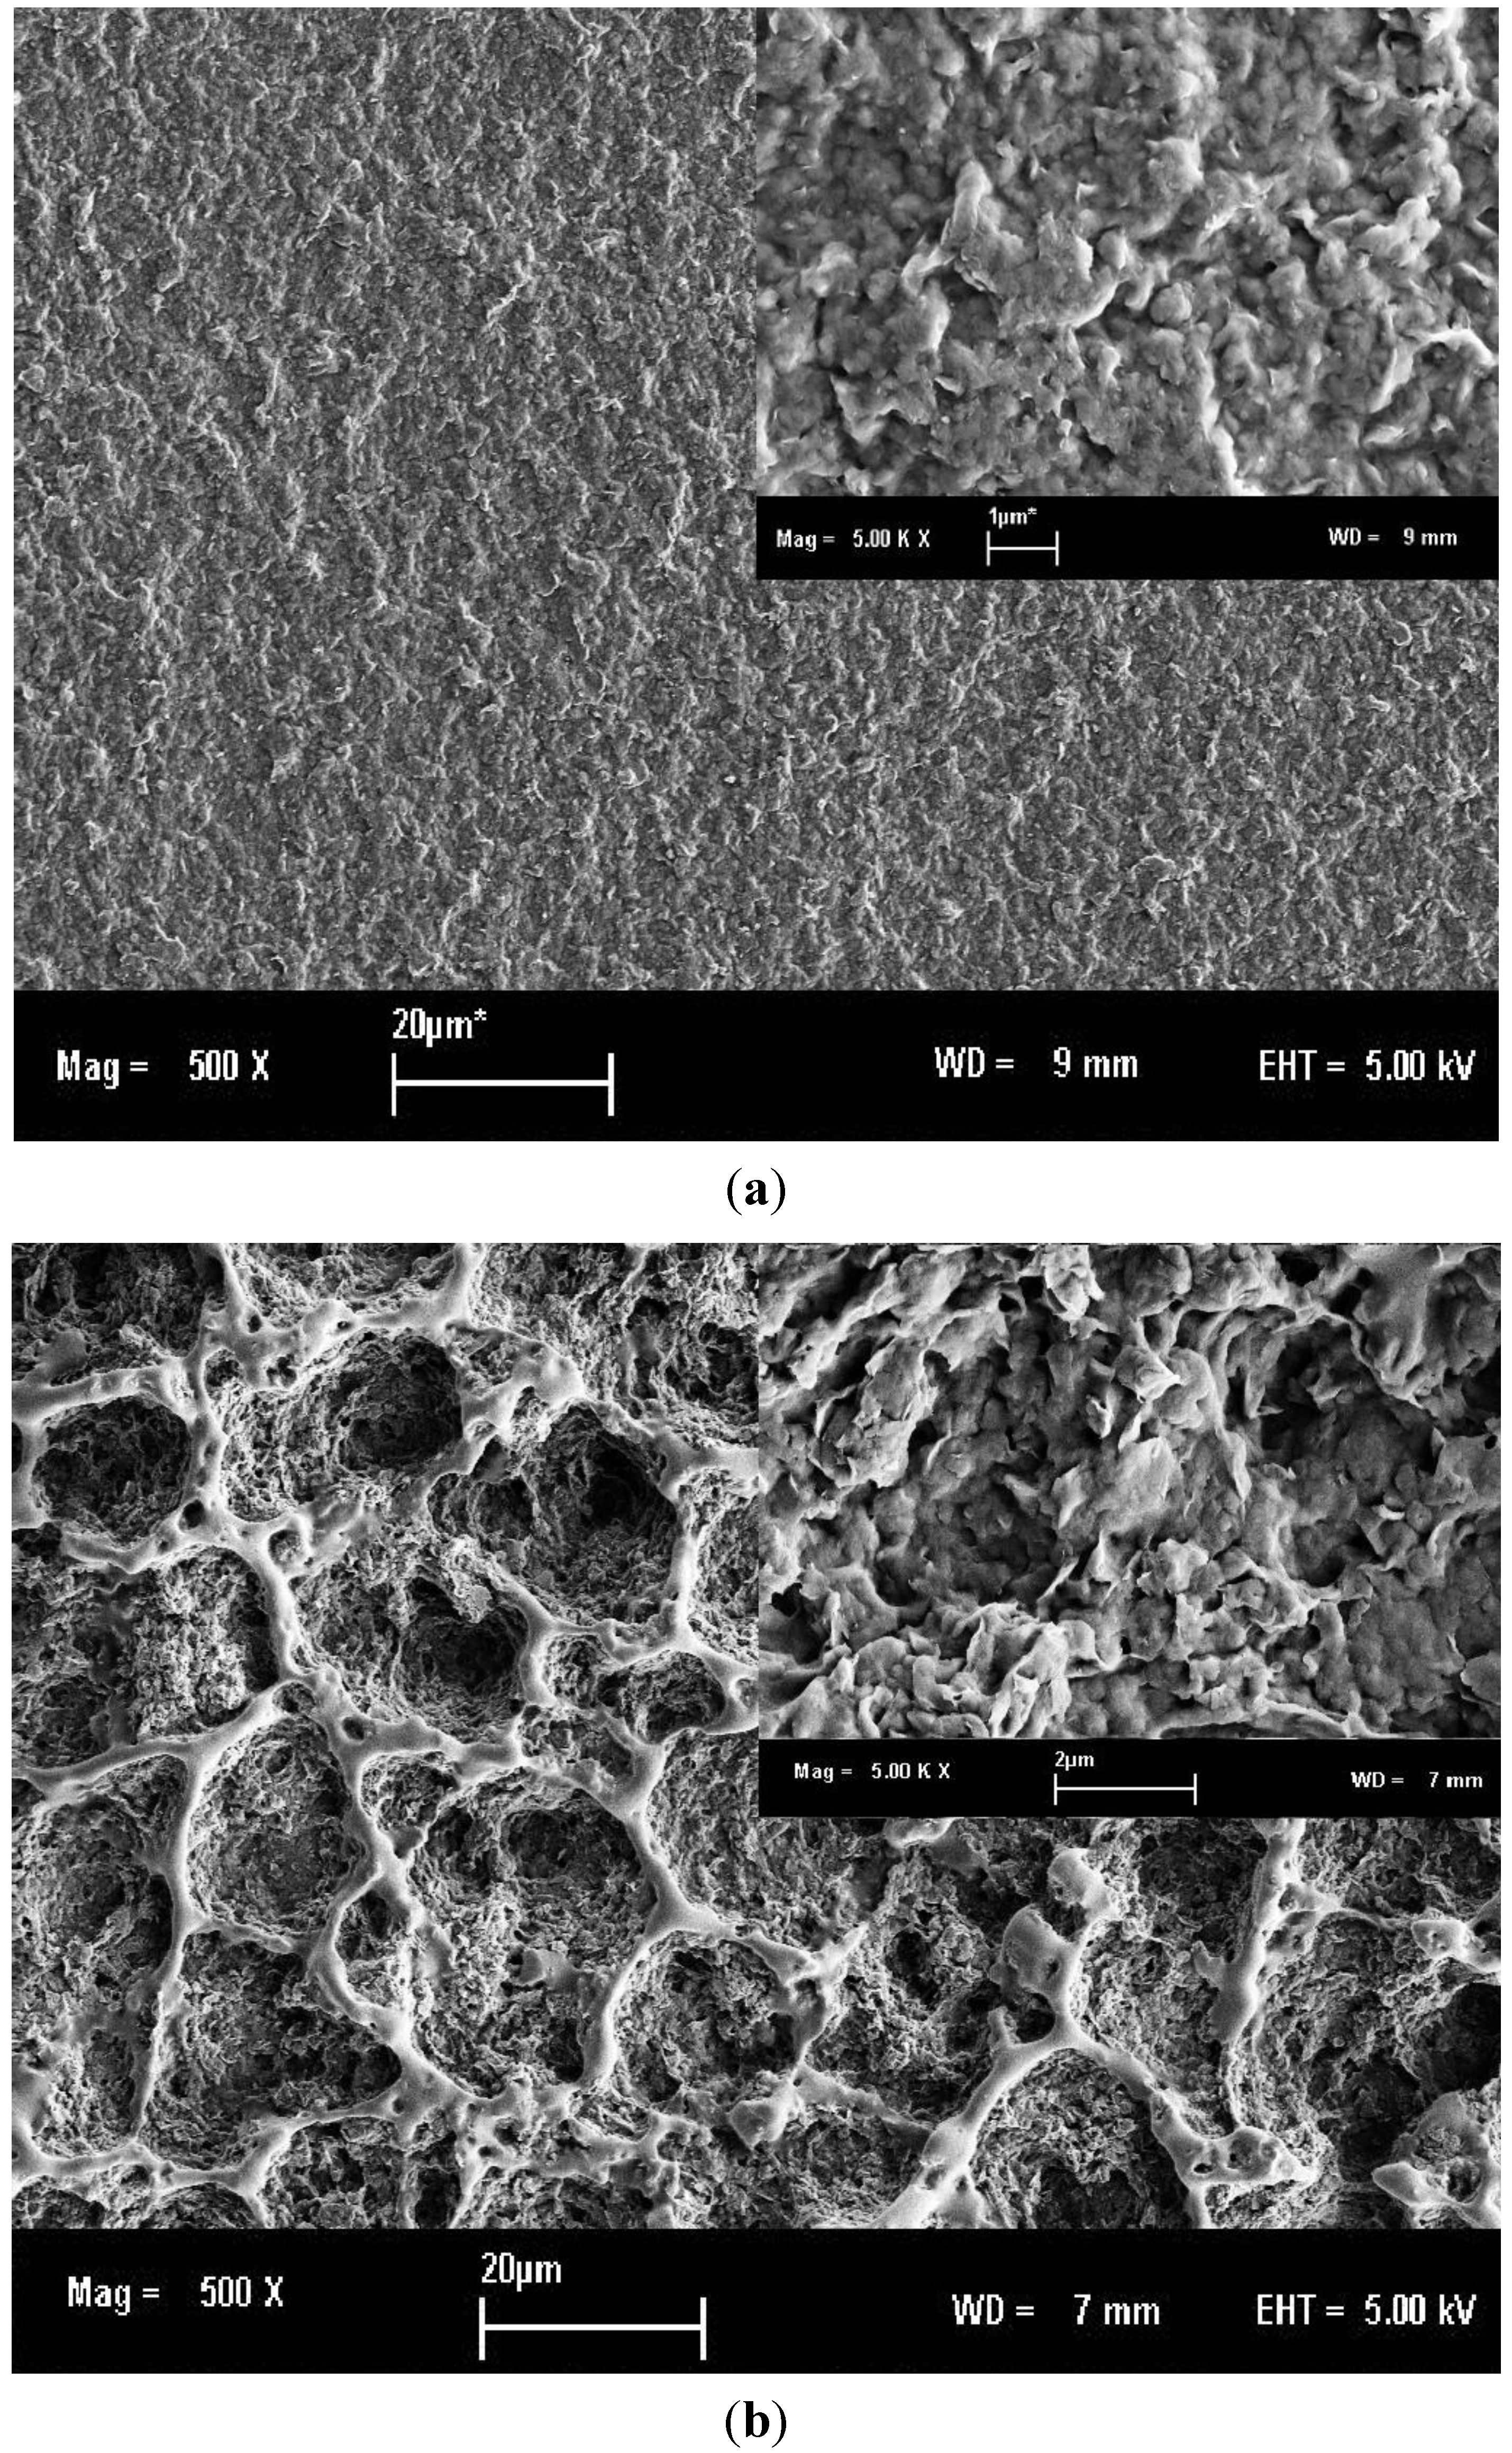
Figure 2 compares the surface morphologies of 50/50 composition of PHB/ENR-50 blends containing 3 and 5 wt% MMT. In this blend, it is observed that upon addition of 3 wt% MMT, packed and folded morphology is formed. The interfaces are dispersed in the internal galleries of silicate layers. In blend containing 5 wt% MMT, some obvious interface can be observed.
Figure 2.
SEM micrographs of equal fraction of PHB/ENR-50 blend containing (a) 3 and (b) 5 wt% MMT (both at 5 kV with 500× and inset: 5000× magnifications).
Figure 2.
SEM micrographs of equal fraction of PHB/ENR-50 blend containing (a) 3 and (b) 5 wt% MMT (both at 5 kV with 500× and inset: 5000× magnifications).
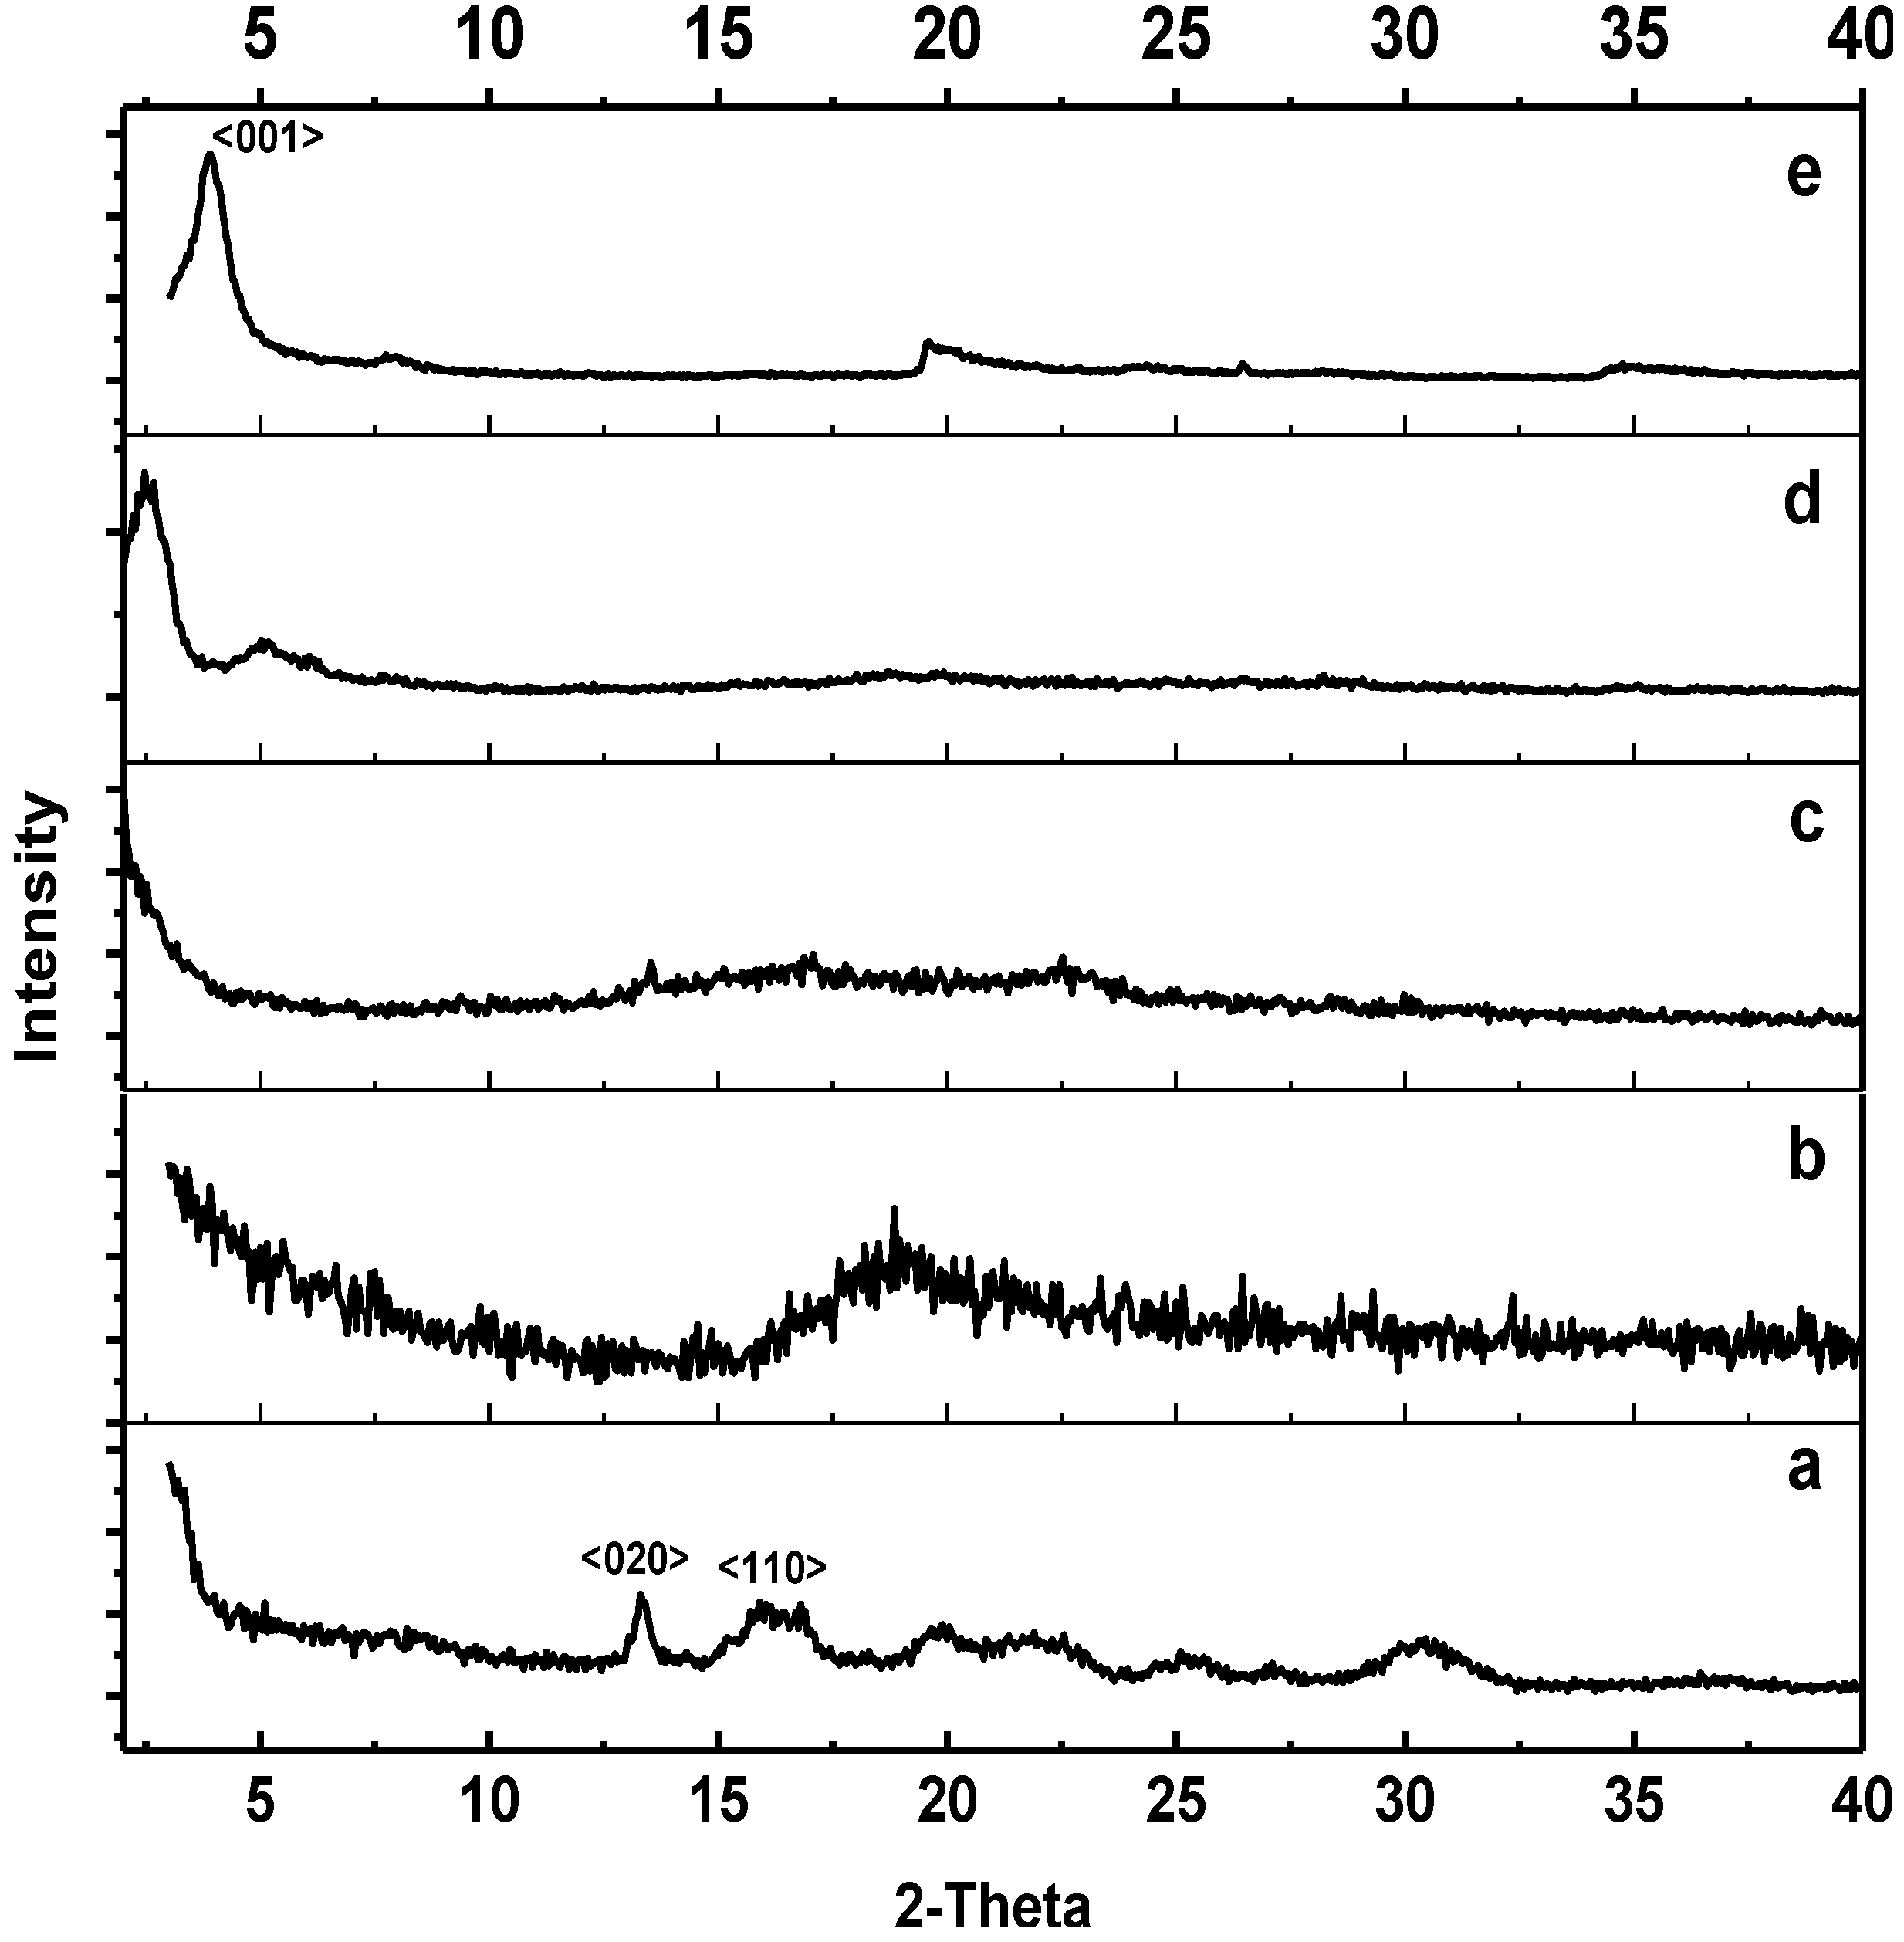
Figure 3 shows the X-ray diffraction patterns of PHB, ENR-50, PHB/ENR-50 (50/50) blends containing zero and 5 wt% MMT and pristine MMT. The diffractogram of PHB is shown in
Figure 3a. This polymer exhibits two intense peaks at 2θ values of 13.33° and 16.05°. These peaks are assigned to the <020> and <110> planes of the orthorhombic unit cell of PHB and is in agreement with those reported by Holmes [
23] and Zihijiang
et al. [
24]. In contrast, ENR-50 does not show any peaks due to the amorphous nature of the polymer as observed in
Figure 3b. The diffractogram of pristine MMT shown in
Figure 3e demonstrates several peaks. These peaks are positioned at 2θ values of 3.913°, 7.869° and 19.511° corresponding to an interlayer distance of 2.256 nm, 1.123 nm and 0.455 nm respectively.
Introducing an amorphous domain of ENR-50 into the crystalline PHB has resulted in disordering of the crystal arrangements of the later polymer. This is depicted by the fact that majority of the PHB peaks disappeared as shown in
Figure 3c. This also suggests a well dispersion of ENR-50 and dominance in PHB. Incorporation of 5 wt% MMT into 50/50 PHB/ENR-50 blend (
Figure 3d) resulted in the MMT peaks to appear at 2θ values of 2.535° and 5.060°. This corresponds to the interlayer spacing of 3.484 nm and 1.746 nm respectively. There is a slight shift in peak position when compared to pristine MMT that suggests a proper intercalation of polymer chains into the silicate layers. According to Vu
et al. [
25] and Botana
et al. [
3], the decrease in peak intensity was due to the swelling of the alkyl ammonium modified nanoclay in organic solvents. Thus, in this work, introducing a polymer solution into the clay layers was sufficient to cause intercalation of the polymer into the galleries of the swelled clay and expand the MMT intergalleries. This is depicted by the shift of the peaks to lower d-spacing values when compared to pristine MMT [
21].
Figure 3.
XRD patterns of (a) PHB; (b) ENR-50; (c) PHB/ENR-50 (50/50) blends; (d) PHB/ENR-50 (50/50) blends containing 5 wt% MMT; and (e) MMT.
Figure 3.
XRD patterns of (a) PHB; (b) ENR-50; (c) PHB/ENR-50 (50/50) blends; (d) PHB/ENR-50 (50/50) blends containing 5 wt% MMT; and (e) MMT.
2.2. FTIR Spectroscopy and Proposed Mechanism
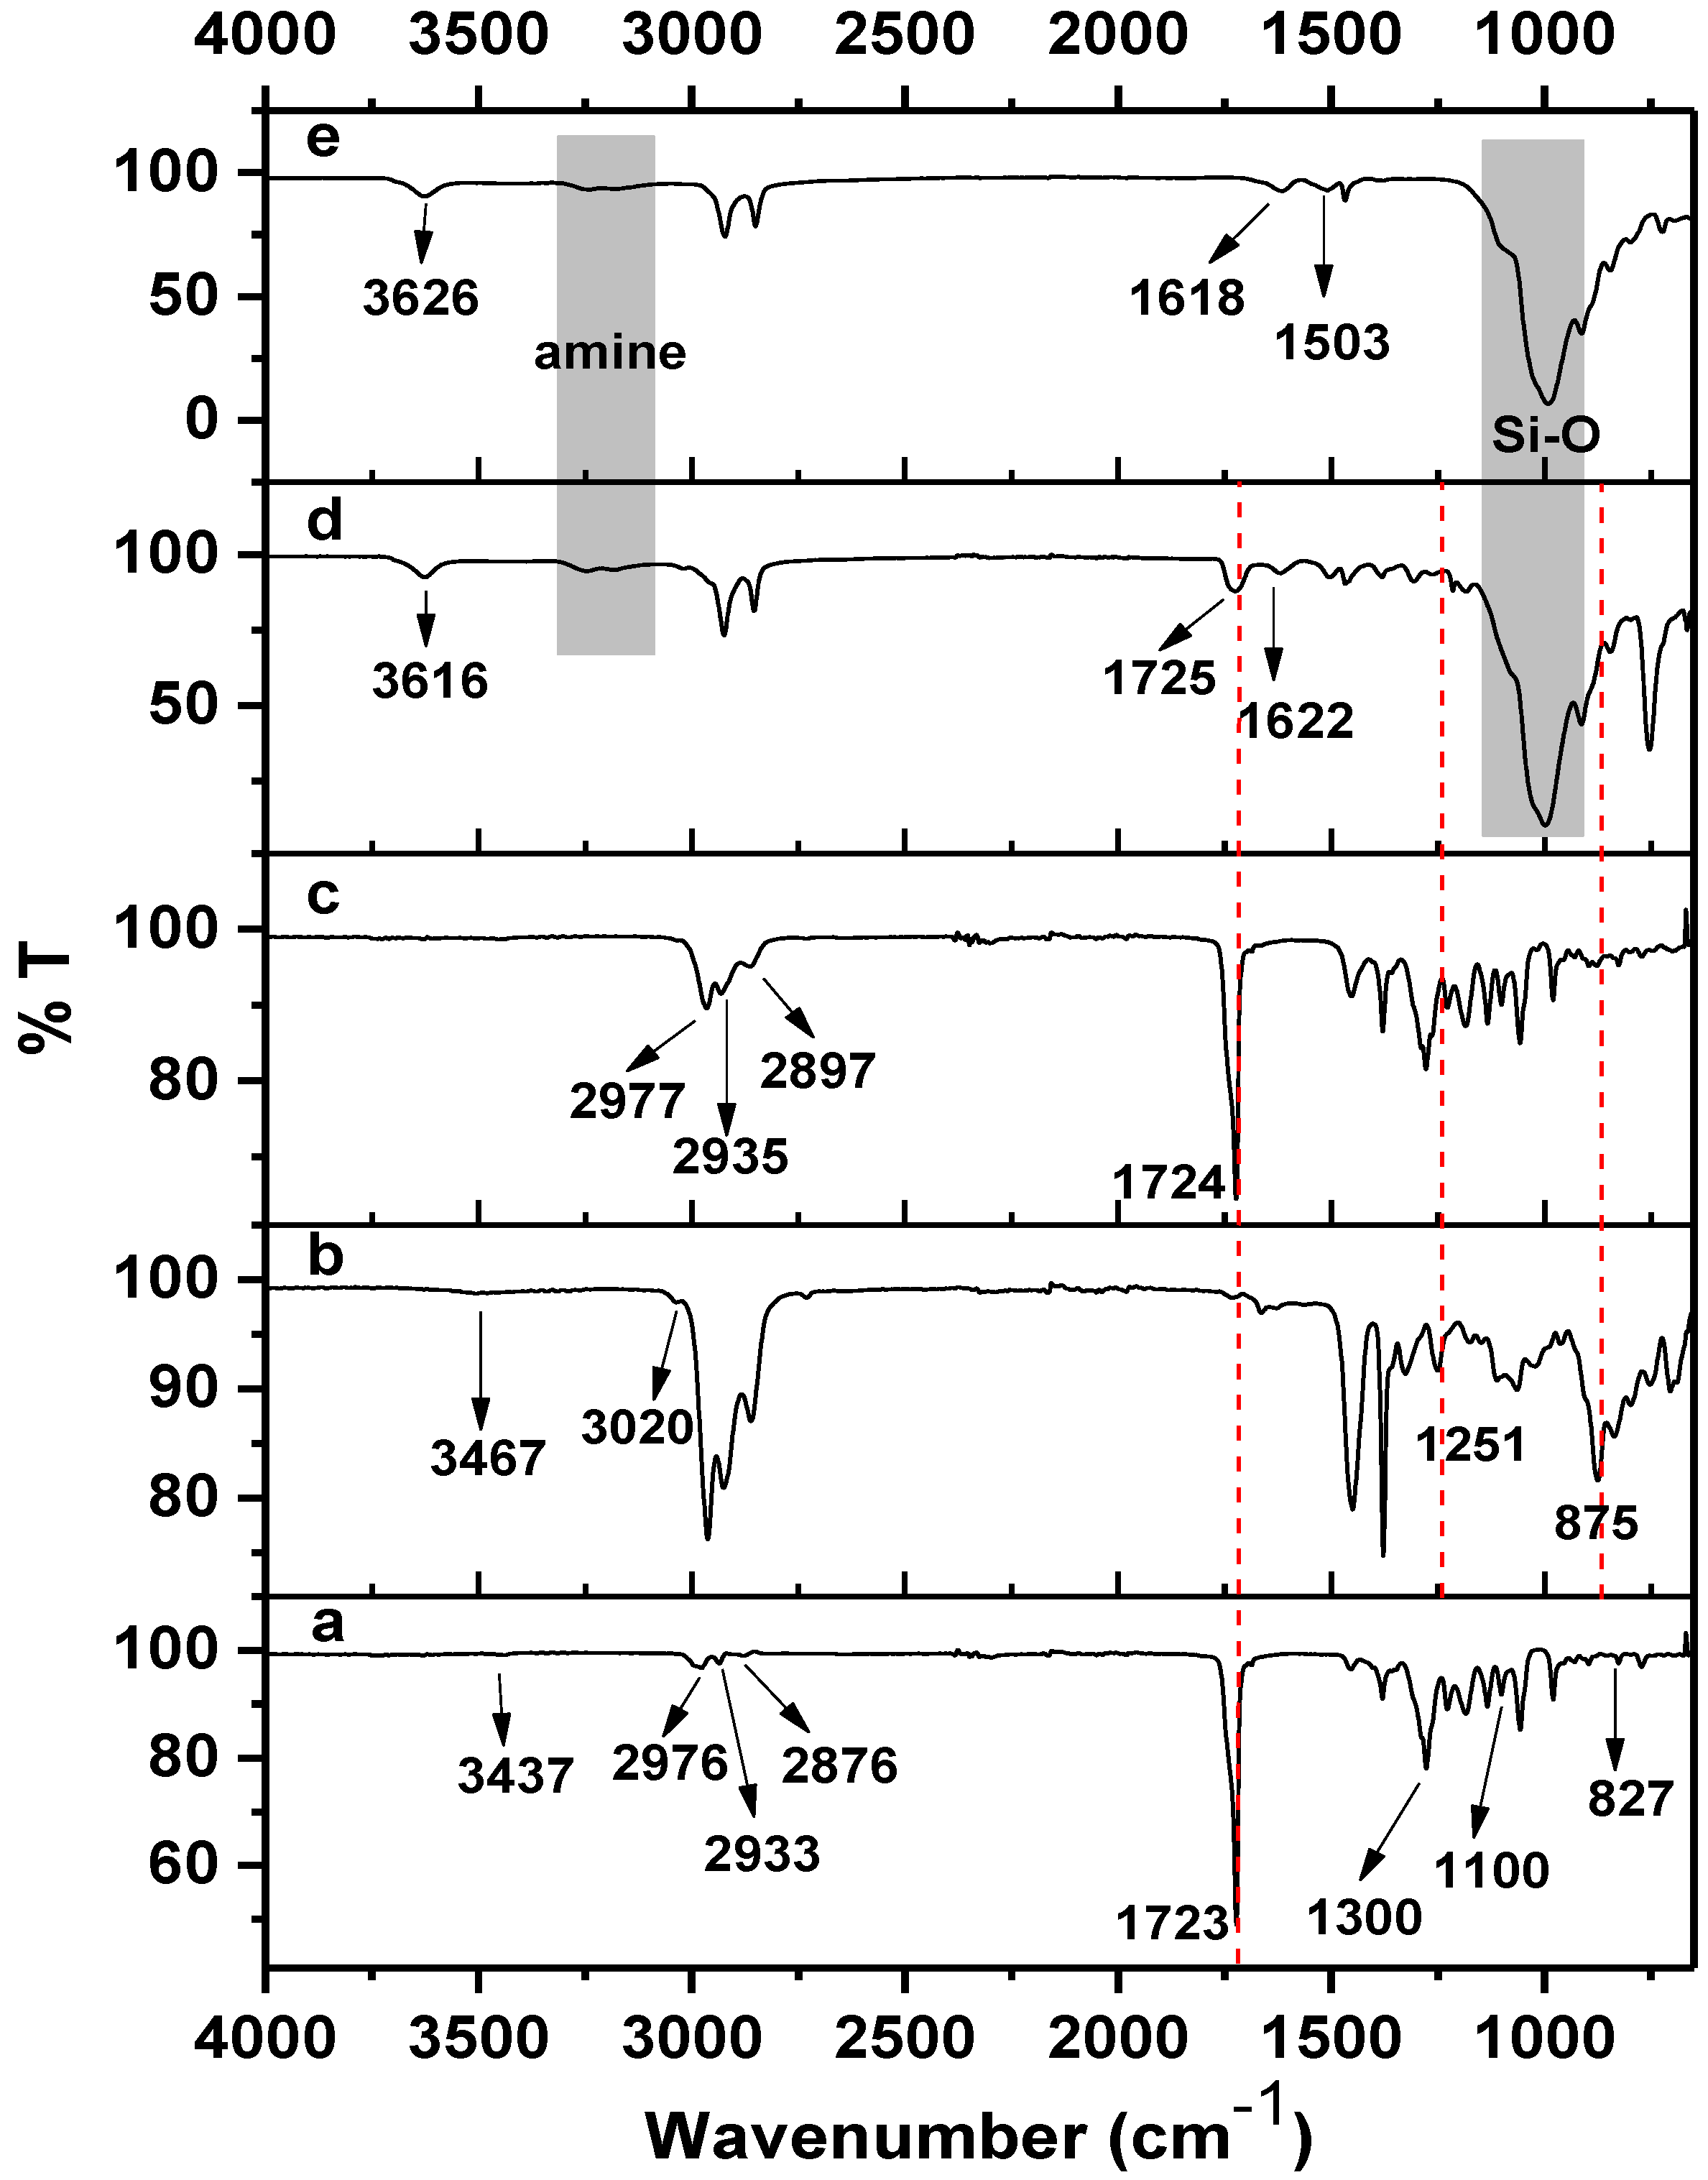
The FTIR spectra of PHB, ENR-50, PHB/ENR-50 (50/50) blend and the respective nanohybrid comprising of the (50/50) blend containing 5 wt% MMT and MMT are shown in
Figure 4. Some of the FTIR characteristic bands are tabulated in
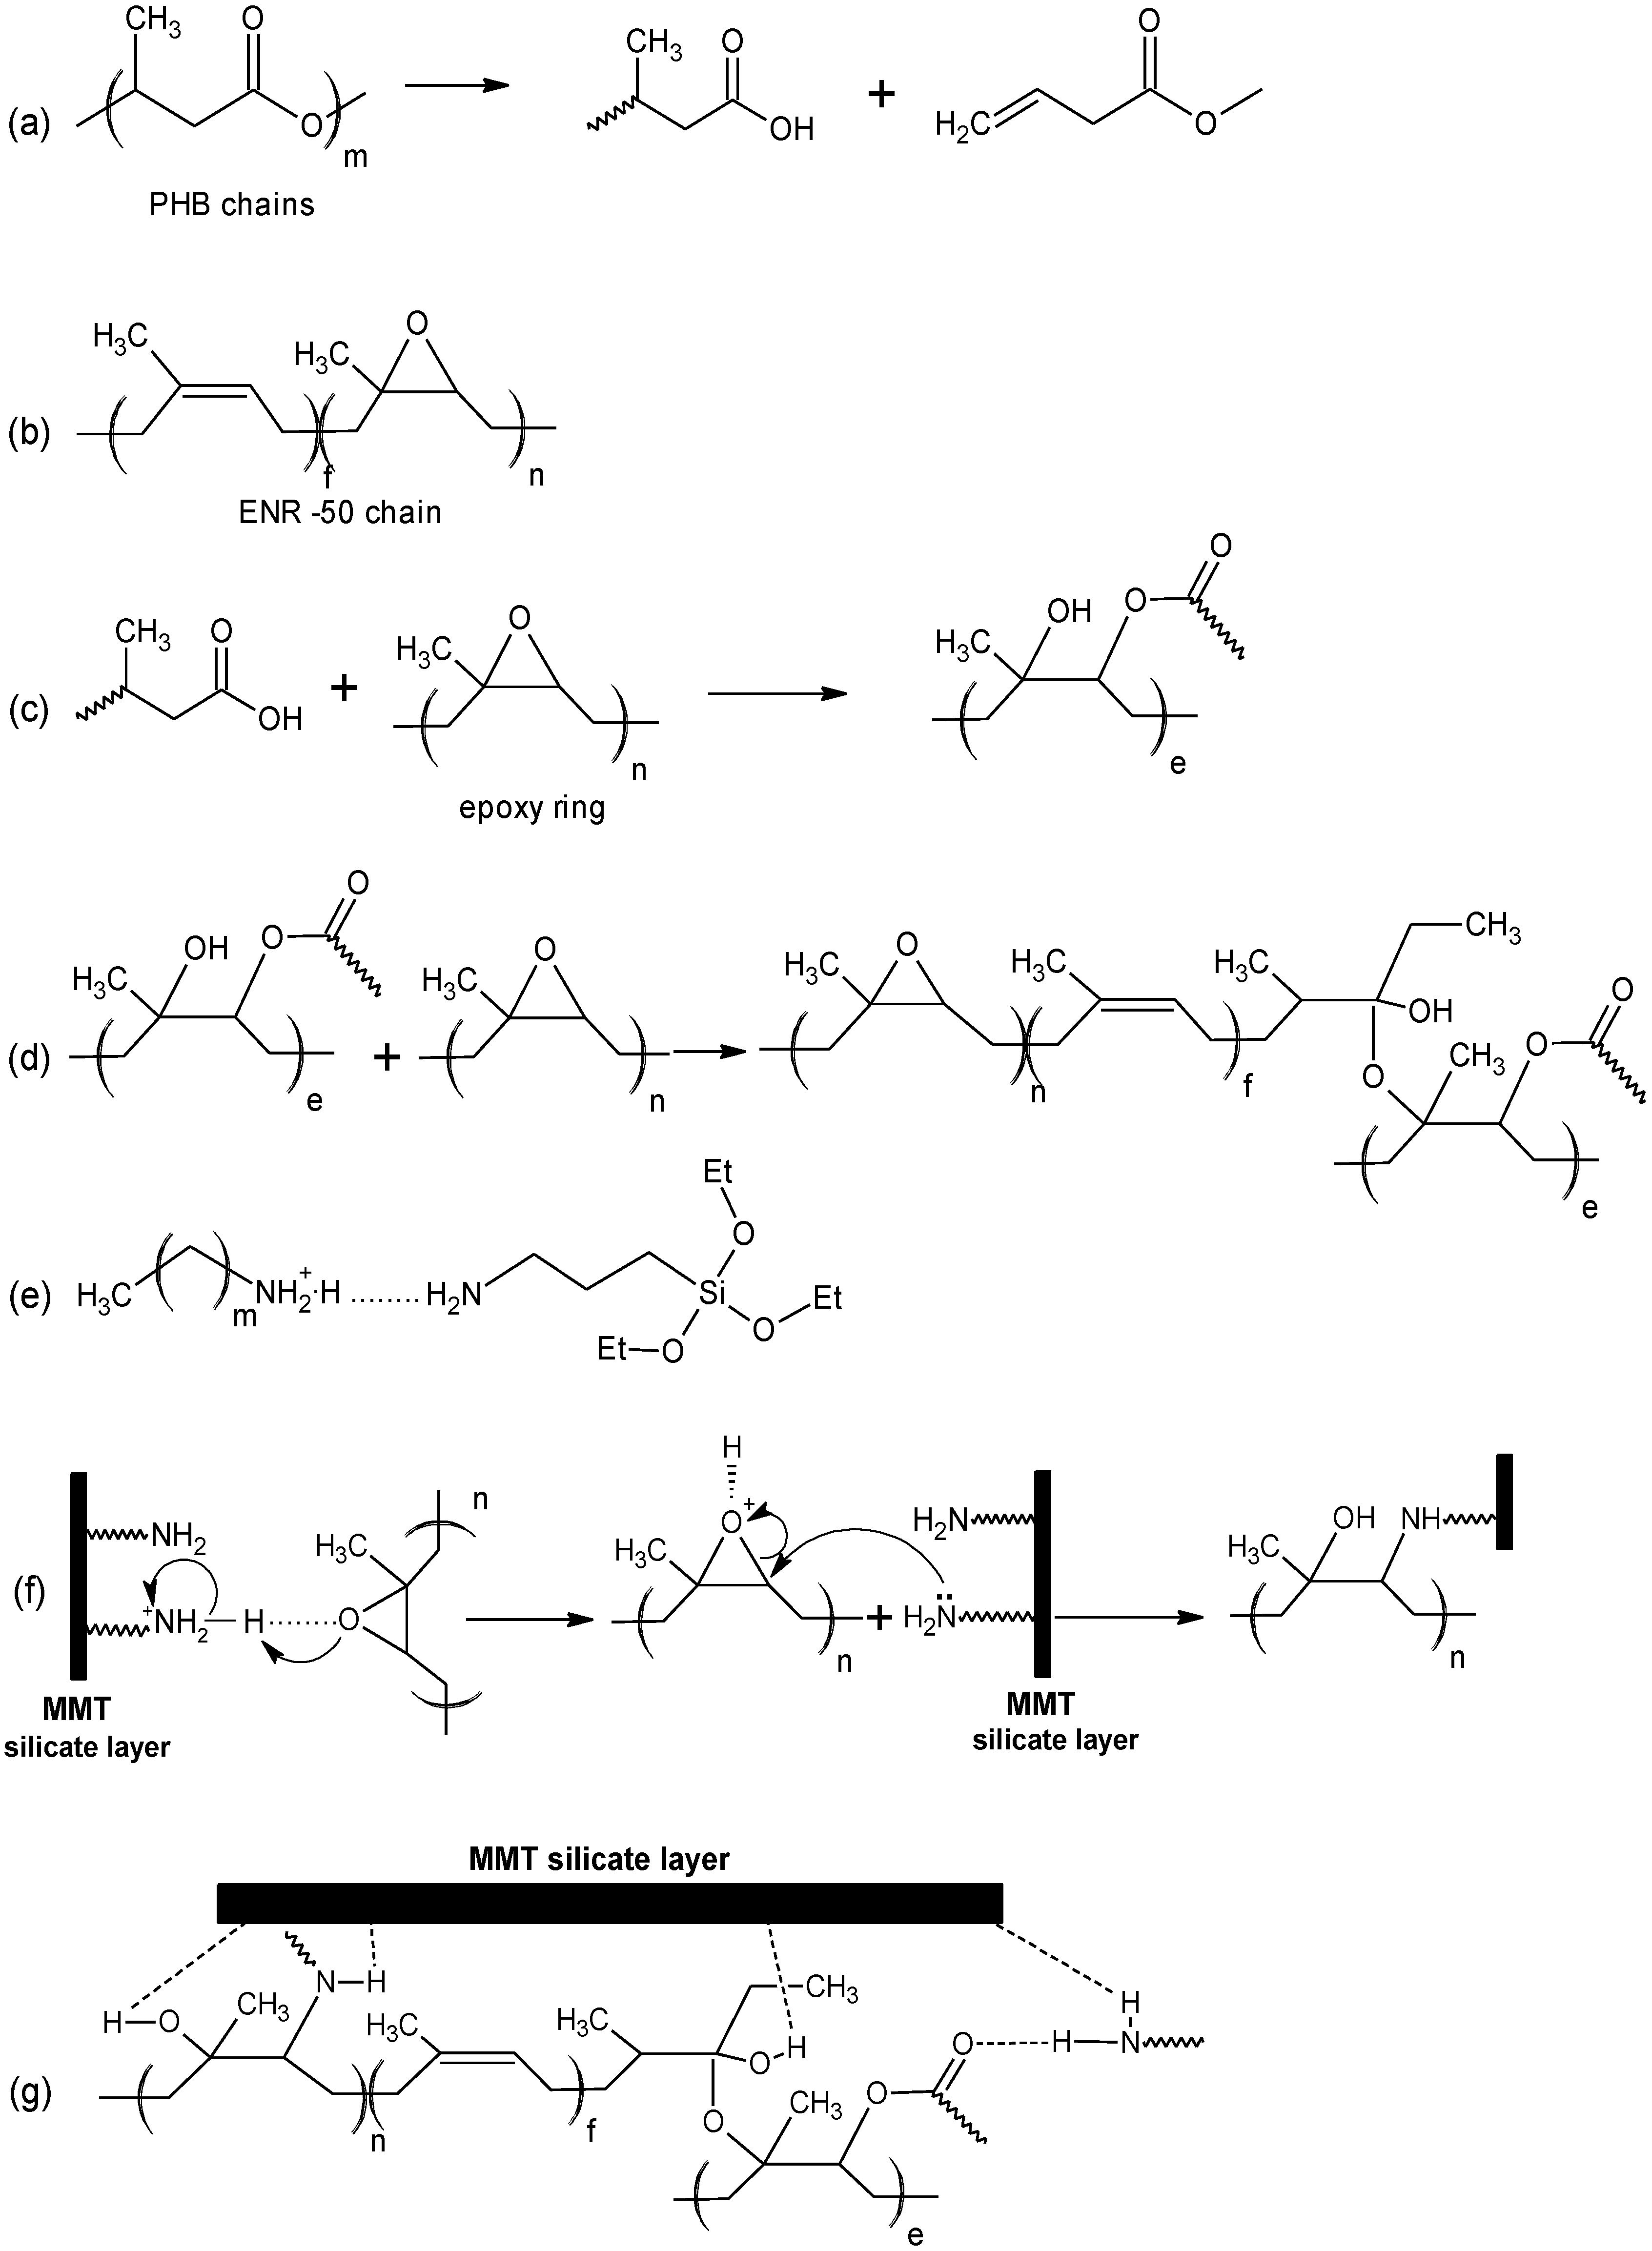
Table 1. On the basis of current FTIR spectra, the proposed reactions and mechanism of formation of the nanohybrids are shown in
Scheme 1.
Figure 4.
FTIR spectra of (a) PHB, (b) ENR-50, (c) PHB/ENR-50 (50/50) blend, (d) ENR/PHB (50/50) blend containing 5 wt% MMT and (e) MMT.
Figure 4.
FTIR spectra of (a) PHB, (b) ENR-50, (c) PHB/ENR-50 (50/50) blend, (d) ENR/PHB (50/50) blend containing 5 wt% MMT and (e) MMT.
In the spectrum of PHB (
Figure 4a), a very strong band at 1723 cm
−1 is due to carbonyl and the –C–O stretching of ester is at 1101 cm
−1. The characteristic –OH stretching band can be observed at 3437 cm
1. This arises due to the chain scission of PHB to shorter chain lengths [
3,
15] creating more carboxyl functionalities as shown in
Scheme 1a.
The spectrum of ENR-50 (
Figure 4b) shows the stretching vibrations of epoxy and half epoxy at 1251 and 875 cm
−1 respectively [
26]. Moreover, a strong absorption band can be observed at 3020 cm
−1 which is due to the –C=CH of isoprene. The structure of ENR is shown in
Scheme 1b.
The spectrum of the equal fraction of PHB/ENR-50 blend (
Figure 4c) shows the –C–O stretching of ester appears at 1100 and 1305 cm
−1. A strong band at 1724 cm
−1 and a weak broad band at 877 cm
−1 are respectively assigned to the carbonyl and epoxy that obviously indicates a different environment in the final blend. The characteristic band of epoxy becomes broad and weak most probably due to the lowering in epoxy content in the final blend caused by epoxy ring opening reactions. It is proposed that the hydroxyl (of carboxyl) of PHB reacts with the epoxy ring by attacking the less hindered carbon of the latter (
Scheme 1c). This can further react with the remaining epoxy to ring open or terminate the reaction (
Scheme 1d). Therefore a new blend structure (or new polymer product) can be assumed which still contains carbonyl and but a lesser number of epoxy ring. The same reaction has been proposed by Lee
et al. [
20] on the basis of melt reaction between two respective immiscible polymers.
Scheme 1.
Proposed mechanism for the formation of PHB/ENR-50/MMT nanohybrid.
Scheme 1.
Proposed mechanism for the formation of PHB/ENR-50/MMT nanohybrid.
Table 1.
FTIR adsorption bands of PHB, ENR-50, PHB/ENR-50 (50/50) blends, the respective nanohybrid containing 5 wt% MMT and MMT.
Table 1.
FTIR adsorption bands of PHB, ENR-50, PHB/ENR-50 (50/50) blends, the respective nanohybrid containing 5 wt% MMT and MMT.
| Functional Group | PHB | ENR–50 | Blend | Nanohybrid | MMT |
|---|
| (CO)–OH | – | – | 3684,3621 | – | – |
| Si–OH | – | – | – | 3616 | 3626 |
| –OH | 3437 | – | 3464 | 3436 | 3428 |
| Free Amine | – | – | – | 3243,3182 | 3265,3175 |
| –C=CH | – | 3020 | 3019 | – | – |
| Methyl | 2976,1378,827 | 2973,1380 | 2977 | 2977–2895 * | – |
| Methylene | 2933,1453 | 2912 | 2935 | 2928–1466 | 2921,1468 |
| Methine | 2876 | 2853 | 2897 | 2856 | 2851 |
| –(O)C=O | 1723 | – | 1724 | 1725 | – |
| –C–O– | 1300,1100 | – | 1305,1100 | – | – |
| Epoxy | – | 1251,875 | 1218,877 | – | – |
| –Si–O | – | – | – | 1100–915 | 1100–915 |
| –C=C– | – | 759,669 | 1602,760,672 | 1667 | – |
| –NH2+ | – | – | – | 1622 | 1618 |
| –NH2+Amine | – | – | – | 1503 | 1503 |
The spectrum of the PHB/ENR-50 (50/50) blend containing 5 wt% of organomodified MMT (
Figure 4d) shows interesting features. Understanding of such a reaction needs apparent knowledge of clay structure after modification. From the spectrum, carbonyl shows a strong band at 1725 cm
−1. The displacement and broadening of carbonyl band as compared to the pristine blend (
Figure 4c) and PHB (
Figure 4a) is most probably due to the H-bonding and the restriction effect of the silicate layers, respectively.
It is logical to assume that the silicate layers of MMT hinder the various polymer chain motions. This is supported by the fact that, nearly all the band intensities decrease as MMT loading is increased [
21]. Furthermore, the disappearance of two characteristic bands of epoxy at 1251 and 875 cm
−1 confirms the epoxy ring opening reaction. The ring opening reaction occurs due to the free amine groups present in the clay structure. The formation of covalent bond via ring opening reaction is shown in
Scheme 1f. In this structure, a new bond –N–C– bond is formed.
Scheme 1g indicates the proposed structure of the new nanohybrid comprising of the reactive polymer blend and organomodified MMT. The structure is also affected through various H–bondings.
In this study, the MMT nanoclay is modified with two organic modifiers containing primary amine groups. Many opinions have been expressed by researchers to explain the reaction of the amine groups with each other and with silicate layers as well [
7]. In the interlayer space within the MMT, the ammonium ions can be generated in two ways; either by cation exchange or by protonation. In the presence of an amine compound, an ammonium-amine association can be obtained [
7]. The spectrum of MMT (
Figure 4e) confirms the ammonium-amine complex formation with the apprearence of a band at 1503 cm
−1. There are two adsorption bands in the 3265 and 3175 cm
−1 region attributed to the –NH stretching vibration.
Scheme 1e depicts the formation of ammonium-amine complex between octadecyl ammonium cation and aminopropyltriethoxysilane [
7]. The extent of the reaction is highly dependent to the amount of the organic components present and from the spectrum there are still some free amines remaining after the reaction.
2.3. Thermal Behavior
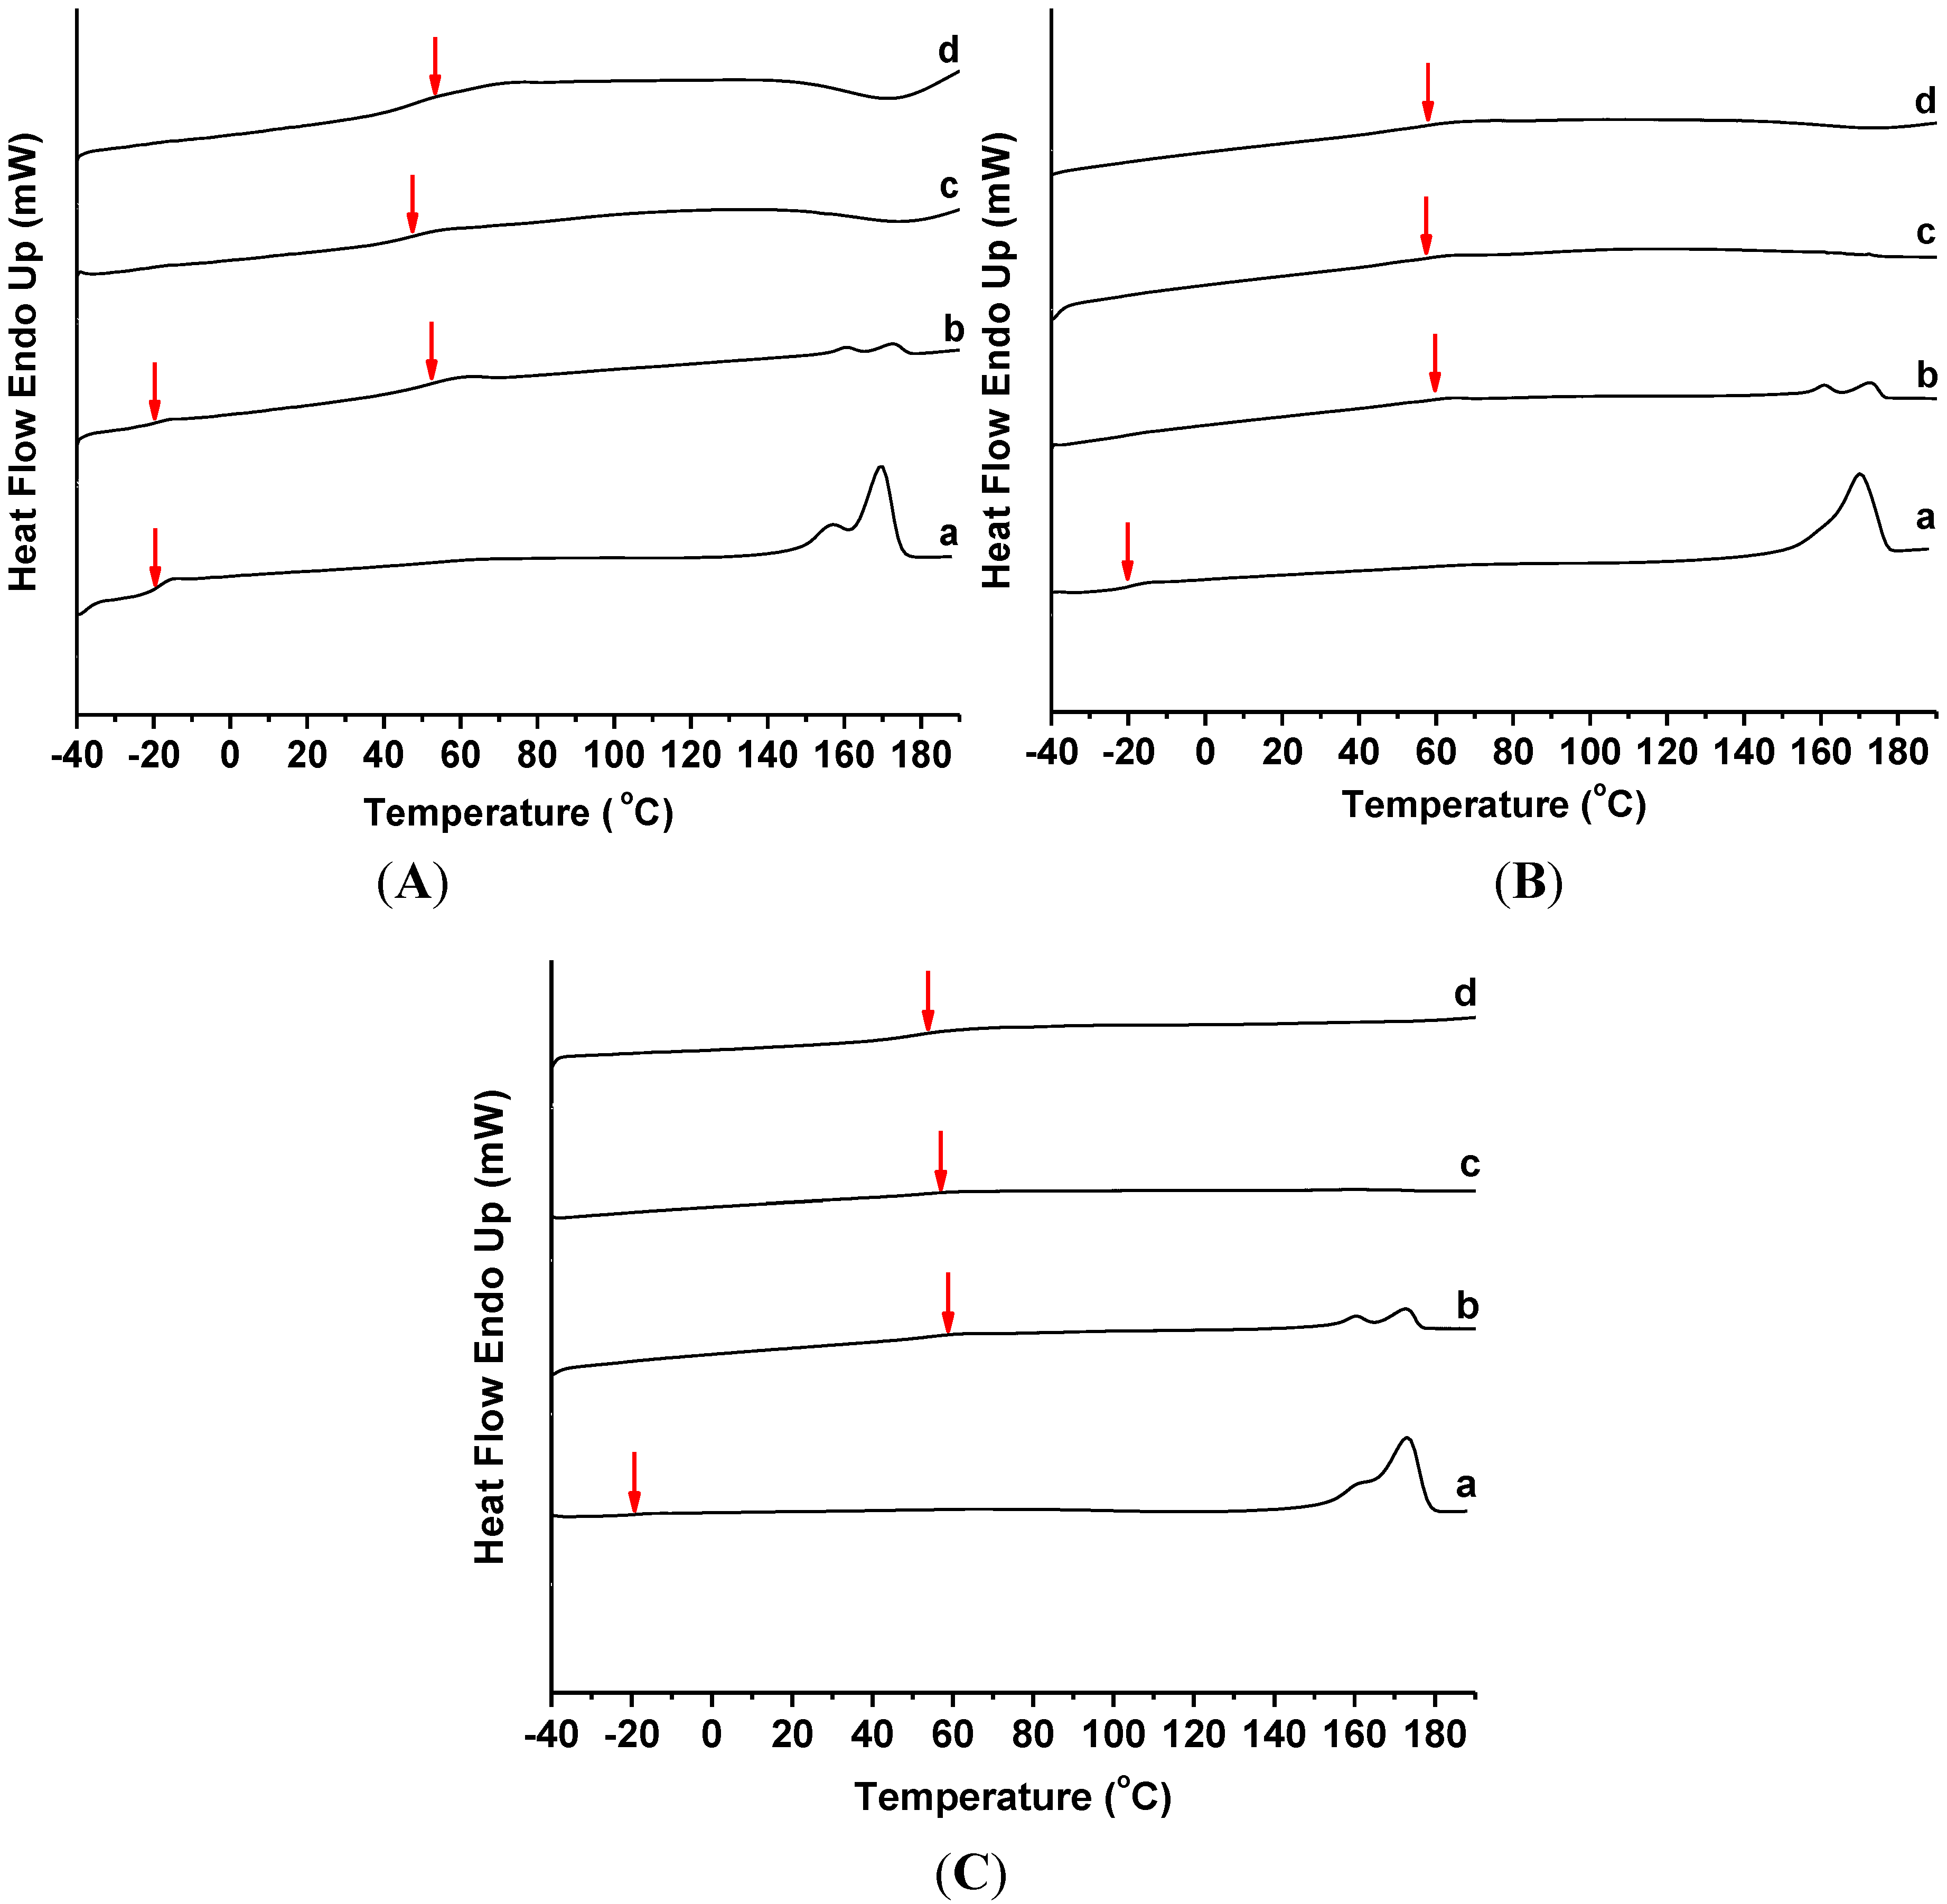
Figure 5 exhibits the DSC profiles of the various PHB/ENR-50 blends containing 0, 1, 3 and 5 wt% MMT based on the first thermal/heating program and the results are summarized in
Table 2. The double melting endotherms of PHB/ENR-50 blends as observed in
Figure 5A–C(a) are due to polymorphism of PHB. Increasing the fraction of ENR-50 in the blends caused the melting temperature (
Tm) and enthalpy of melting (∆
Hm) to decrease. As shown in
Table 2, addition of 1 wt% MMT to the blend also caused the
Tm to decrease. However, further addition of MMT (
i.e., 3 and 5 wt%), caused these two corresponding temperature peaks to disappear. This is presumably due to the alteration in the PHB crystal structure by the increase presence of MMT.
The glass transition temperature (
Tg) of ENR-50 can be observed in the various PHB/ENR-50 blend compositions. These are assigned as
Tg1 in
Table 2. The second
Tg (
Tg2) is due to the glass transition temperature of organomodified montmorillonite.
Figure 5.
DSC thermograms (first heating program) of PHB/ENR-50 blend composition of (A) 30/70; (B) 50/50; and (C) 70/30 containing (a) 0, (b) 1, (c) 3, and (d) 5 wt% MMT.
Figure 5.
DSC thermograms (first heating program) of PHB/ENR-50 blend composition of (A) 30/70; (B) 50/50; and (C) 70/30 containing (a) 0, (b) 1, (c) 3, and (d) 5 wt% MMT.
Table 2.
Thermal transition (DSC) and thermal decomposition (TG-DTG) data of PHB/ENR-50 (30/70, 50/50 and 70/30) blends and respective nanohybrids containing 1, 3 and 5 wt% MMT.
Table 2.
Thermal transition (DSC) and thermal decomposition (TG-DTG) data of PHB/ENR-50 (30/70, 50/50 and 70/30) blends and respective nanohybrids containing 1, 3 and 5 wt% MMT.
| PHB/ENR-50 composition | Clay content (wt%) | DSC * | TG-DTG ** |
|---|
| Tg1 (°C) | Tg2 (°C) | Tm (°C) | ∆Hm (J/g) | T10 (°C) | T20 (°C) | T30 (°C) | Tmax1 (°C) | Tmax2 (°C) |
|---|
| 30/70 | 0 | −18.1 | – | 169.6 | 25.8 | 255.6 | 281.5 | 370.4 | 280.9 | 433.1 |
| 1 | −18.8 | 53.5 | 172.4 | 4.1 | 270.4 | 318.5 | 366.7 | 332.8 | 438.2 |
| 3 | – | 49.3 | – | – | 296.3 | 366.7 | 403.7 | 310.9 | 432.7 |
| 5 | – | 60.0 | – | – | 314.8 | 377.8 | 414.8 | 291.0 | 430.7 |
| 50/50 | 0 | −17.7 | – | 170.2 | 37.5 | 248.2 | 259.3 | 270.4 | 279.1 | 437.8 |
| 1 | – | 60.7 | 172.4 | 9.1 | 266.7 | 281.5 | 307.4 | 313.9 | 431.5 |
| 3 | – | 57.3 | – | – | 274.1 | 340.7 | 388.9 | 300.0 | 429.5 |
| 5 | – | 58.6 | – | – | 285.2 | 388.9 | 425.9 | 294.4 | 441.0 |
| 70/30 | 0 | −19.3 | – | 173.1 | 53.7 | 235.2 | 242.6 | 248.2 | 276.9 | 414.2 |
| 1 | – | 58.0 | 172.8 | 18.3 | 281.5 | 292.6 | 300.0 | 303.6 | 446.7 |
| 3 | – | 57.4 | 170.0 | 1.9 | 274.1 | 296.3 | 377.8 | 297.9 | 438.7 |
| 5 | – | 54.3 | – | – | 266.7 | 355.6 | 407.4 | 284.1 | 429.5 |
Figure 5A shows the DSC thermograms of 30/70 PHB/ENR-50 blend containing 1, 3 and 5 wt% MMT. Increasing the MMT content increased the second
Tg (
Tg2). However, the trend is not linear. This is because the affinity of interactions between polymers and organoclay. However, in PHB/ENR-50 blends comprising equal or reduce fraction of ENR-50 (
i.e., 50/50 and 70/30) with similar MMT organoclay content (
Figure 5B,C), the
Tg2 was displaced to a lower temperature. This is due to the reduced ENR-50/MMT organoclay interactions coupled with lower affinity of PHB towards MMT.
It seems that in the blends with higher composition of PHB, the organomodified nanoclay imparted catalytic effect [
21] and barrier effect is dominant in the blends with higher ENR-50 [
22]. Therefore, the
Tg2 decreases and allows the polymer to achieve the rubbery state at a lower temperature.
In this work, all of the PHB/ENR-50/MMT nanohybrid thermograms showed a single
Tg except the PHB/ENR-50 (30/70) containing 1 wt% MMT. In fact, the
Tg is a function of miscibility of the polymers and the extent of reaction of the blend components can therefore be deduced on the basis of
Tg. Previous study on PHB/ENR-50 blends [
19] have shown that various compositions of blend compartments exhibit different extent of miscibility.
2.4. Thermal Decomposition
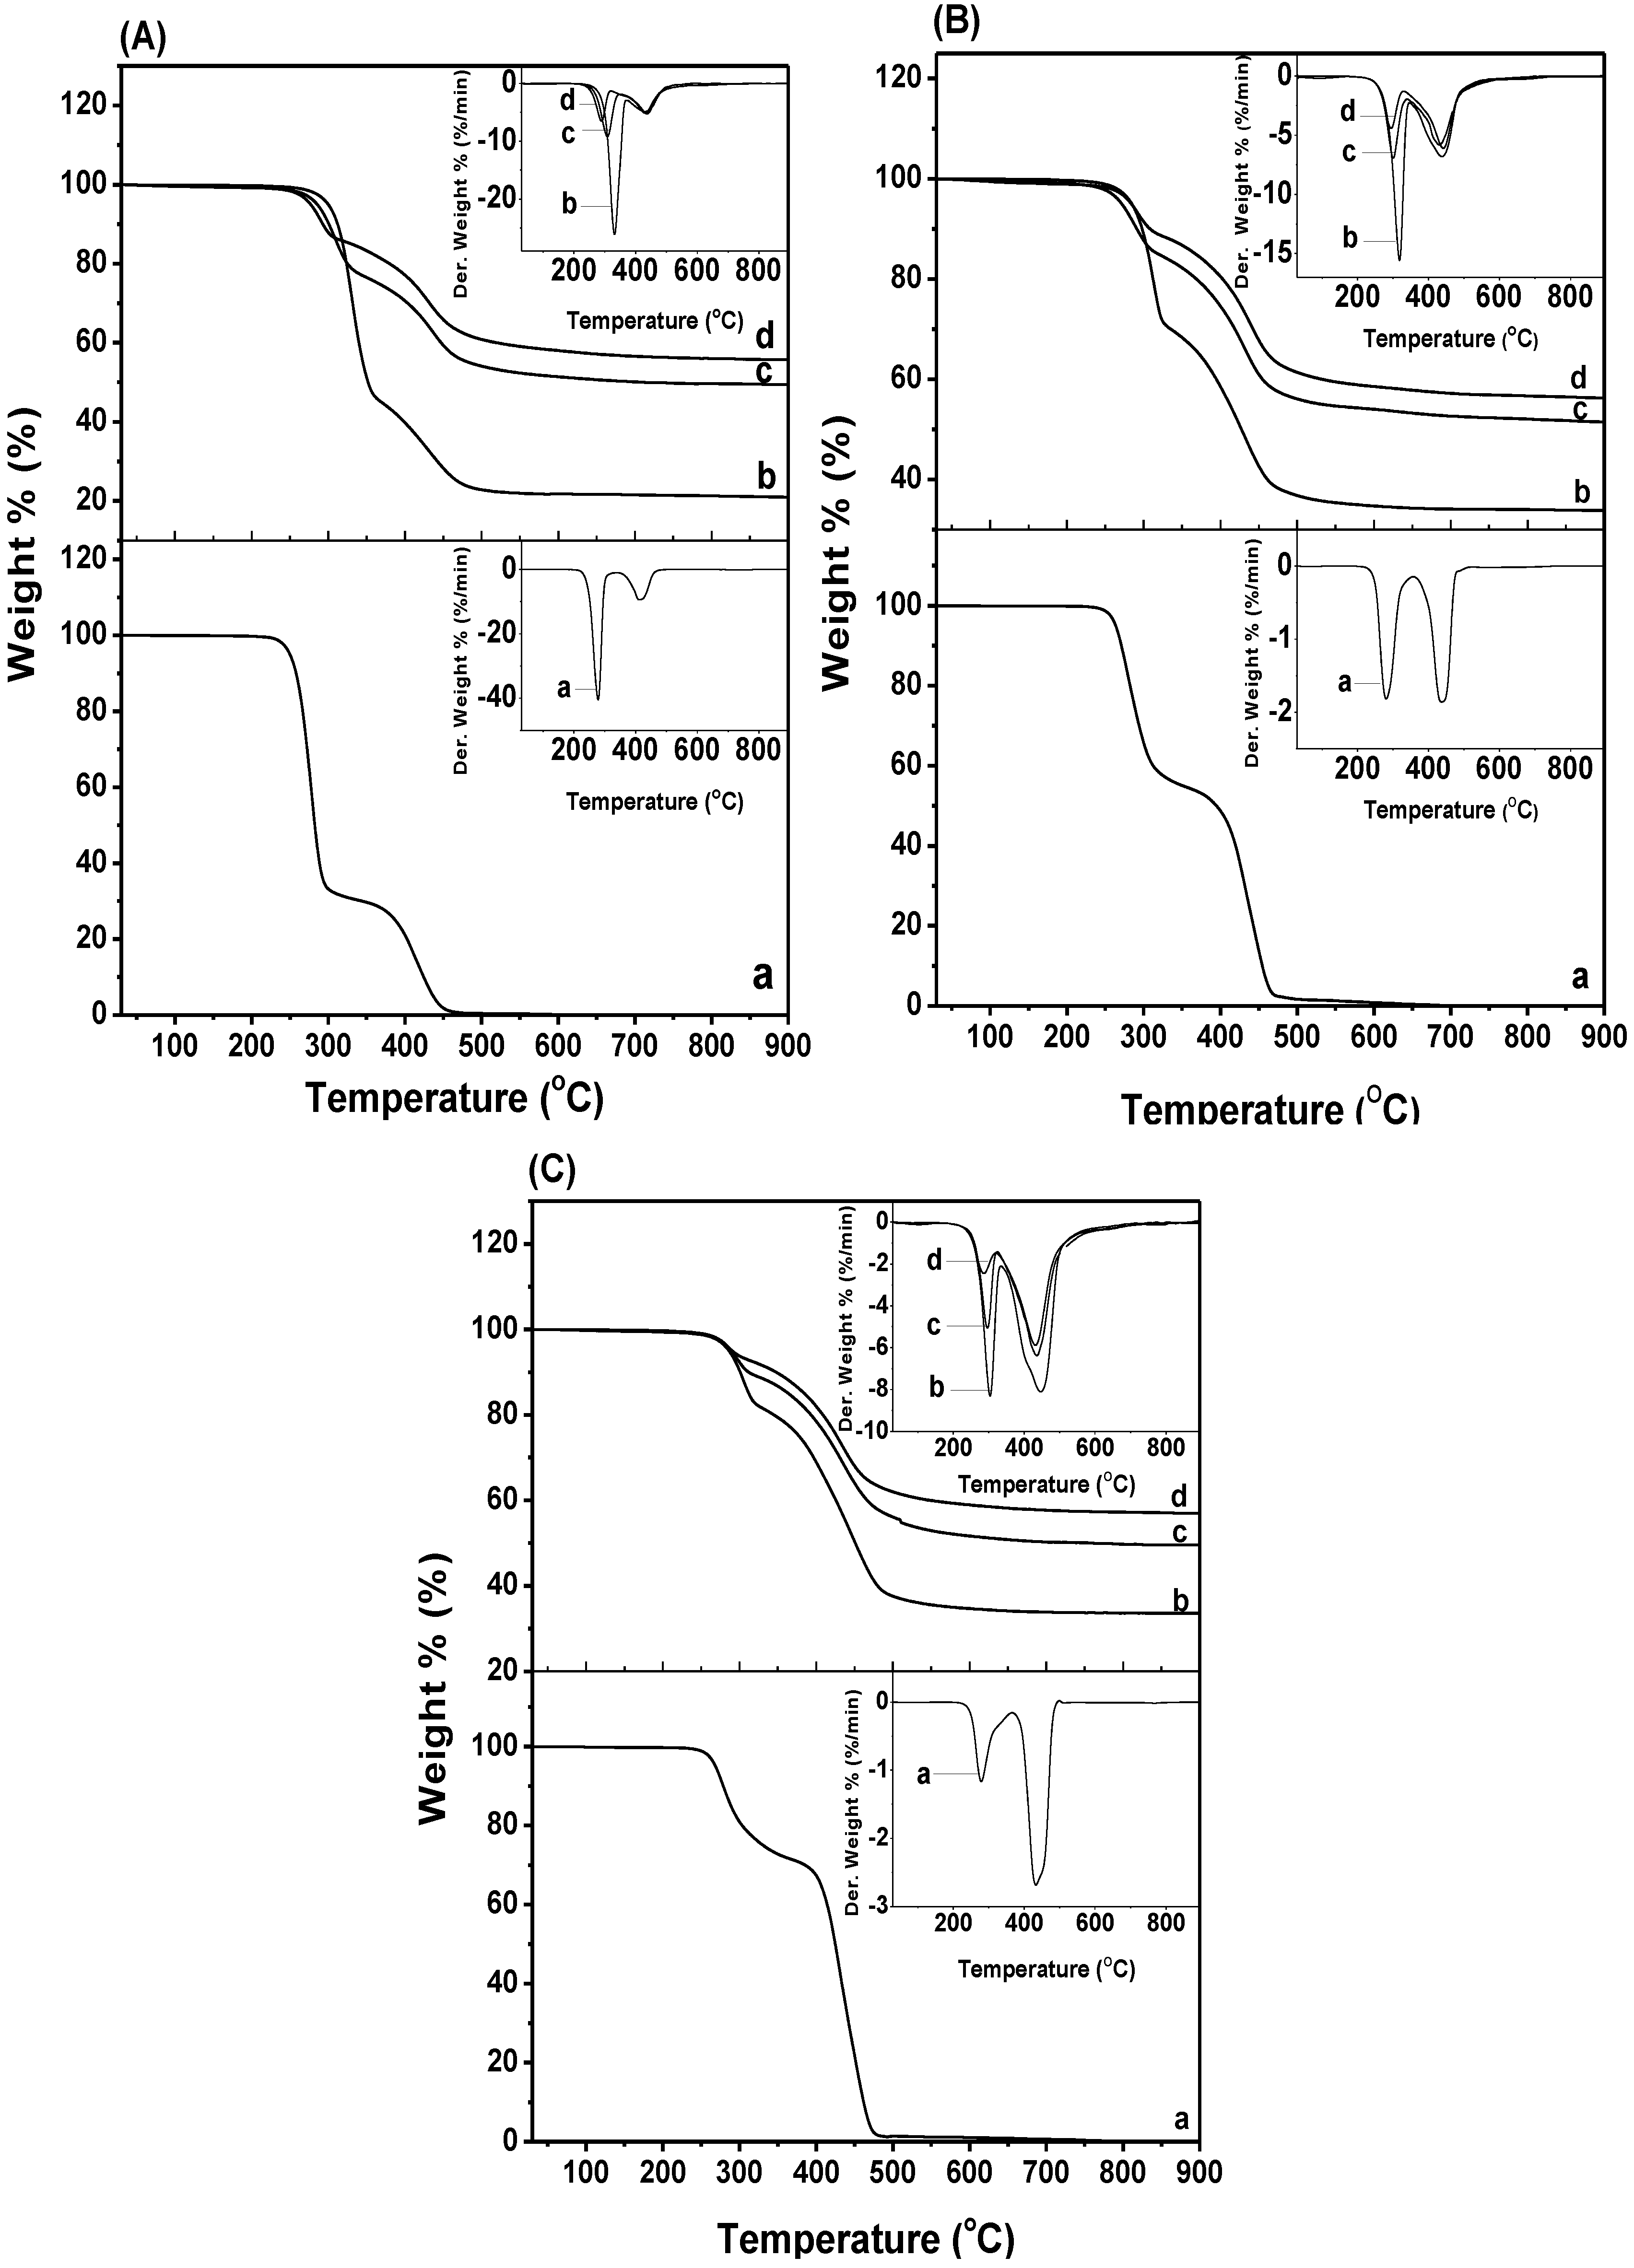
Thermal decomposition profiles of the various PHB/ENR-50 blends and the respective blend/MMT nanohybrids are shown in
Figure 6. Their respective decomposition temperatures are tabulated in
Table 2. In the pristine blends (
Figure 6A–C(a)), upon increasing the ENR-50, the first (
Tmax1) and second (
Tmax2) maximum were slightly displaced. It is obvious that the
Tmax2 of 50/50 PHB/ENR-50 blend are shifted to the higher temperature as compared to the blends with a composition of 70/30 and 30/70. The higher displacement of
Tmax can be due to the better dispersion of the PHB and ENR-50 in this composition. It must be mentioned that the thermal decomposition of pristine PHB and ENR-50 occurs in single stage at 288.8 °C and 418.8 °C, respectively [
21,
22].
Figure 6.
TG-DTG curves of PHB/ENR-50 blend composition of (A) 70/30; (B) 50/50; and (C) 30/70 containing (a) 0, (b) 1, (c) 3, and (d) 5 wt% MMT.
Figure 6.
TG-DTG curves of PHB/ENR-50 blend composition of (A) 70/30; (B) 50/50; and (C) 30/70 containing (a) 0, (b) 1, (c) 3, and (d) 5 wt% MMT.
Increasing the MMT content in various PHB/ENR-50 blends caused the degradation temperatures at 10%, 20% and 30% mass loss to shift to higher temperatures. The degradation temperatures of the nanohybrids are higher than the polymer blends itself and can be attributed to the barrier effect of MMT which inhibits heat transfer to the polymer blends. This is true for all the series studied except for the hybrid comprising of low fraction of ENR-50 (
i.e., 70/30 PHB/ENR-50;
Figure 6A). Here at 10% mass loss, a decrease in the degradation temperature as the MMT content is increased from 1–5 wt% is observed. This variation in trend can only be explained as due to the fact that MMT promotes catalytic decomposition of PHB in the samples [
27].
Another observation is that two
Tmax occur in all the hybrid samples and are tabulated in
Table 2. The
Tmax1 is due to the PHB while the
Tmax2 is attributed to the decomposition of ENR-50. The
Tmax values decrease upon increase in MMT content from 1 to 5 wt% for all the series investigated except the
Tmax2 of the hybrid comprising 50/50 PHB/ENR-50 with 5 wt% MMT. The exceptional
Tmax2 value for the hybrid comprising of 50/50 PHB/ENR-50 and 5 wt% MMT content can be explained as due to the agglomeration of MMT particles.
Nonetheless, all the
Tmax values are superior as compared to the pristine PHB/ENR-50 blends. Generally, the decrease in
Tmax value upon increase in the MMT content in the hybrid is due to the catalytic effect of Lewis acid sites in the MMT [
28]. In the thermal treatment, the organomodifiers viz. alkyl ammonium salts, the ammonium cation degraded to olefin and amine. As a result, the available proton(s) impart catalytic effect during the initial stages of PHB decomposition and this is more apparent at high MMT loading [
29]. It is therefore obvious that the decomposition temperature of the nanohybrids is much higher than respective pristine polymer blends. This improvement of thermal properties can be attributed to the production of a new compound that arises from proper reaction between the components.
Degree of delamination and dispersion can affect the thermal enhancement. Optimized processing conditions and proper polymer-clay interaction are two important factors affecting delamination and dispersion. Hence, the extent of interaction/reaction between polymer and clay layers either through the hydrogen bond or covalent bond formation contributes to this enhancement. These are shown in
Scheme 1. It was proposed that the amine group presence on the surface of montmorillonite can form covalent bond. This occurs over the formation of –N–C– bond over the ring opening of epoxy groups thus creating the nanohybrid.
It is noted that upon increasing the MMT content in the samples, the ash content increase gradually. Here, the majority of organic compound decompose up to ~600 °C. At 900 °C, the char yields of the sample containing higher amount of MMT achieve higher value than that of the blend. The residue is mainly from inorganic MMT and components like Al2O3, MgO, and SiO2.

