Article

Preparation, Surface and Pore Structure of High Surface Area Activated Carbon Fibers from Bamboo by Steam Activation

Department of Wood Science and Technology, Tianjin University of Science & Technology, Tianjin 300222, China
*
Author to whom correspondence should be addressed.
Materials 2014, 7(6), 4431-4441; https://doi.org/10.3390/ma7064431
Submission received: 5 February 2014 / Revised: 19 May 2014 / Accepted: 28 May 2014 / Published: 12 June 2014
(This article belongs to the Section Porous Materials)

Abstract

:
High surface area activated carbon fibers (ACF) have been prepared from bamboo by steam activation after liquefaction and curing. The influences of activation temperature on the microstructure, surface area and porosity were investigated. The results showed that ACF from bamboo at 850 °C have the maximum iodine and methylene blue adsorption values. Aside from the graphitic carbon, phenolic and carbonyl groups were the predominant functions on the surface of activated carbon fiber from bamboo. The prepared ACF from bamboo were found to be mainly type I of isotherm, but the mesoporosity presented an increasing trend after 700 °C. The surface area and micropore volume of samples, which were determined by application of the Brunauer-Emmett-Teller (BET) and t-plot methods, were as high as 2024 m2/g and 0.569 cm3/g, respectively. It was also found that the higher activation temperature produced the more ordered microcrystalline structure of ACF from bamboo.

1. Introduction

Activated carbon fibers (ACFs) are relatively novel fibrous adsorbents that show important advantages with respect to conventional activated carbons due to the easily handled and the faster adsorption kinetics. Thus, it has a high adsorption capacity for pollutants such as methylene blue, phenolic compound, lead ions and vapors of some volatile organic compounds [1]. Most ACFs have been synthesized from precursors based on the fossil fuels. The shortage of these resources necessitates an improvement in ACFs production which highly depends on chemicals [2,3,4]. Therefore, it is necessary to find cheap and renewable new types of precursors. In recent years, growing research interest has been focused on various natural materials, which can be used for the production of ACFs with high adsorption capacity. Some of the natural materials include Kenaf [5], cotton stalk [6], coconut shell [7], wood [8,9] and paper [10]. However, limited reports were found using bamboo as raw materials for the preparation of high surface ACFs, except activated carbon [11,12,13,14].
Biomass is an abundant and renewable carbon source with many ecological advantages. Moreover, bamboo is readily available and a fast growing resource which offers great potential application as an alternative to wood. Bamboo is mainly composed of cellulose, lignin and hemicellulose. However, cellulose fibers from bamboo are too short for the texture production [15], which is the main purpose of ACFs. As a result, it is important to study the potential of bamboo fiber as ACFs precursor. Liquefaction technique can completely convert wood or bamboo into useful liquid chemical raw [16,17,18], which greatly improves the utilization of these materials, and provides a new method for the preparation of bamboo based ACFs. Moreover, some studies have reported the preparation of carbon fibers from liquefied wood instead of fossil fuels [19,20].
In the present study, ACF prepared from bamboo (BACFs) were obtained by steam physical activation after liquefaction and curing. The influences of activation temperature on the pore structure (specific surface area, pore volume, and pore size distribution) were examined. In addition, the microstructure and the surface chemistry of the BACFs were investigated. The adsorption performance of BACFs, the iodine and methylene blue (MB) adsorption of BACFs under different activation temperatures were also studied.

2. Results and Discussion

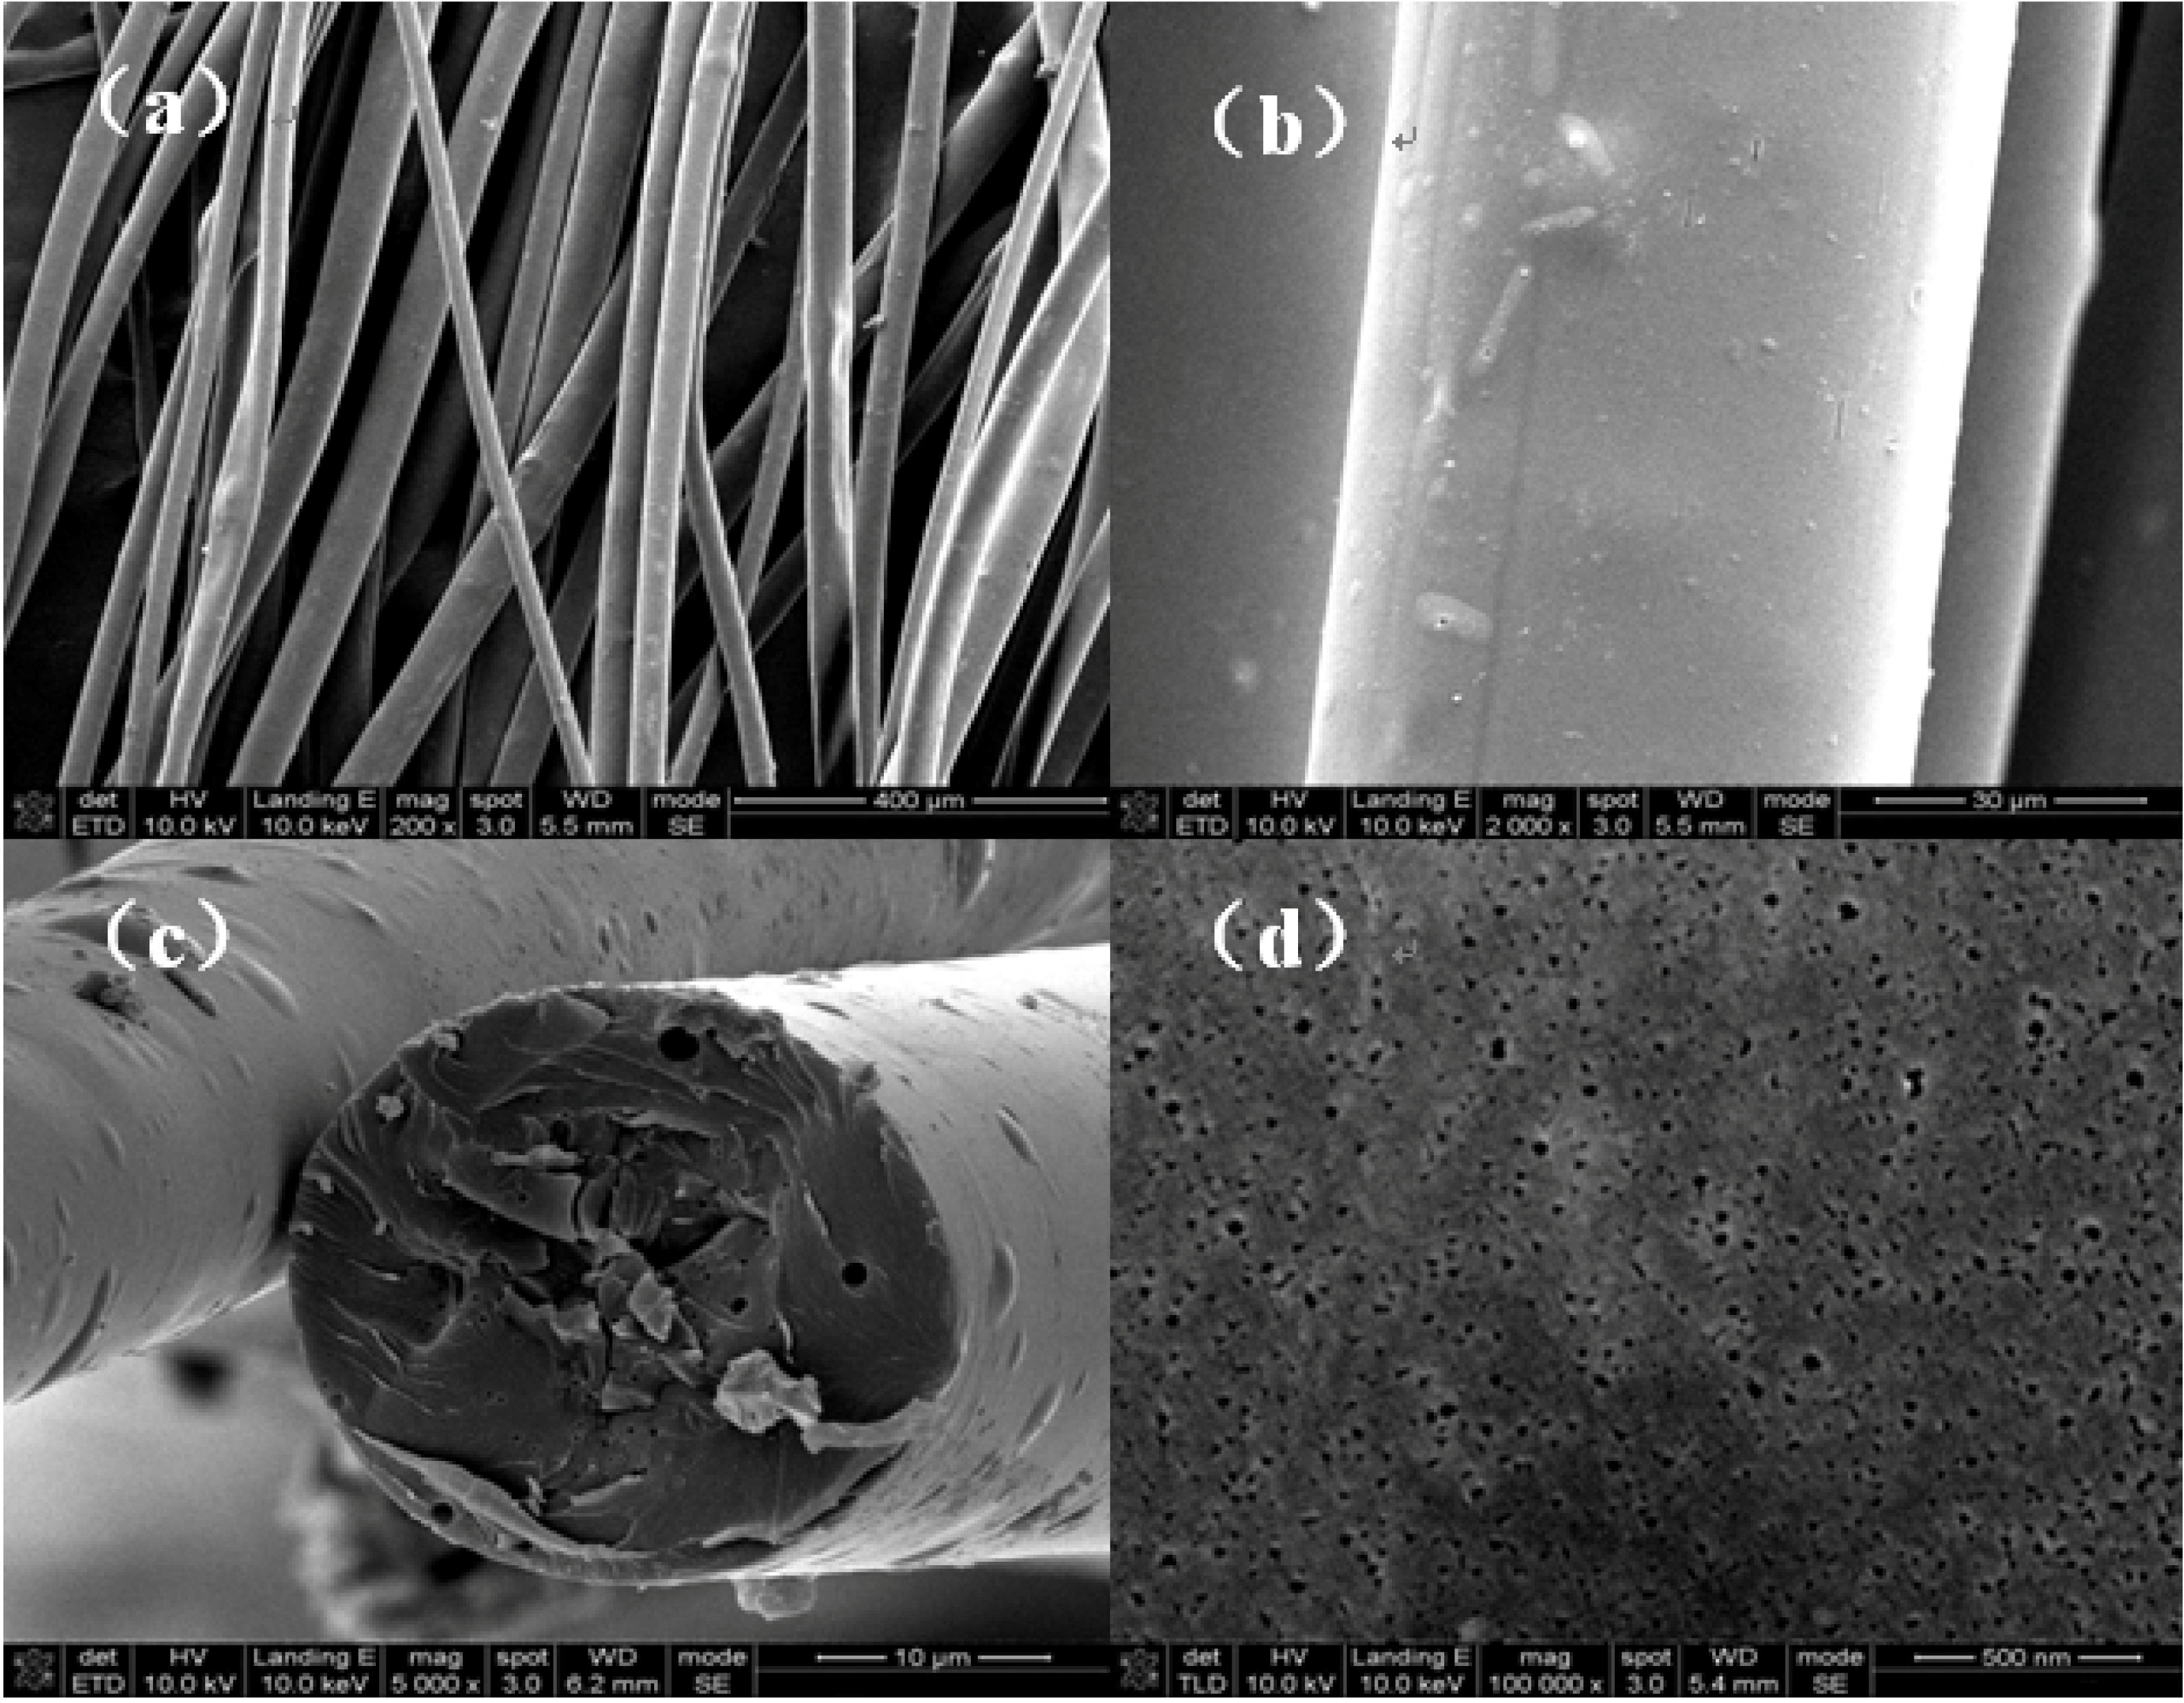
2.1. Morphological Characteristics of BACFs

SEM micrographs of BACFs are shown in Figure 1. From these figures it is clear that the rough surfaces of BACFs can be easily detected as knots and bubbles (see Figure 1a,b). Because of the different crosslinkage degree during curing treatment, there are a loose core and a denser edge of fiber cross-section, resulting in the appearance of skin-core structure. Moreover, many pores are observed in the cross section (see Figure 1c), due to gas caused in the process of synthesis of spinning solution. In addition, more developed pore structure can be observed on the surface of BACFs at 850 °C (see Figure 1d).

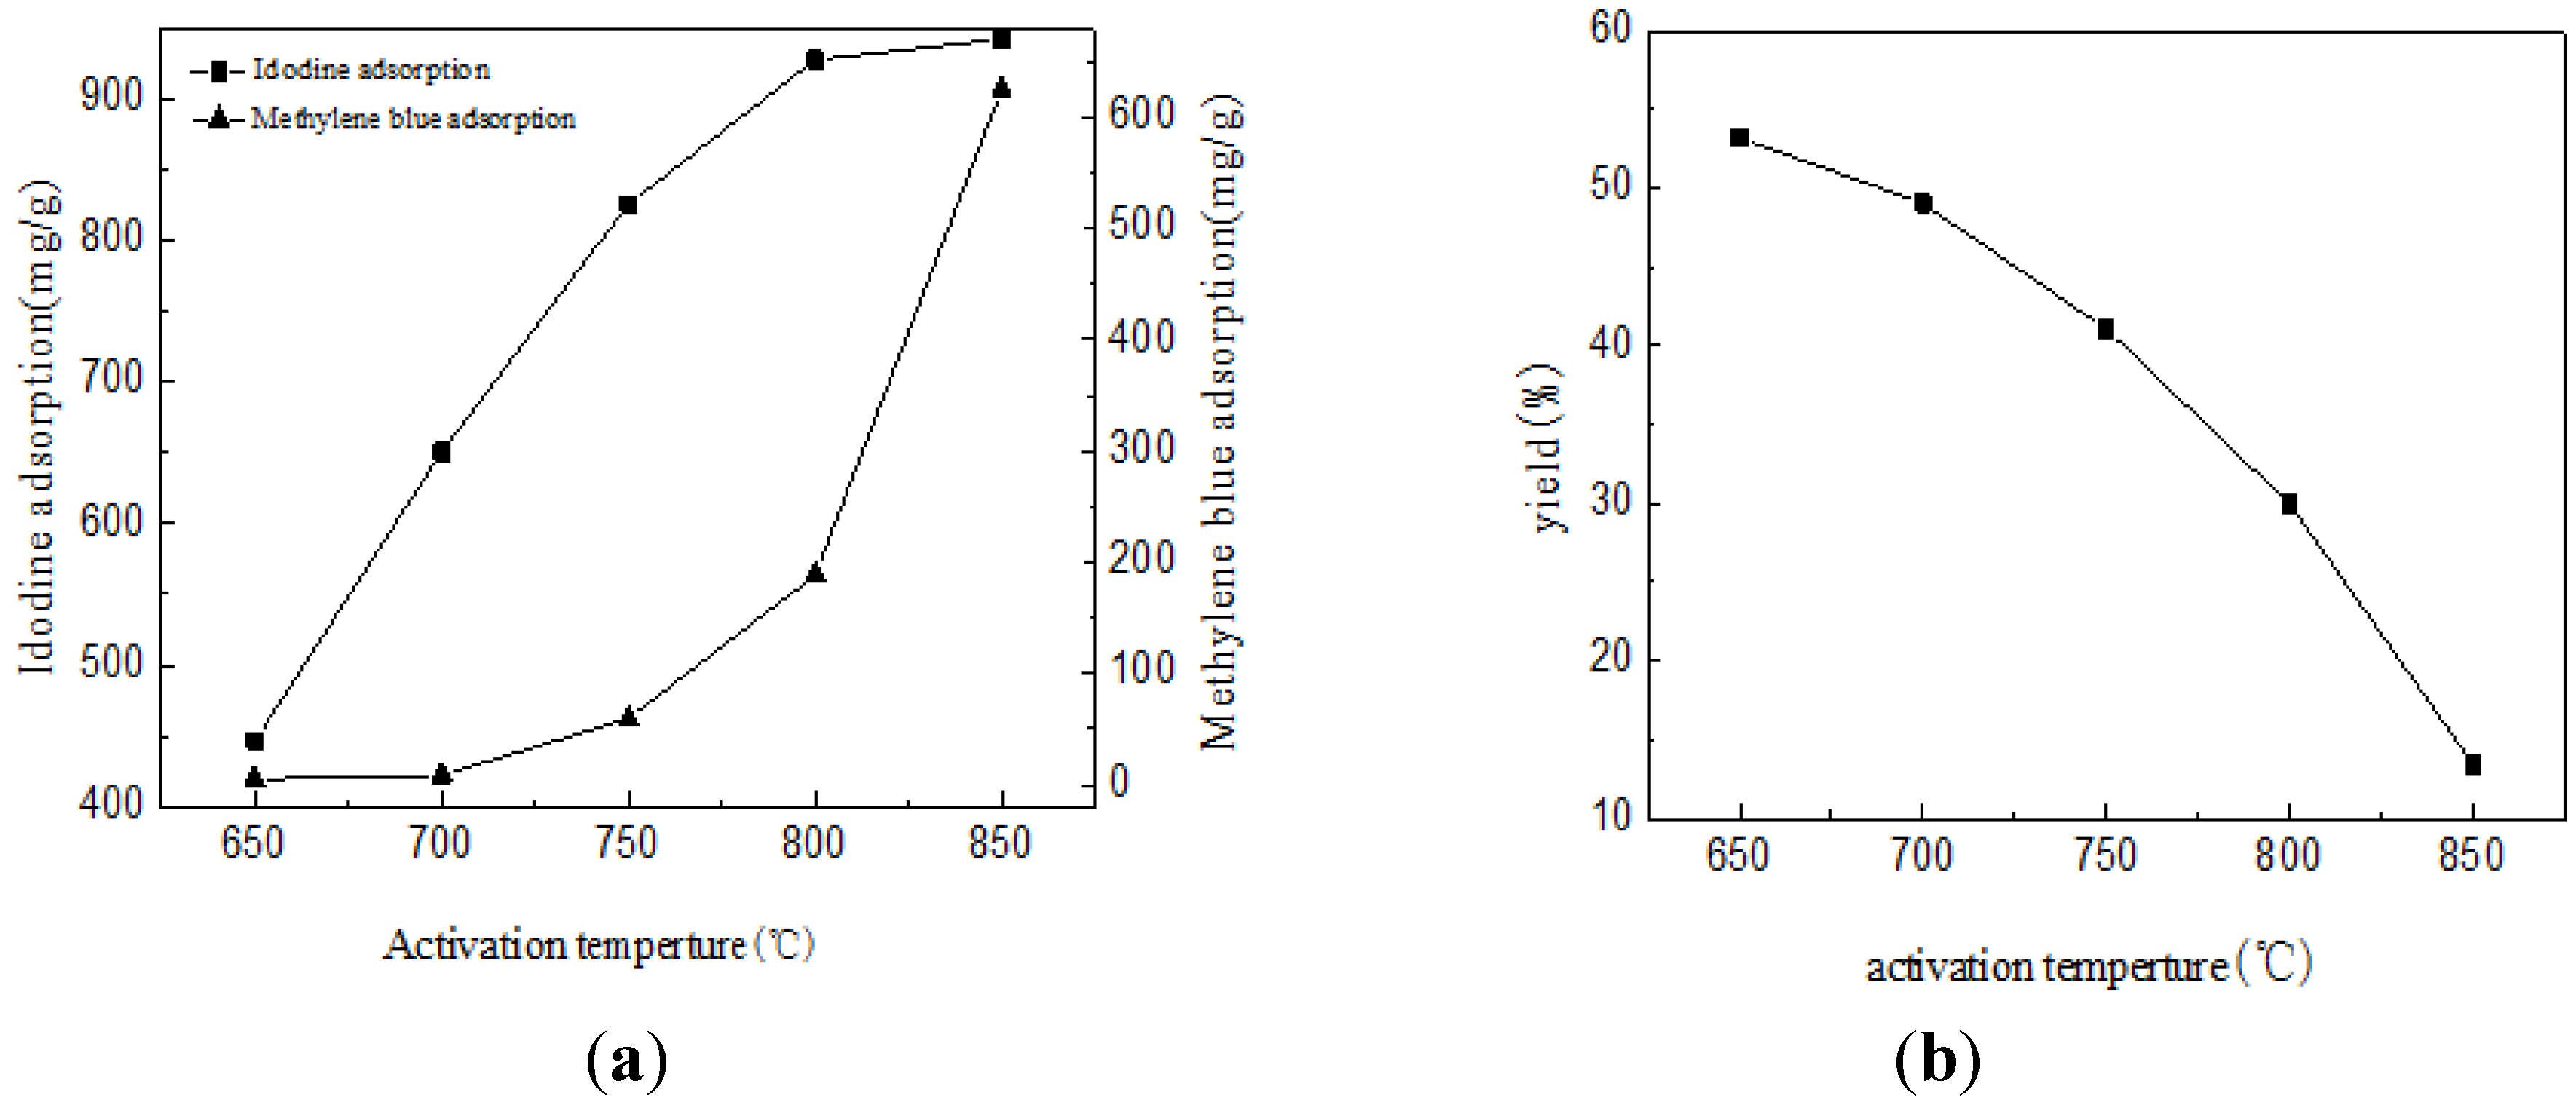
2.2. The Iodine, MB Adsorption and Yield Rate of BACFs

Figure 2 shows the iodine, MB adsorption and yield rate curve of BACFs under different activation temperatures. As can be seen, BACFs showed higher adsorption capacities, which increased with the rise of the activation temperature. The iodine adsorption values of BACFs increased more significantly than MB adsorption values in the activation temperature range of 650–800 °C, while the opposite trend can be observed over 800 °C. This implies that the pore size distributions of BACFs have significantly changed with the increasing of activation temperature, resulting on the more amounts of mesopores and macropores. Enhanced adsorption of methylene blue that benefited from the addition of mesopores has also been reported [21,22]. The iodine and MB adsorption values of BACFs at 850 °C are 942 mg/g and 626 mg/g, respectively. As seen in Figure 2, with increased activation temperature, the yield rate of BACFs gradually decreases. The yield rate of BACFs at 850 °C is 13.42%. It is also clear that the porous structure of BACFs could be obtained by improving the activation temperature, but the cost is high due to the low yield.
Figure 1. SEM micrographs of activated carbon fibers prepared from bamboo (BACFs): (a) and (b) side surface; (c) cross section; (d) side surface.
Materials 07 04431 g001
Figure 2. The iodine, methylene blue (MB) (a) adsorption and (b) yield of BACFs.
Materials 07 04431 g002

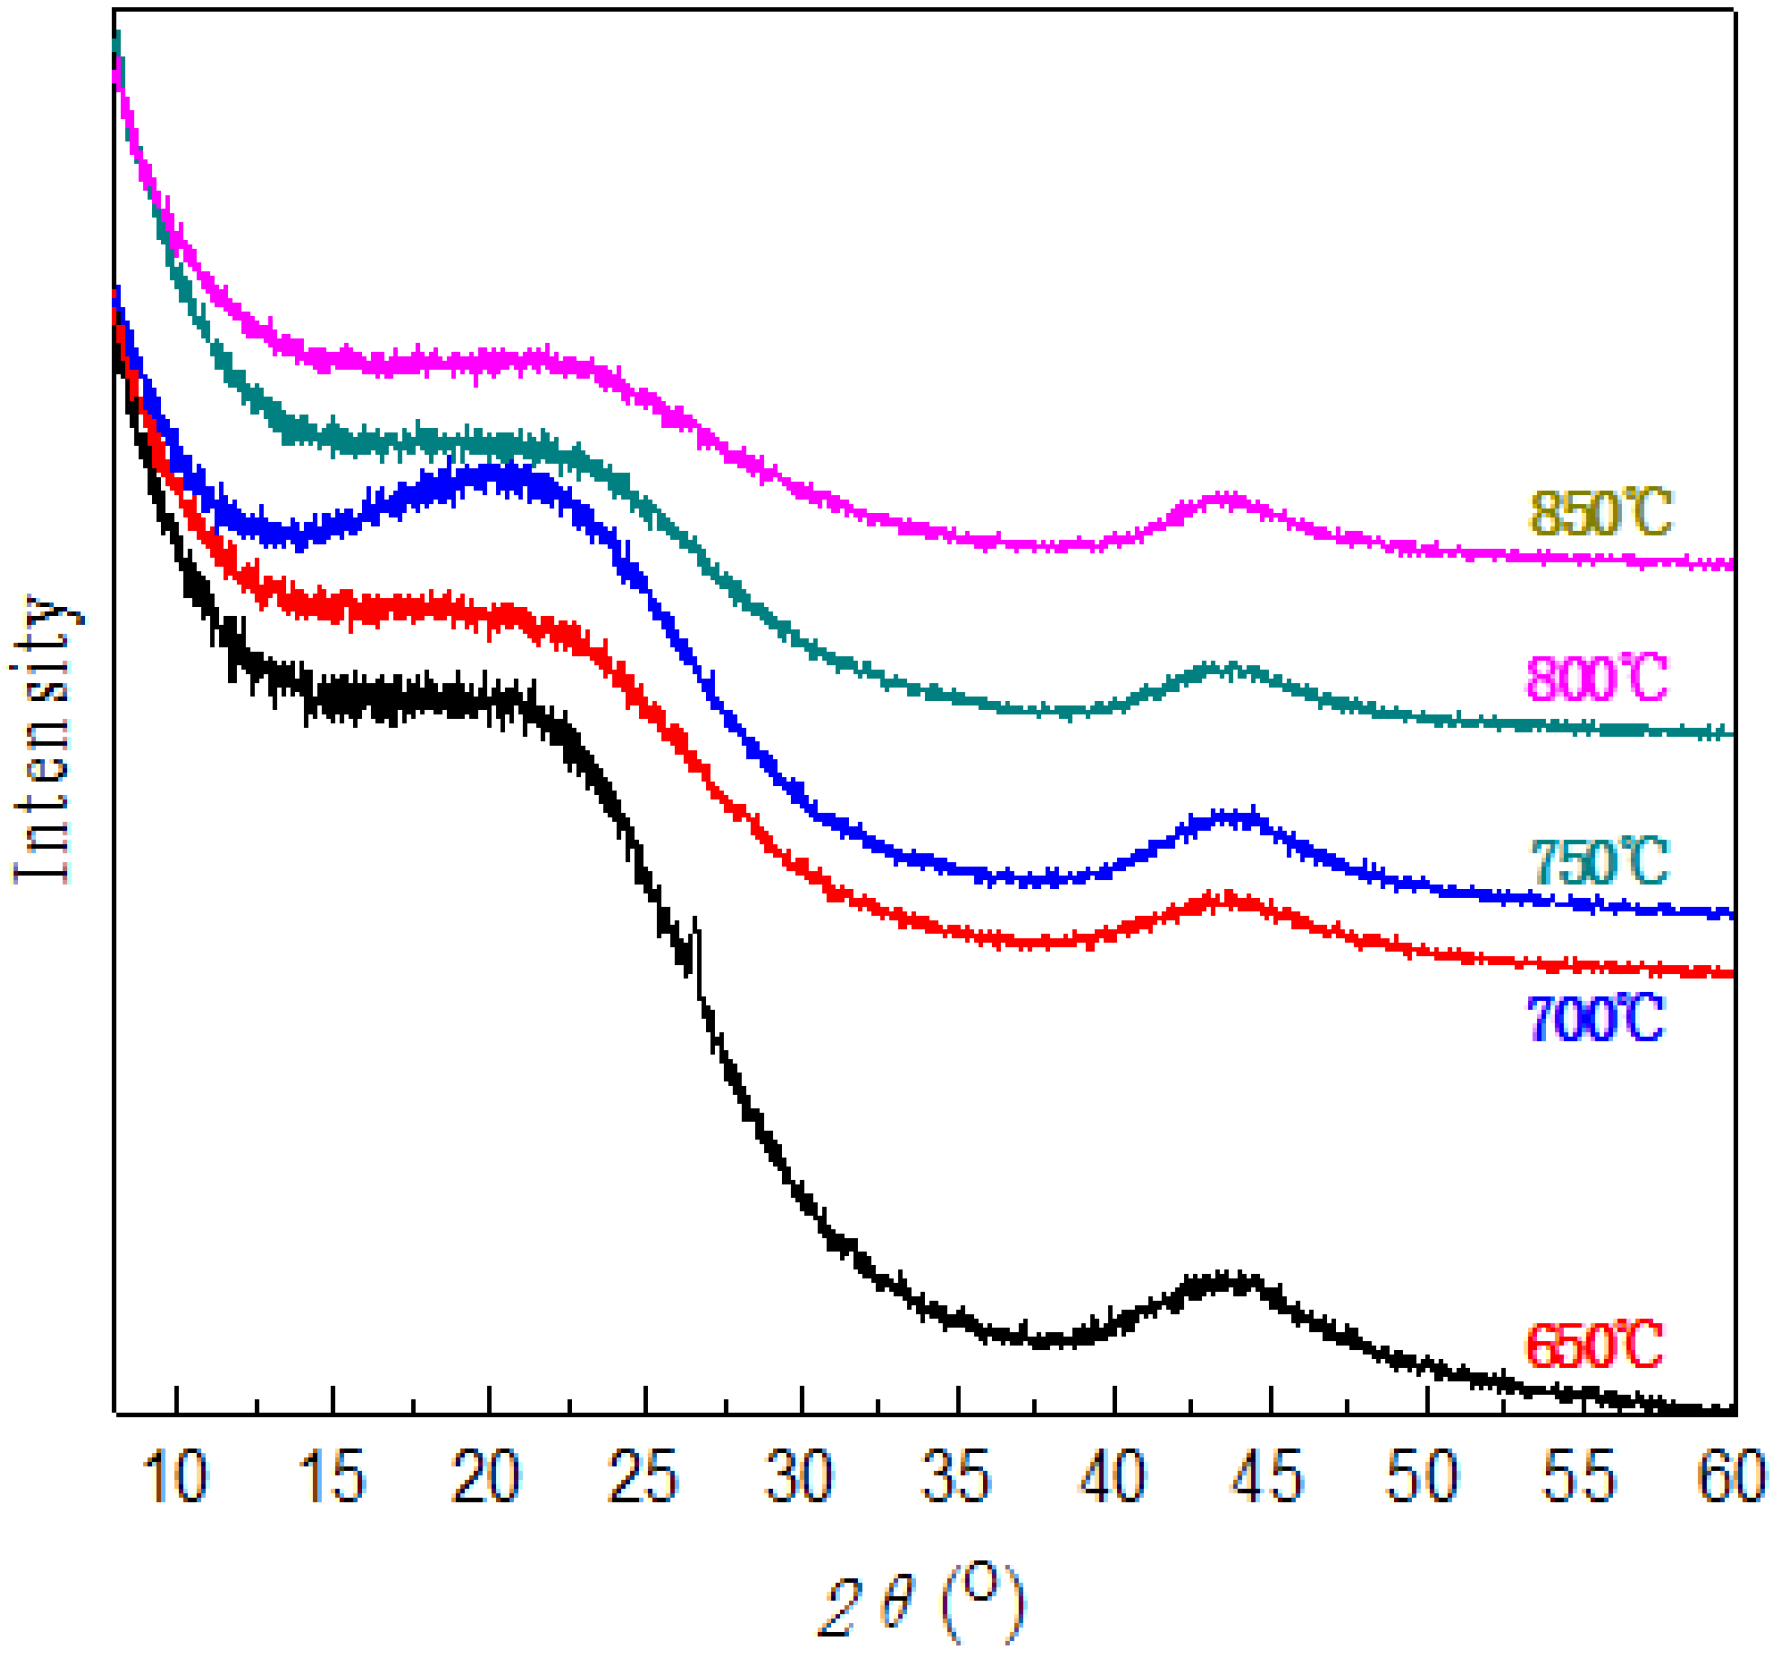
2.3. XRD Analysis of BACFs

Figure 3 shows XRD patterns of BACFs at various activation temperatures. With increased activation temperature, the 002 peak begins to shift towards higher angle and becomes broader, corresponding to smaller sized crystallites. Above 650 °C, the samples presents (100) diffraction peak (2θ = 43°). Finally, X-ray diffractograms for BACFs show a similar diffraction pattern. The XRD structure parameters of BACFs under various activation temperatures are shown in Table 1. It can be observed with increased activation temperature, that the value of d002 gradually decreases, whereas the values of the crystallite sizes La, Lc and Lc/d002 value slightly increase. At the same time, the g value corresponding to the change degree of graphitization structure increases. As can be seen, the Lc value is increased from 0.88 to 2.39 nm, while the Lc/d002 value is increased from 2.17 to 2.98 nm; indicating that a higher activation temperature produces thicker crystal and a denser structure [23,24].
Figure 3. XRD of BACFs at various temperatures.
Materials 07 04431 g003
Table 1. Structure parameters of XRD for BACFs.
Temperature (°C)d002/nmLc/nmLa/nmLc/d002g/%
6500.40720.881.832.17−7.25
7000.40531.981.982.37−7.14
7500.40532.062.062.46−7.14
8000.39302.112.112.60−5.69
8500.38792.392.392.98−5.10

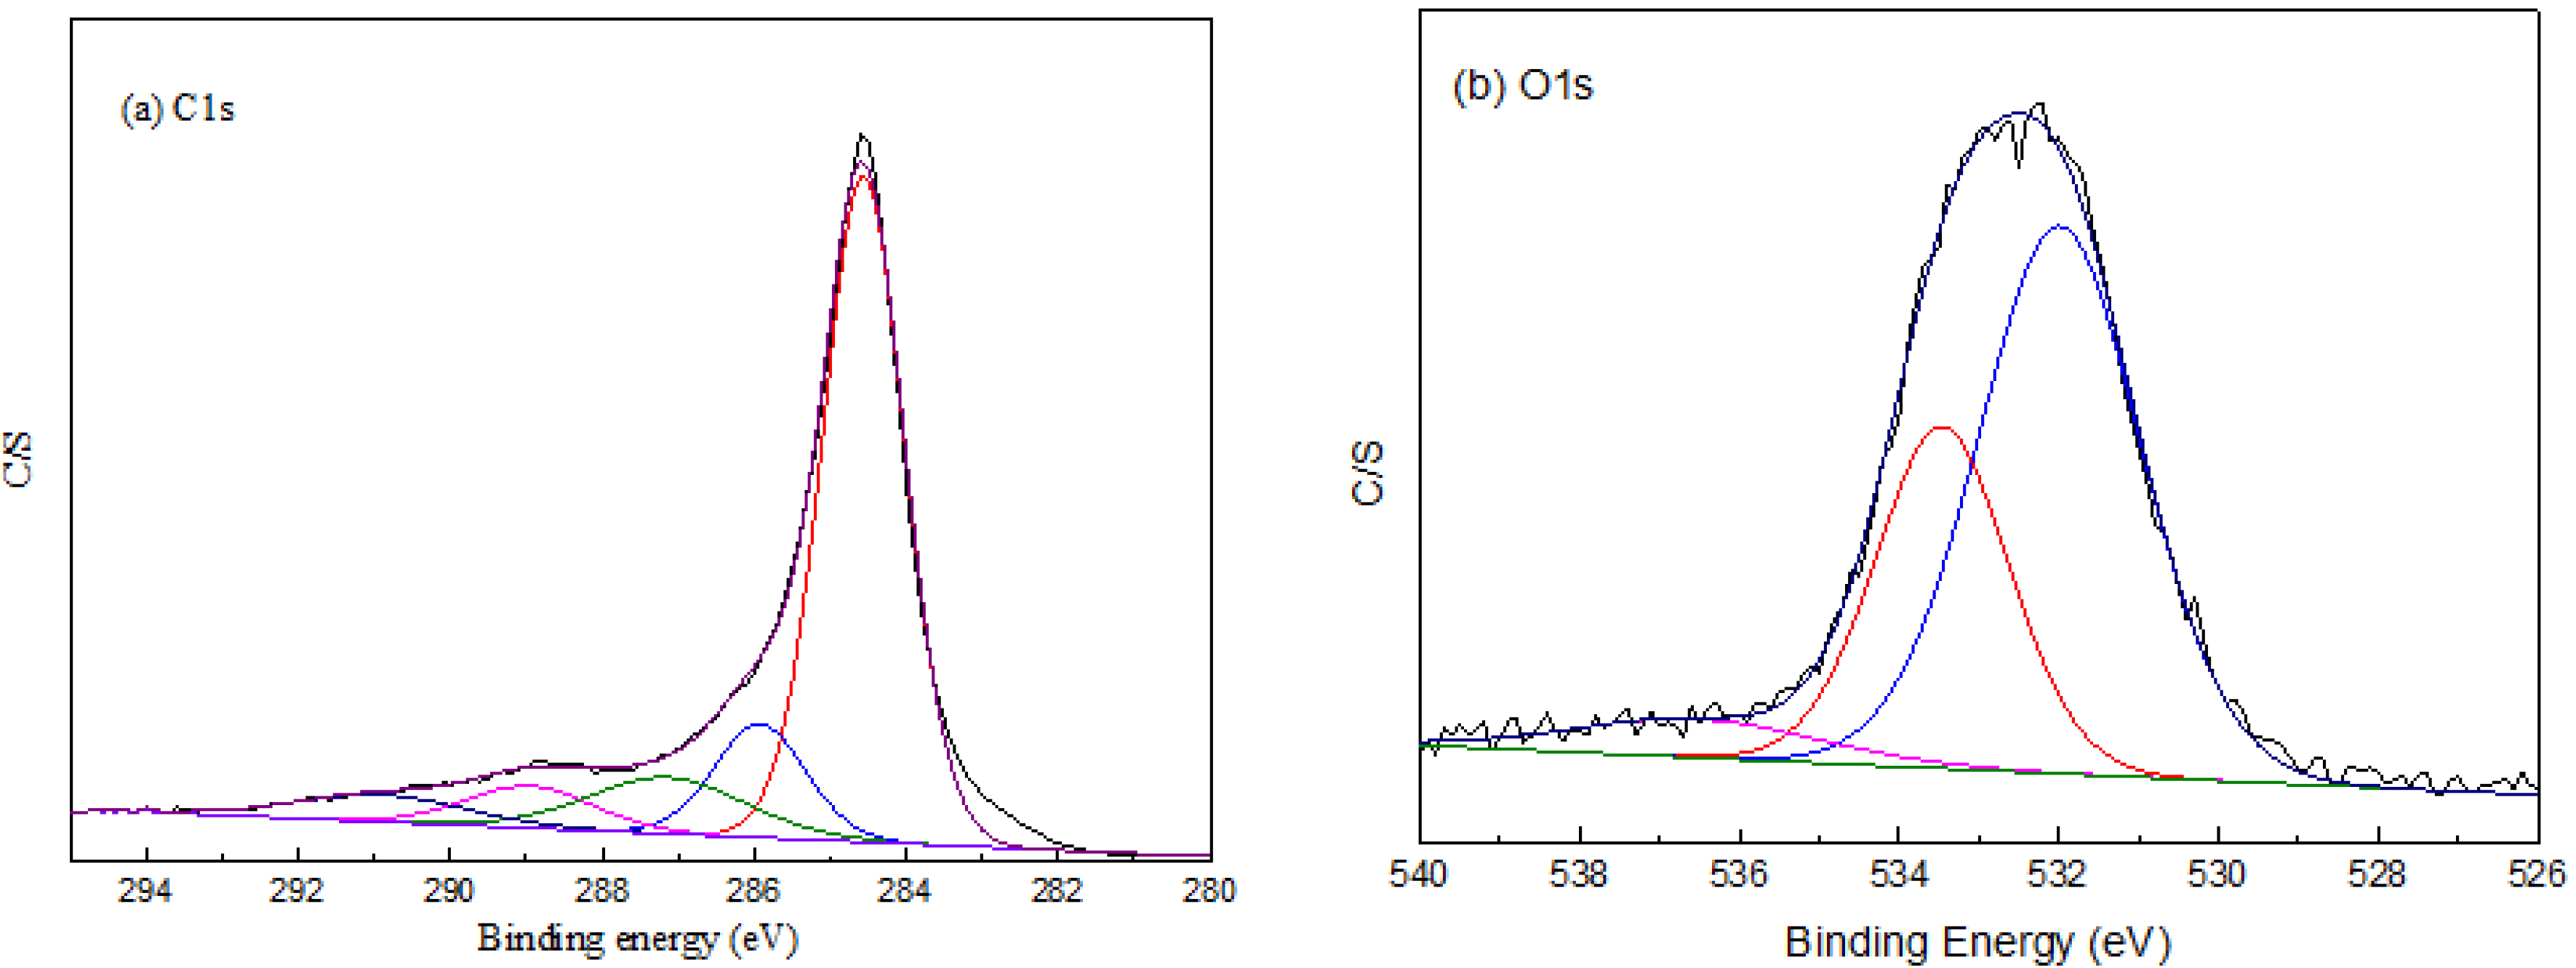
2.4. XPS Analysis of BACFs

Elemental analysis was carried out to obtain the compositions of C, O and P atoms in the fibers. As seen from Table 2, element C was the most abundant constituent in BACFs. With increased activation temperature, there was an increasing in C content, probably due to the release of volatiles. The presence of P could also be explained from the addition of phosphoric acid catalyst for liquefaction. Activation treatment has provoked a progressive release of oxygen, with a remarkable loss at 850 °C. This implies that the fraction of oxygen was located around the pore entry, hence the extension of micropores at 850 °C resulted in a large decrease in oxygen, corresponding to a much higher C/O atomic ratio [25,26].
Table 2. Elemental composition of the surface of BACFs.
Temperature (°C)C (wt%)O (wt%)P (wt%)C/O
65080.7218.910.374.26
70082.8516.710.404.95
75083.0816.830.084.94
80084.4015.300.305.51
85088.5511.190.267.91
To obtain information about the chemical composition of the fiber surface and the binding characteristics of the elements at the surface, the measurements of the high-resolution XPS C 1s spectra were carried out. The bands obtained by spectral deconvolution of the C1s peak are shown in Figure 4, and the functionalities attributed to each are presented in Table 3. The same functionalities were detected for both types of fibers, namely hydroxyl or ether groups, quinone type groups and carboxylic acid. The C1s spectra have each been resolved into five individual component peaks that represent graphitic carbon (CP1, 284.6 eV), and carbon present in phenol, alcohol, ether or C=N groups (CP2, 285.8–286.0 eV), carbonyl or quinine groups (CP3, 286.7–287.5 eV), carboxyl, lactone, or ester groups (CP4, 288.3–289.0 eV), and carbonate groups (CP5, 289.7–290.8 eV) [27,28,29].
Figure 4. High-resolution X-ray photoelectron spectroscopy (XPS)fitted (a) C 1s and (b) O1s spectra of BACFs.
Materials 07 04431 g004
Table 3. XPS results of the peak fits of the C1s and O1s regions.
Temperature (°C)Graphite (CP1)C–OH (CP2)C=O (CP3)C–OOH (CP4)CO32−, CO, CO2 (CP5)
BE (eV)M (%)BE (eV)M (%)BE (eV)M (%)BE (eV)M (%)BE (eV)M (%)
650284.668.5286.014.7287.27.0288.76.2290.13.7
700284.670.9286.09.6286.86.8288.58.7290.24.5
750284.669.4285.810.8286.76.5288.37.2289.96.1
800284.666.0286.015.5287.57.5288.93.2289.77.8
850284.665.3286.012.4287.210.5289.06.4290.85.4
It can be seen from Table 3 that there was a decrease in the relative content of graphitic carbon and an increase in the relative content of carbon bonded to oxygen-containing functions after heat treatment. Aside from the graphitic carbon, C–OH, C=O and C–OOH groups were the predominant functions on the surface of ACFs. The relative composition of the fibers’ surface was similar to the published work [30]. The surface oxides on BACFs change from C–OH or C=O to C–OOH before heating up to 700 °C. However, the oxygen-containing groups change from C–OH to C=O or C–OOH after heating up to 800 °C. A slight increase of surface oxides on BACFs after heat treatment may cause by the formation of oxygenic functional groups, which the activating agent reacts with the reactive centers such as disorganized carbons, carbons with heteroatom and carbons on graphene edges, creating new pores and widening the existing ones during the activation [31].

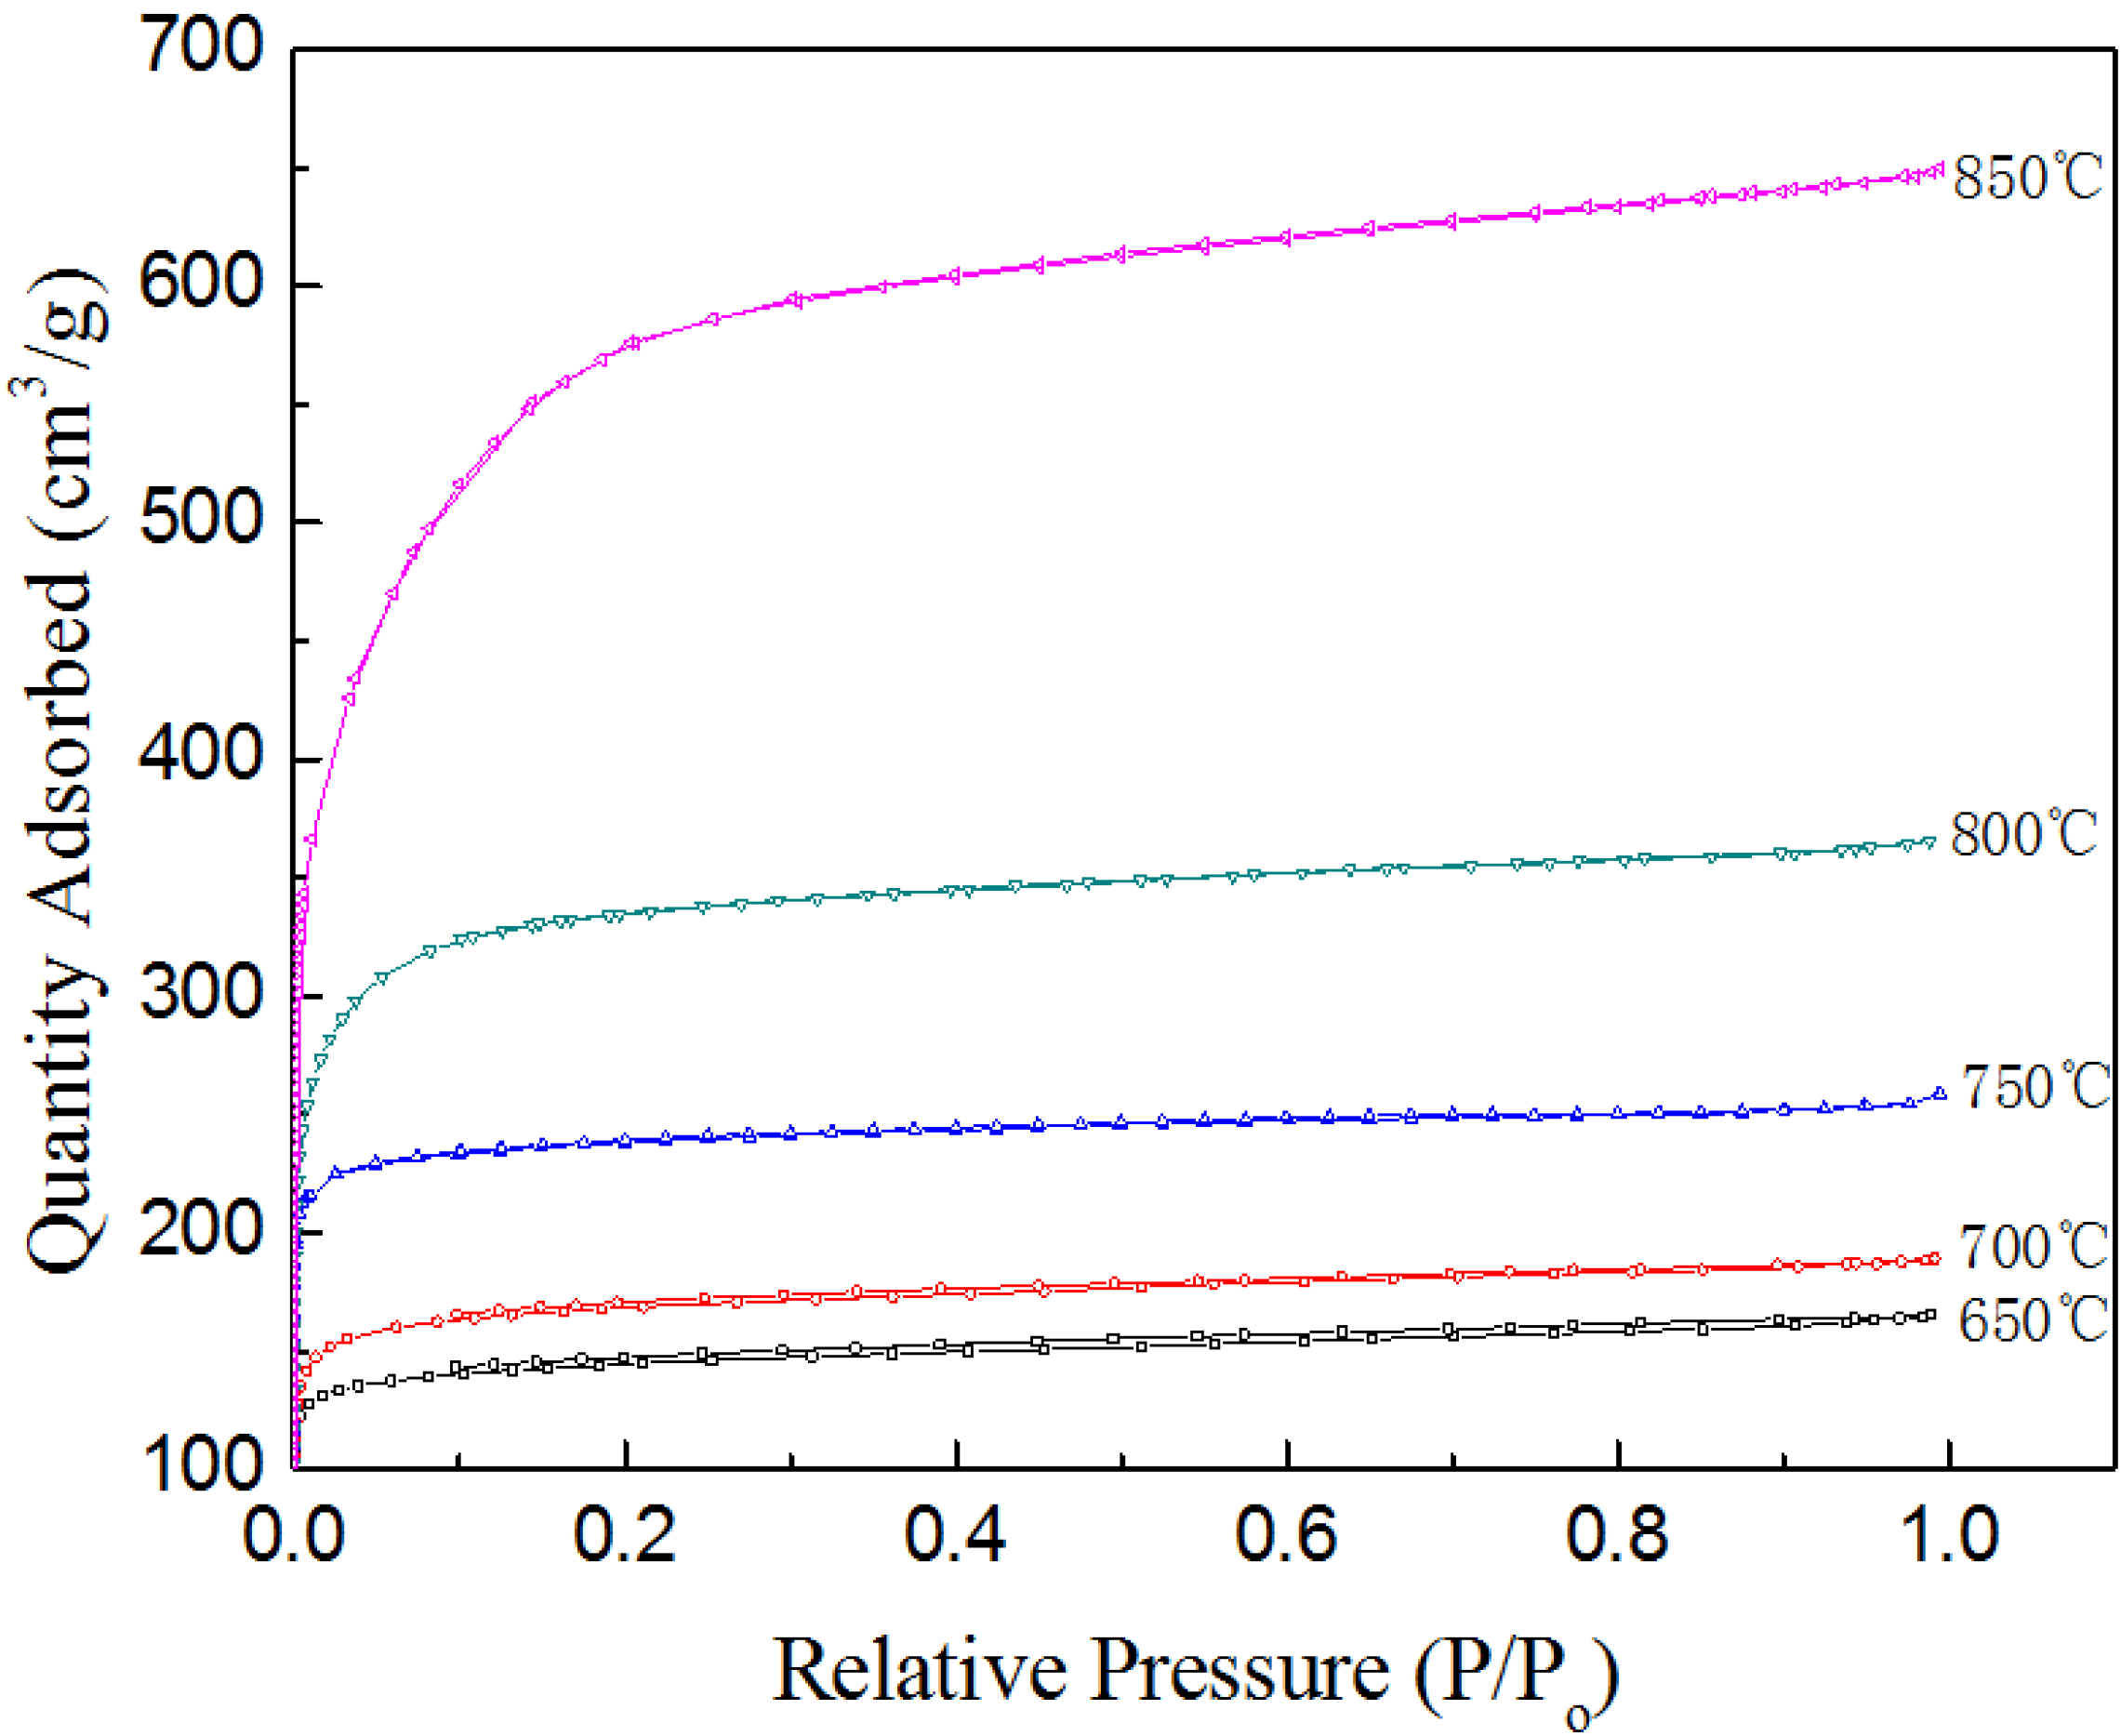
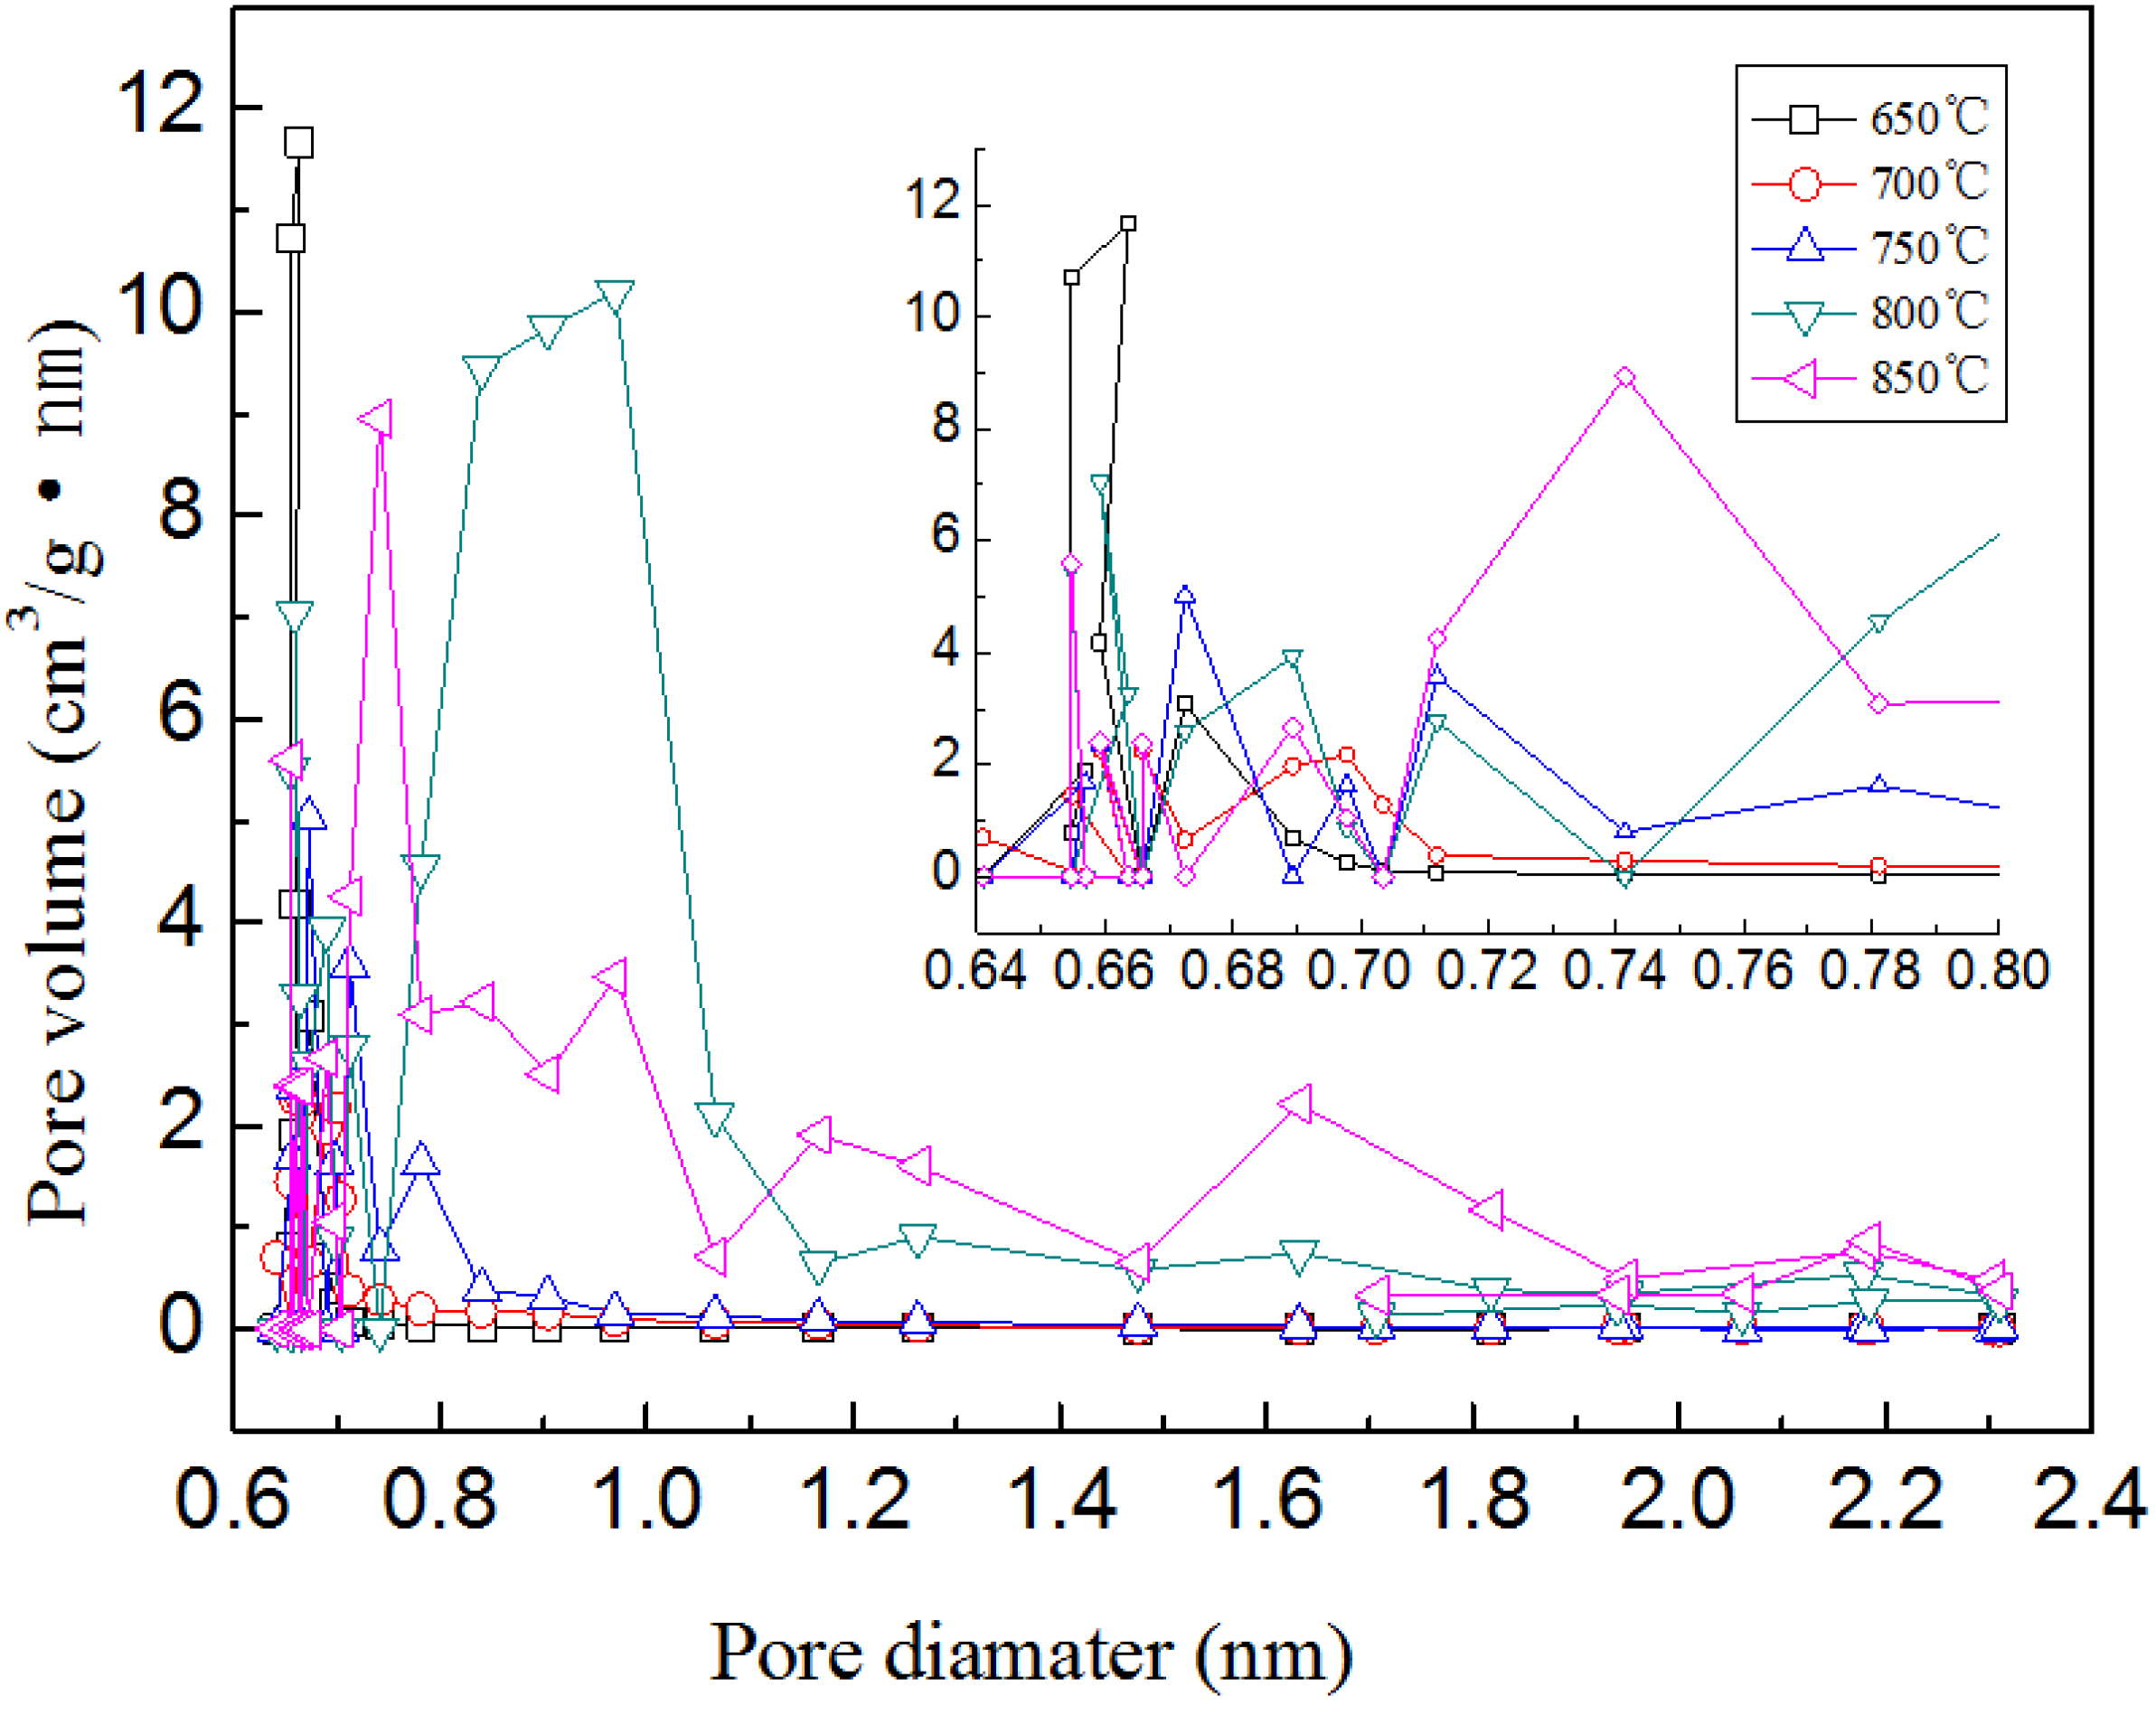
2.5. N2 Adsorption of BACFs

The N2 adsorption-desorption isotherms for BACFs obtained at various final activation temperatures were investigated. Figure 5 shows the adsorption-desorption isotherms of BACFs prepared at various temperatures. As can be seen from Figure 5, at low relative pressures, a rapid increase in the adsorption–desorption isotherms is observed, which is followed by a plateau at higher relative pressures, indicating a type I isotherm according to the IUPAC classification [32,33]. The type I isotherm represents a material with microporous structure. The major uptake occurs at low relative pressures indicating the formation of highly porous materials with narrow pore size distribution [34].
Figure 5. N2 adsorption isotherms at −196 °C of BACFs at various temperatures.
Materials 07 04431 g005
The pore size distributions for the BACFs samples calculated from HK supported the above results. As can be seen from Figure 6, the differences in pore size distribution among them were mainly in the region where pore size was smaller than 0.8 nm. The pore size distribution of BACFs above 800 °C was broader than the former three samples, with a significant increase in the number of micopores with a size 0.8–2.4 nm.
Figure 6. The pore size distributions for BACFs (HK method).
Materials 07 04431 g006
The effects of temperature on the surface areas (BET and micropore) and pore volumes (total, micropore, and mesopore) of BACFs are shown in Table 4. The surface areas and pore volumes of BACFs gradually increased with increasing final carbonization temperature from 650 to 850 °C. When the final activation temperature was raised to 850 °C, the SBET and Smic were found as 2024 and 1275 m2/g, respectively; and the Vtot, Vmic and Vmes were found as 0.999, 0.569 and 0.416 cm3/g, respectively. The BET values are higher than the bamboo activated carbons reported [35,36]. The micro and mesoporosity percentages at the studied temperatures are also given in Table 2. As can be seen from Table 4, the micro and mesoporosities also change with the increasing activation temperature. The microporosity increased from 70.7% to 72.2% and mesoporosity decreased from 29.3% to 27.8% as temperature increased from 650 to 700 °C. After 700 °C activation temperature, the microporosity was decreased to the value of 57%, which accorded with the iodine and MB adsorption in Figure 2. At all final activation temperatures, mixed (microporous/ mesoporous) activated carbon fibers were obtained. According to the results, BACFs having high-surface areas (SBET and Smic) and pore volumes (Vtot, Vmic, and Vmes) was obtained at final activation temperature of 850 °C.
Table 4. Surface areas and pore volumes of BACFs at different temperatures.
Temperature (°C)SBET (m2/g)Smic (m2/g)Vtot (cm3/g)Vmic (cm3/g)Vmes (cm3/g)Vmi/Vt (%)
6504833860.2560.1810.07570.7
7005614490.2930.2120.08172.2
7507246010.4110.2910.13170.9
80011258560.5660.3870.16568.4
850202412750.9990.5690.41657.0
Note: SBET, BET surface area; Smic, micropore surface area; Vtot, total pore volume; Vmic, micropore volume; Vmes, mesopore volume.

3. Experimental

3.1. Samples

The mixture of bamboo powder (20 g, Zhangji Corporation, Nanjing, China), phenol (120 g, Jiangtian Corporation, Tianjin, China) and H3PO4 (9.6 g, Jiangtian Corporation, Tianjin, China) were loaded into a round bottom flask, and heated at 160 °C for 150 min to liquefy bamboo. Subsequently, hexamethylenetetramine (5 wt%) was added to the liquefied medium and heated to 130 °C in 40 min to prepare spinning solution. The spinning solution was spun into filaments by melt-spinning. The spun filaments were cured by soaking in an acid solution (HCHO and HCl, 1:1 by volume, Jiangtian Corporation, Tianjin, China) at 95 °C for 4 h, washed with distilled water and finally dried at 90 °C for 45 min to obtain the fibers. The activation was carried out in a tube furnace and the samples were heated from room temperature to the final activation temperature with a heating rate of 5 °C/min in N2. Thereafter, the fibers were held at this temperature for 40 min by introducing a steam flow of 8 g/min and then cooled down to room temperature. These samples were denoted BACFs.

3.2. Measurements

The surface morphologies of BACFs were examined using a SEM (SS-550, Shimadzu Corporation, Kyoto, Japan) with an acceleration voltage of 15 kV.
The crystal structures of BACFs were measured using a Powder X-ray Diffractometer (D/max-2500, Rigaku Corporation, Tokyo, Japan) using Cu Kα radiation (λ = 0.154 nm, powdery samples), diffraction angle range of 2θ = 5°−60° with a count time of 20 s at each point. The accelerating voltage and applied current were 40 kV and 100 mA, respectively.
In order to examine the differences of microcrystalline structure of BACFs at various temperatures, the apparent crystallite thickness (Lc), the apparent layer-plane length parallel to the fiber axis (La), and the average interlayer spacing d were calculated using the Bragg and Scherrer formula. The formulas can be expressed as:
Materials 07 04431 i001
Materials 07 04431 i002
where θ is the Bragg angle of peaks (°), λ is the wavelength of X-ray used (0.154 nm), and β is peak width at half-height (rad). The form factor K is 0.89 for Lc, and 1.84 for La, respectively.
The graphitization degree of BACFs can be calculated by the layer spacing d002, the simplified formula is:
Materials 07 04431 i003
where: g-graphitization degree (%); 0.3440-layer spacing of not graphited carbon material completely (nm); 0.3354-layer spacing of ideal graphite crystal (nm); d002-layer spacing (nm).
X-ray photoelectron spectroscopy measurements of the samples at various calcination temperatures were carried out on a Kratos Axis UltraDLD (XPS, Shimadzu Corporation, Kyoto, Japan) with a monochromated Al Kα X-ray source (hv = 1486.6 eV). XPS survey spectra were recorded with pass energy of 80 eV, and high resolution spectra with pass energy of 40 eV.
Specific surface area was obtained from a N2 adsorption-desorption isotherm taken at 77 K with a Micromeritics ASAP-2020. The surface area of each specimen was obtained based on the Brunauer-Emmett-Teller (BET) method. The micropore area and micropore volume were calculated by t-plot. The micropore size distributions were obtained based on the Horvath-Kawazoe (HK) method. The total pore volume and radius were based on the assumption that nitrogen filled the sample pores at a relative pressure of 0.99 atm.
The iodine and MB adsorption were calculated following GB/T 12496.8-1999 and 12496.10-1999, respectively.

4. Conclusions

Bamboo can be effectively used as a raw material for the preparation of high-surface area ACFs after liquefaction and curing. In addition, the raw material is found in abundance and therefore the ACFs cost is expected to be economical. Also, the obtained ACFs with high surface area in this study can be used as a very promising adsorbent for pollution control and other applications.

Acknowledgments

This research was financially supported by National Natural Science Foundation of PR China (No. 31270607), and Tianjin Outstanding Postdoctoral Internationalization Training Plan.

Author Contributions

Ying Li carried out the experimental work and edited the paper. Hongmei Yang performed literature review and participated in writing the manuscript. Lili Yu and Yin Chen performed literature review and corrected the paper.

Conflicts of Interest

The authors declare no conflict of interest.

References

  1. Yang, R.; Liu, G.Q.; Xu, X.H.; Li, M.; Zhang, J.C.; Hao, X.M. Surface texture, chemistry and adsorption properties of acid blue 9 of hemp (Cannabis sativa L.) bast-based activated carbon fibers prepared by phosphoric acid activation. Biomass Bioenergy 2011, 35, 437–445. [Google Scholar] [CrossRef]
  2. Suzuki, M. Activated carbon fiber: Fundamentals and applications. Carbon 1994, 32, 577–586. [Google Scholar] [CrossRef]
  3. Pastor, A.C.; Rodriguez-Reinoso, F.; Marsh, H.; Martinez, M.A. Preparation of activated carbon cloths from viscous rayon. Part I. Carbonization procedures. Carbon 1999, 37, 1275–1283. [Google Scholar] [CrossRef]
  4. Park, S.J.; Jang, Y.S.; Shim, J.W.; Ryu, S.K. Studies on pore structures and surface functional groups of pitch-based activated carbon fibers. J. Colloid. Interface. Sci. 2003, 260, 259–264. [Google Scholar] [CrossRef]
  5. Eduardo, M.C.C.; Antonio, M.G.M.; Angeles, D.D.; Angel, L.O. Textural and morphological study of activated carbon fibers prepared from kenaf. Microporous Mesoporous Mater. 2008, 111, 523–529. [Google Scholar] [CrossRef]
  6. Li, K.Q.; Li, Y.; Hu, H.L. Adsorption characteristics of lead on cotton-stalk-derived activated carbon fibre by steam activation. Desalin. Water Treat. 2011, 30, 1–9. [Google Scholar]
  7. Phan, N.H.; Rio, S.; Faur, C.; Coq, L.L.; Cloirec, P.L.; Nguyen, T.H. Production of fibrous activated carbons from natural (jute, coconut) fibers for water treatment applications. Carbon 2006, 44, 2569–2577. [Google Scholar] [CrossRef]
  8. Uraki, Y.; Nakatani, A.; Kubo, S.; Sano, Y. Preparation of activated carbon fibers with large specific surface area from softwood acetic acid lignin. J. Wood. Sci. 2001, 47, 465–469. [Google Scholar] [CrossRef]
  9. Asakura, R.; Morita, M.; Maruyama, K.; Hatori, H.; Yamada, Y. Preparation of fibrous activated carbons from wood fiber. J. Mater. Sci. 2004, 39, 201–206. [Google Scholar] [CrossRef]
  10. Zhang, Z.J.; Li, J.; Sun, F.S.; Ng, D.H.L.; Kwong, F.L.; Liu, S.Q. Preparation and characterization of activated carbon fiber from paper. Chin. J. Chem. Phys. 2011, 24, 503–504. [Google Scholar]
  11. Asada, T.; Ohkubo, T.; Kawata, K.; Oikawa, K. Ammonia adsorption on bamboo charcoal with acid treatment. J. Health. Sci. 2006, 52, 585–589. [Google Scholar] [CrossRef]
  12. Wang, S.Y.; Tsai, M.H.; Lo, S.F.; Tsai, M.J. Effects of manufacturing conditions on the adsorption capacity of heavy metal ions by Makino bamboo charcoal. Bioresour. Technol. 2008, 99, 7027–7033. [Google Scholar] [CrossRef]
  13. Ip, A.W.M.; Barford, J.P.; McKay, G. Production and comparison of high surface area bamboo derived active carbons. Bioresour. Technol. 2008, 98, 8909–8916. [Google Scholar]
  14. Lianggui, W. Removal of Disperse Red dye by bamboo-based activated carbon: Optimisation, kinetics and equilibrium. Environ. Sci. Pollut. Res. 2013, 20, 4635–464. [Google Scholar] [CrossRef]
  15. Dagang, L.; Tuhua, Z.; Kaifu, L.; Qinglin, W. Starch composites reinforced by bamboo cellulosic crystals. Bioresour. Technol. 2010, 101, 2529–2536. [Google Scholar] [CrossRef]
  16. Masahiko, K.; Toshiyuki, A.; Mikio, K.; Bunichiro, T. Analysis on residue formation during wood liquefaction with polyhydric alcohol. J. Wood. Sci. 2004, 50, 407–414. [Google Scholar] [CrossRef]
  17. Joanne, Y.; Meijuan, C.; Szeto, Y.S.; Siucheong, Y. Comparative study of liquefaction process and liquefied products from bamboo using different organic solvents. Bioresour. Technol. 2009, 100, 6674–6678. [Google Scholar] [CrossRef]
  18. Liyi, Y.; Jingmiao, Z.; Jie, Z.; Song, T. Liquefaction of bamboo shoot shell for the production of polyols. Bioresour. Technol. 2014, 153, 147–153. [Google Scholar] [CrossRef]
  19. Xiaojun, M.; Guangjie, Z. Preparation of carbon fibers from liquefied wood. Wood Sci. Technol. 2010, 44, 3–11. [Google Scholar] [CrossRef]
  20. Xiaojun, M.; Guangjie, Z. Variations in the microstructure of carbon fibers prepared from Liquefied wood during carbonization. J. Appl. Polym. Sci. 2011, 121, 3525–3530. [Google Scholar] [CrossRef]
  21. Pelekani, C.; Snoeyink, V.L. Competitive adsorption between atrazine and methylene blue on activated carbon: The importance of pore size distribution. Carbon 2000, 38, 1423–1436. [Google Scholar] [CrossRef]
  22. Lei, S.; Miyamoto, J.; Kanoh, H.; Nakahigashi, Y.; Kaneko, K. Enhancement of the methylene blue adsorption rate for ultramicroporous carbon fiber by addition of mesopores. Carbon 2006, 44, 1884–1890. [Google Scholar] [CrossRef]
  23. Cuesta, A.; Dhamelincout, P.; Laureyns, J.; Martínez-Alonso, A.; Tascon, J.M.D. Comparative performance of X-ray diffraction and Raman microprobe techniques for the study of carbon materials. J. Mater. Chem. 1998, 8, 2875–2879. [Google Scholar]
  24. Kercher, A.K.; Nagle, D.C. Microstructural evolution during charcoal carbonization by X-ray diffraction analysis. Carbon 2003, 41, 15–27. [Google Scholar] [CrossRef]
  25. Chong, Y.B.; Ohara, H. Modification of carbon fiber surfaces by direct fluorination. J. Fluor. Chem. 1992, 57, 169–175. [Google Scholar]
  26. Paiva, M.C.R.; Bernardo, C.A.; Nardin, M. Mechanical, surface and interfacial characterisation of pitch and PAN-carbon fibres. Carbon 2000, 38, 1323–1327. [Google Scholar] [CrossRef]
  27. El-Merraoui, M.; Tamai, H.; Yasuda, H.; Kanata, T.; Mondori, J.; Nadai, K.; Kaneko, K. Pore structures of activated carbon fibers from organometallics/pitch composites by nitrogen adsorption. Carbon 1998, 36, 1769–1776. [Google Scholar] [CrossRef]
  28. Kang, E.T.; Neoh, K.G.; Tan, K.L.; Liaw, D.J. Surface Graft Polymerization and Grafting of Polymers for Adhesion Improvement. In Handbook of Adhesion Improvement Techniques in Advanced Materials; Marcel Dekker Inc.: New York, NY, USA, 1999; pp. 289–321. [Google Scholar]
  29. Kang, E.T.; Neoh, K.G.; Liaw, D.J. Surface Modification of Polymers via Molecular Design, Advanced Functional Molecules and Polymers; Gordon and Breach Publisher: Amsterdam, The Netherlands, 2001; pp. 1–33. [Google Scholar]
  30. Yuchun, C.; ChienCheng, L.; HungChih, L. Characterization of microstructure and surface properties of heat-treated PAN-and rayon-based activated carbon fibers. Porous. Mater. 2007, 14, 227–237. [Google Scholar] [CrossRef]
  31. Qingsong, L.; Tong, Z.; Nan, L.; Peng, W.; Gulizhaer, A. Modification of bamboo-based activated carbon using microwave radiation and its effects on the adsorption of methylene blue. Appl. Surf. Sci. 2010, 256, 3309–3315. [Google Scholar] [CrossRef]
  32. Rouquerol, F.; Rouquerol, J.; Sing, K. Adsorption by Powders and PorousSolids, Principles, Methodology and Applicatiions; Academic Press: London, UK, 1999. [Google Scholar]
  33. Shujuan, Z.; HanQing, Y.; HuiMin, F. PVA-based activated carbon fibers with lotus root-like axially porous structure. Carbon 2006, 44, 2059–2068. [Google Scholar] [CrossRef]
  34. Warhurst, A.M.; Fowler, G.D.; McConnachie, G.L.; Pollard, S.J.T. Pore structure and adsorption characteristics of steam pyrolysis carbons from moringa oleifera. Carbon 1997, 35, 1039–1045. [Google Scholar]
  35. Mizuta, K.; Matsumoto, T.; Hatate, Y.; Nishihara, K.; Nakanishi, T. Removal of nitrate-nitrogen from drinking water using bamboo powder charcoal. Bioresour. Technol. 2004, 95, 255–257. [Google Scholar] [CrossRef]
  36. Toshihide, H.; Yoshiyuki, K.; Tomoki, S.; Jun’ichi, H.; Masahiro, K. Characteristics and humidity control capacity of activated carbon from bamboo. Bioresour. Technol. 2010, 101, 3964–3969. [Google Scholar]

