2.1. Effects of Fly Ash on Chloride Ion Ingress in the Surface Layer of Concrete
Contents of chloride ion in the surface layer of all concrete under saturated conditions for 30, 60, 90, 120 and 150 days are shown in
Table 1.
Table 1.
Contents of chloride ion in the surface layer of concrete at different immersion time (%).
Table 1.
Contents of chloride ion in the surface layer of concrete at different immersion time (%).
| Mix ID | Immersion Time (day) |
| 30 | 60 | 90 | 120 | 150 |
| CF0 | 0.295 | 0.408 | 0.450 | 0.679 | 0.684 |
| CF15 | 0.397 | 0.505 | 0.630 | 0.752 | 0.790 |
| CF30 | 0.397 | 0.576 | 0.625 | 0.700 | 0.777 |
Based on the previous study [
26], the most important parameter that influences the chloride ion transport is the materials’ pore structure. The use of supplementary cementing materials (SCM) such as fly ash, silica fume,
etc. have been found to be beneficial in resisting the ingress of chloride ions into concrete because of the microstructure densification caused by the pozzolanic reaction or secondary hydration of these materials [
27]. From the results observed in
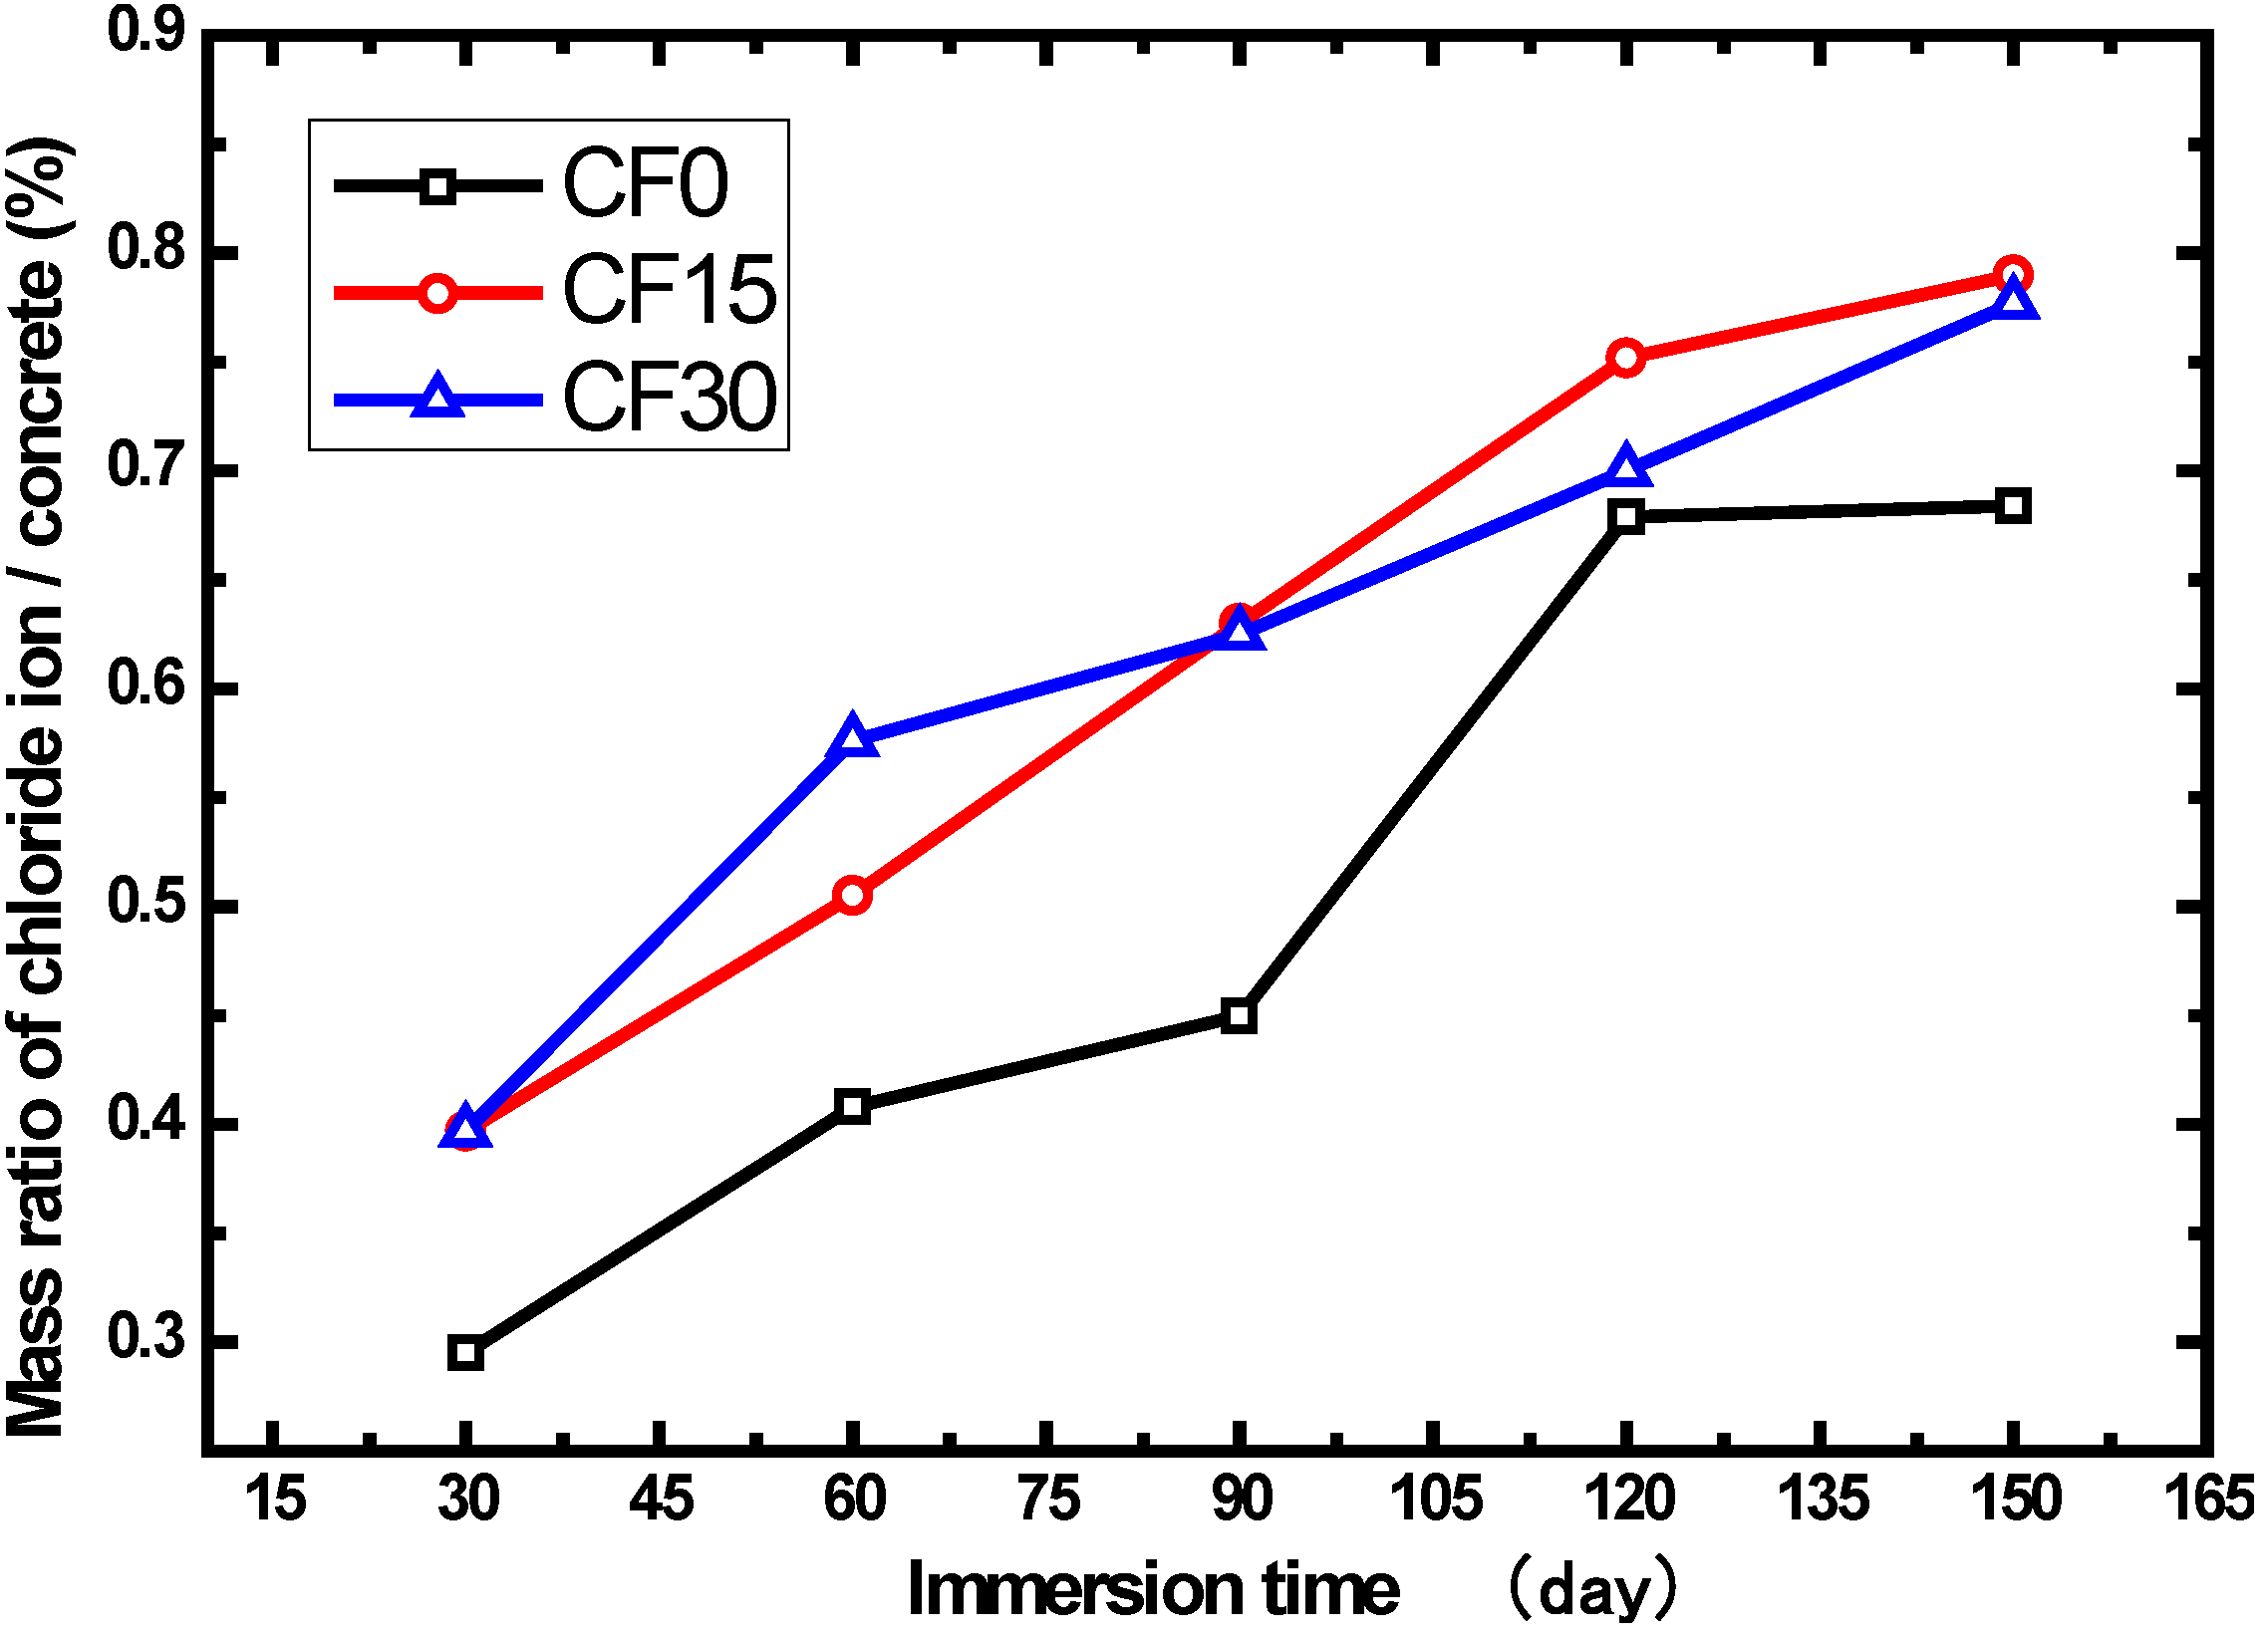
Table 1 and
Figure 1, it can be observed that the chloride concentration in the surface layer of fly ash concrete increases throughout the entire test period. The mixtures, respectively containing 15% and 30% fly ash replacement, show higher chloride concentrations than the reference specimen (CF0). It is mainly attributed to the lack of activated materials caused by fly ash replacement in early cement hydration, which postpones the cement hydration process. It should be noted that the ongoing and sufficient hydration reactions in Portland cement are essential to the durability and quality of concrete [
28,
29,
30,
31]. Thereby, the chloride ingress of the concrete with fly ash is far more remarkable than the concrete without any fly ash. In
Figure 1, it can also be found that there is no evident difference in the chloride concentrations between CF15 and CF30, which indicates that the fly ash dosage has little impact on the chloride accumulation in the surface layer of concrete. Along with the immersion time, the chloride contents of all the samples tend to be closed. This can be explained by the fact that the pozzolanic reaction becomes more and more pronounced with increases in time, resulting in microstructure densification. Accumulation of chloride ion in the surface layer is therefore hindered. The chloride concentration in the surface layer of fly ash concrete and the ordinary Portland cement concrete (OPC) are at the same level.
Figure 1.
Correlation between the fly ash and chloride ion content in the surface layer of concrete.
Figure 1.
Correlation between the fly ash and chloride ion content in the surface layer of concrete.
2.2. Influence of Fly Ash on the Water Permeability in the Surface Layer
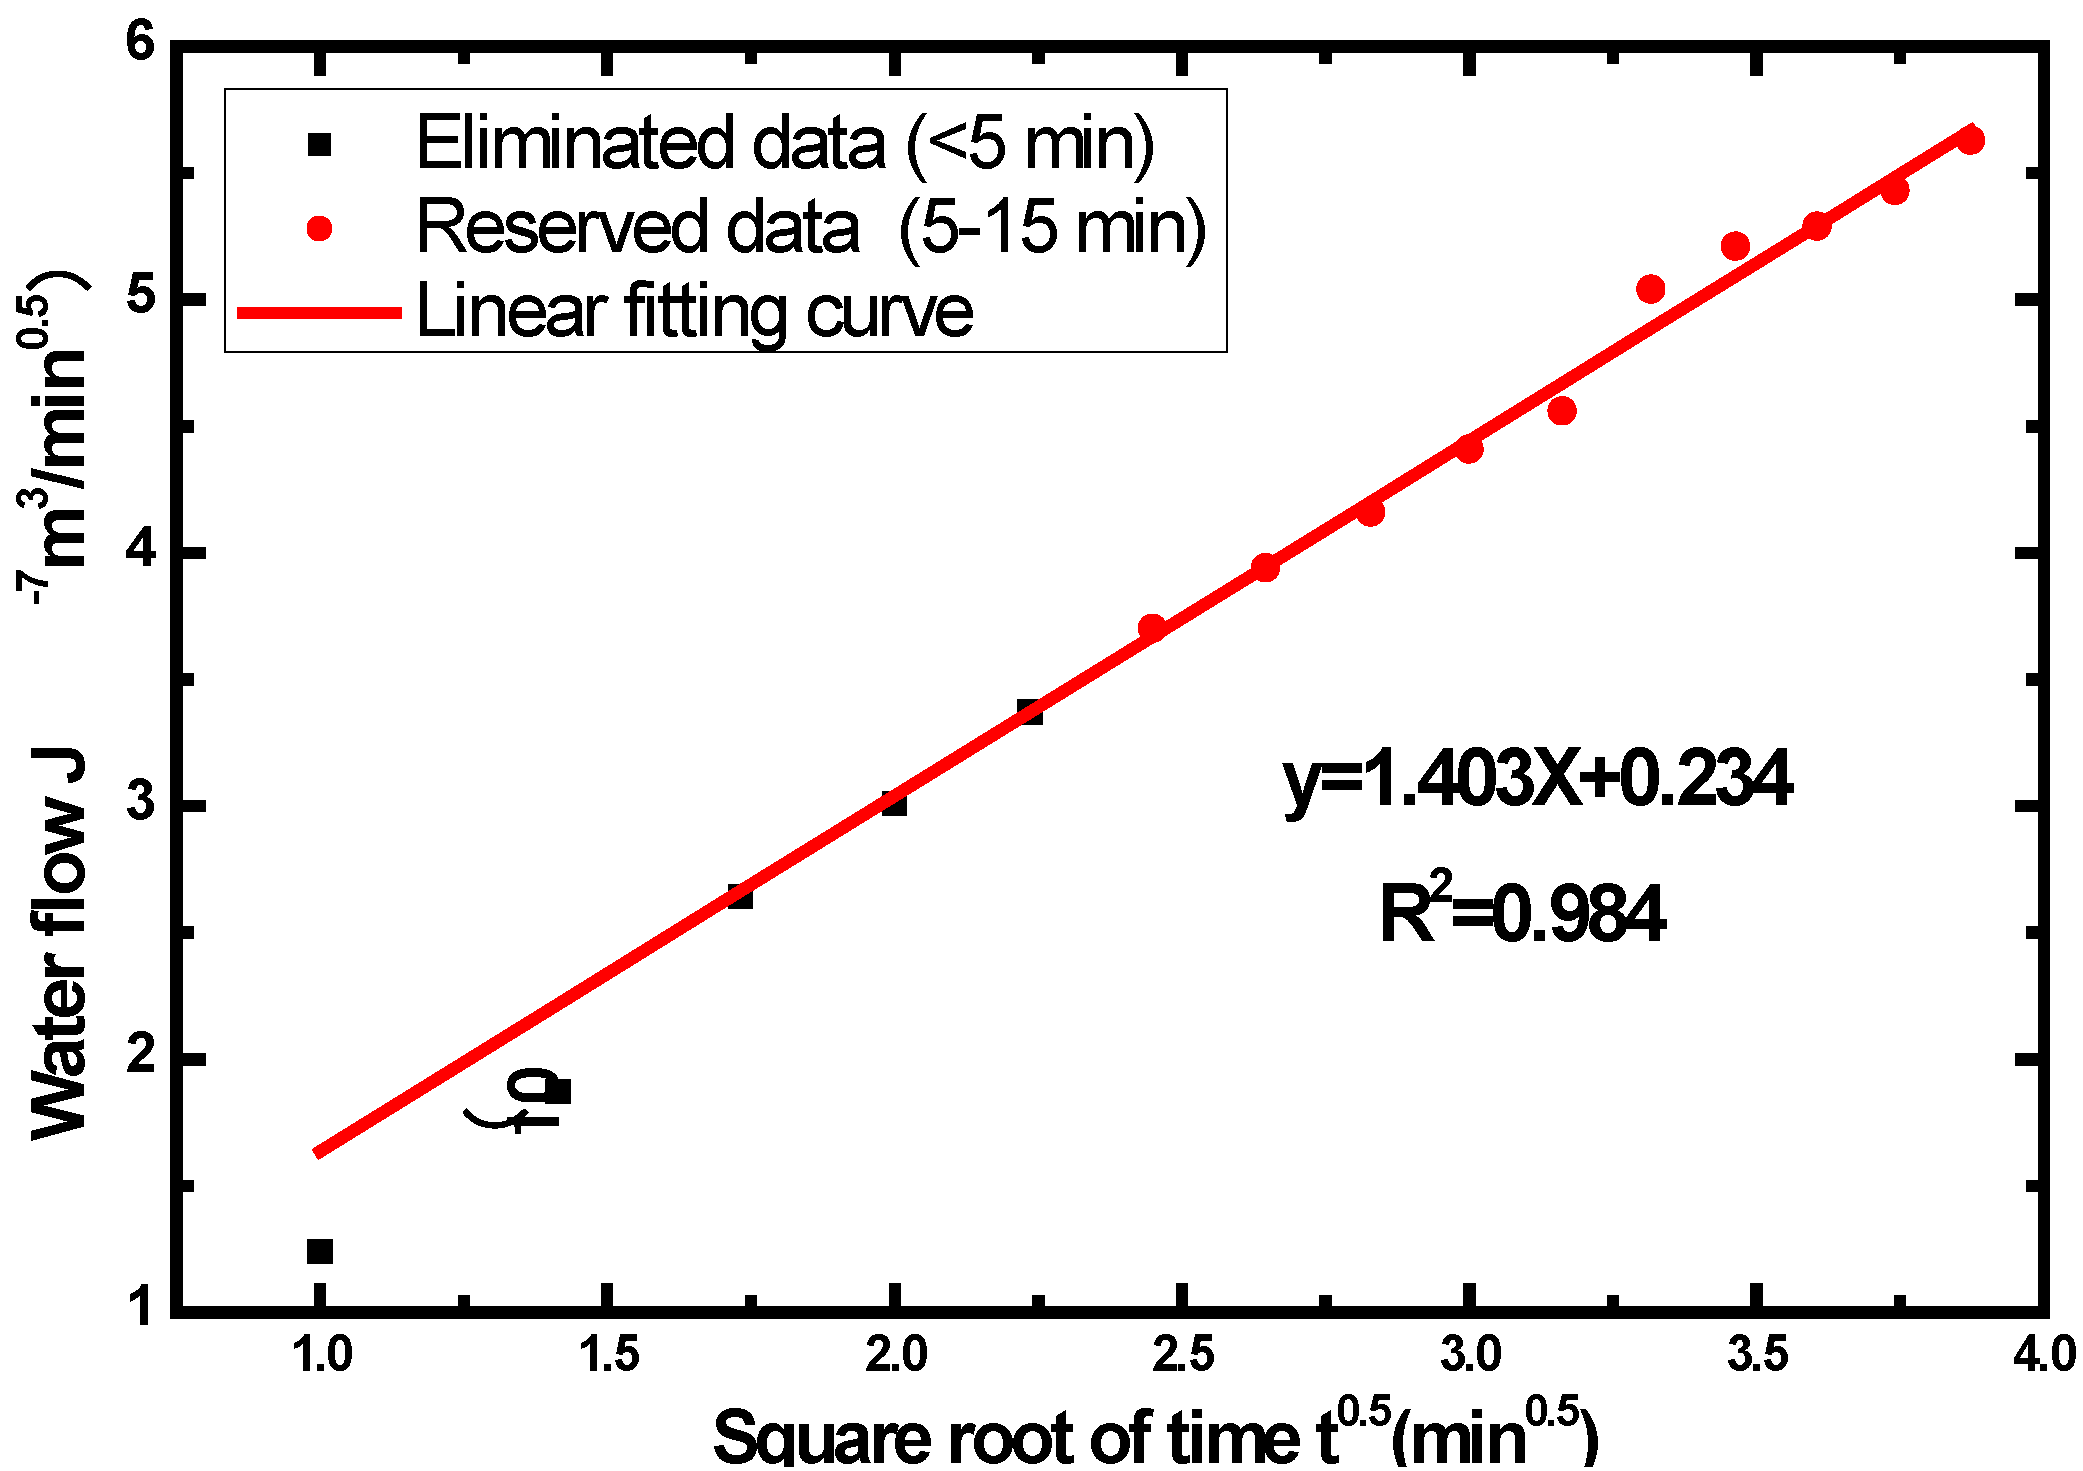
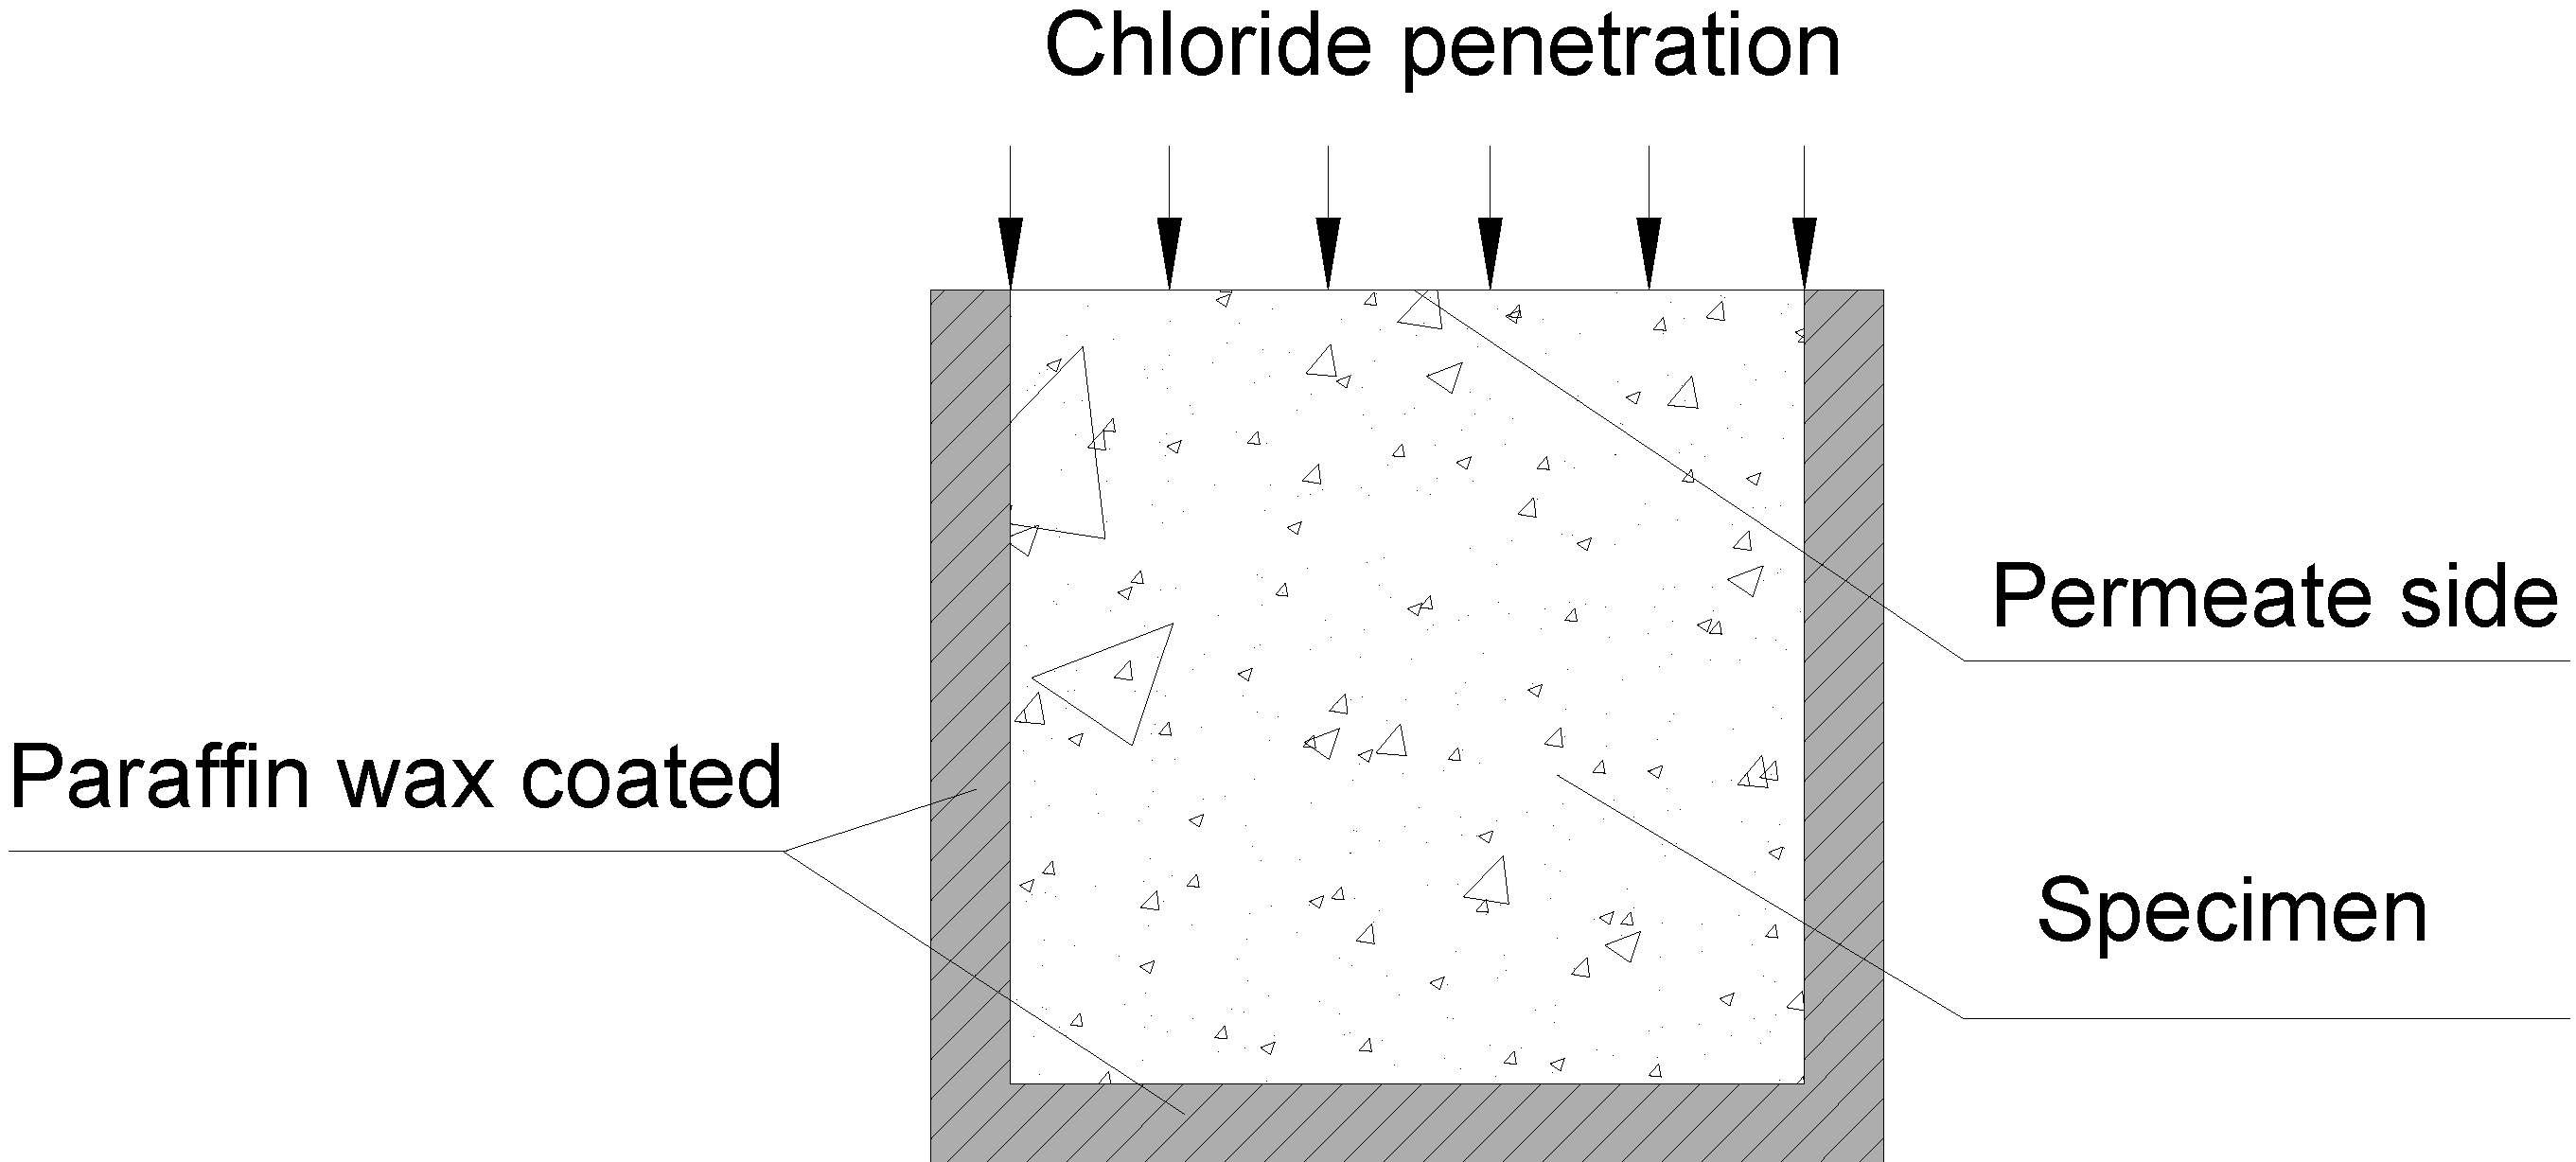
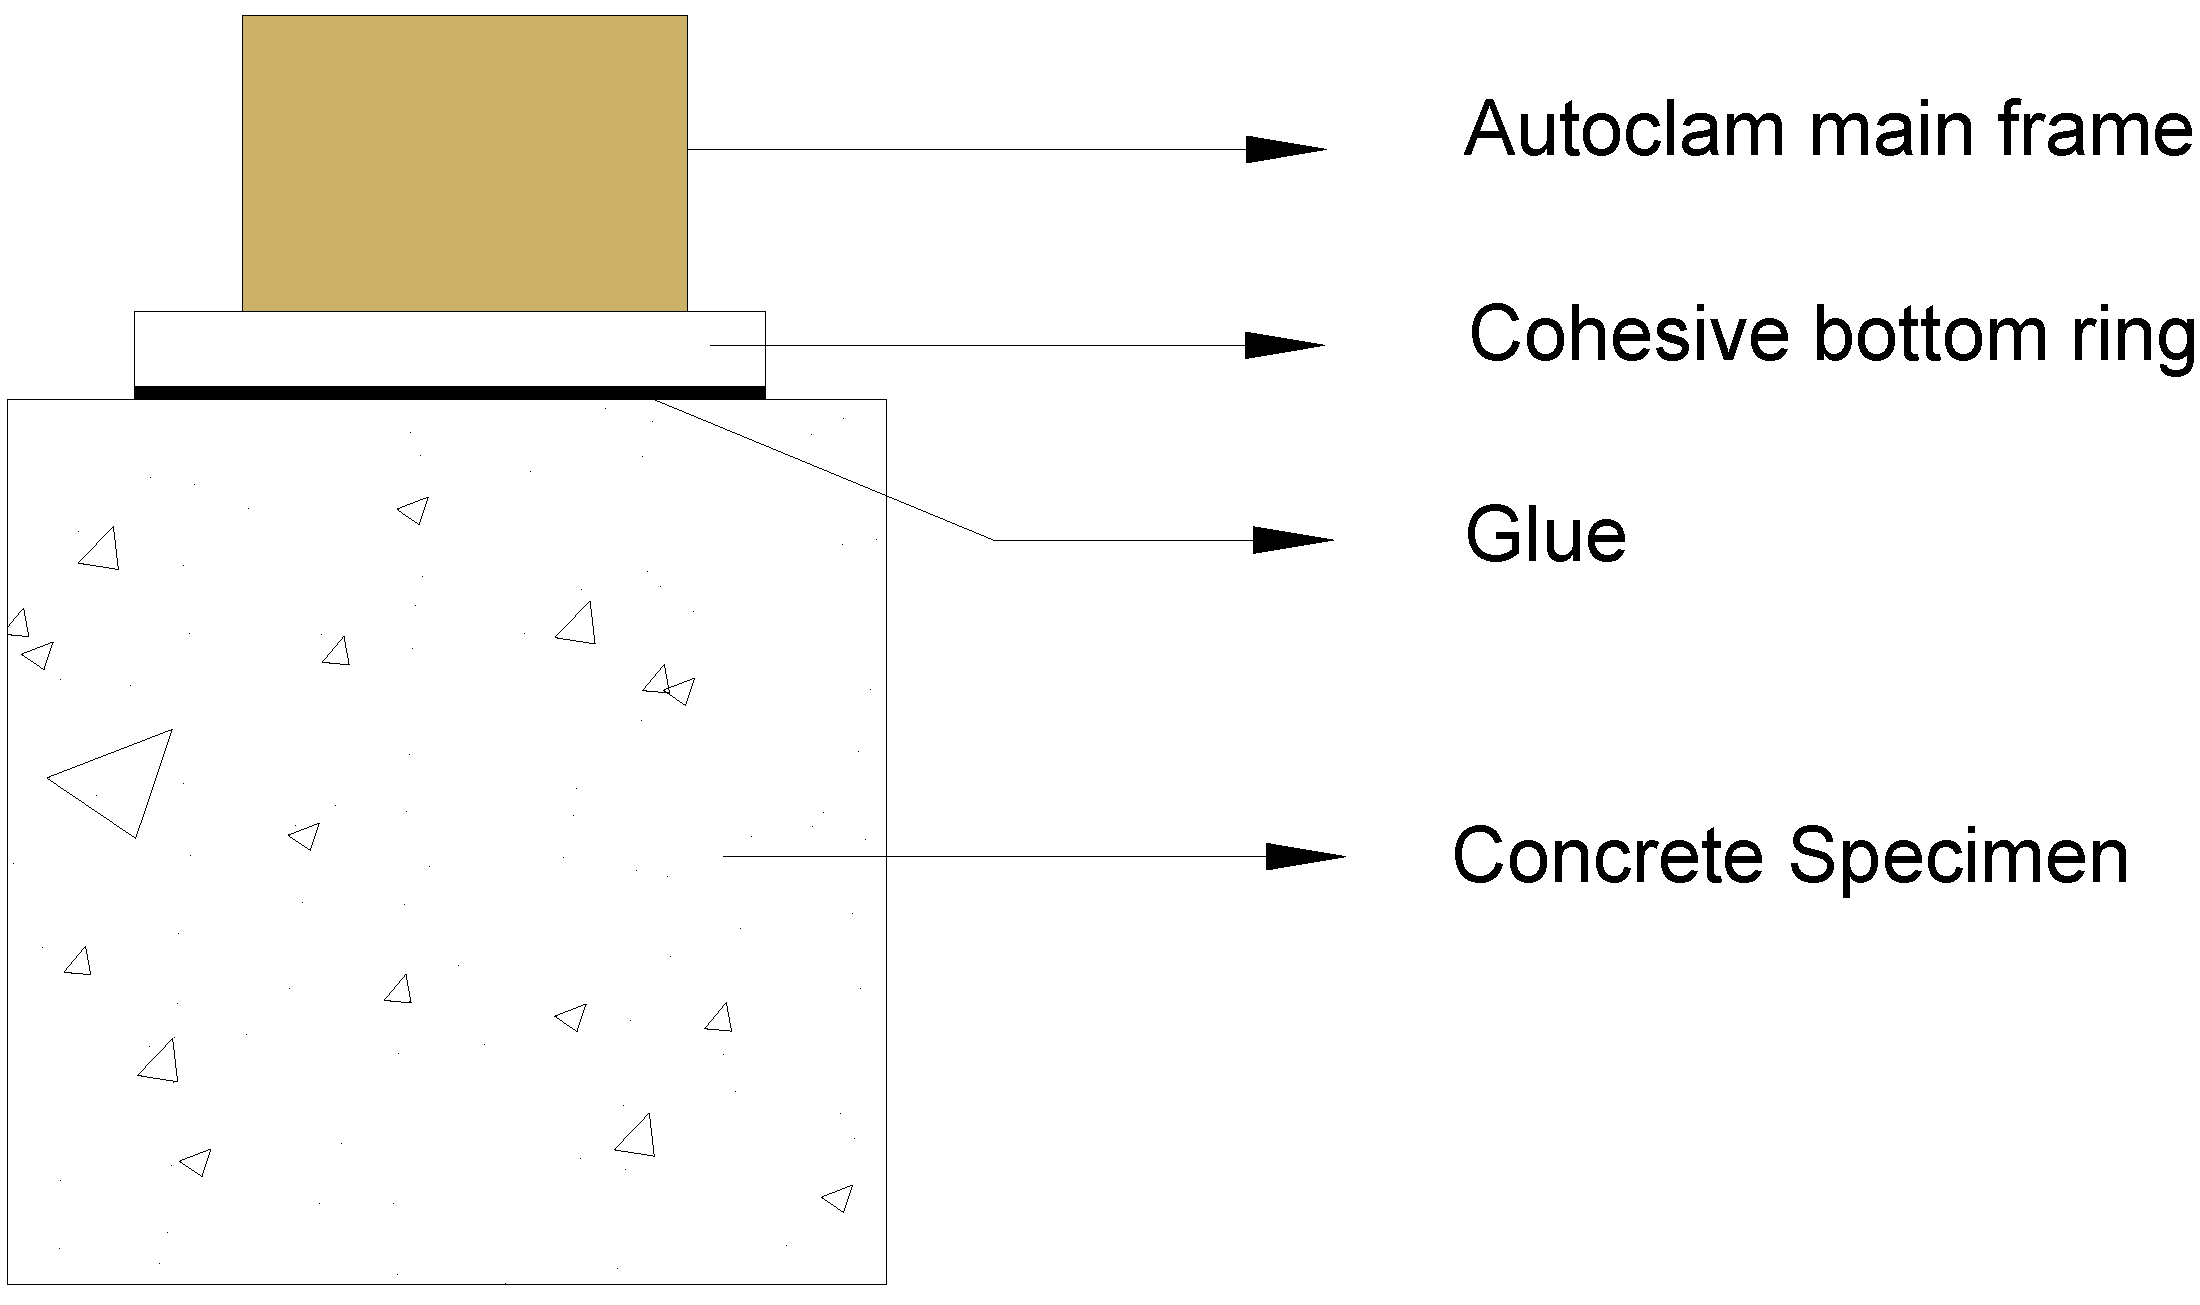
Table 2 depicts the seepage volume of concrete CF15 sample under distilled water-eroding procedure within 15 min, by the method of Autoclam tester stated in
Section 3.4. Due to the instability of the seepage in the early test period, the results data before 5 min are eliminated. Based on the results from 5 to 15 min, the seepage volume is found to be the linear function of square root time. The linear fitting curve of results of CF15 is given in
Figure 2. The
Table 3 summarizes the relations between each of these permeability results of CF15 at 28, 30, 60, 90, 120 and 150 days, respectively.
Surface permeability coefficient of CF0 and CF30 under ultrapure water is also provided in the following
Table 4.
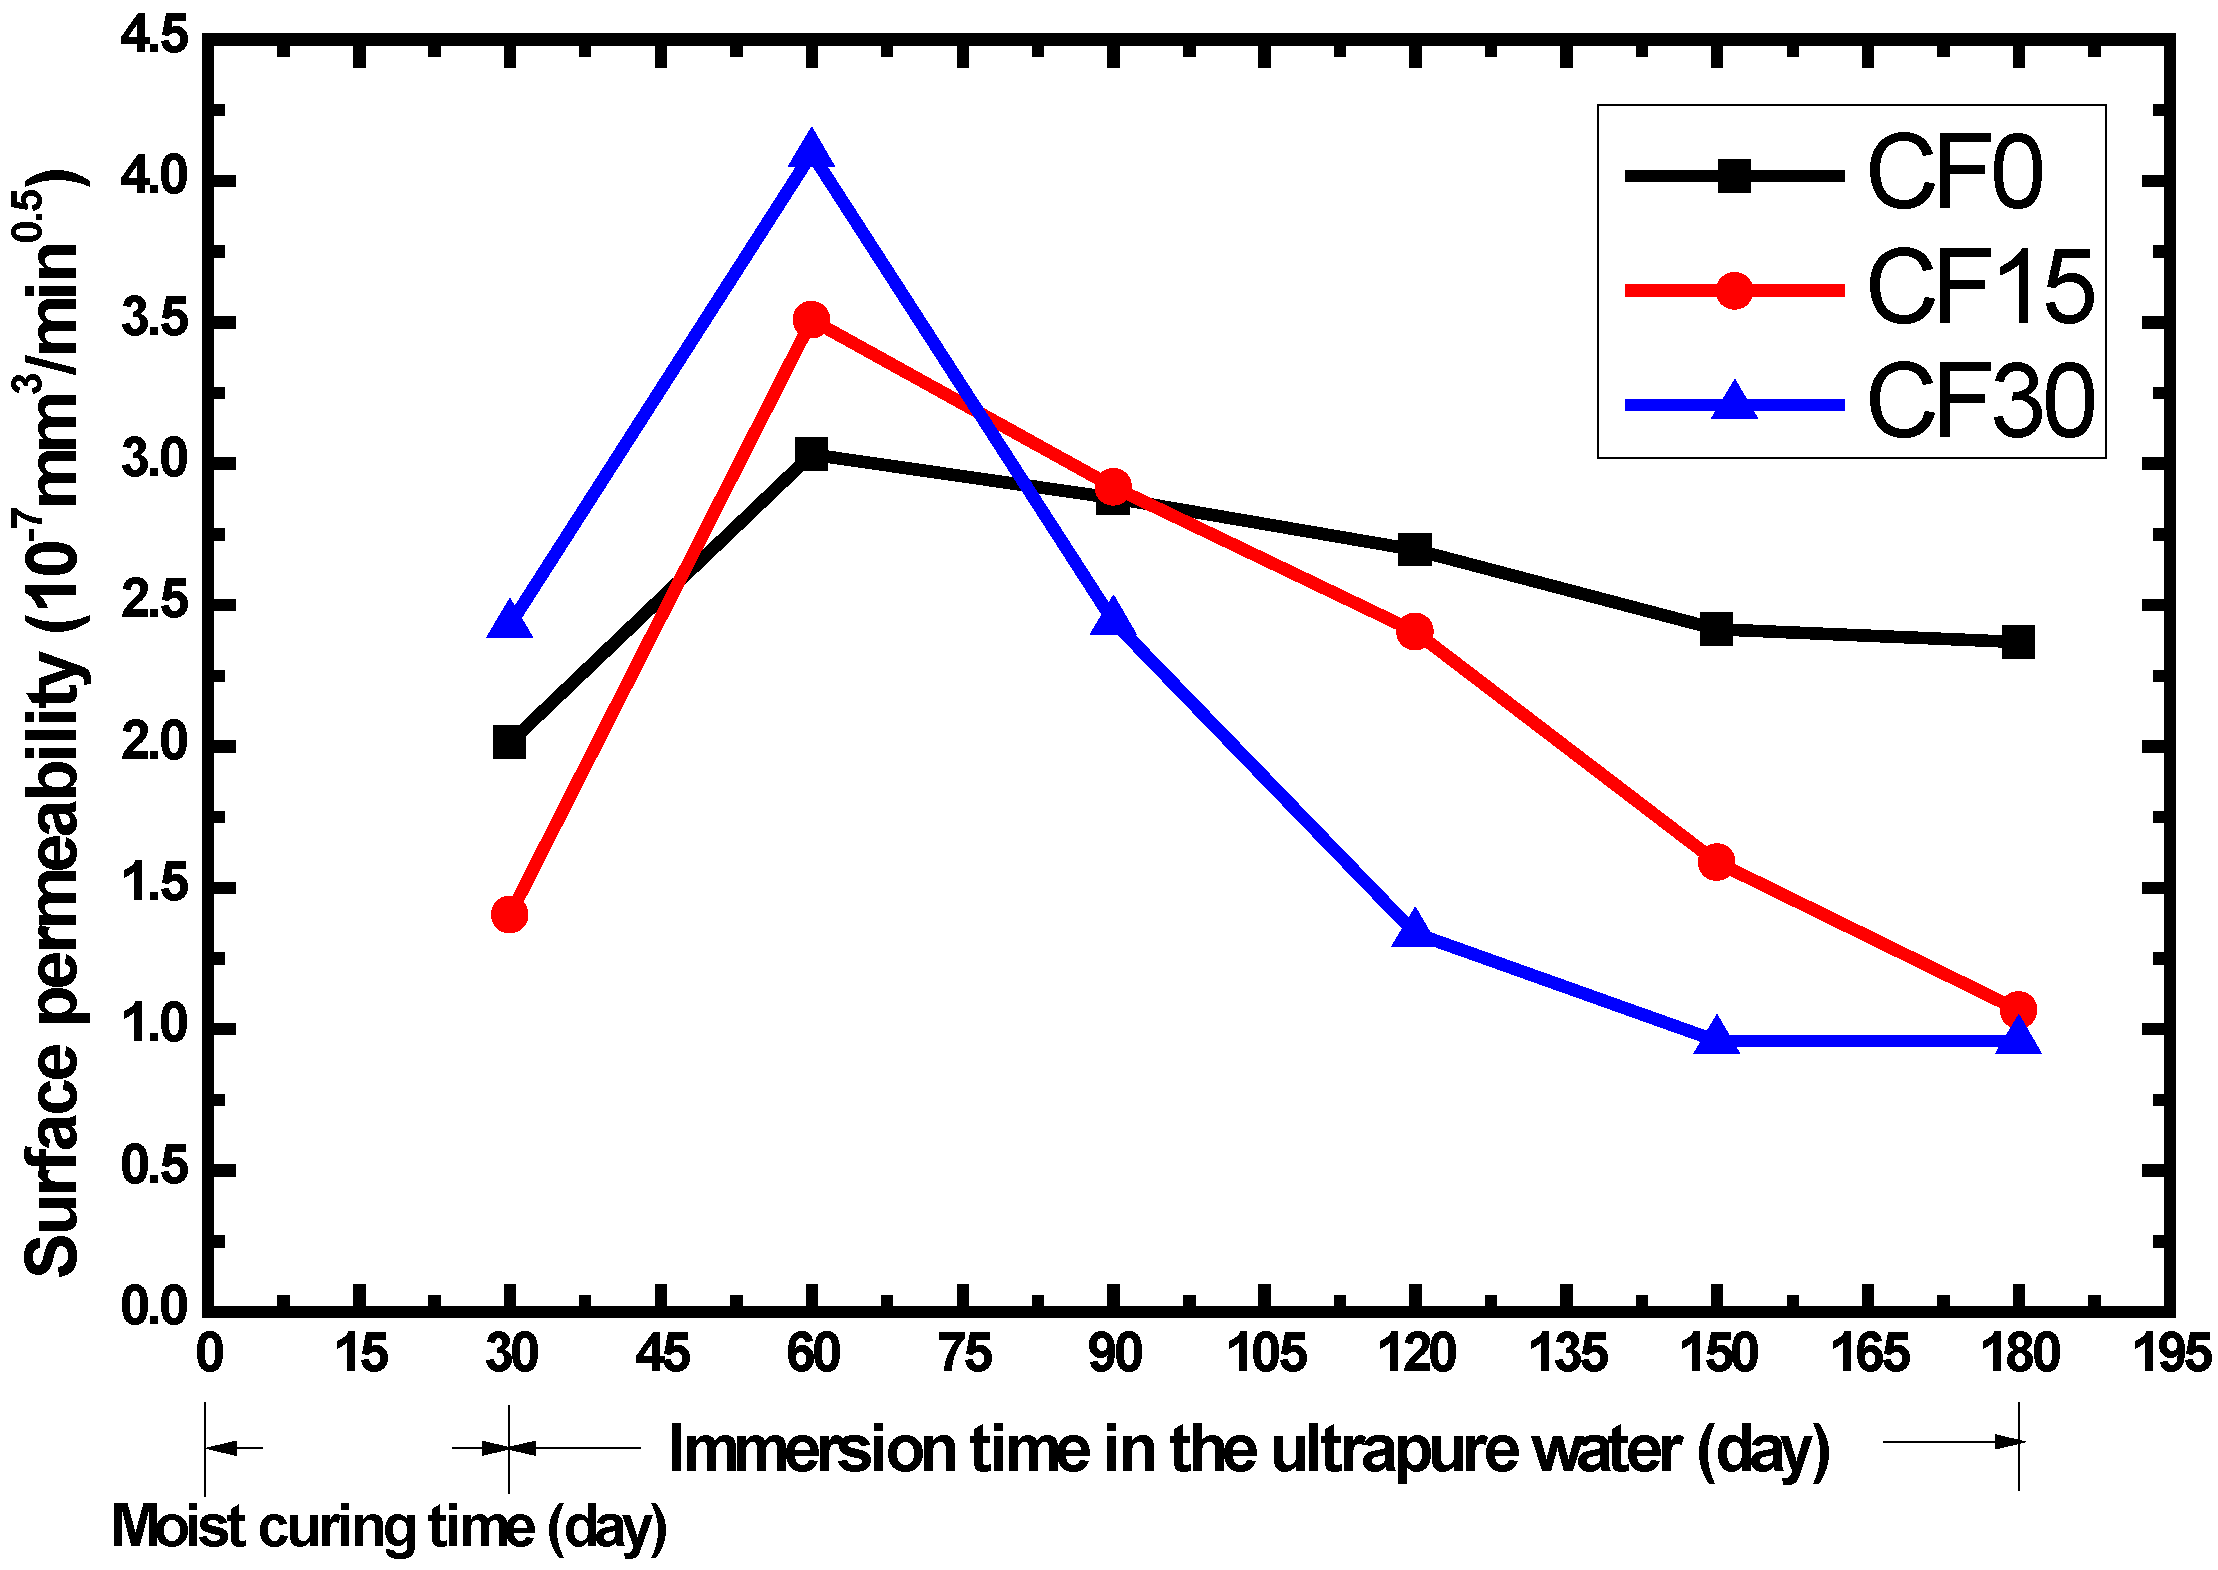
Based on the experimental data provided in
Table 4, the change of surface permeability according to immersion time in distilled water is shown in
Figure 3. It can be seen that fly ash has a significant effect on the water ingress in the surface layer after the curing period. At the time of 60 days, the mixture containing 30% FA replacement showed the highest surface permeability, followed by the concrete with 15% FA addition and the reference specimen, respectively. With the progress of immersion, after the age of 90 days, the case is quite different. The CF30 claims the lowest surface permeability while the reference specimen has the highest.
Table 2.
Seepage volume of concrete CF15 sample under ultrapure water-eroding procedure within 15 min.
Table 2.
Seepage volume of concrete CF15 sample under ultrapure water-eroding procedure within 15 min.
| Immersion time (day) | Water permeability test time (min) |
| 1 | 2 | 3 | 4 | 5 | 6 | 7 | 8 | 9 | 10 | 11 | 12 | 13 | 14 | 15 |
| 0 | 124 | 187 | 264 | 301 | 337 | 370 | 394 | 416 | 441 | 456 | 1598 | 521 | 529 | 543 | 563 |
| 30 | 539 | 805 | 997 | 1125 | 1246 | 1330 | 1423 | 1488 | 1547 | 1598 | 1666 | 1713 | 1756 | 1795 | 1836 |
| 60 | 204 | 353 | 426 | 550 | 602 | 654 | 697 | 799 | 835 | 870 | 900 | 930 | 1017 | 1041 | 1069 |
| 90 | 338 | 571 | 725 | 807 | 876 | 930 | 1002 | 1047 | 1086 | 1121 | 1153 | 1203 | 1229 | 1257 | 1278 |
| 120 | 104 | 154 | 197 | 253 | 288 | 318 | 344 | 370 | 396 | 422 | 442 | 463 | 502 | 520 | 543 |
| 150 | 55 | 89 | 113 | 139 | 161 | 182 | 200 | 221 | 249 | 262 | 271 | 295 | 305 | 319 | 333 |
Figure 2.
Water permeability results of concrete CF15 and their trend line.
Figure 2.
Water permeability results of concrete CF15 and their trend line.
Table 3.
The fitting of the permeability coefficient of CF15.
Table 3.
The fitting of the permeability coefficient of CF15.
| Immersion time (day) | Fitting Curve | R2 |
|---|
| 0 | y = 1.403x + 0.234 | 0.984 |
| 30 | y = 3.509x + 4.893 | 0.996 |
| 60 | y = 2.916x + 3.588 | 0.992 |
| 90 | y = 2.405x − 0.546 | 0.982 |
| 120 | y = 1.590x − 0.784 | 0.994 |
| 150 | y = 1.067x − 0.786 | 0.994 |
Table 4.
Surface permeability coefficient of concrete under distilled water-eroding at different ages.
Table 4.
Surface permeability coefficient of concrete under distilled water-eroding at different ages.
| Sample | Immersion Period (day) |
| 0 | 30 | 60 | 90 | 120 | 150 |
| CF0 | 2.014 | 3.033 | 2.879 | 2.694 | 2.414 | 2.369 |
| CF15 | 1.403 | 3.509 | 2.916 | 2.405 | 1.590 | 1.067 |
| CF30 | 2.429 | 4.098 | 2.442 | 1.339 | 0.958 | 0.958 |
Figure 3.
The effect of fly ash on surface permeability coefficient of concrete.
Figure 3.
The effect of fly ash on surface permeability coefficient of concrete.
Generally speaking, inclusion of fly ash has the following main effects: micro-filler effect and pozzolanic reaction. Pozzolanic reaction occurs from the reaction of Ca(OH)
2 with SiO
2 and Al
2O
3 from fly ash [
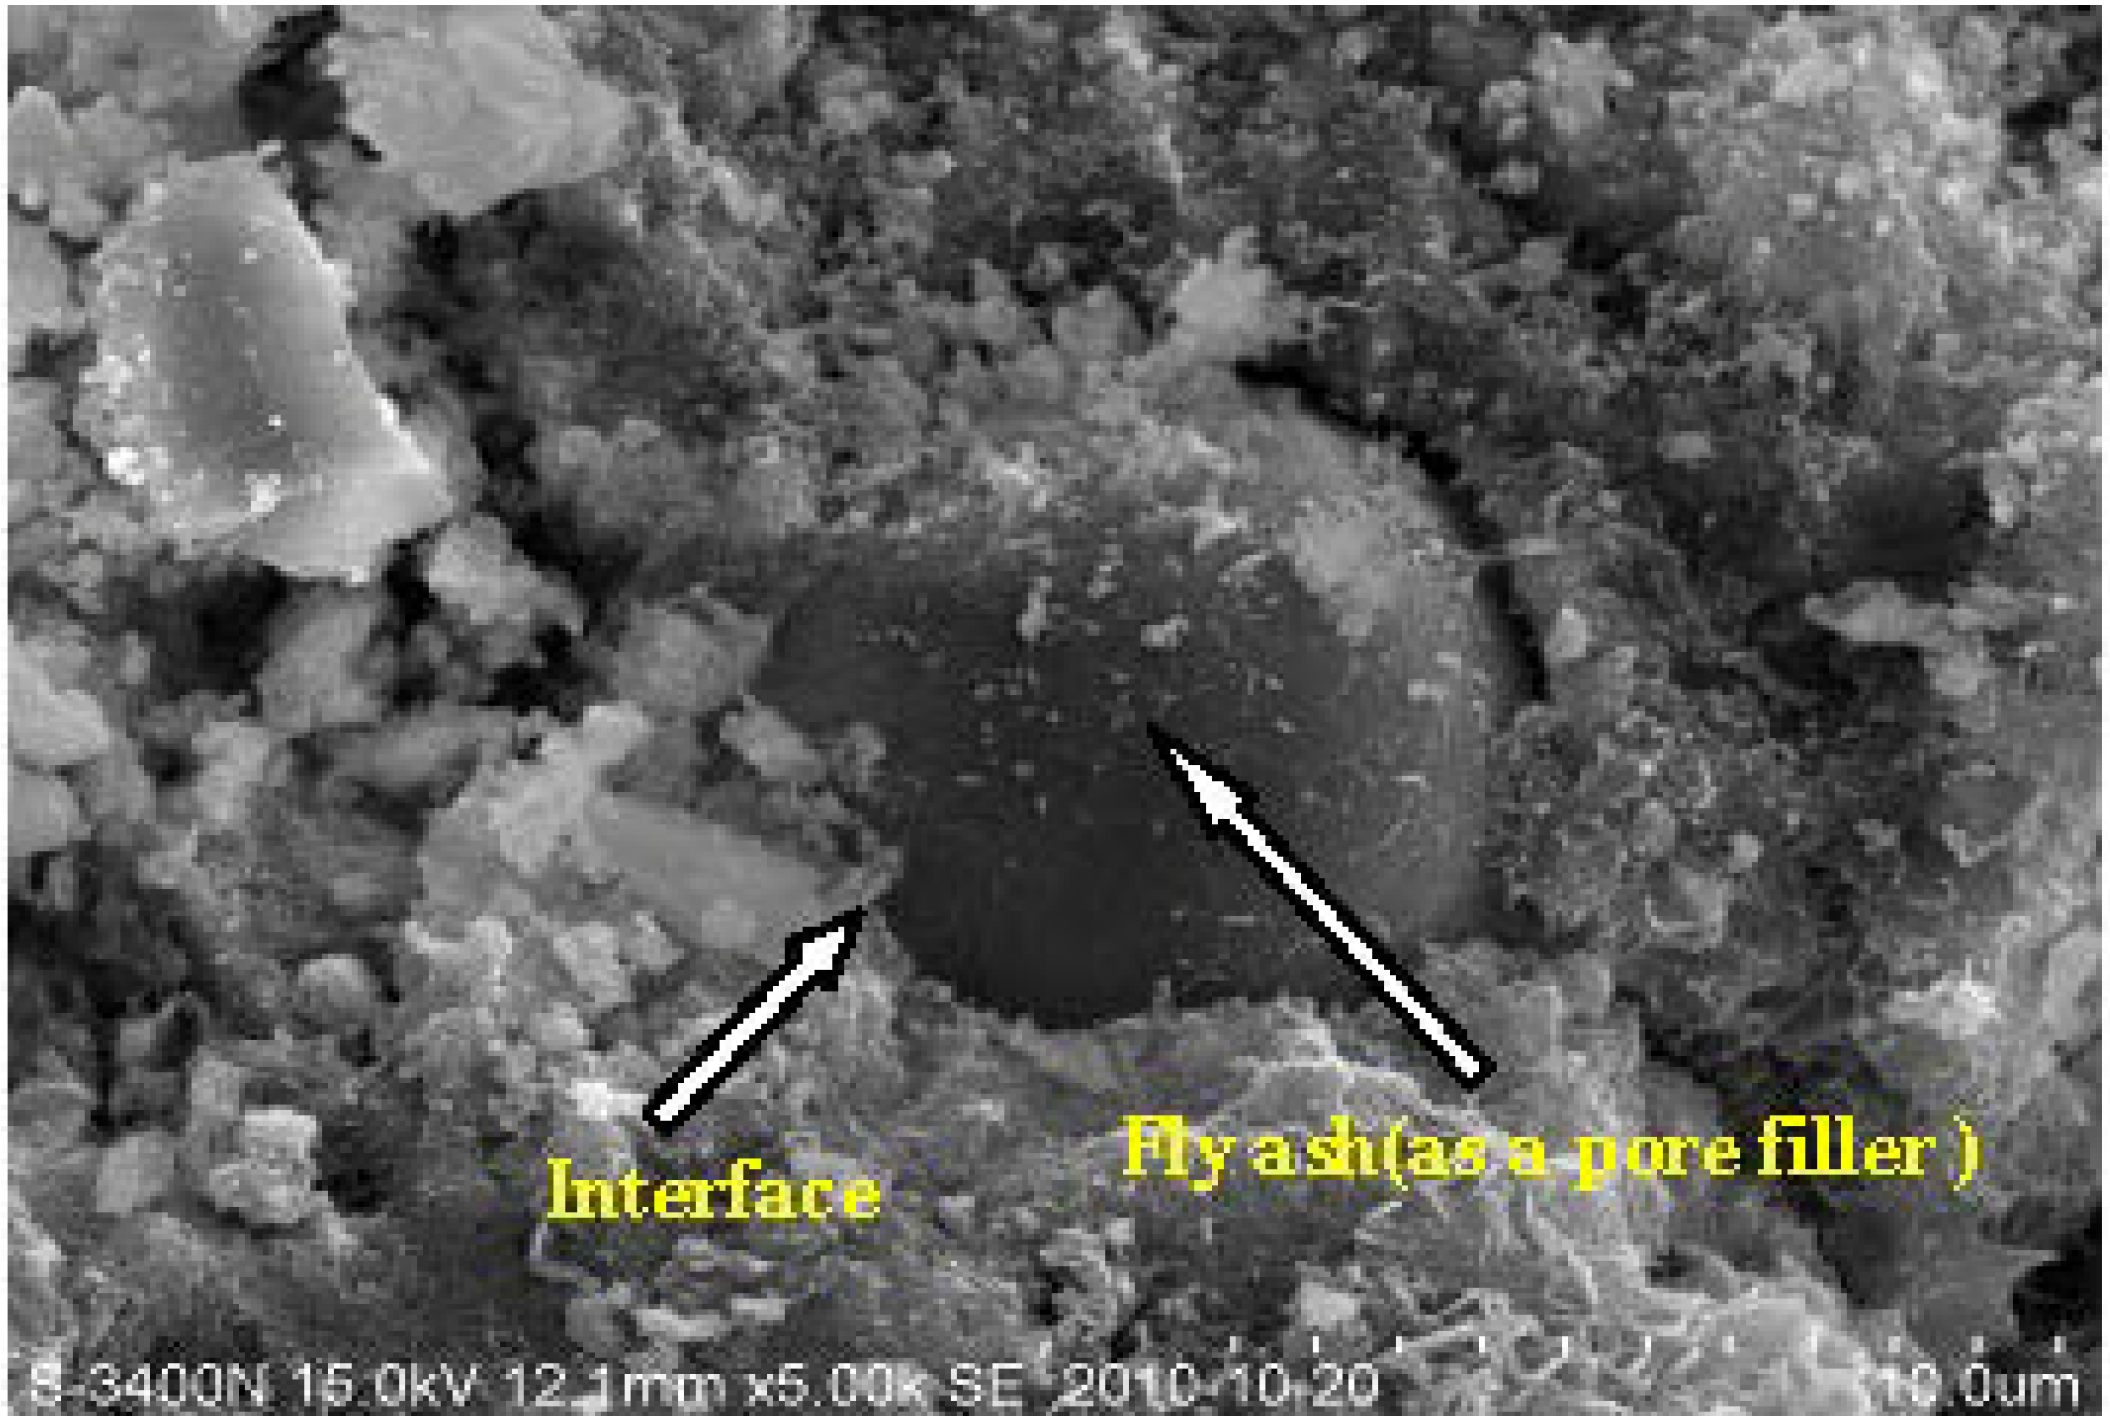
17]. However, pozzolanic reaction of fly ash is not evident in the early hydration ages. Fly ash particles only act as the pore filler (see
Figure 4). Worse still, the cement hydration is postponed by incorporation of fly ash [
32]. An explanation for this is that the Ca
2+ ions in the cement hydration system are attached and fixed to fly ash particles [
33]. The reduced availability of Ca
2+ ions prolongs the nucleation of CH or CSH. Therefore, in the early ages, due to the low levels of the Ca
2+ ions caused by fly ash replacement, the progress of cement hydration in this period is slow and incomplete. Moreover, the delay of hydration is founded to be even more remarkable with an increase in fly ash, which hinders the pozzolanic reaction due to the lack of hydrate product Ca(OH)
2 [
34].
Figure 4.
Scanning electron image of specimen C15 hydrated for 28 days showing morphology of fly ash particle.
Figure 4.
Scanning electron image of specimen C15 hydrated for 28 days showing morphology of fly ash particle.
With the immersion process, secondary hydration of fly ash produces a large amount of CSH, which reduces the large capillary pores sizes and thus enhances the high resistance to water ingress. A series of papers have pointed out that the permeable nature of concrete goes hand in hand with the size of capillary pores [
35]. Incorporation of pozzolanic materials leads to the pore structure densification of the concrete and the CSH gels/aggregates’ interface, leading to a reduction in the porosity of capillary pores, to refine the size of pores and to increase their sinuosity.
2.3. Influence of Fly Ash on the Pore Structure for Surface Layer of Concrete
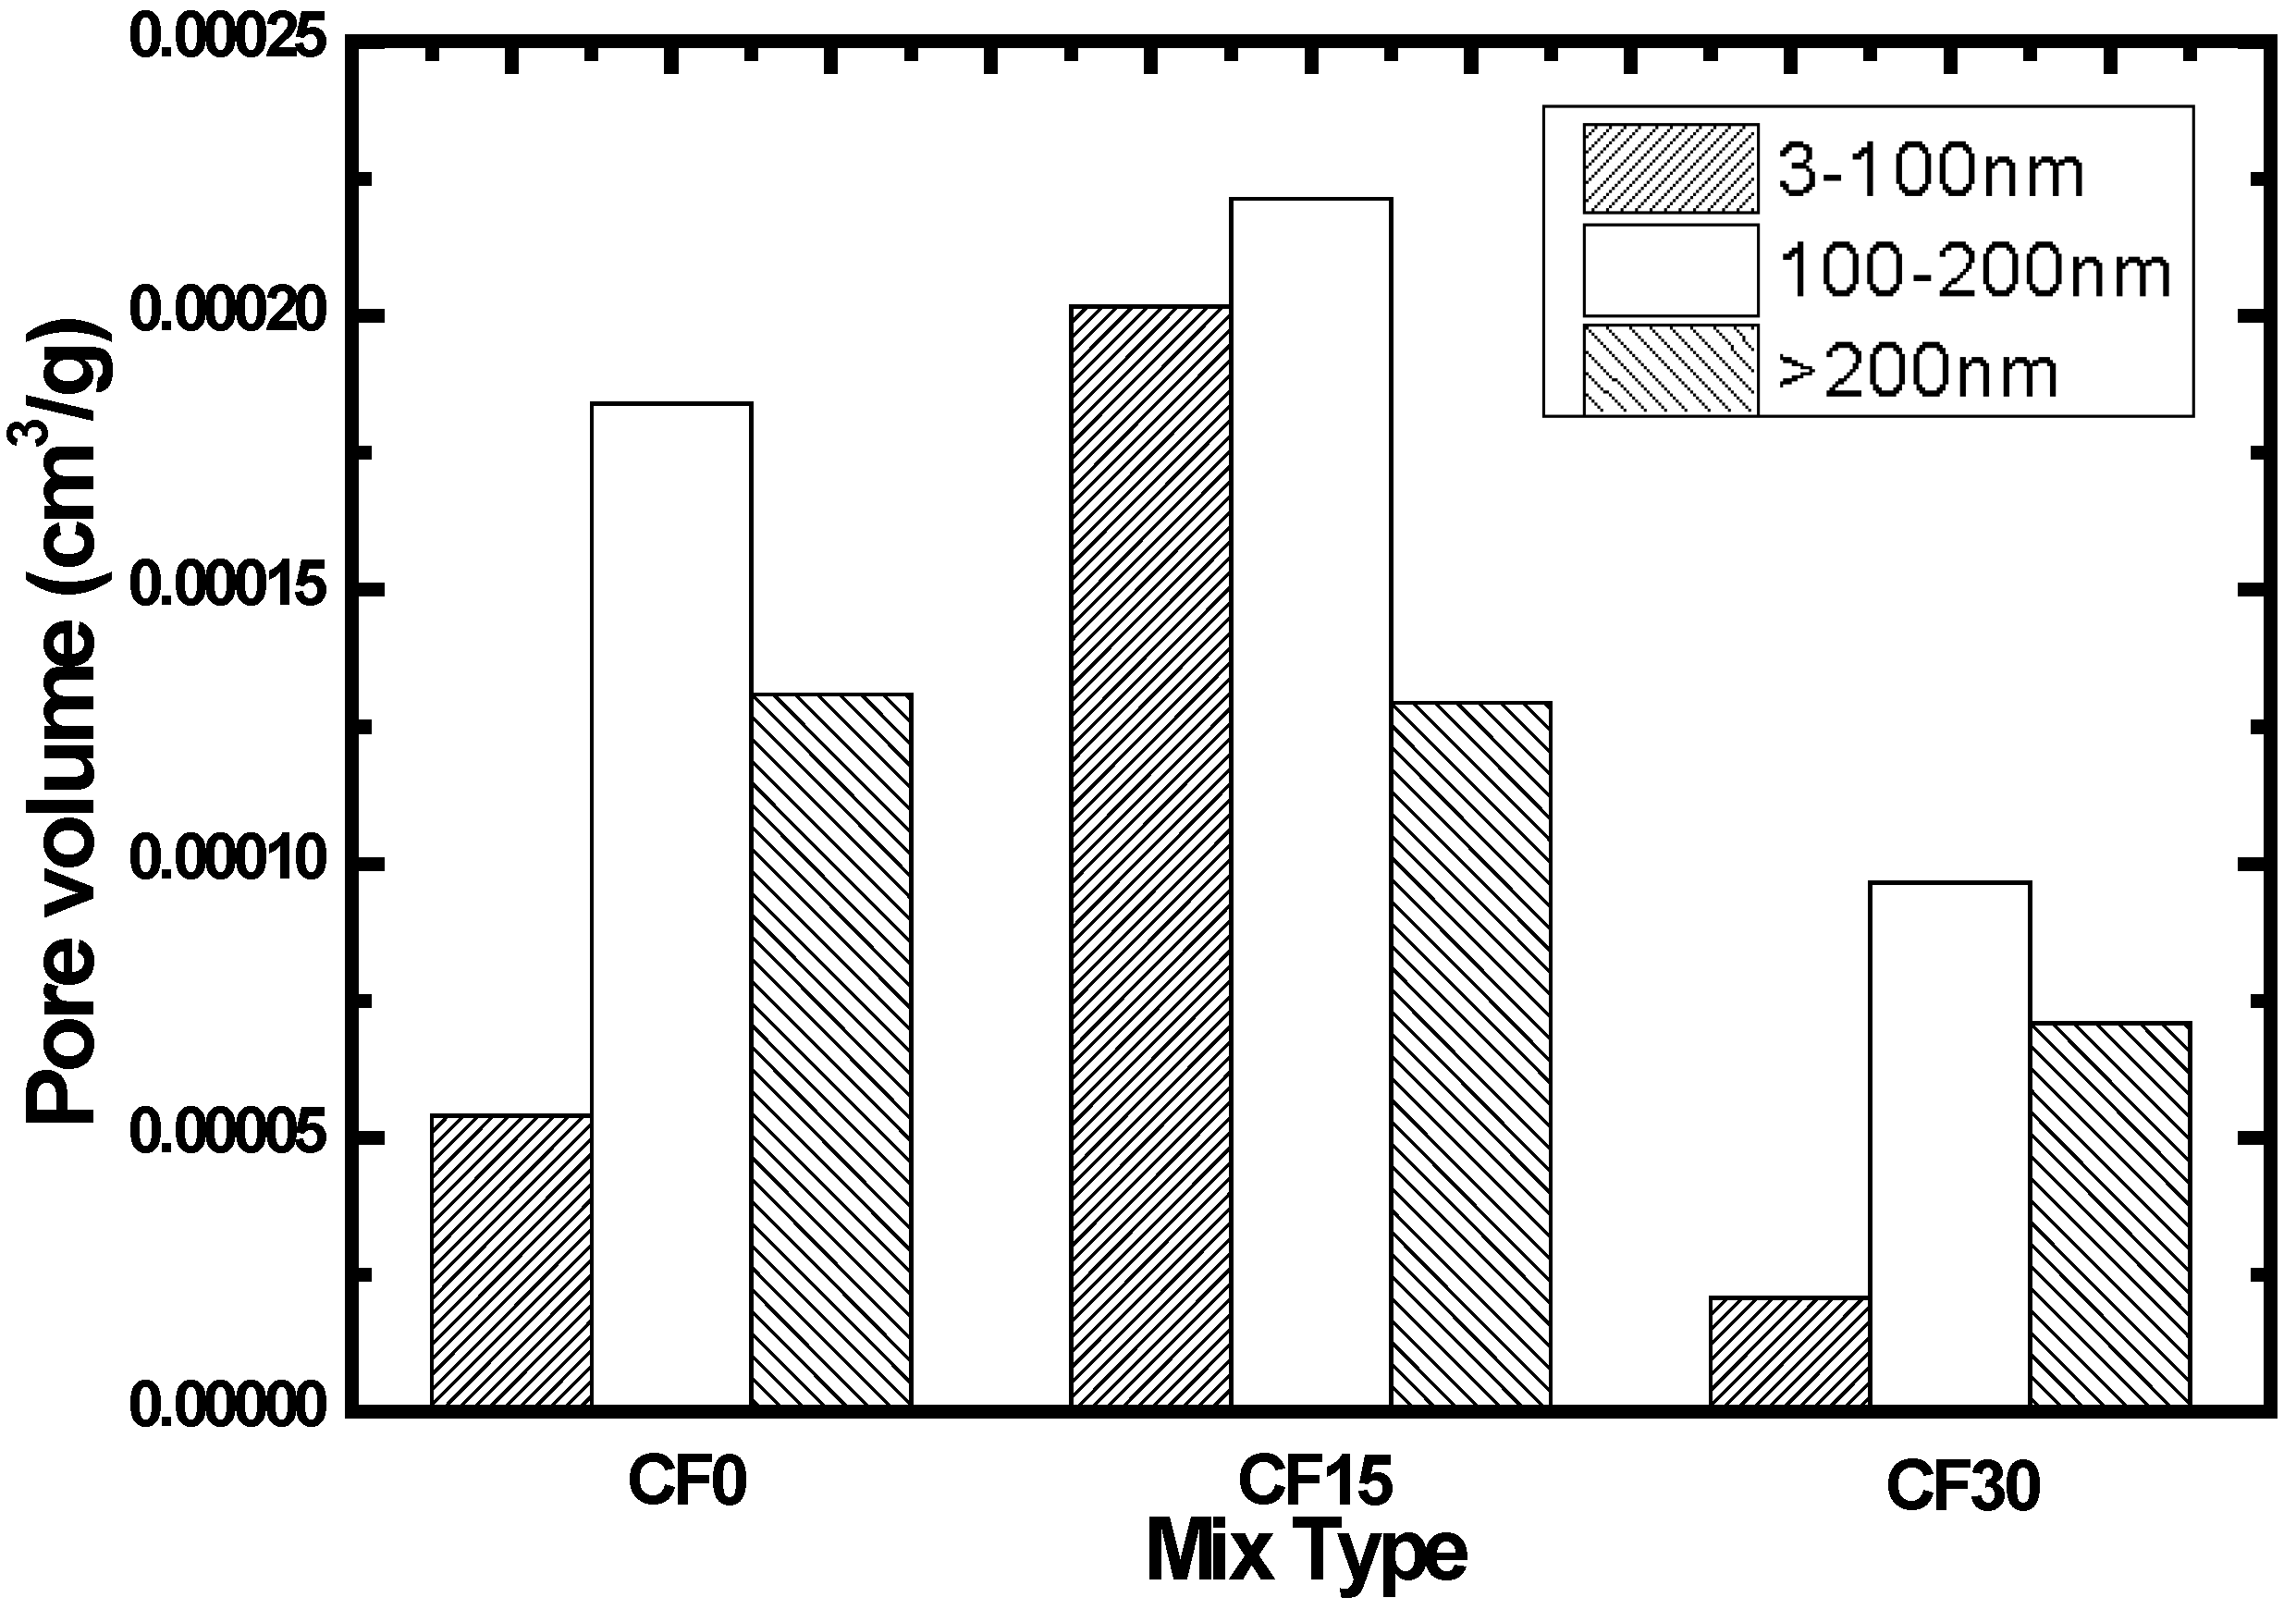
Results of the pore size distribution for fly ash concrete that was immersed in the distilled water at 90 days is given in
Figure 5. Based on the results observed from
Figure 5, the pore volume (<100 nm) of CF15 is found to increase as compared to the reference specimen (CF0), while the pore volume (>200 nm) does not show any variations. It can be explained by the presence of fly ash which leads to filling of the pores inside the concrete. As regards the specimen CF30, the pore volume (>200 nm) declined significantly compared to the CF0 and CF 15, which can be attributed to the strong activation of pozzolanic material when concrete has been immersed for 90 days. Secondary hydration must therefore occur in order to form calcium silicate hydrate. In this regard, the concrete samples become denser and in turn the impermeability is improved.
Figure 5.
Pore size distribution of concrete sample immersed in ultrapure water at 90 days.
Figure 5.
Pore size distribution of concrete sample immersed in ultrapure water at 90 days.
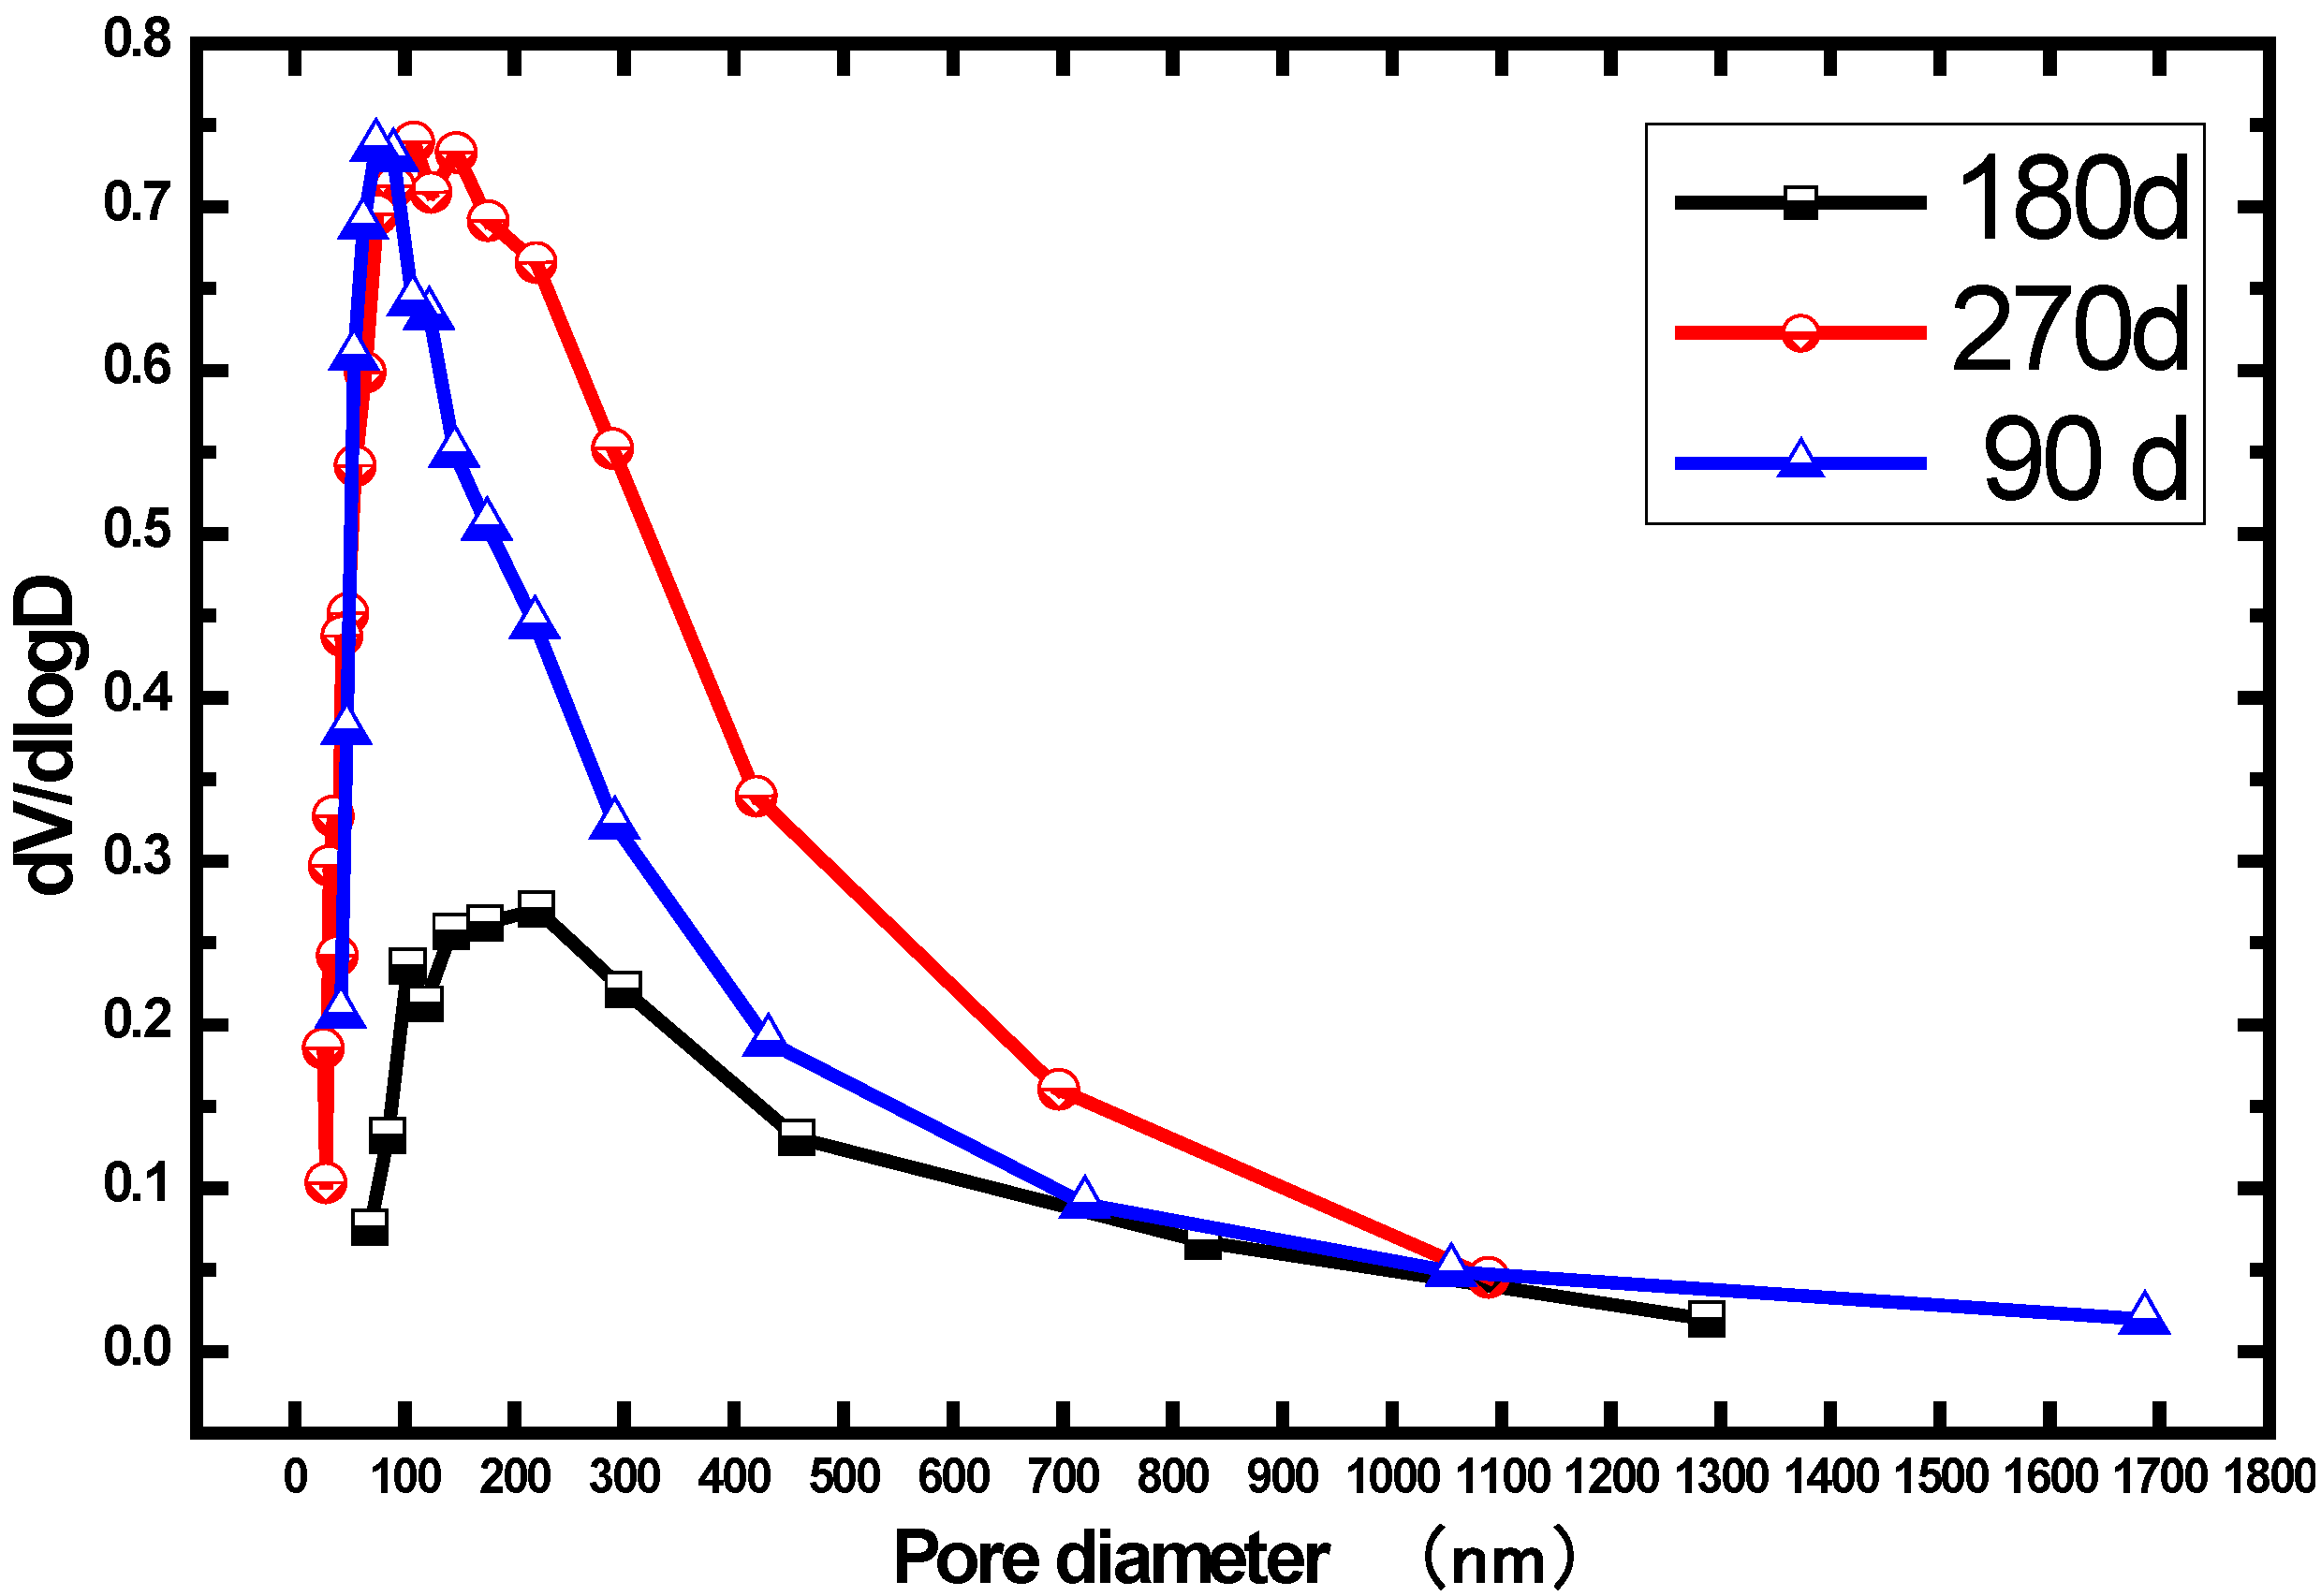
Figure 6 provides us the information of pore size distribution and differential curves for CF15 at different ages. According to the studies outlined in [
9,
36], pores whose diameter are 100 nm are defined as threshold, which significantly determines the permeability of concrete. When the pore size exceeds the threshold, the concrete matrix tends to be more permeable [
9]. Hence, the pores (> or <100 nm) are discussed in this research. At the age of 180 days, the amount of pores with all diameters (> and <100 nm) is least, in comparison to the 90 days. An explanation for this lies in the denser pore structure from the pozzolanic reaction or secondary hydration of fly ash. At the time of 270 days, the amount of pores with all diameters (> and <100 nm) surpasses the 180 days. In addition, the amount of pores smaller than 100 nm are nearly the same as compared to that of 90 days, but the amount of pores larger than 100 nm is considerably greater than the 90 days. This phenomenon can be described via a mechanism of progressive leaching of the calcium hydroxide and massive decalcification of CSH hydrates, resulting from water dissolution [
37,
38]. Consequently, the macroporosity is thought to be increased [
39].
Figure 6.
Pore size distribution of concrete CF15 sample immersed in distilled water.
Figure 6.
Pore size distribution of concrete CF15 sample immersed in distilled water.
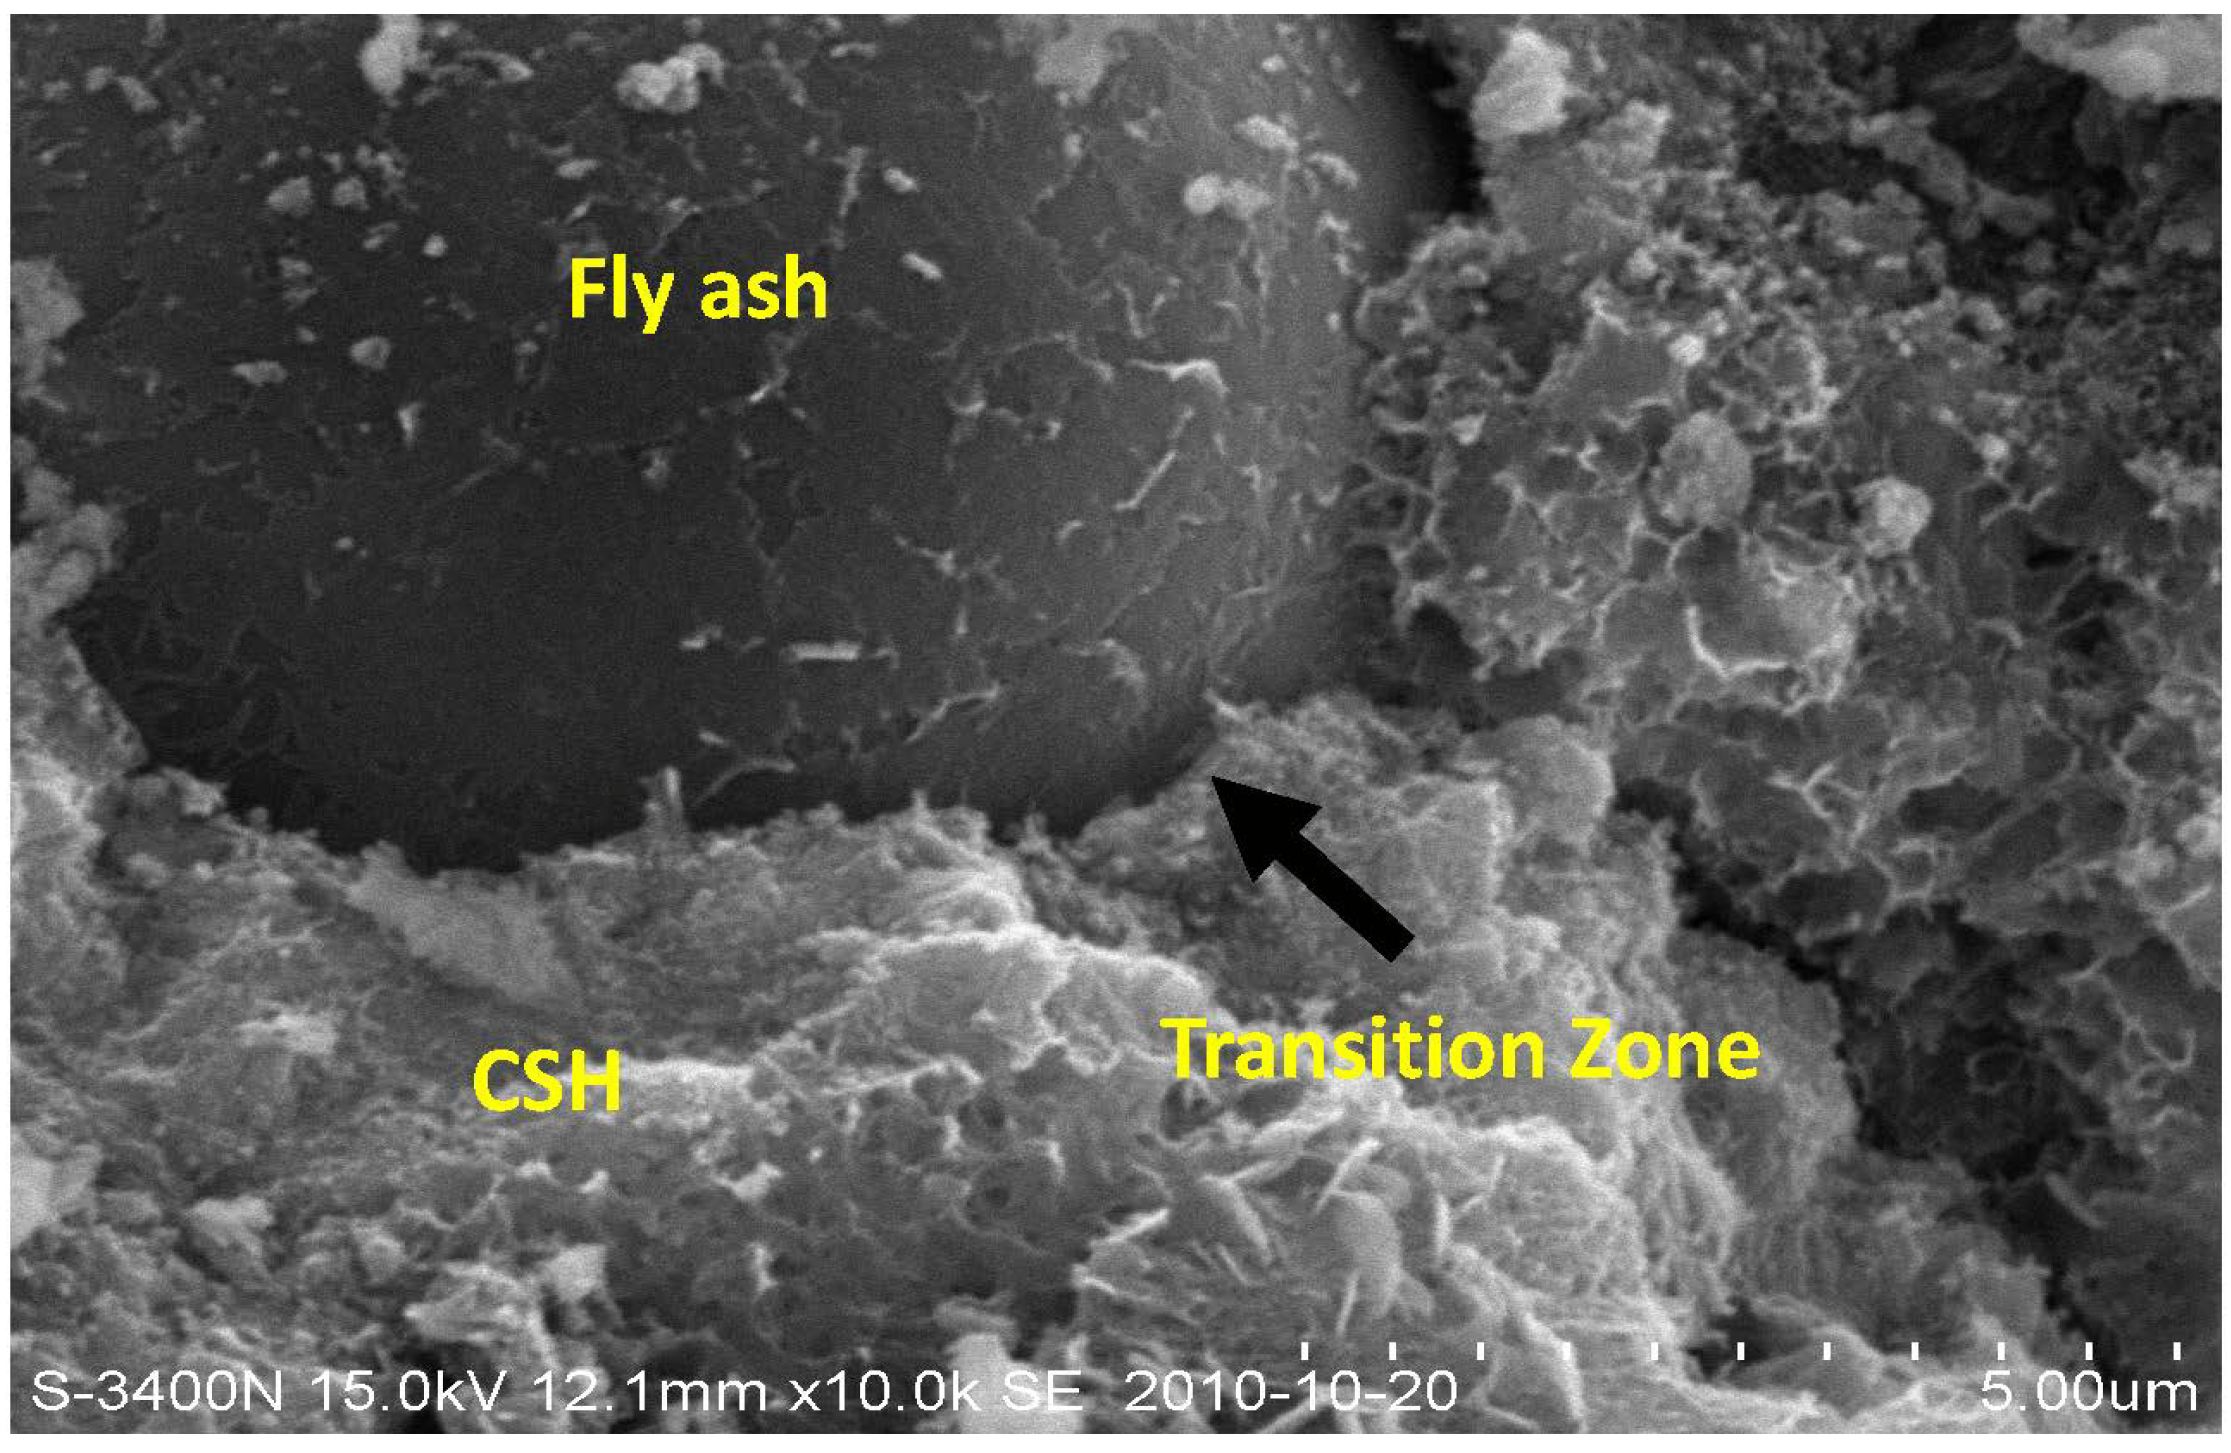
Microstructure of concrete CF15 at 90 days of immersion is presented in
Figure 7. With the process of hydration, the fly ash particle fills in the space among the calcium silicate hydrate (CSH) gels, which blocks the capillary pores and hence improves the density of concrete. Meanwhile, due to the secondary hydration, the product CSH fills in the micropores of concrete, which results in a denser matrix. It is generally known that permeability and erosion often takes place in the interior pores of concrete. In the process of water transport in concrete, the hydration product gradually dissolves in the water. Given that concrete is rather dense and water-resistant, the rate of permeability is thought to slow down.
Figure 7.
SEM picture of concrete containing 15% fly ash at 90 days of immersion.
Figure 7.
SEM picture of concrete containing 15% fly ash at 90 days of immersion.


