3.1. Layer Formation Mechanisms
The possibility of producing porous layers on the surface of glass-ceramic substrates has been demonstrated when the substrate is machined by means of pulsed lasers in the nanosecond range [
22,
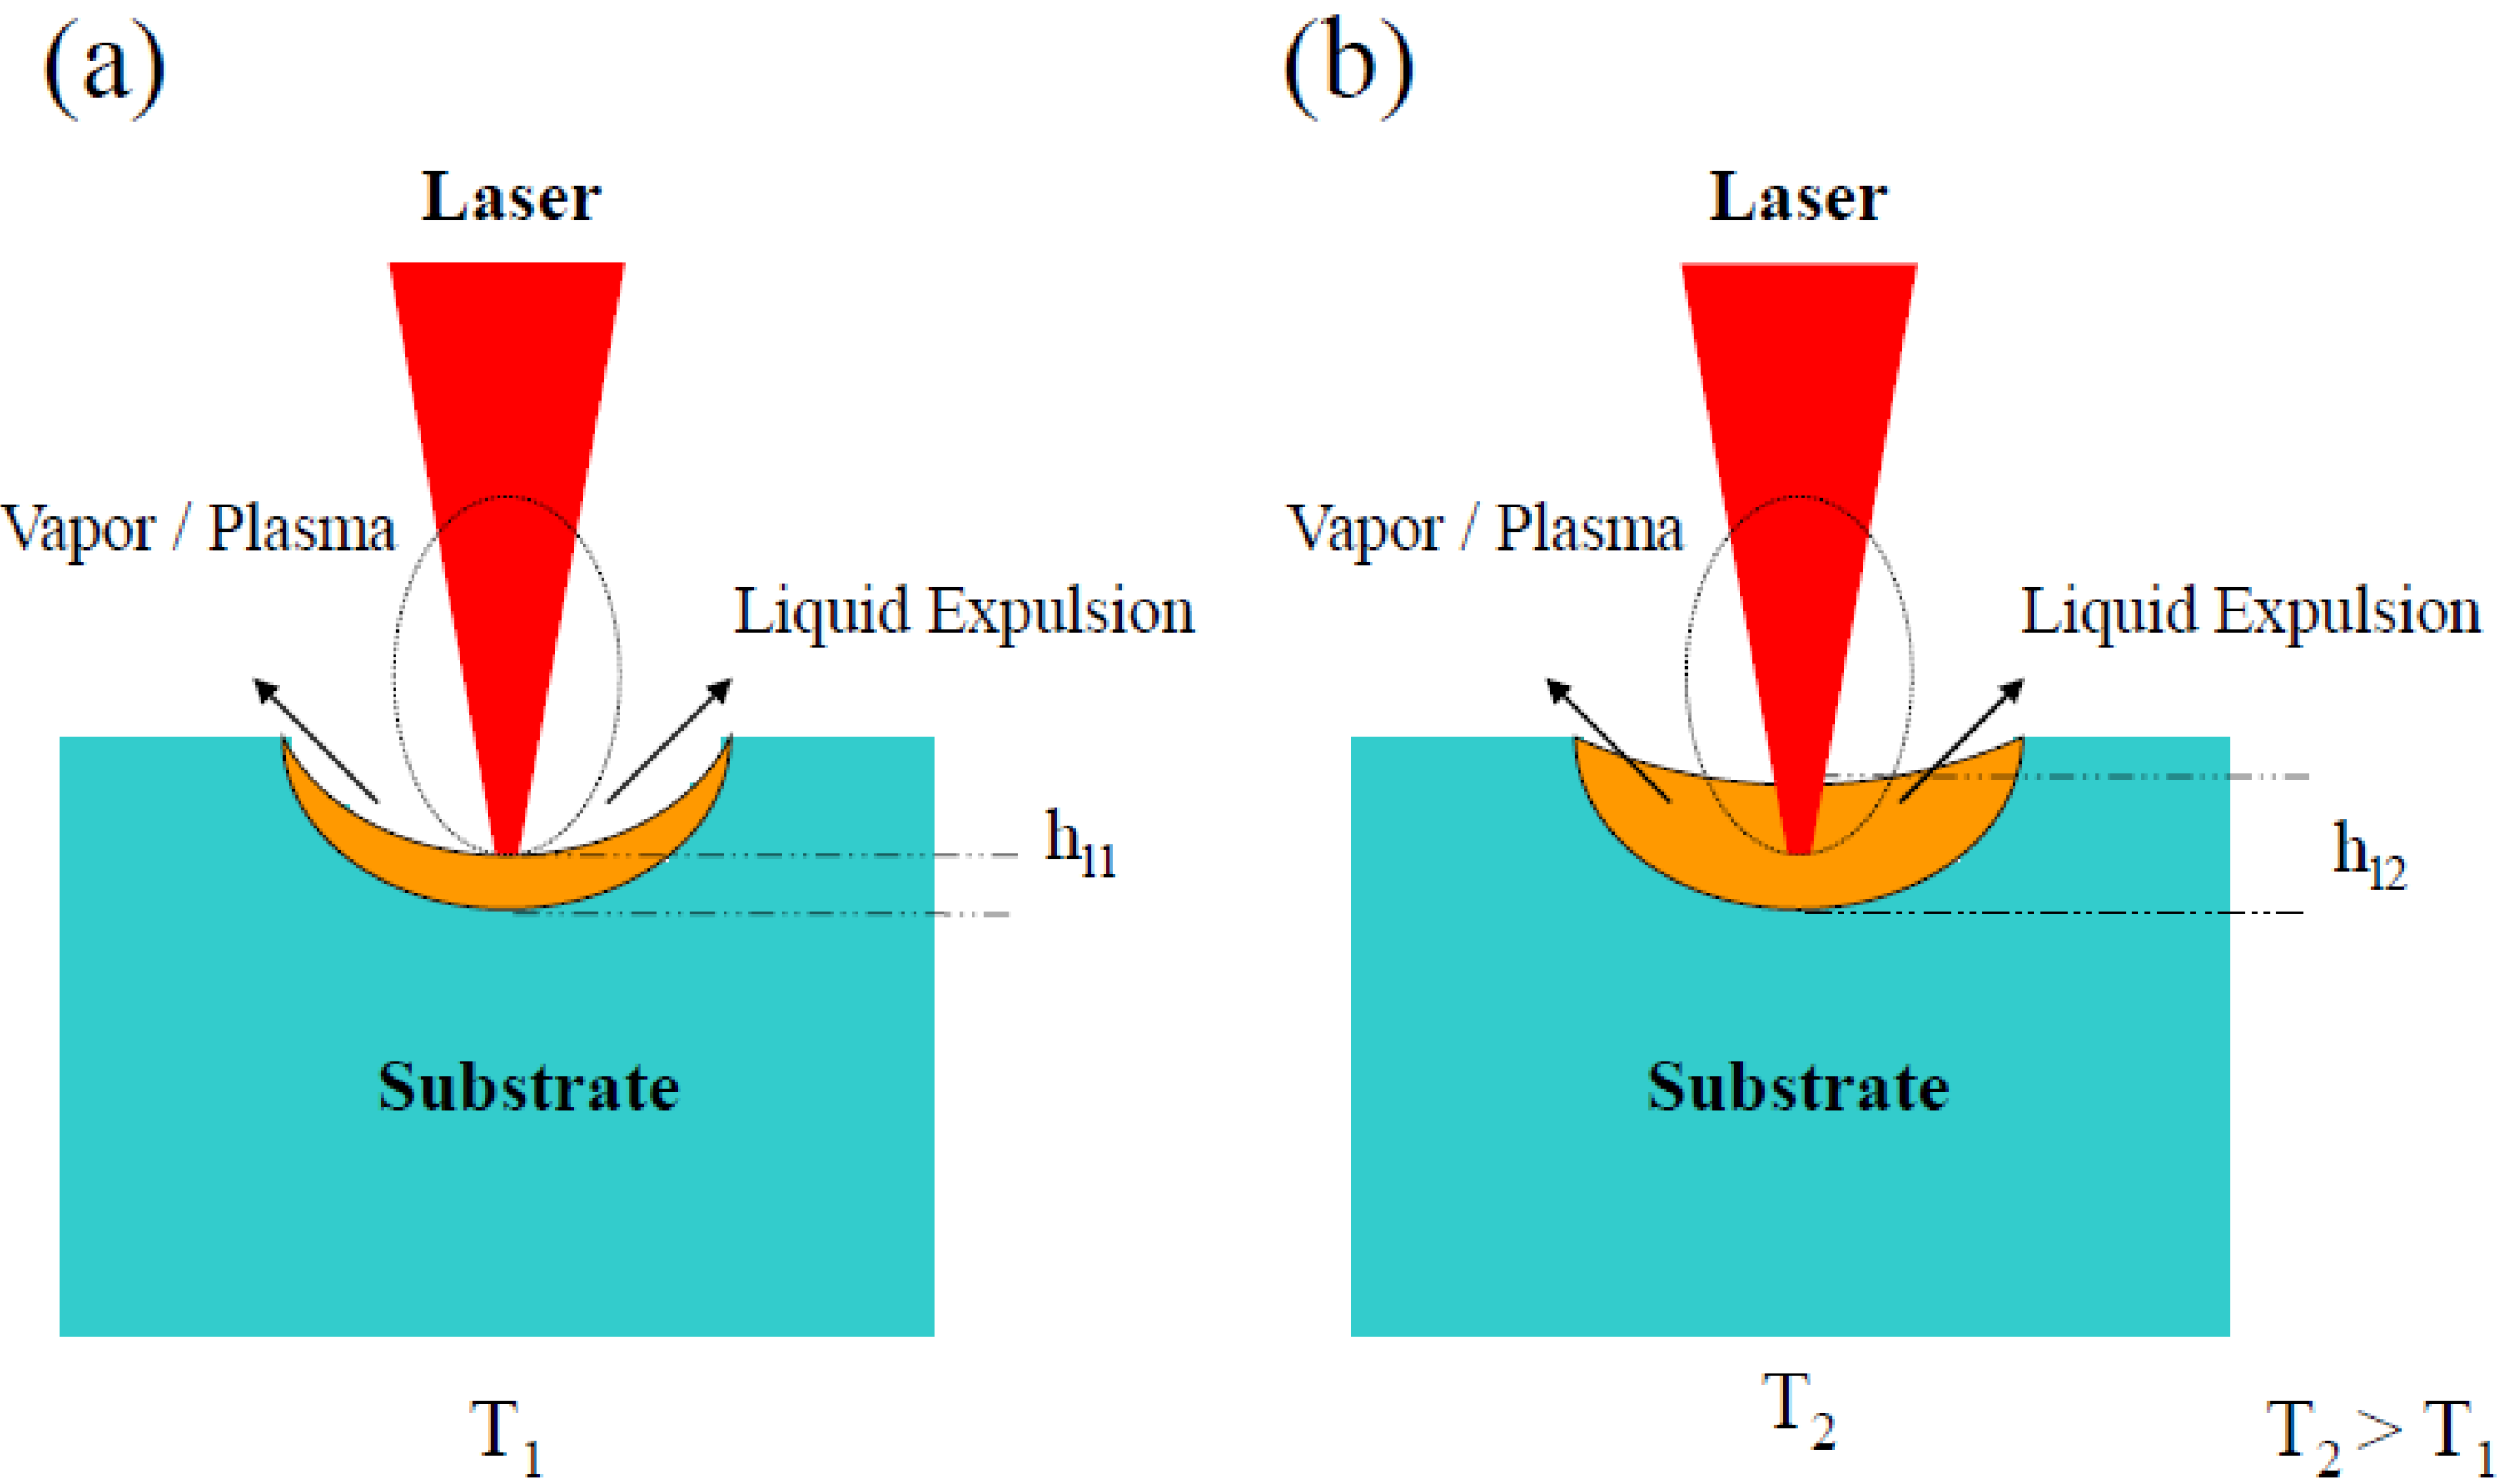
23]. Laser ablation in the nanosecond range is a photothermal-mechanical process so that the material is removed by the thermal mechanisms activated by the laser beam. They essentially consist of the absorption of the laser energy and subsequent evaporation and ejection of the material. During the ablation process, a thin layer of material in liquid-phase is formed in the interaction zone [
2],
Figure 1a. The recoil pressure produced in the process squeezes the liquid out from the interaction zone and the material is removed from the surface via evaporation and liquid-phase expulsion. The thickness of liquid phase,
hl, and recoil pressure,
Prec, can be expressed as [
2]:
where
D is the thermal diffusivity, Δ
Hv the enthalpy of vaporization, and
Ia the absorbed laser intensity.
Since the variations of thermal diffusivity and enthalpy of vaporization with temperature are negligible [
24,
25], the thickness of the molten layer and the recoil pressure depend mainly on the absorbed irradiance.
The formation mechanisms differ depending on the laser wavelength used. When the laser wavelength is in the near infrared range (NIR) the layer formation depends on the substrate temperature. At room temperature or for temperatures lower than 300 °C the laser processing generates a groove on the surface. Nevertheless, by increasing the substrate temperature, the vibrations of the ions in the lattice also increase. Taking into account that the melting temperature of the glass-ceramic is about 1300 °C, as temperature increases the material acquires a pseudo-plastic character. This behavior together with the fact that the ablated particles ejected from the interaction zone shield the incoming irradiation produce a diminution in the effective irradiance and therefore in the recoil pressure, resulting in an increase of the thickness of the layer in liquid-phase present in the interaction zone,
Figure 1b. The pressure exerted by the pulsed laser beam onto the molten interaction zone produces an air bubble generation inside the layer which leads, after cooling, to the generation of the porous layer.
Figure 2a,b shows the frontal and cross-section view of the layer obtained by processing at 600 °C. In this case, the porous layer can only be produced at low scanning speeds, 1 mm/s.
Figure 1.
Scheme of ablation process and molten layer of thickness hl formed in the interaction zone at room temperature T1 (a) and at high temperature T2 (b). The thickness increases when the surface temperature of the glass-ceramic substrate is heated.
Figure 1.
Scheme of ablation process and molten layer of thickness hl formed in the interaction zone at room temperature T1 (a) and at high temperature T2 (b). The thickness increases when the surface temperature of the glass-ceramic substrate is heated.
The formation of the porous layer is also possible when the laser wavelength is in the green or in the UV range. In this case, the formation mechanisms are in relation with the variation of the absorbance of the glass-ceramic substrate with the wavelength. The absorbance of the glass-ceramics substrate decreases with the wavelength [
23]. In particular, the optical absorption coefficients, α, for 355 and 532 nm are 62.13 and 28.37 cm
−1, 17 and 8 times greater than for 1064 nm, the value of which is 3.52 cm
−1. As the absorption coefficient increases the absorbed irradiance
Ia and the absorbed power per unit of volume (1 −
R)·α·
Ia are higher. Since the values of diffuse reflection
R for 1064, 532 and 355 nm are 0.94, 0.96 and 0.87 [
23], this power density is about 17.52, 31.77 and 68.67 GW/cm
3 respectively. According to the Equations (3) and (4), when the substrate processing is carried out with a shorter wavelength the pressure increases and a diminution in the thickness of the layer in liquid-phase is produced. Furthermore, the surface temperature can be expressed as [
6]:
where
,
is the pulse width,
f the working frequency,
D the thermal diffusivity and
k the thermal conductivity.
Thus, an increase in the absorbed irradiance produces a higher substrate temperature on the surface,
. In this way, laser processing at 532 nm or 355 nm produces a local increase in the temperature of the substrate and in the recoil pressure exerted over the substrate, inducing a growth of the crystalline phase of the glass-ceramic substrate and generating the porous layer. Moreover, the increase in the absorption coefficient allows producing the porous layer at higher scanning speeds, 25 and 60 mm/s for 532 and 355 nm respectively. Furthermore, the porous layer can be produced at room temperature, without the drawback of heating the whole sample, and with lower energetic cost, since the energy delivered in the process, calculated by means of the pulse energy, frequency, scanning speed and distance between adjacent lines, are 29.4, 0.86 and 0.42 J/mm
2 for 1064, 532 and 355 nm respectively. Although laser treatment may cause a build-up of stress in the adjacent regions [
26] the features of this laser processing and the porous nature of the layer release the possible stresses produced while the process is carried out, as shown in previous works by means of Raman spectroscopy and mechanical tests [
20,
27].
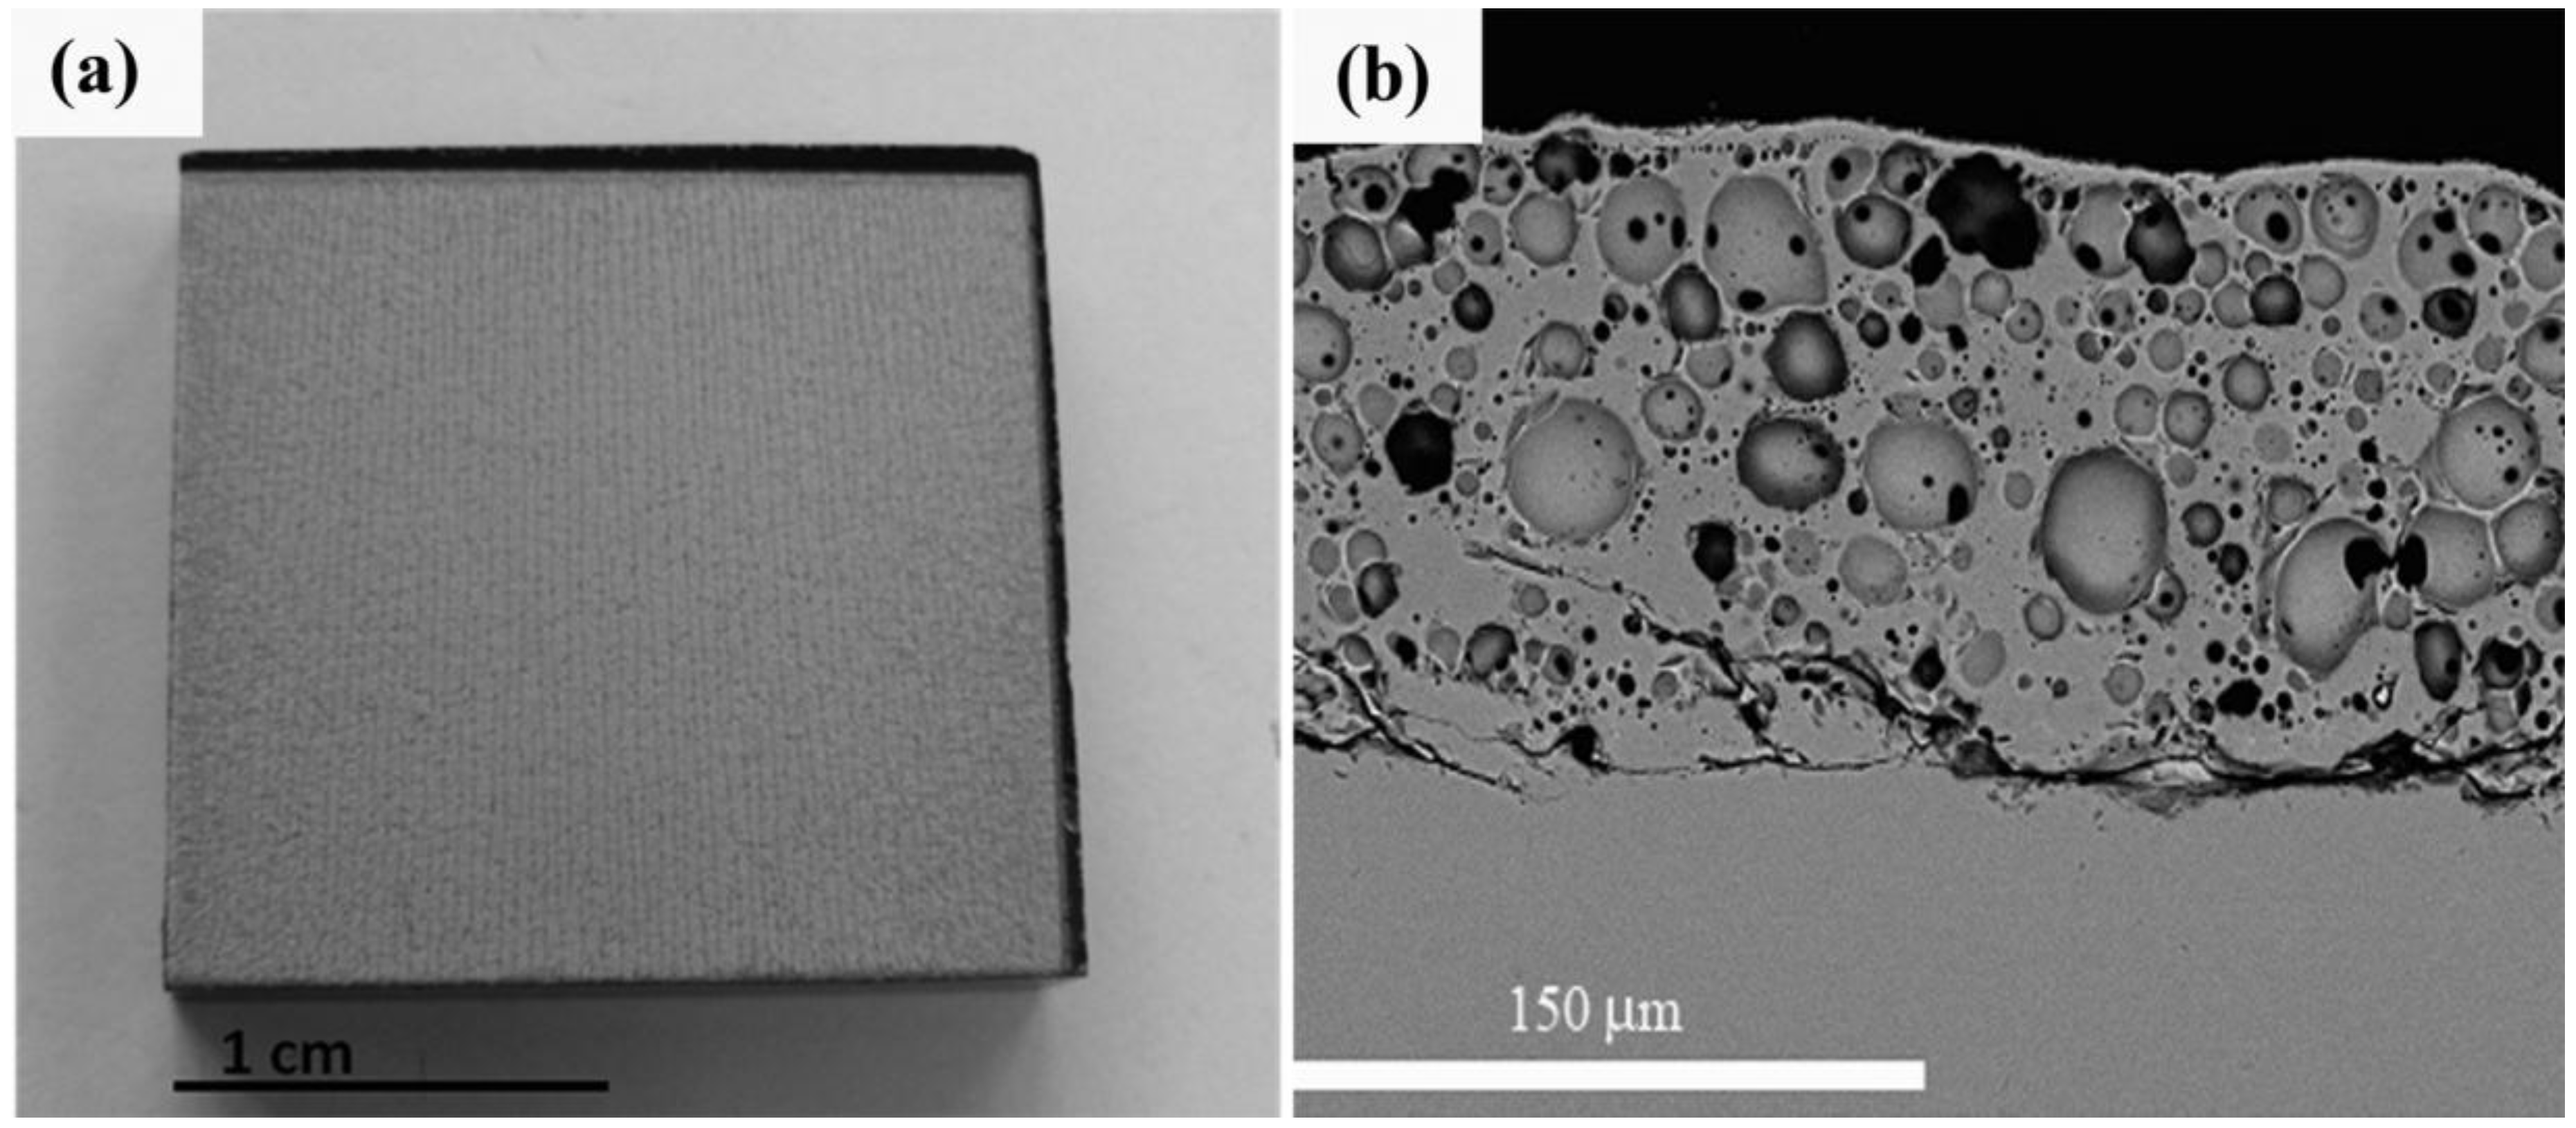
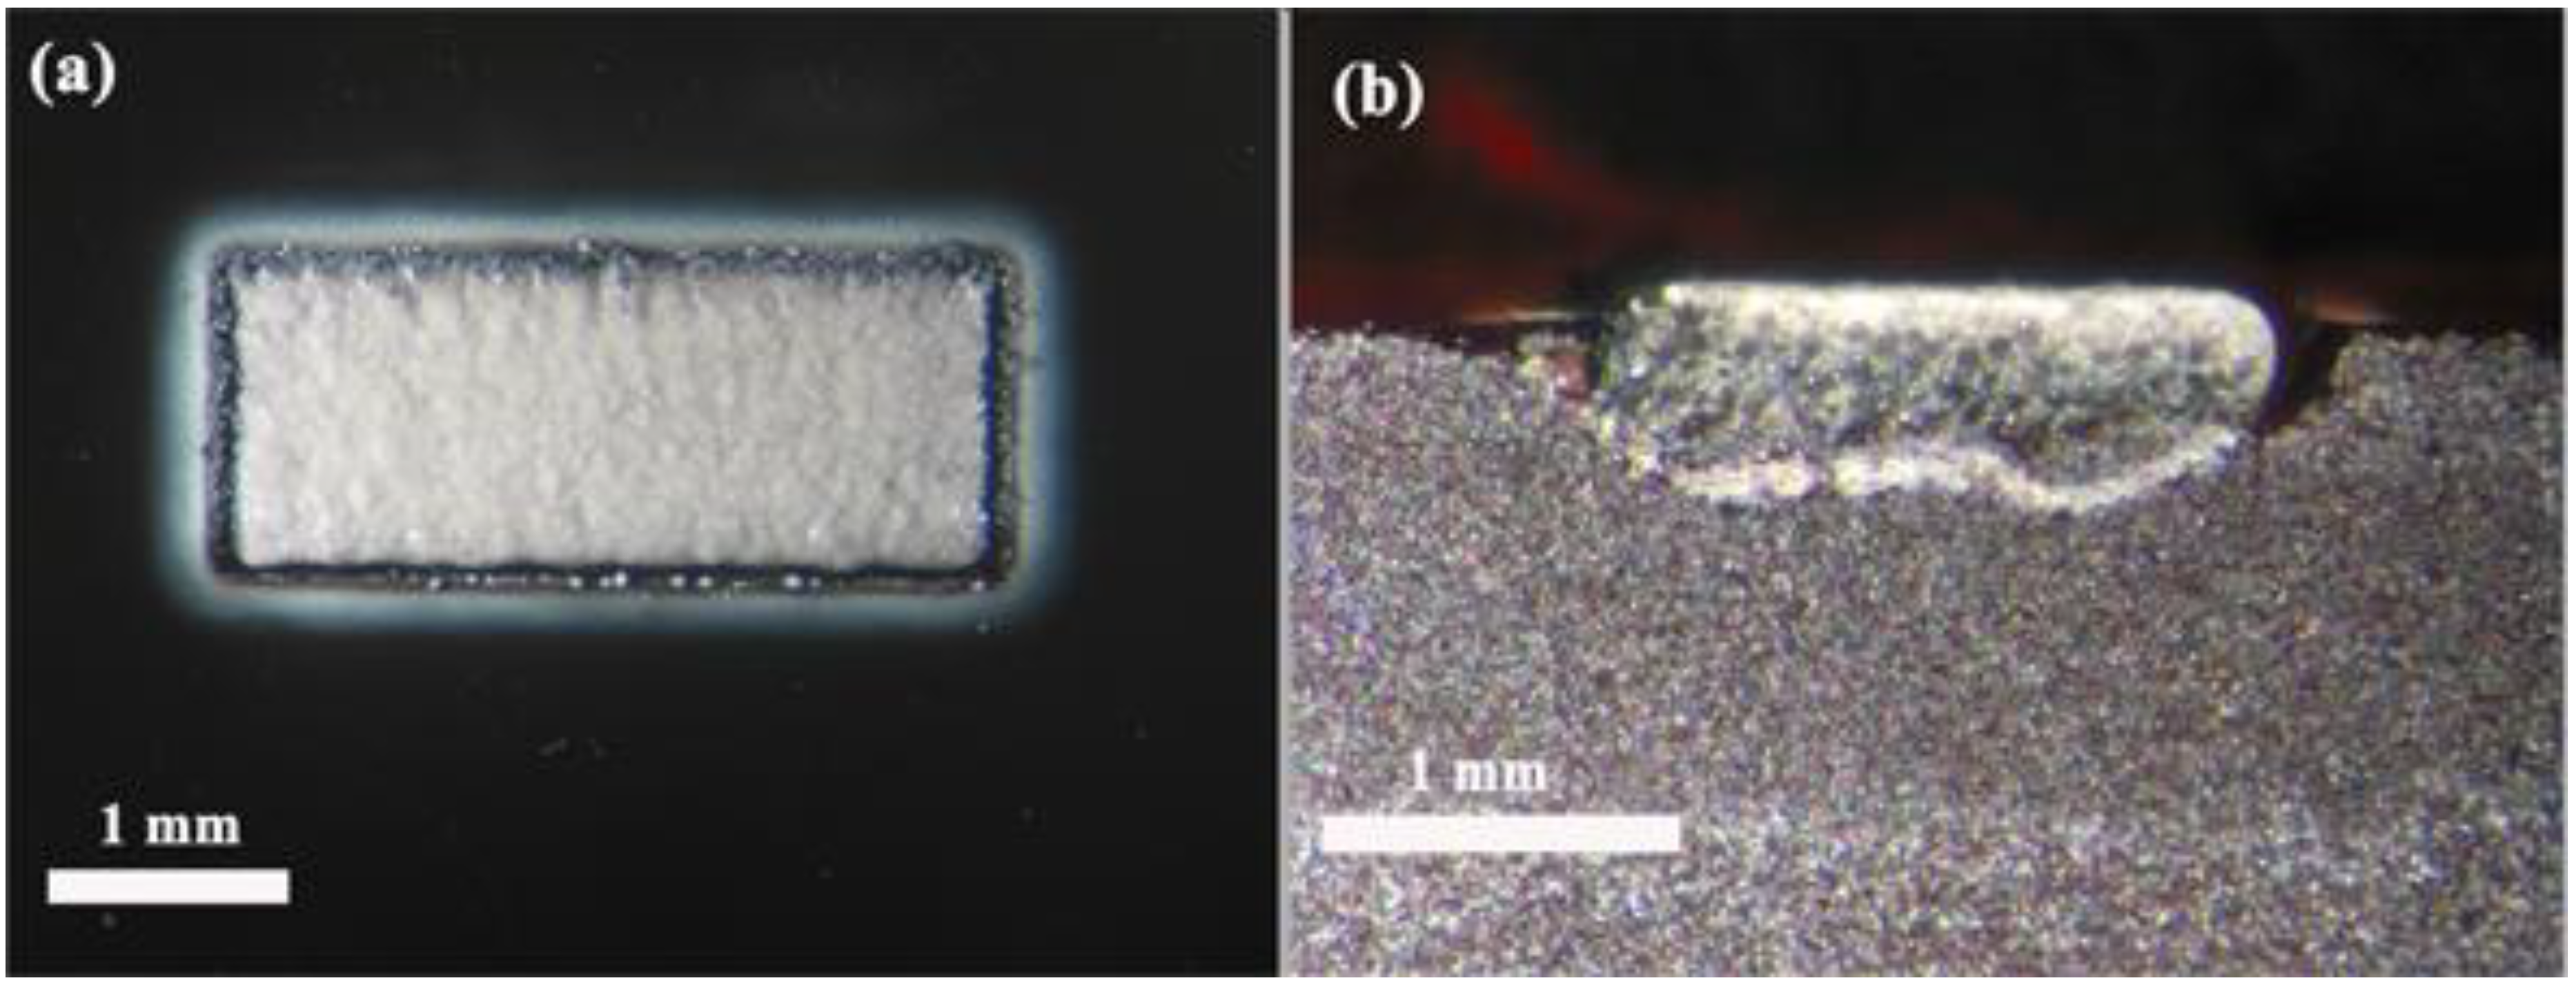
Figure 3 shows the top view (a) and cross-section micrograph (b) of the porous layer obtained by using a laser system emitting at 532 nm. As seen in
Figure 3a the layer presents a texture in the scanning direction produced by the local heating induced by the laser beam. As
Figure 3b depicts, the thickness is around 150 μm and presents high porosity.
Figure 2.
Top view (a) and cross-section view (b) of the porous layer generated at 600 °C with a laser system emitting at 1064 nm.
Figure 2.
Top view (a) and cross-section view (b) of the porous layer generated at 600 °C with a laser system emitting at 1064 nm.
Figure 3.
Top view (a) and cross-section micrograph (b) of the porous coating produced with a laser system emitting at 532 nm.
Figure 3.
Top view (a) and cross-section micrograph (b) of the porous coating produced with a laser system emitting at 532 nm.
In this work, the aim is to investigate the wear resistance of the layer. For this purpose, the porous layer was produced by means of a pulsed laser system emitting at 532 nm since the thickness of the layer produced at a wavelength of 355 nm was too thin to assess the wear behavior, and the scanning speed required for producing the coating at a wavelength of 1064 nm was too slow and entails the heating of the whole sample beyond 300 °C.
3.3. Tribological Behaviour
Prior to the wear tests, the hardness of the porous layer was measured to estimate the maximum load that the layer may withstand without cracking during the wear test. Although the nominal hardness of the glass-ceramic Ceran Suprema is 5.56 GPa, due to the porous structure of the layer, loads above 0.4 kgf on the Vickers indenter induce cracking of the layer. Therefore the hardness of the porous layer is remarkably lower than the dense substrate being the hardness measured applying a load of 5 kgf only 1.33 GPa. Therefore, the maximum load that can be applied without severe cracking for wear test is 4 N (0.4 kgf).
Wear behavior was initially tested against AISI316 at two loads, 1 and 3 N. The lower load applies a Hertz initial medium pressure of 0.22 GPa and a maximum pressure of 0.33 GPa, while a load of 3 N applies an hertzian a medium pressure of 0.32 GPa and a maximum pressure of 0.48 GPa. In all cases pressure is below either the measured hardness of the layer or the load limit for cracking.
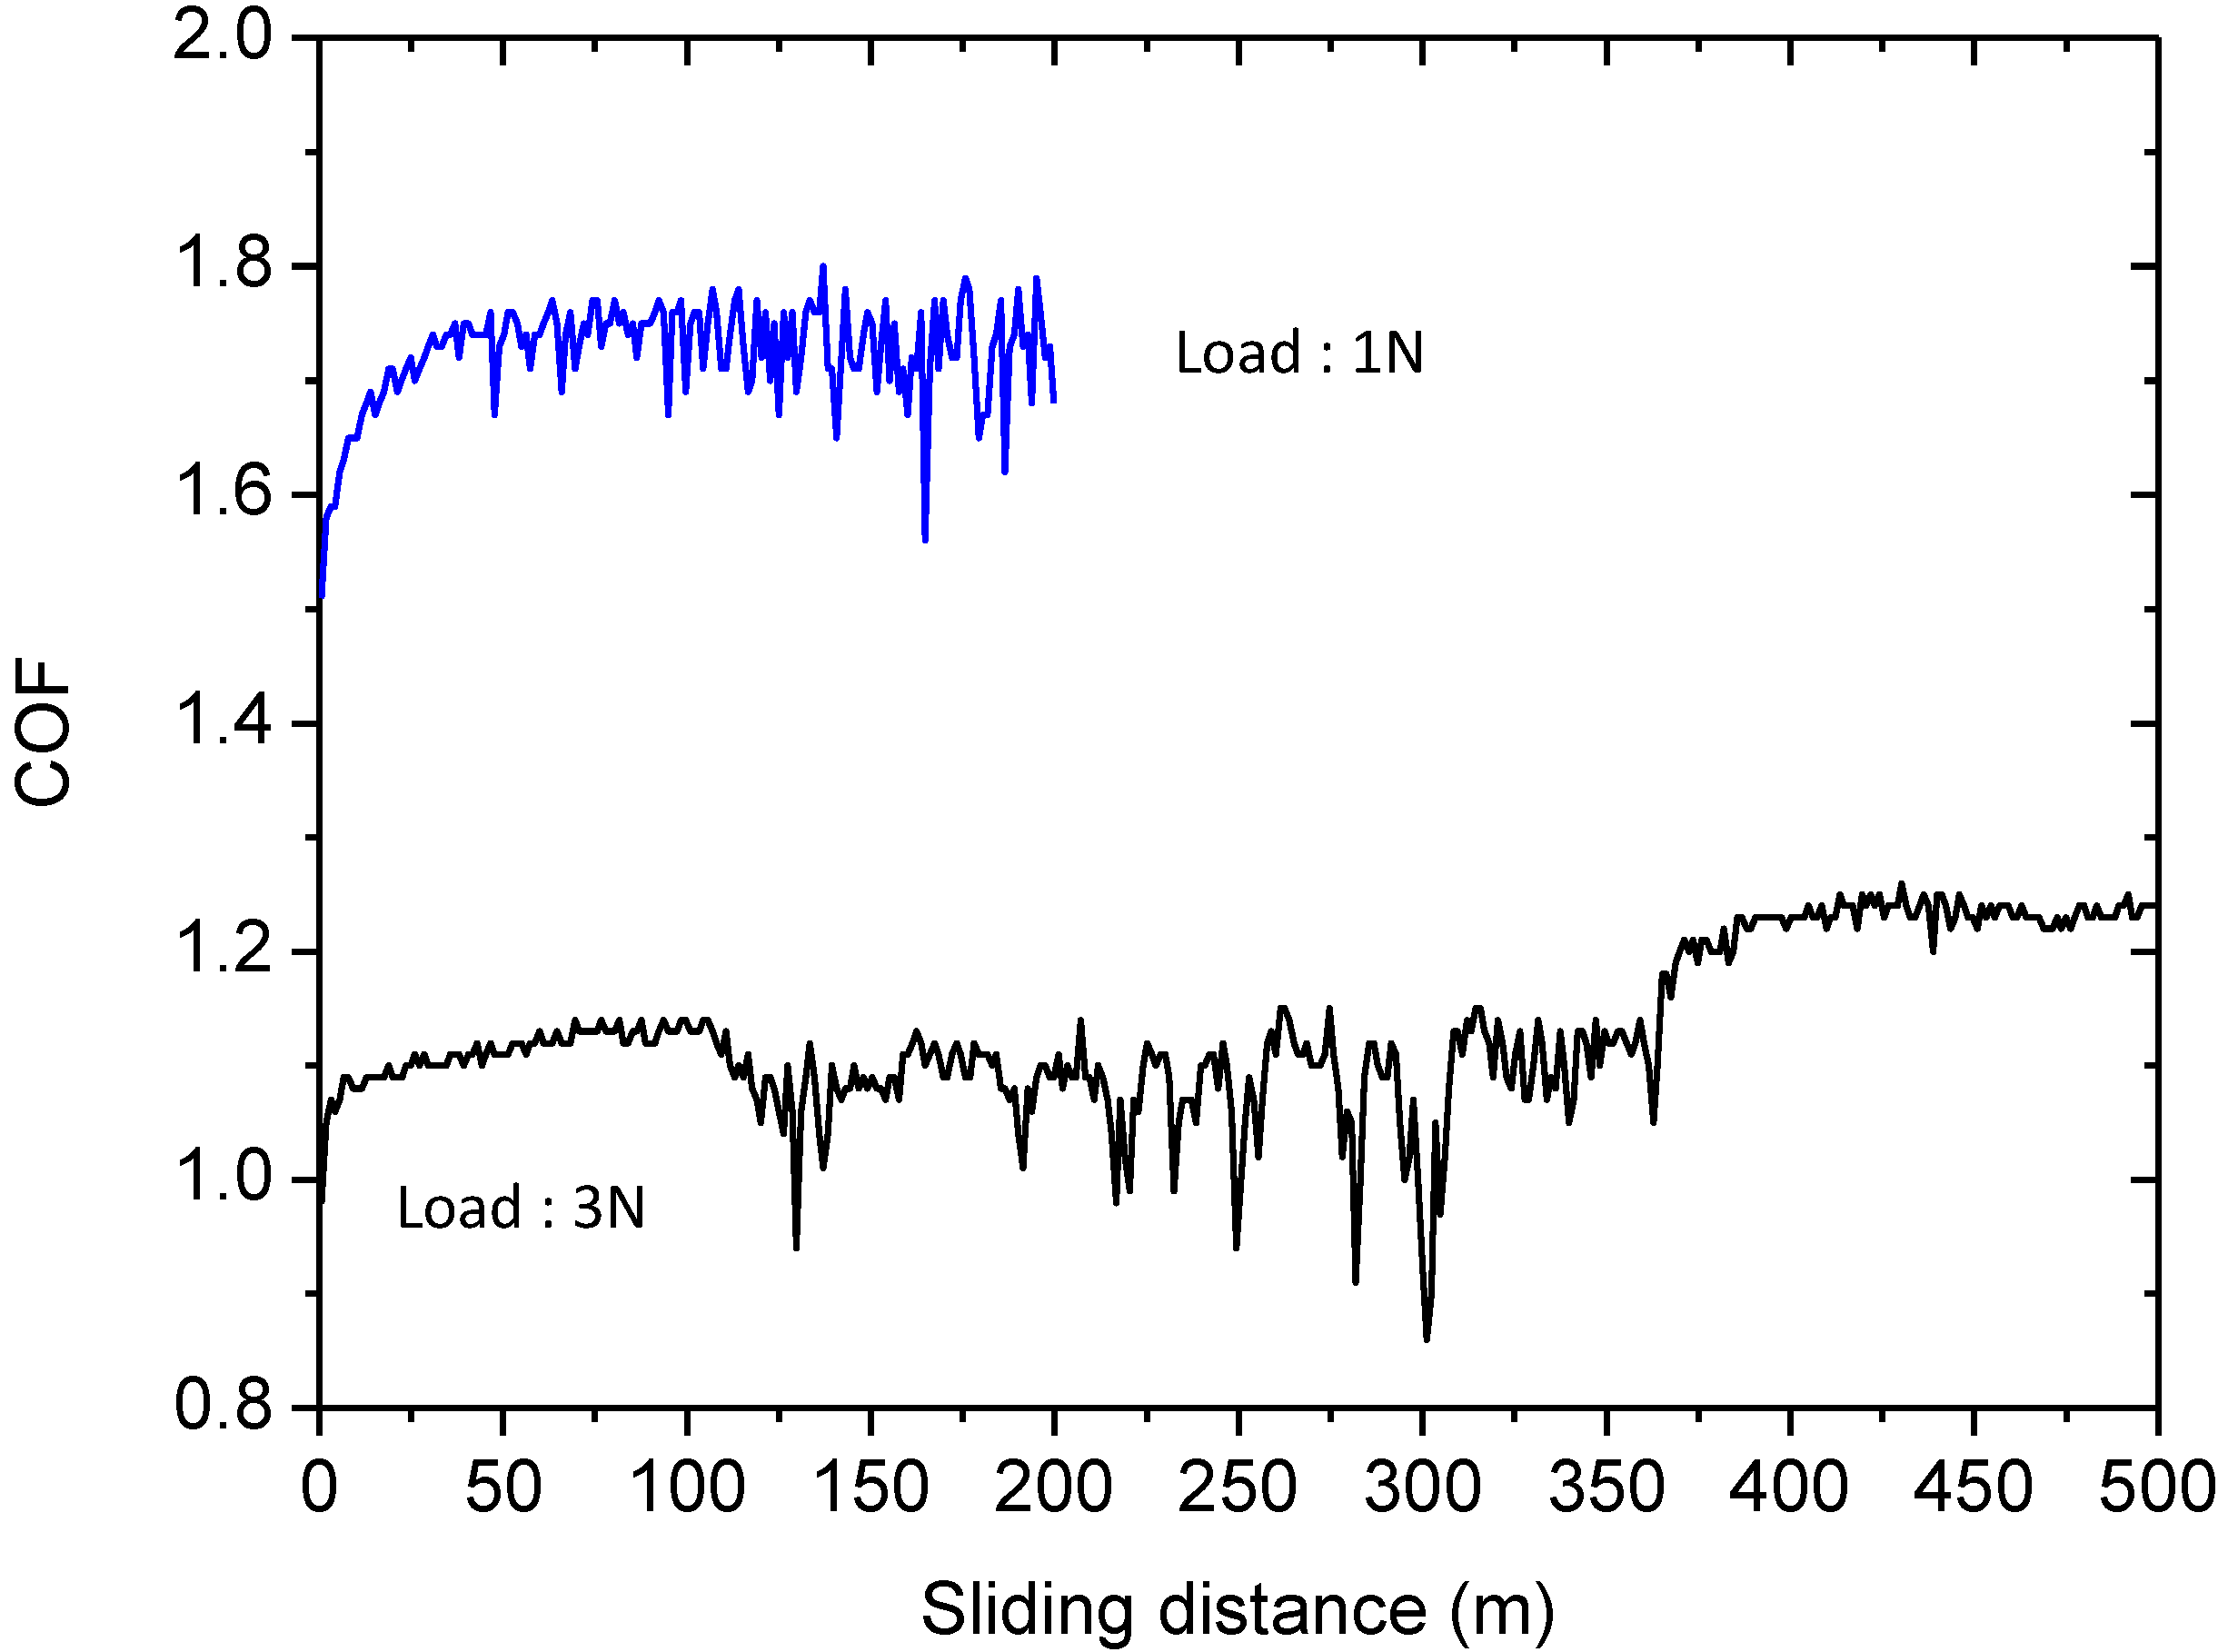
Figure 4 shows the variation of the friction coefficient, COF, with the load. At the lower load, the COF is as high as 1.7 meanwhile at 3 N the COF reduces to 1.1–1.2. In both cases such COF is notably higher than the values reported in the literature for different types of dense glass-ceramic materials, which is around 0.8 for a wide range of loads and counterbodies [
28,
29,
30].
Figure 4.
Friction coefficient, COF, recorded during the wear tests against AISI316 ball at 1 and 3 N of normal load with 200 and 500 m of sliding distance, respectively.
Figure 4.
Friction coefficient, COF, recorded during the wear tests against AISI316 ball at 1 and 3 N of normal load with 200 and 500 m of sliding distance, respectively.
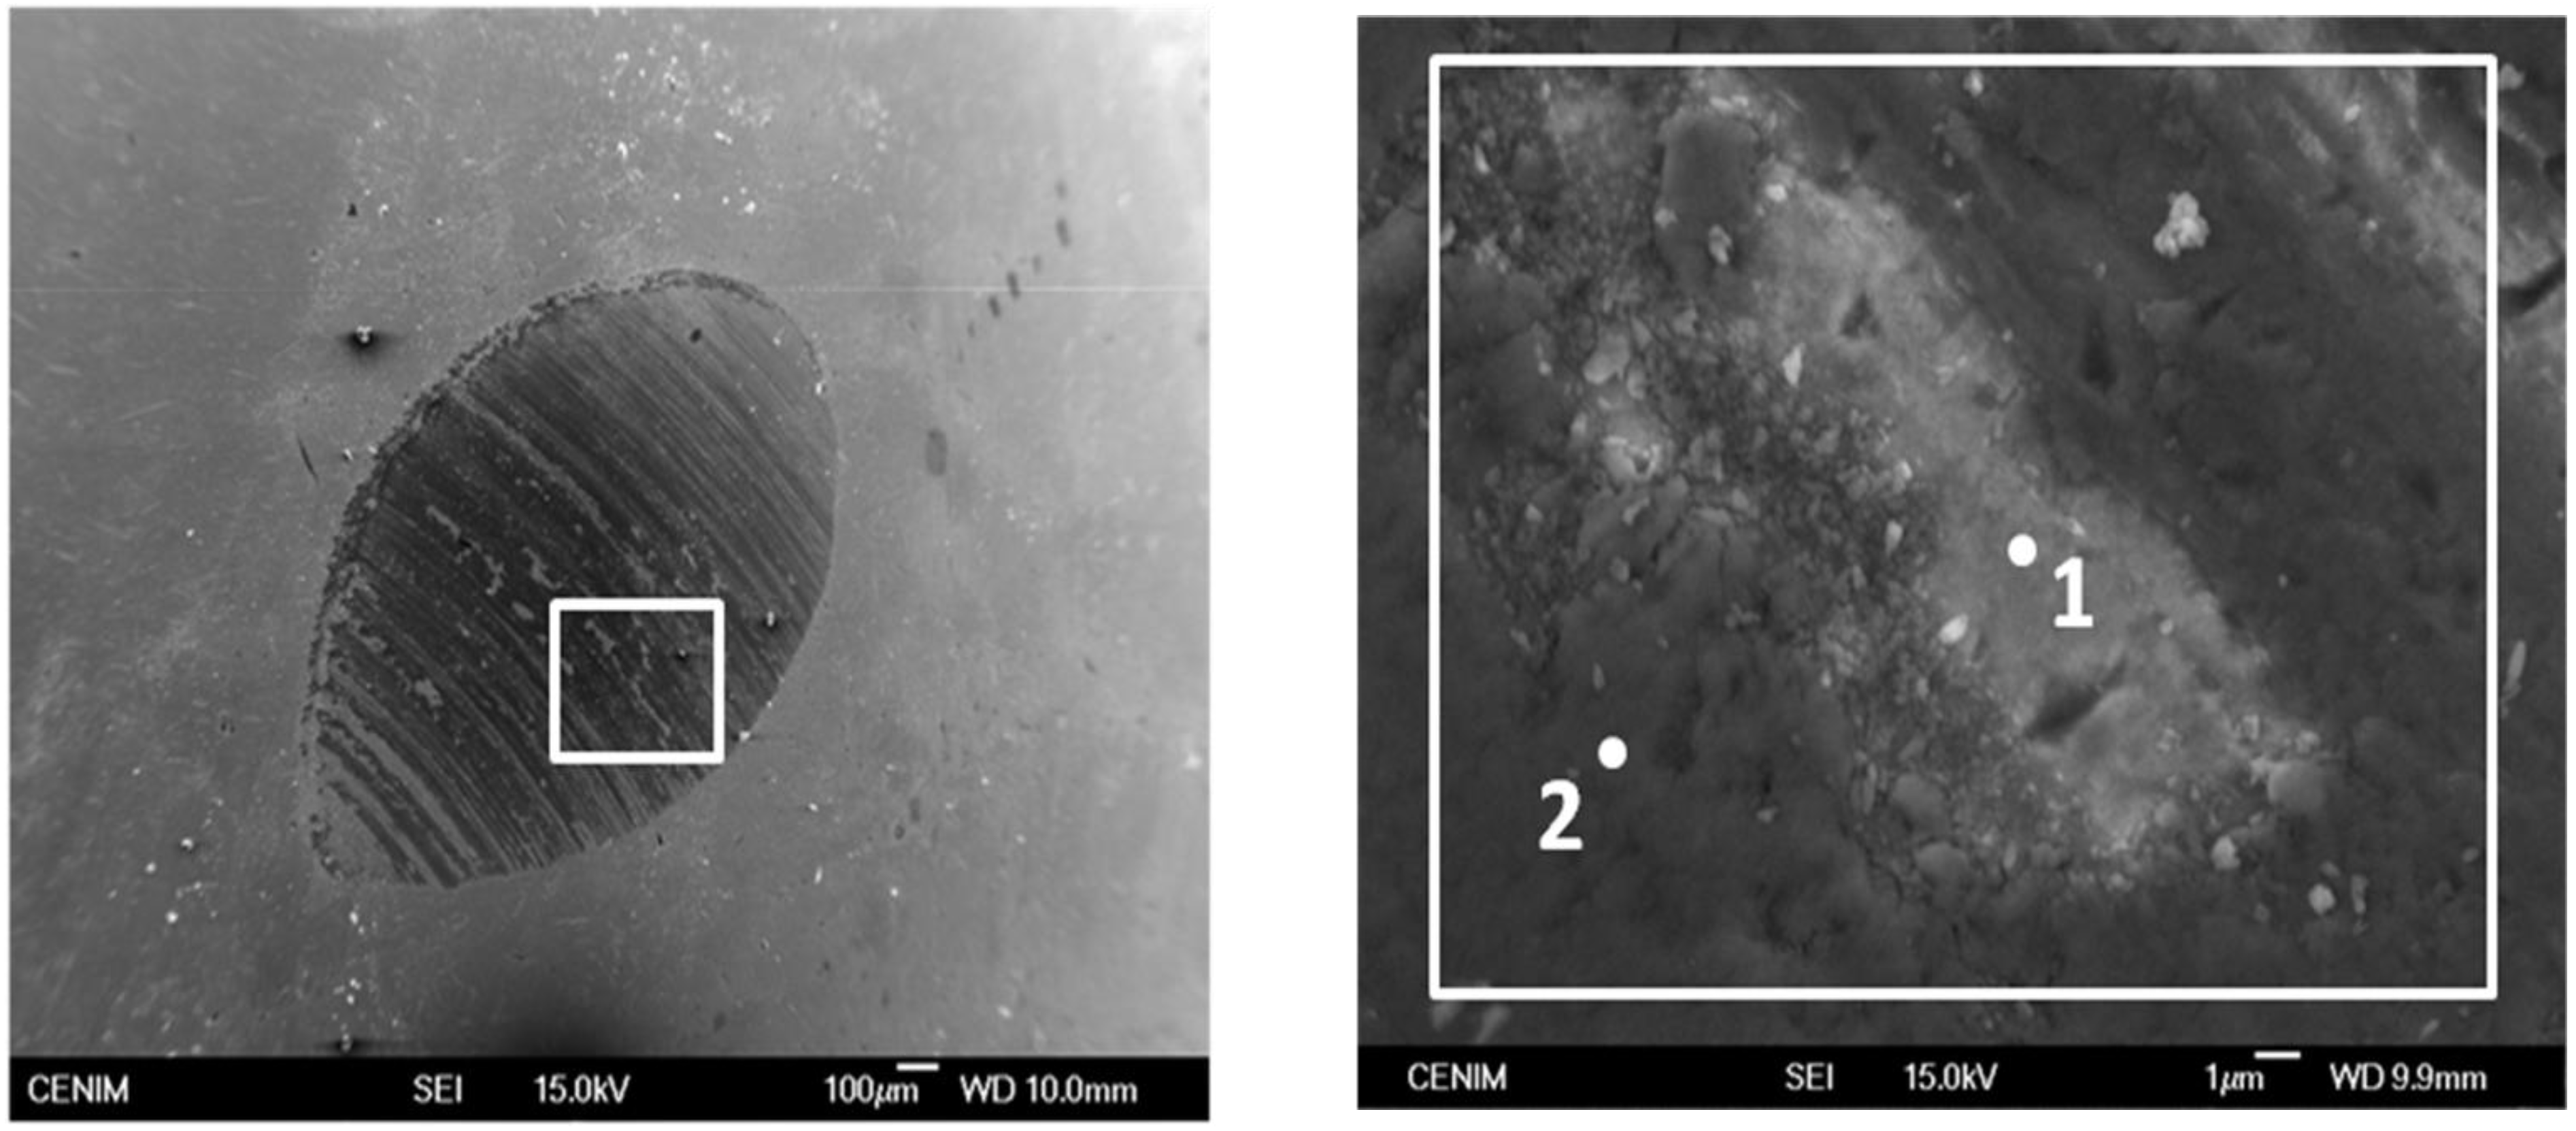
The analysis of the worn surfaces revealed that the steel ball appears notably eroded,
Figure 5, meanwhile the wear tracks on the glass-ceramic acquire an orange-like color,
Figure 6, indicating that oxide transference from the ball to the porous layer has been produced. The analysis of the wear track performed by EDX, confirmed that such material transference occurred between the glass-ceramic layer and the AISI316 ball.
Table 3 compares the chemical composition of the porous glass-ceramic layer before and after the wear tests. Similarly
Table 4 compares the chemical composition of the ball before and after the same wear test at the different locations identified in
Figure 5. While the wear track shows the presence of Cr and Fe, coming from the steel ball, the analysis of the flattened area of the ball shows the presence of Al, Mg, and Si oxides coming from the glass-ceramic material.
Figure 5.
Appearance of the worn surface for the AISI 316 ball showing the areas in which the EDX analyses were carried out (see
Table 3).
Figure 5.
Appearance of the worn surface for the AISI 316 ball showing the areas in which the EDX analyses were carried out (see
Table 3).
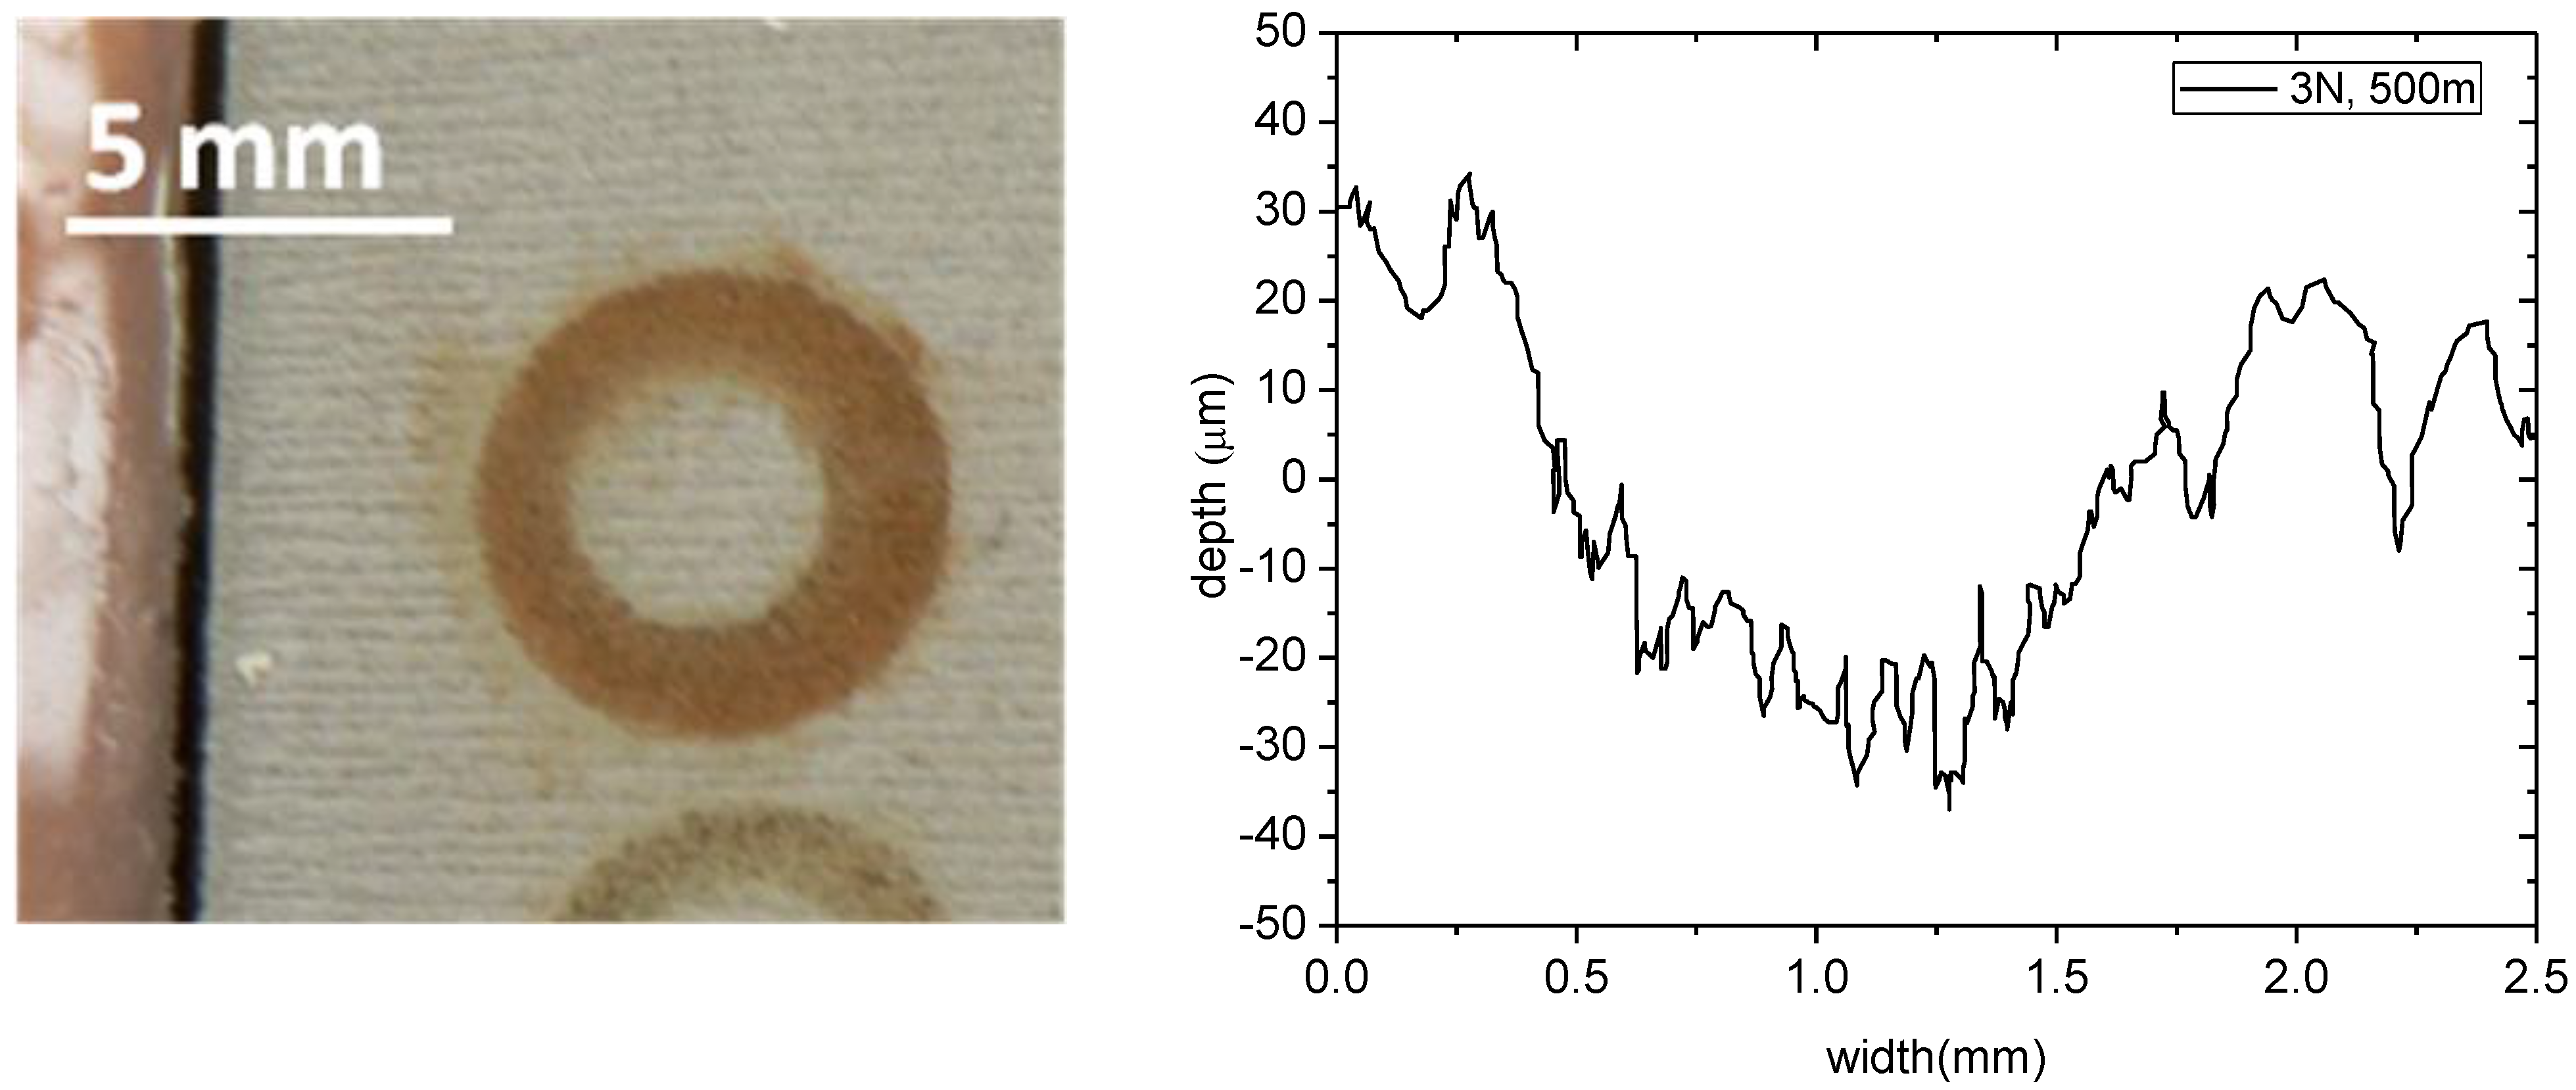
Figure 6.
Appearance and profile of the wear track in a glass-ceramic sample after wear test against AISI 316 ball with a normal load of 3 N and sliding distance of 500 m.
Figure 6.
Appearance and profile of the wear track in a glass-ceramic sample after wear test against AISI 316 ball with a normal load of 3 N and sliding distance of 500 m.
The ball exhibits a severe abrasion by the hard ceramic oxide particles and consequently the contact area has increased remarkably during the test. Although the wear track width is very large (around 1.5 mm) the average depth is only 50 μm,
Figure 6. This fact indicates that most of the worn volume is concentrated on the AISI316 ball and the apparent width of the wear track is mainly due to the widening of the ball contact area more than a real severe wear of the porous ceramic layer.
In order to reduce the severity of the tests for the steel used as a counterbody, further tests were performed at a lower load and shorter sliding distance, 1 N and 100 m respectively. In these new conditions the glass-ceramic material did not show any measurable volume loss since the wear track is hardly distinguished conversely to what occurred in the steel ball where severe material loss and a wide flattened area is still observed.
Table 4.
Composition of the AISI316 ball flattened surface in contact with the coating after the wearing test. The analyses were performed in the areas pointed out in the inset of
Figure 5b.
Table 4.
Composition of the AISI316 ball flattened surface in contact with the coating after the wearing test. The analyses were performed in the areas pointed out in the inset of Figure 5b.
| at.% | AISI316 | Worn AISI316 Ball |
|---|
| Ball | 1 | 2 |
|---|
| O | – | 7.85 | 52.74 |
| Mg | – | 0.03 | 0.31 |
| Al | – | 0.06 | 2.75 |
| Si | – | 1.70 | 7.51 |
| Ti | – | – | 0.12 |
| Cr | 14.16 | 11.41 | 4.06 |
| Fe | 85.24 | 64.97 | 21.35 |
| Ni | 0.49 | – | – |
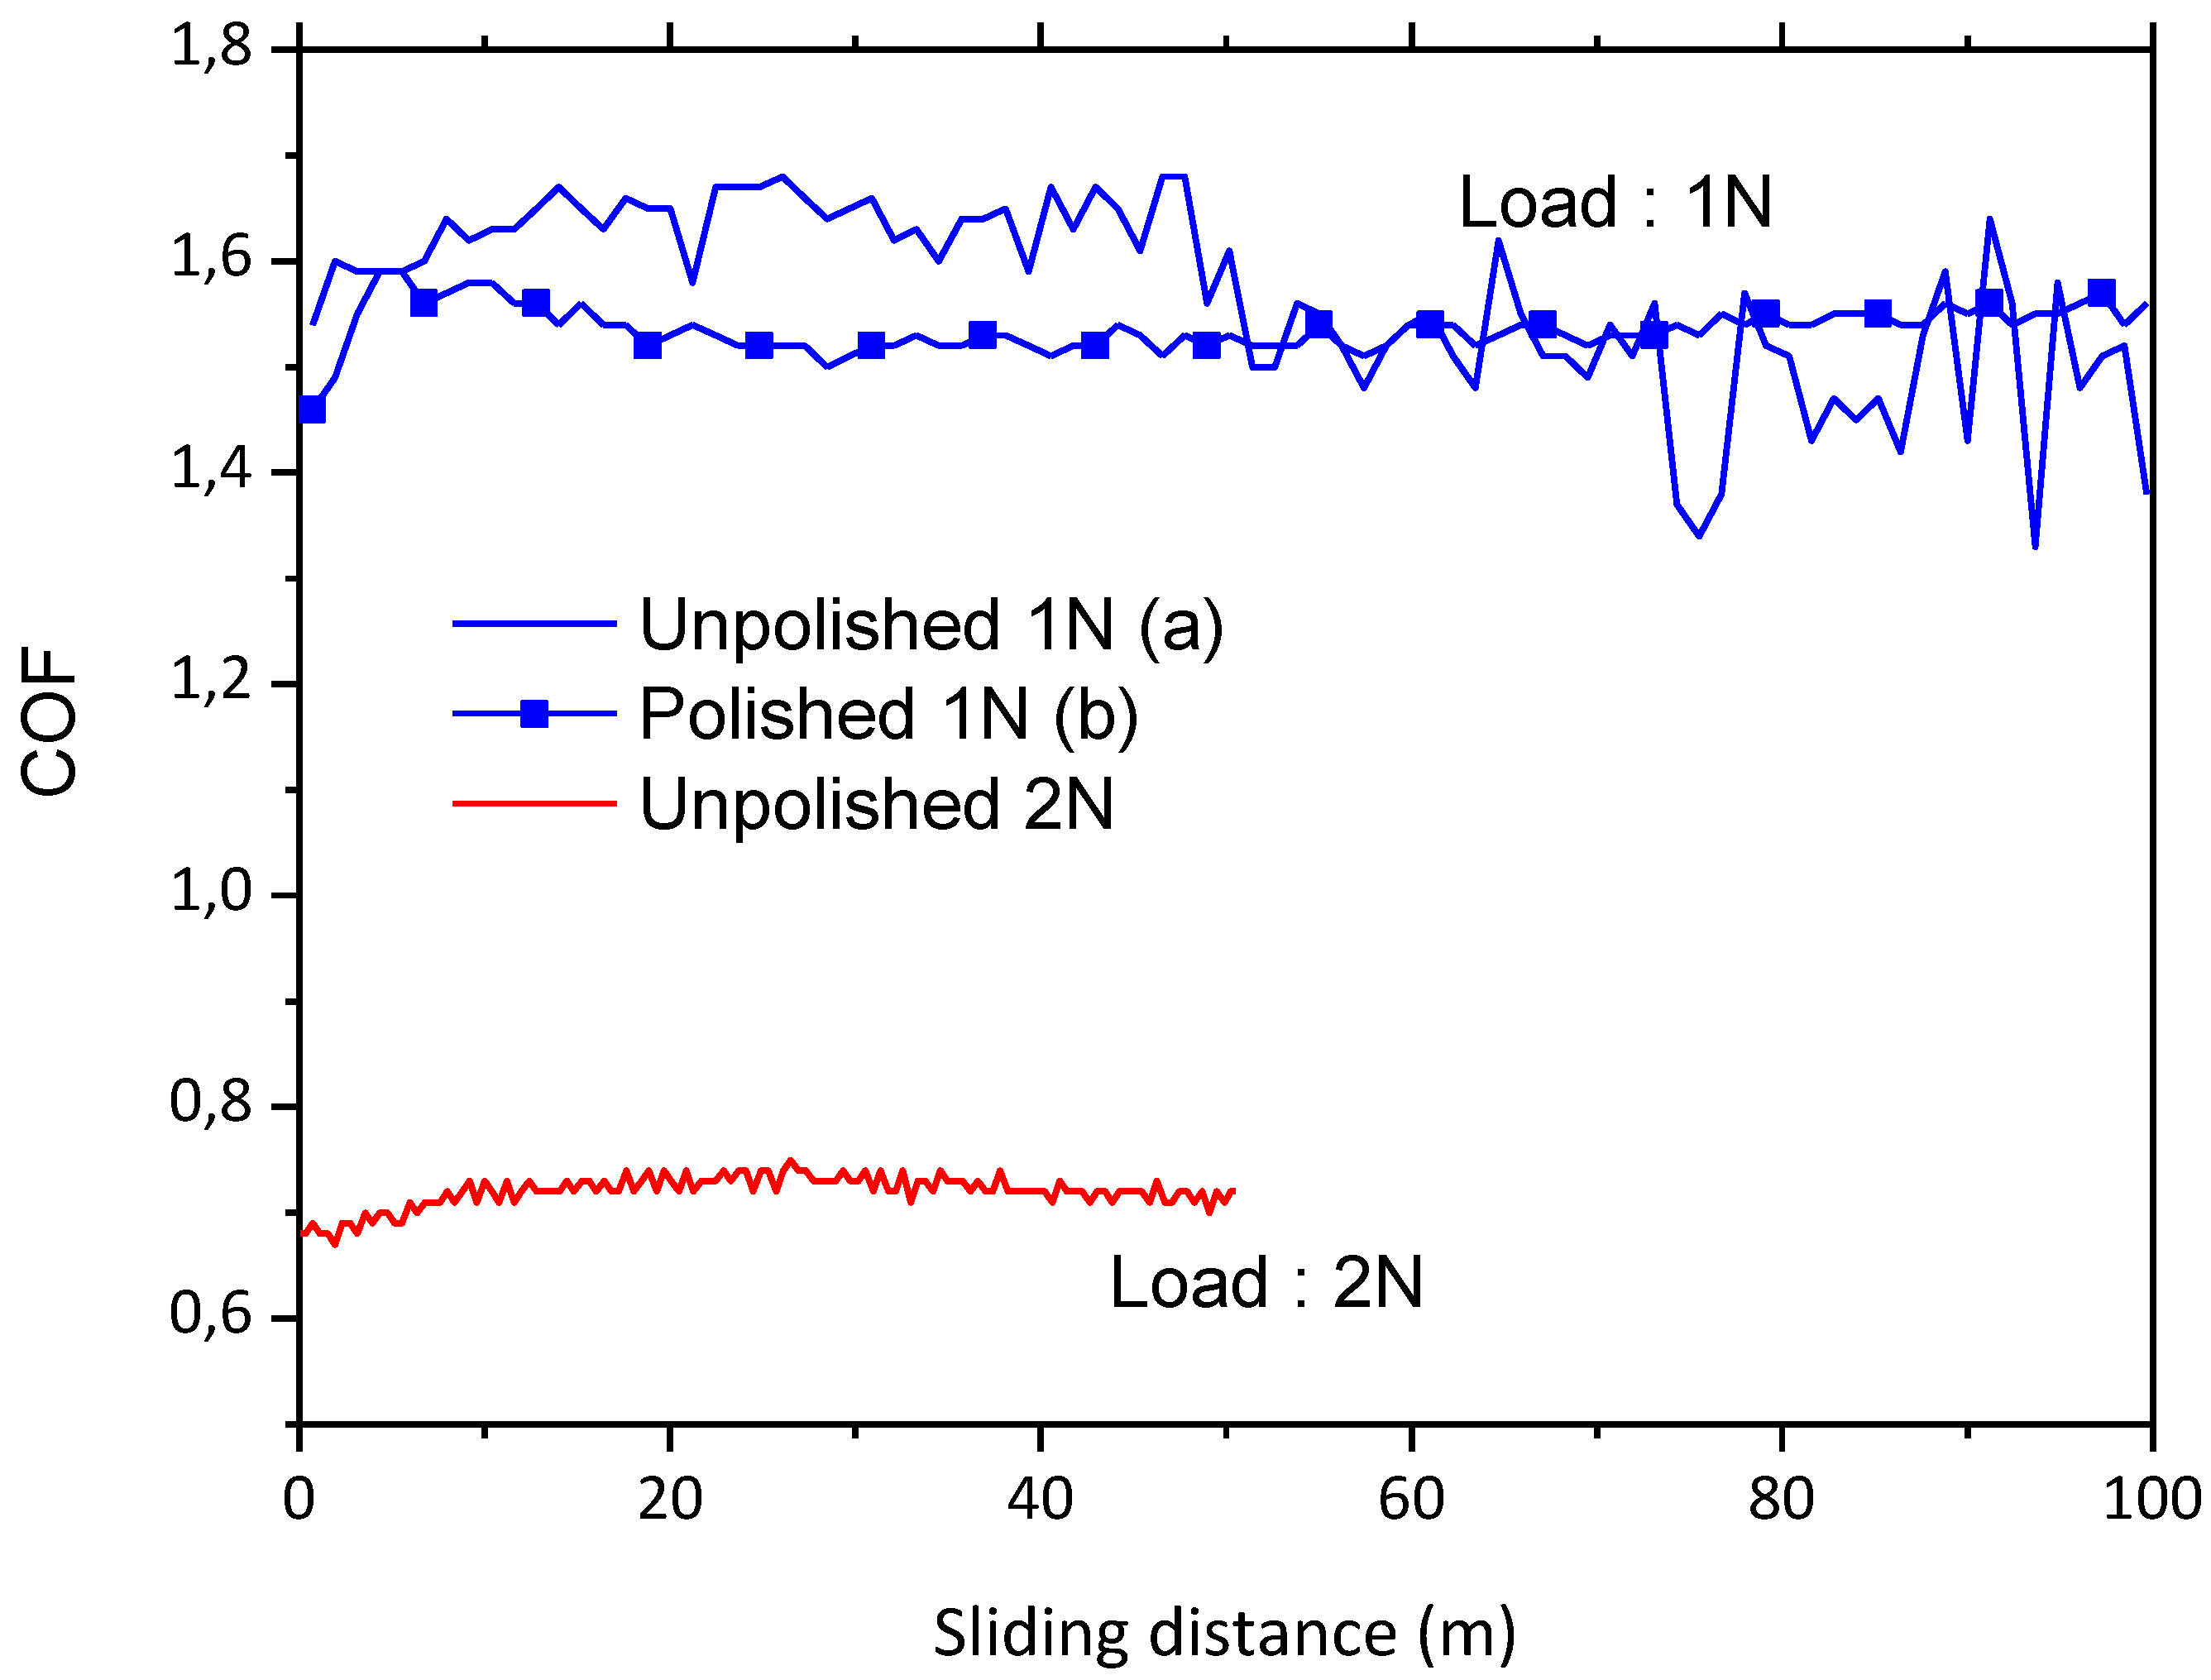
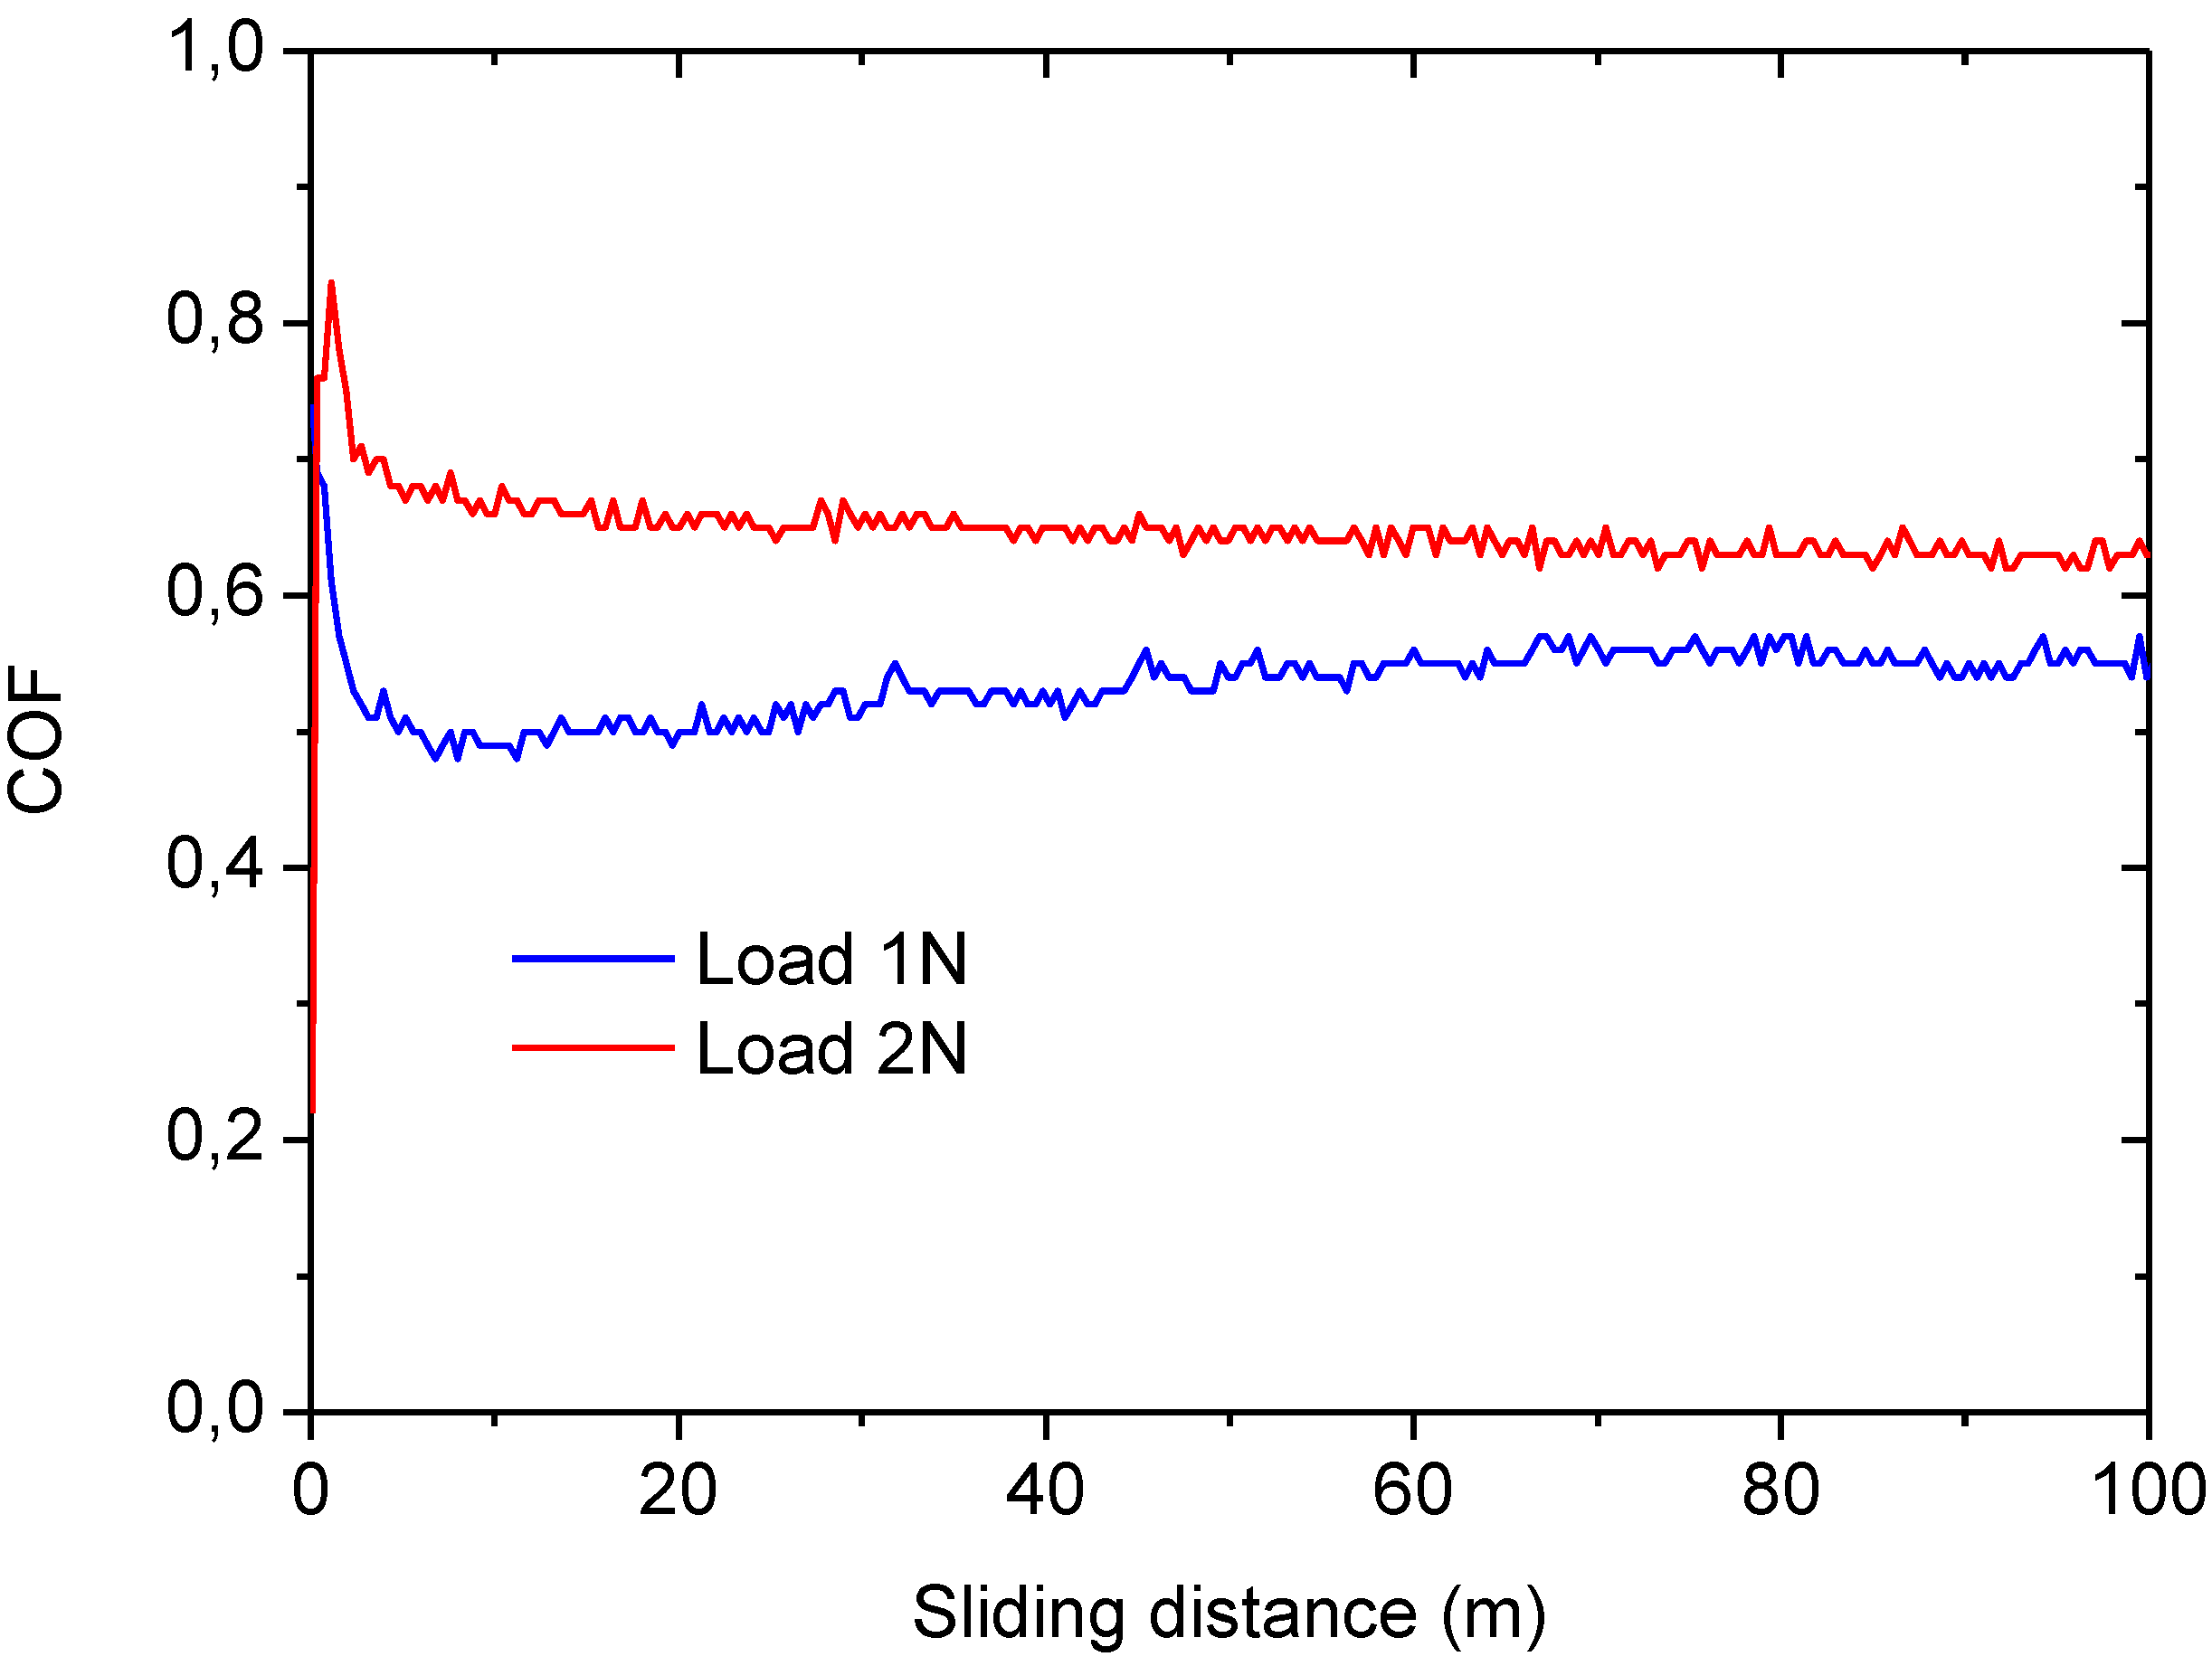
In sight of the results obtained from the wear tests carried out using the AISI316 ball, a new batch of tests were performed using a much harder counterbody, namely a corundum ball of 3 mm diameter. Therefore the friction coefficient of the porous layer against corundum was determined for a load of 1 N and sliding distances of 100 m,
Figure 7. Although the load employed was the same as in the AISI316 case, the initial Hertz contact average pressure and the maximum pressures were slightly higher, 0.39 and 0.59 GPa, respectively. The friction coefficient recorded is still very high, above 1.4. These values are still significantly higher from those reported in the literature. Cranmer [
31] determined the COF values of many commercial glass-ceramic compositions, finding that the average COF values, measured on sample pairs of parallel rings, ranged from 0.49 to 0.7. Similarly, Buchner
et al. [
32] reported values within the same range for various types of ceramics evaluated in a reciprocating sliding configuration against a tungsten carbide ball of 6.3 mm.
Figure 7.
Friction coefficients, COF, for the porous layer against corundum counterbody with the sliding distance for loads of 1 N and sliding distance of 100 m (a) unpolished and (b) polished samples and for loads of 2 N and sliding distance of 50 m.
Figure 7.
Friction coefficients, COF, for the porous layer against corundum counterbody with the sliding distance for loads of 1 N and sliding distance of 100 m (a) unpolished and (b) polished samples and for loads of 2 N and sliding distance of 50 m.
In order to discriminate the role played by surface pattern and roughness produced by the laser process the specimens were polished to reduce their roughness. Initially the surface of the porous glass-ceramic layer obtained by laser exhibits a high roughness (average arithmetic roughness Ra) of 6.53 ± 0.67 and 4.90 ± 0.39 μm in the scanning and in the perpendicular direction respectively. The specimens were polished by means of sandpapers and diamond polishing abrasives of up to 1 μm. After such polishing process the laser scans were not visible, and the roughness Ra achieved on the specimens was reduced to 2.65 ± 0.44 μm in any directions. However, wear tests performed on such polished specimens still reveal similar COF values as those found for unpolished samples,
Figure 7. Despite the similar COF average value (1.55 approximately) it is clearly observed that the polished sample presents a lower dispersion of data and the COF value is more uniform along the tests. Therefore the high values of the COF recorded in all cases compared to the reported values in the literature, appears to be related to the high porosity of the layer rather than to the roughness.
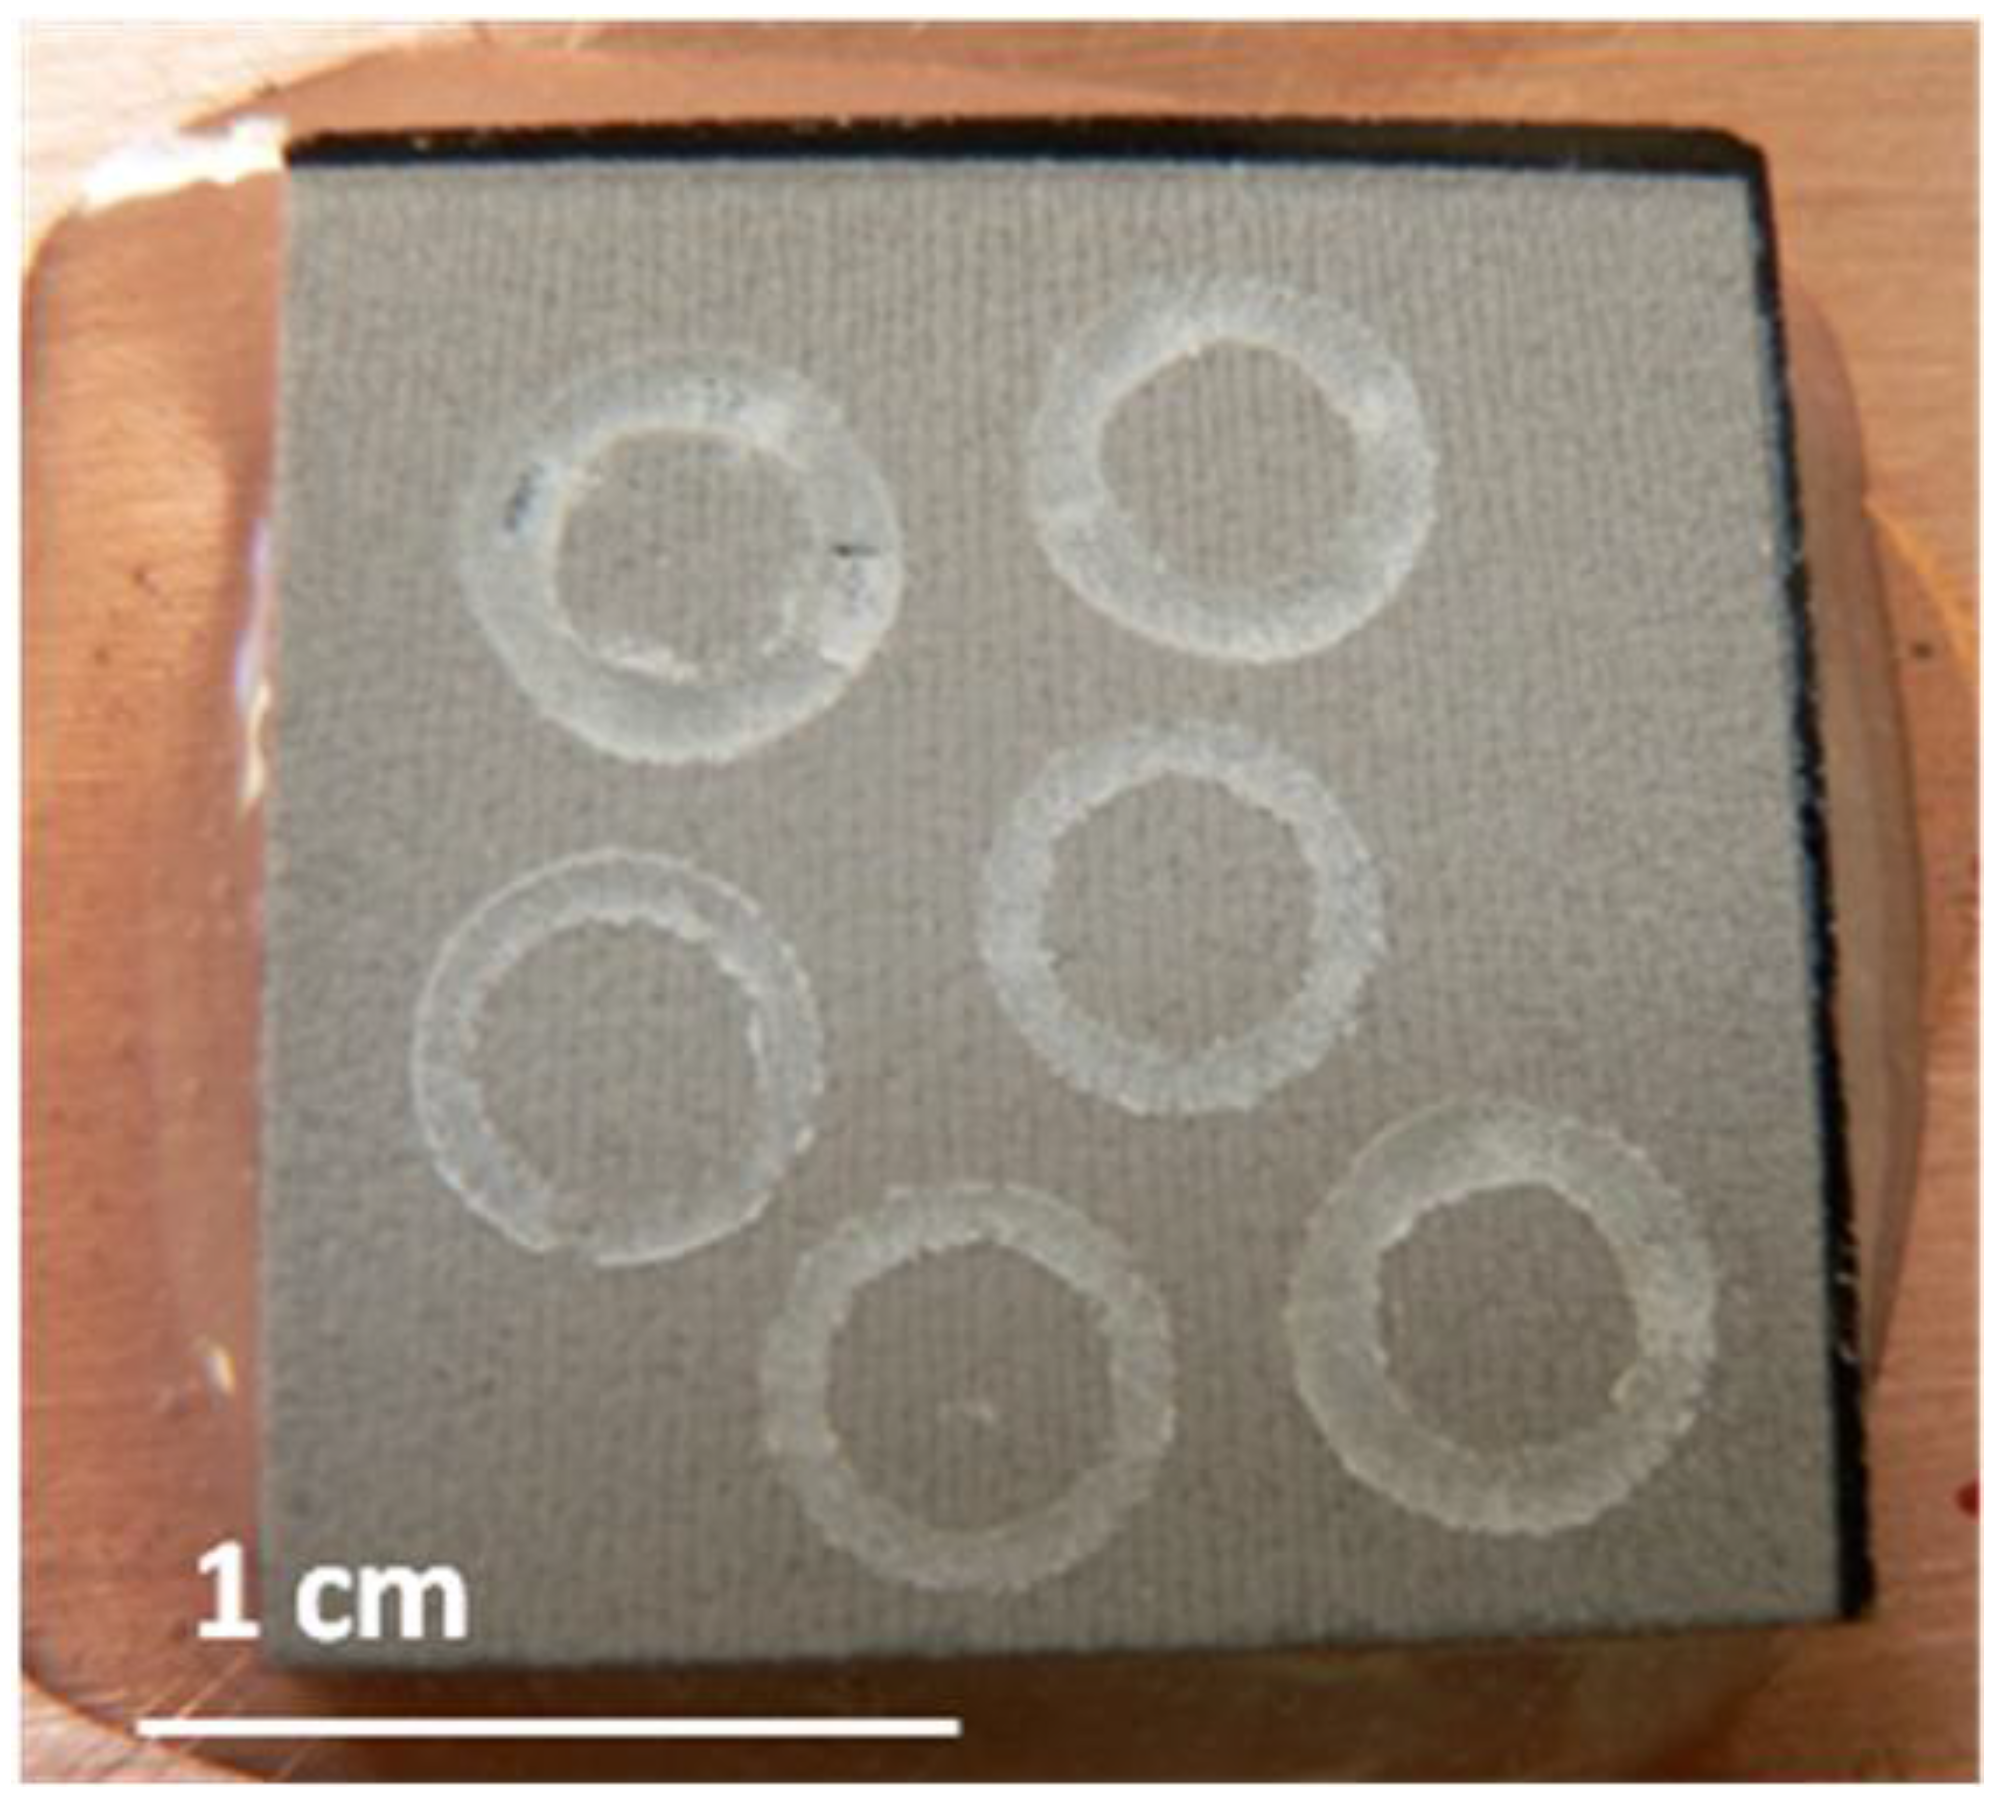
The wear tracks obtained on unpolished samples against corundum balls showed a homogeneous appearance without change of color,
Figure 8. The chemical composition of the wear track showed that the composition did not vary from the composition of the porous layer,
Table 3, that is to say, no material transference from the ball had been produced. On the other hand, the wear rate calculated is 6.01 × 10
−3 ± 5.76 × 10
−4 mm
3/Nm. These values are higher than those reported by Buchner [
32] for common dense glass-ceramic.
Figure 8.
Appearance of the wear track in the unpolished glass-ceramic porous layer performed against corundum balls.
Figure 8.
Appearance of the wear track in the unpolished glass-ceramic porous layer performed against corundum balls.
The effect of the load in the friction coefficient was assessed by increasing the load to 2 N for a sliding distance of 50 m. In this case the Hertz average and the maximum contact pressure were 0.5 and 0.74 GPa respectively. In these tests a reduction in the COF was observed, as shown in
Figure 7, obtaining values around 0.8, in the same order reported in the literature [
31,
33]. On the other hand, the average wear rate obtained for these tests is 2.85 × 10
−3 mm
3/Nm, a value also above typical values in the literature [
32].
All the results shown above seem to indicate that the porous layer presents a more elevated COF and wear rate than typical dense glass-ceramic materials reported in the literature. This seems not to be a consequence of the high roughness and surface pattern induced by the laser treatment as we have shown this result also in the wear tests on polished samples. In order to discard effects due to the specific glass-ceramic substrate, a wear test on the dense substrate was performed. For that, the porous layer was completely removed by grinding and a wear test with applied loads of 1 and 2 N performed against corundum for a sliding distance of 100 m. In this case, the COF observed,
Figure 9, is reduced drastically to values around 0.55–0.65, which is in the range of the reported for other dense glass-ceramic materials. On the other hand, the wear rates measured are in the order of 6.7 × 10
−5–1.5 × 10
−4 mm
3/Nm that are in the same range of the reported for similar glass-ceramic materials. Therefore, the COF and wear rate results found for the porous layer should be attributed to the porous structure itself and not to a compositional or roughness effects.
The results shown from the laser porous layer, polished porous layer and dense glass-ceramic substrate seem to indicate that the generation of the porous structure is the responsible of the increment of COF and wear rate when compared with the values of the dense substrate. It is generally agreed that the presence of porosity is detrimental to the wear resistance of ceramic and composite materials except when the porosity values are low [
33]. The pores may act as stress raisers when a load is applied and thus facilitate crack initiation. Such cracks could also easily propagate by connecting pores with high stress concentration, leading to severe surface failure and material removal. Some works on porous titanium dioxide layers [
34] and zirconia polycrystalline ceramics [
35,
36] state that the presence of porosity strongly weakens the resistance of the material during scratching and wears testing. Young’s modulus and hardness of the ceramic structures were substantially reduced with increasing porosity. In general, for a low amount of pores the capability of plastic deformation compared with the dense ceramic is increased. Conversely, greater porosity promoted surface and subsurface cracking. Regarding COF, in crystalline ceramic materials, low to medium porosity did not affect the friction coefficient but at high porosity the friction also increased. High porosity levels lead to the formation and propagation of cracks which favor the occurrence of granular wear particles in the contact area. Cracking is the main factor influencing the wear mechanism of ceramic materials, as a result of its occurrence, friction and wear increased substantially in porous ceramics.
Figure 9.
Friction coefficients, COF, for the glass-ceramic substrate against corundum counterbody with the sliding distance for loads of 1 and 2 N and sliding distance of 100 m.
Figure 9.
Friction coefficients, COF, for the glass-ceramic substrate against corundum counterbody with the sliding distance for loads of 1 and 2 N and sliding distance of 100 m.

