3.1. FT-IR Measurement
Table 1 shows the empirical formulas, molecular weights and chemical structures of the major components of the plant dyes selected for this work; these include curcumin, indigo, brazilin, shikonin and quercetin. To establish the FTIR technique for dye identification, commercial dyes and the dyed silk fabric were prepared.
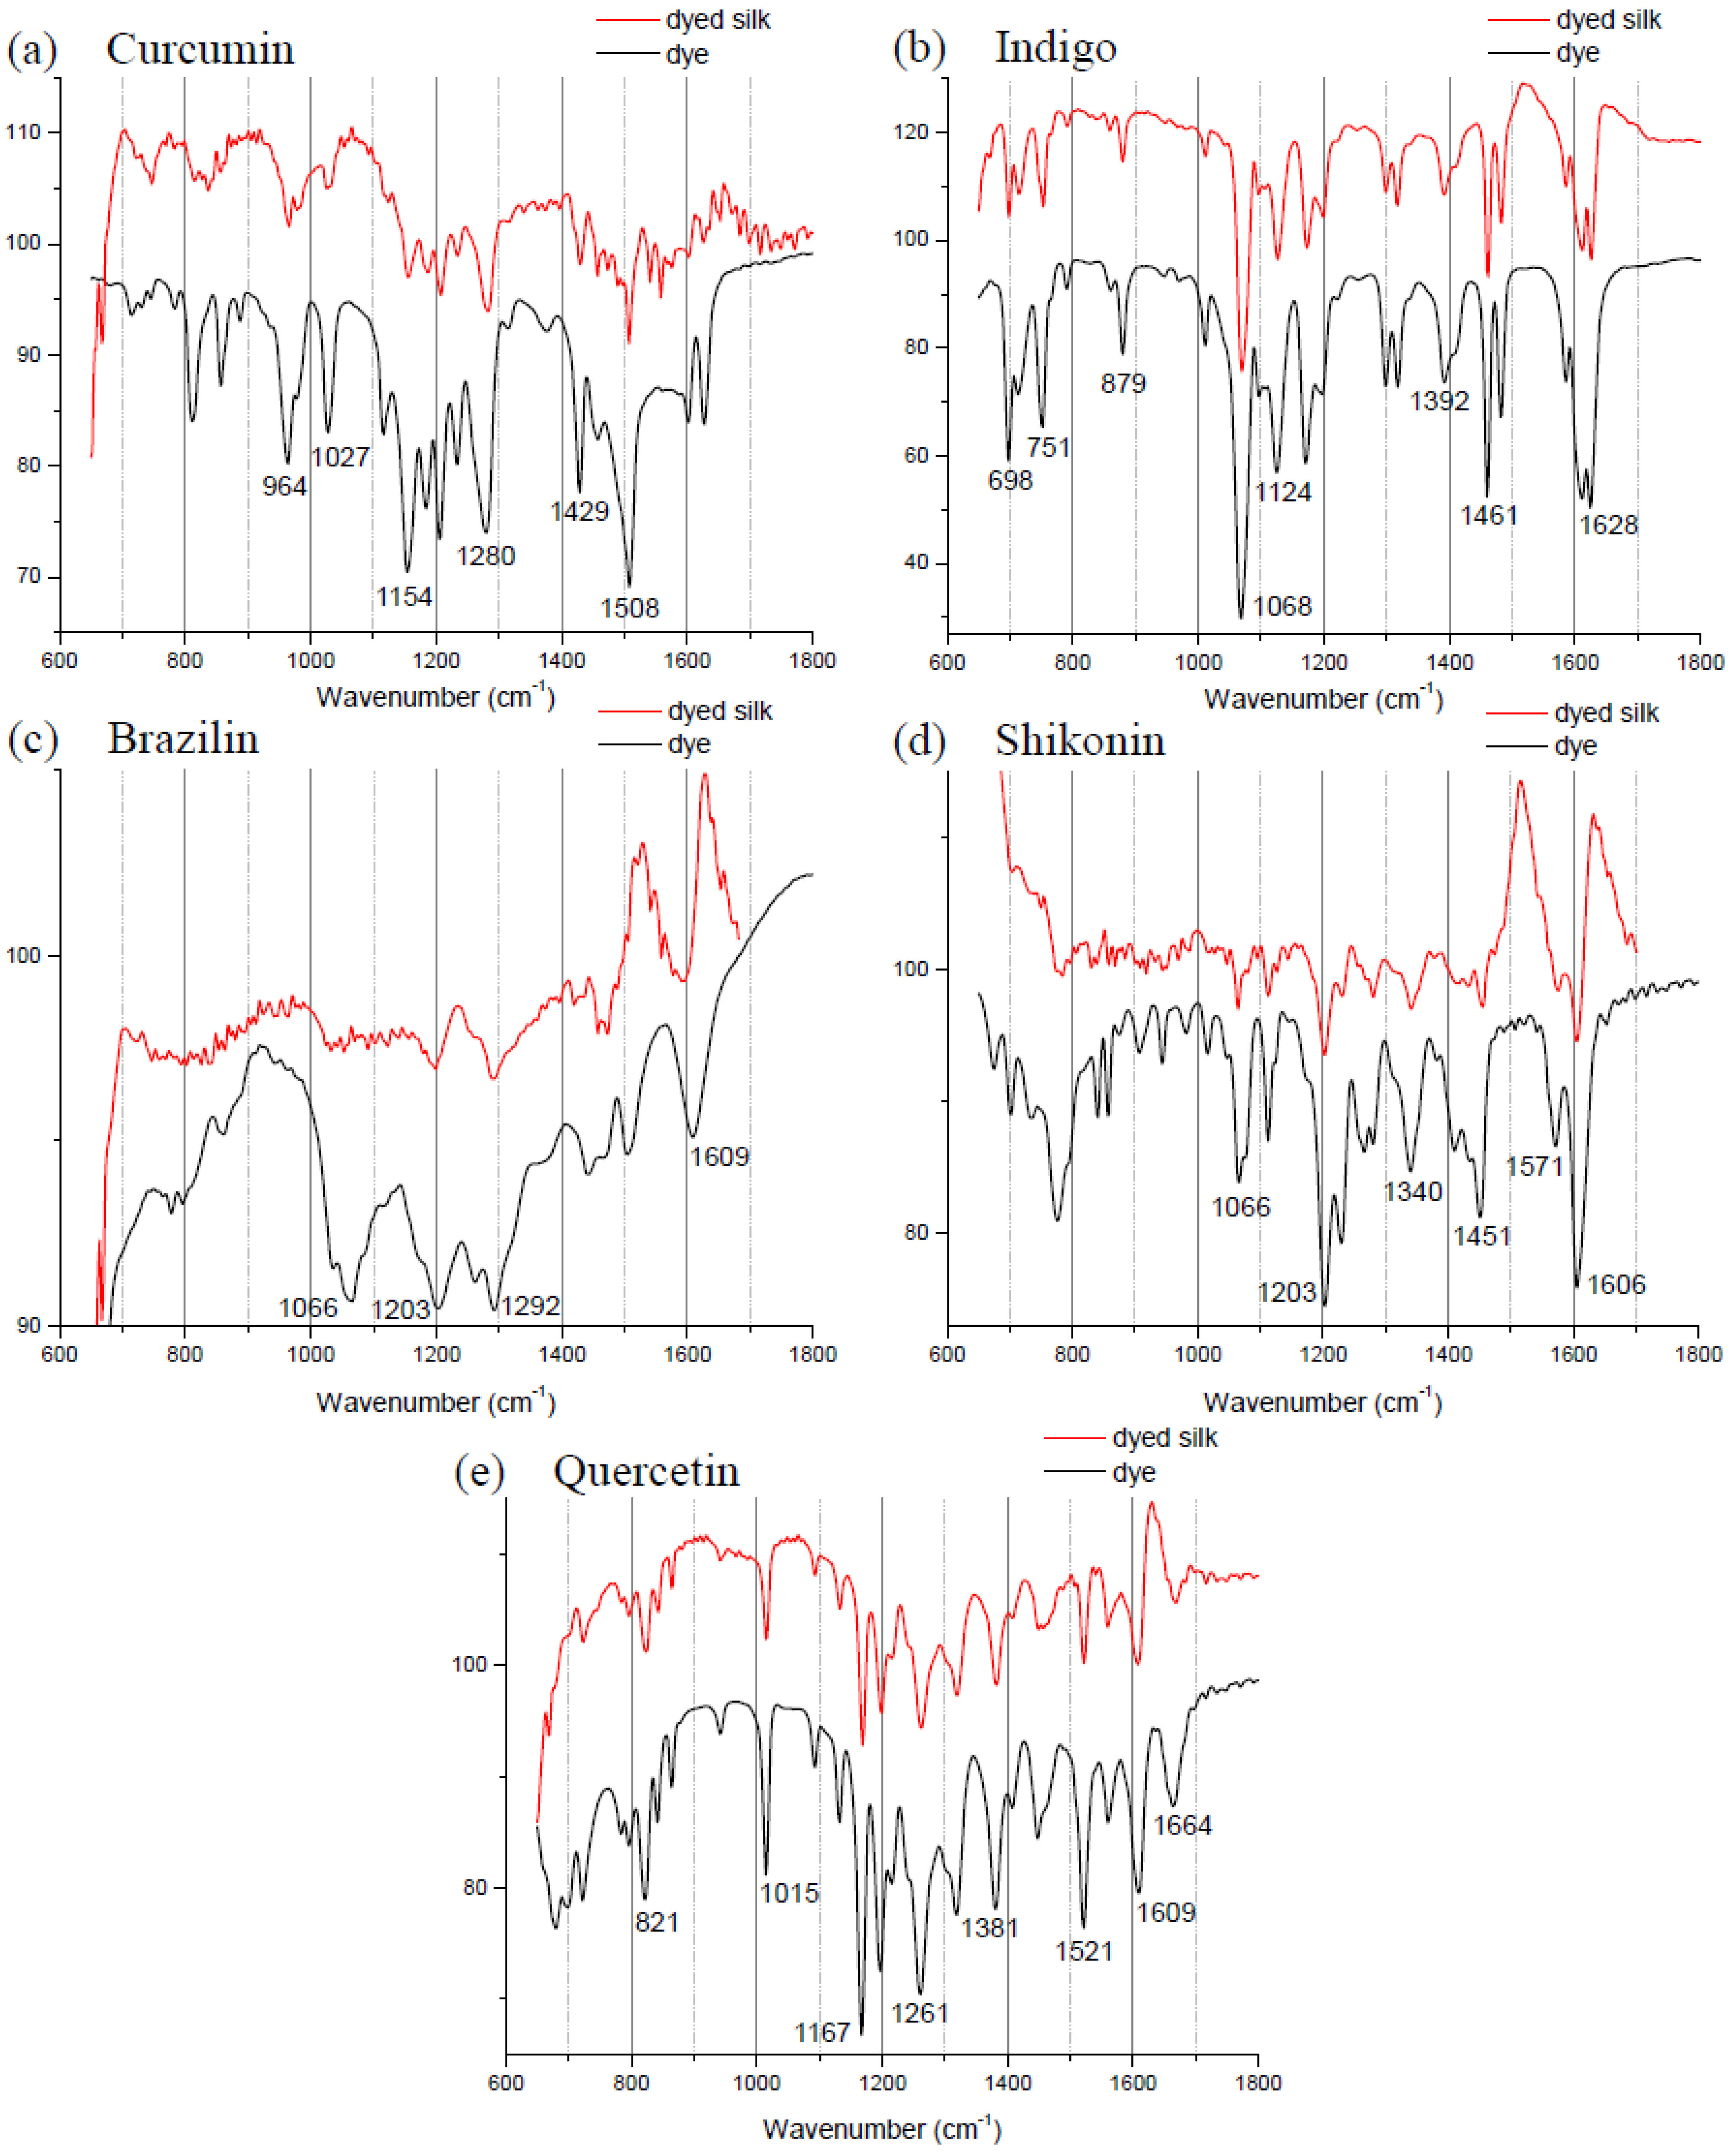
Figure 1 compares the FTIR spectra of curcumin, indigo, brazilin, shikonin and quercetin-dyed silk fabric obtained by subtraction of undyed silk with one obtained from the commercial dyes. Undyed silk textile was used to obtain the reference spectrum. No dye component could be detected in the FTIR spectra unless spectral subtractions were conducted. After spectral subtraction, it was easily possible to identify the dye component in all of the dyed silk fabric.
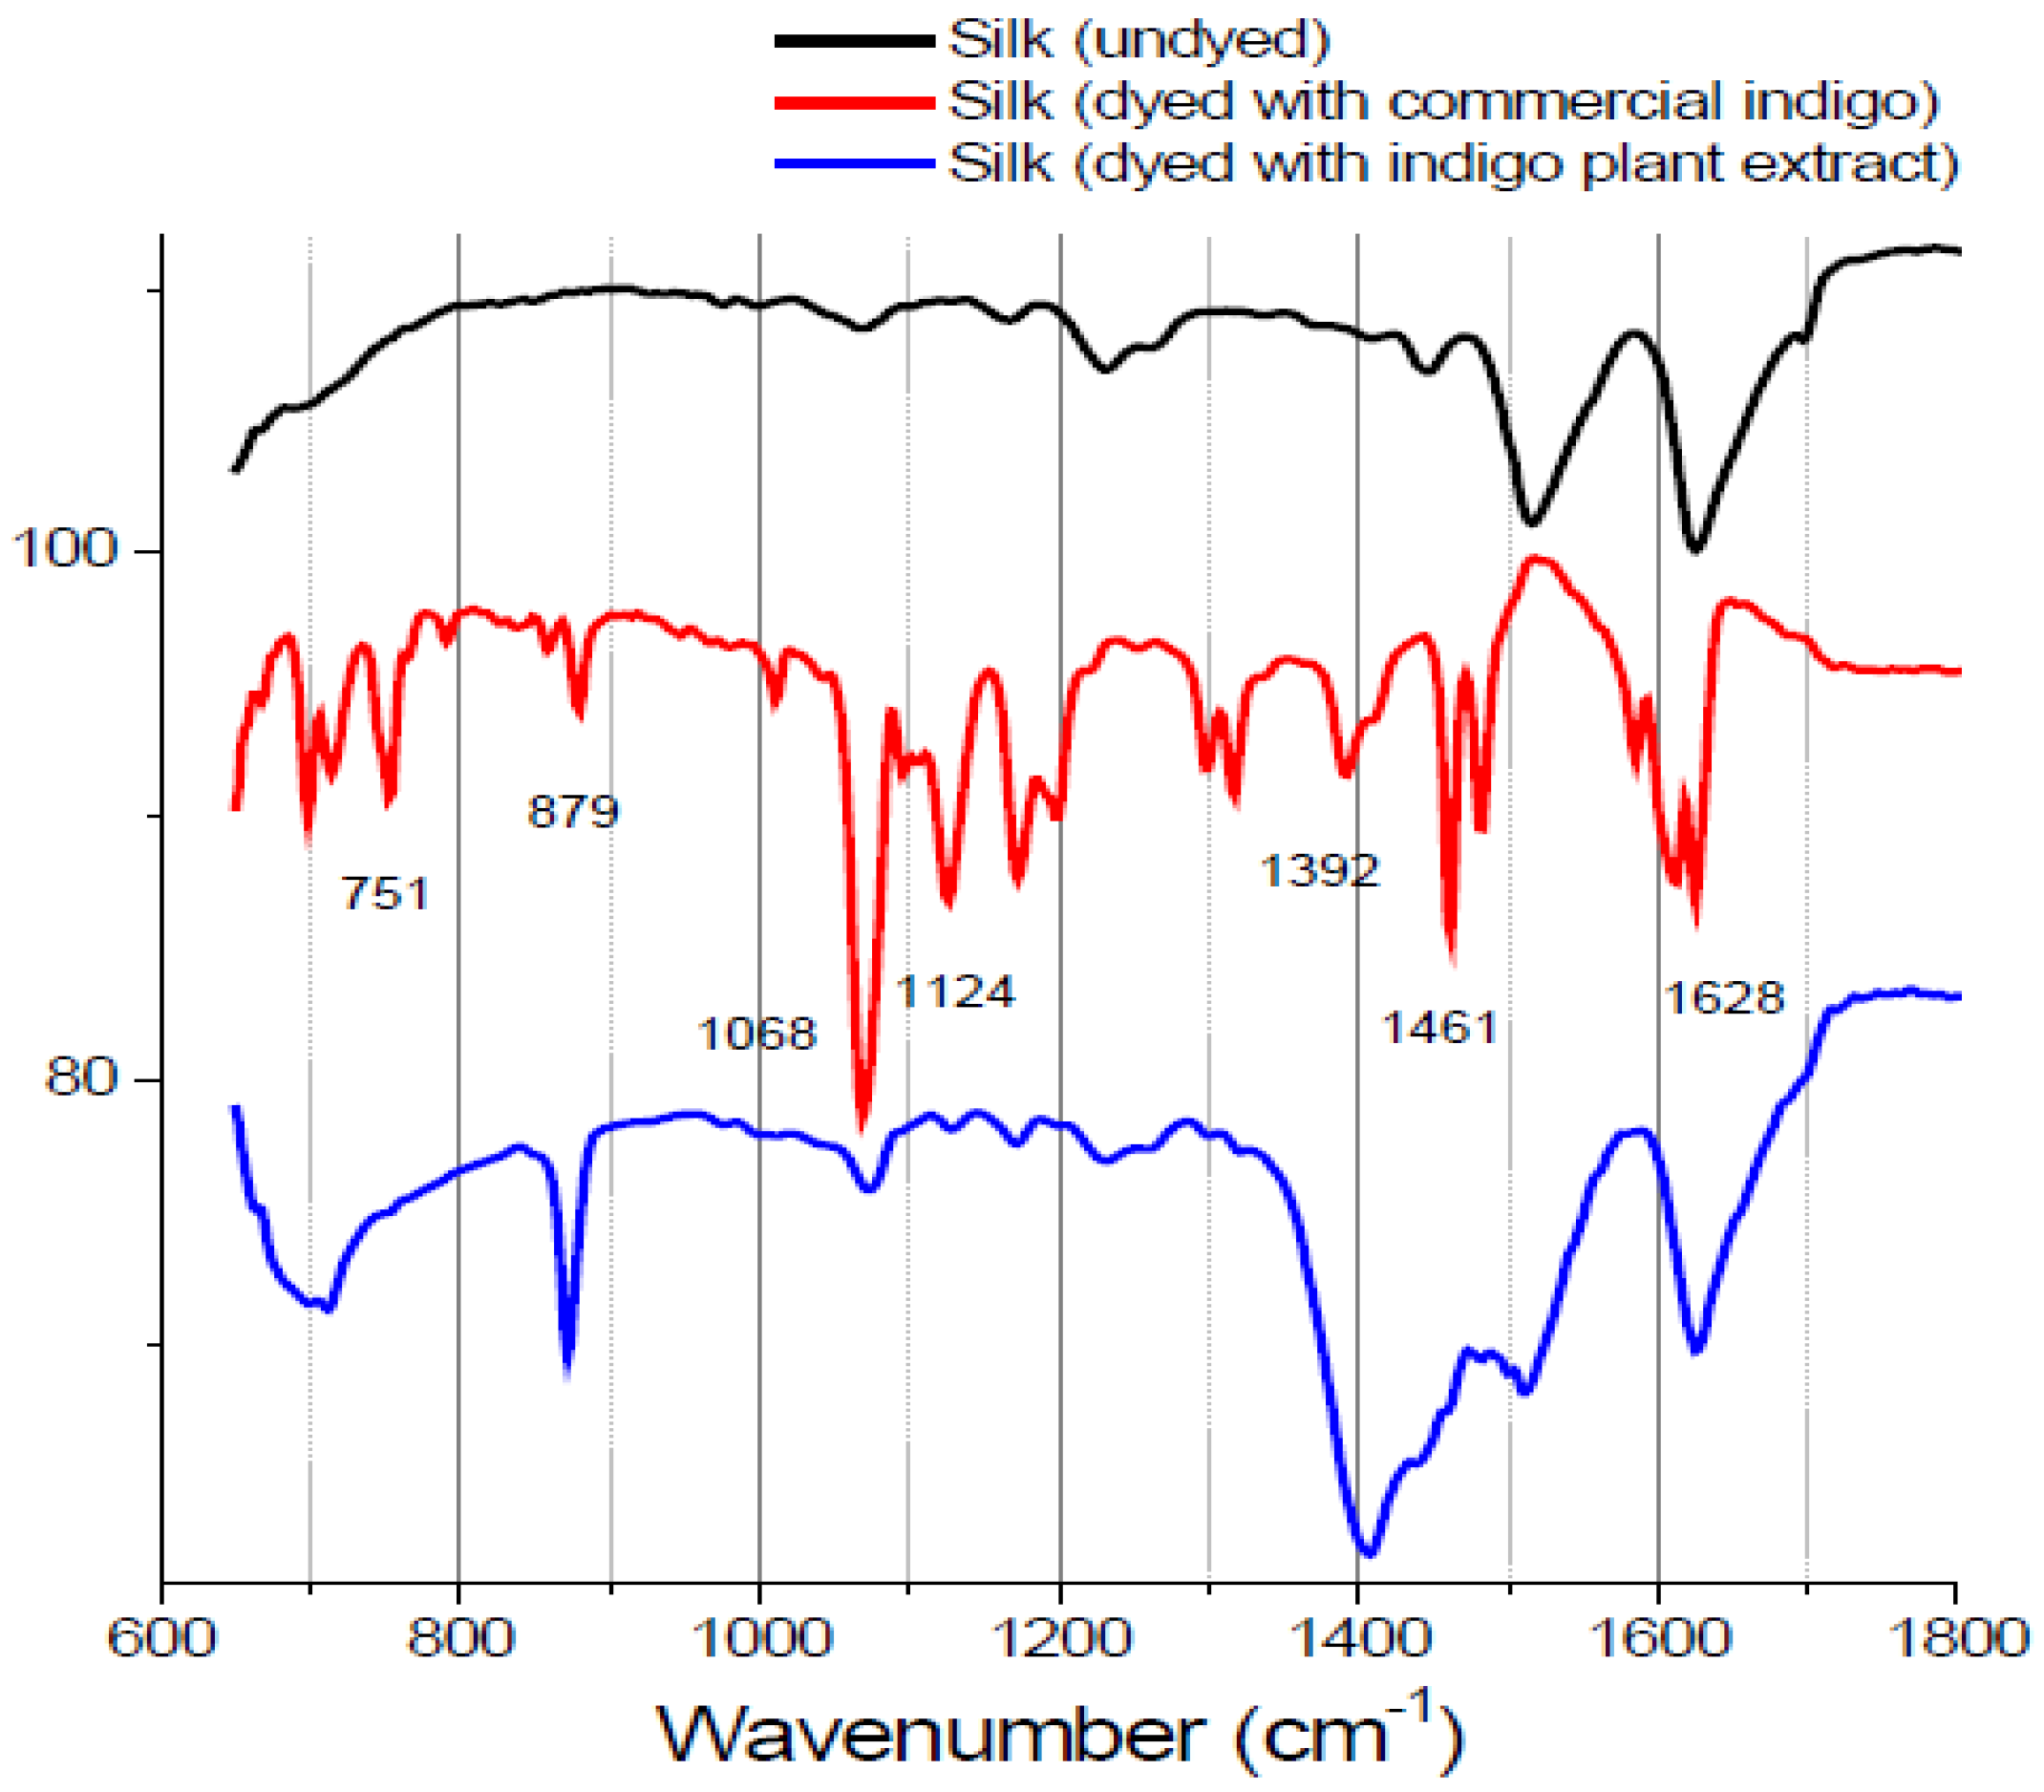
The spectrum of indigo is shown with a specific peak at 2360 cm−1 due to the N–H stretching, a peak at 1628 cm−1 that is because of C=O stretching and a peak at 1392 cm−1 that is because of N–H bending. Other specific peaks are the aromatic ring C=C vibration at 1461, 1483 and 1585 cm−1.
Figure 1.
Fourier transform infrared spectra of five commercial dyes and the dyed silk fabric between 600 and 1800 cm−1: (a) curcumin; (b) indigo; (c) brazilin; (d) shikonin; and (e) quercetin.
Figure 1.
Fourier transform infrared spectra of five commercial dyes and the dyed silk fabric between 600 and 1800 cm−1: (a) curcumin; (b) indigo; (c) brazilin; (d) shikonin; and (e) quercetin.
Minerals readily available from the environment were used in combination with natural dyes to provide a strong bond between the textile and the dye. Color brightness and fastness are improved by the use of mordants in the dyeing process. However, the mordant had no apparent effect on the FTIR spectra. The FTIR spectra of the indigo extract-dyed and zinc-mordanted silk fabric that underwent spectral subtraction of undyed silk from indigo-dyed silk matched those of silk fabric dyed with commercial indigo, with specific peaks at 1628, 1124 and 1068 cm
−1 (
Figure 2). These results, which are expected, because indigo is the main coloring component in indigo plant, support the accuracy of the FTIR technique. However, it was not possible to distinguish individual dye components in silk fabric dyed with the other natural extracts using the FTIR technique. In this study, we prepared dyed silk fabric using the traditional dying process; the amounts of dyes used in this procedure may be below the detection limit of FTIR.
Figure 2.
Fourier transform infrared spectra of undyed silk textile with commercial indigo and silk textile dyed with indigo plant extract. The characteristic peaks allow easy identification. The spectra are vertically shifted for sake of clarity.
Figure 2.
Fourier transform infrared spectra of undyed silk textile with commercial indigo and silk textile dyed with indigo plant extract. The characteristic peaks allow easy identification. The spectra are vertically shifted for sake of clarity.
3.2. XPS Measurement
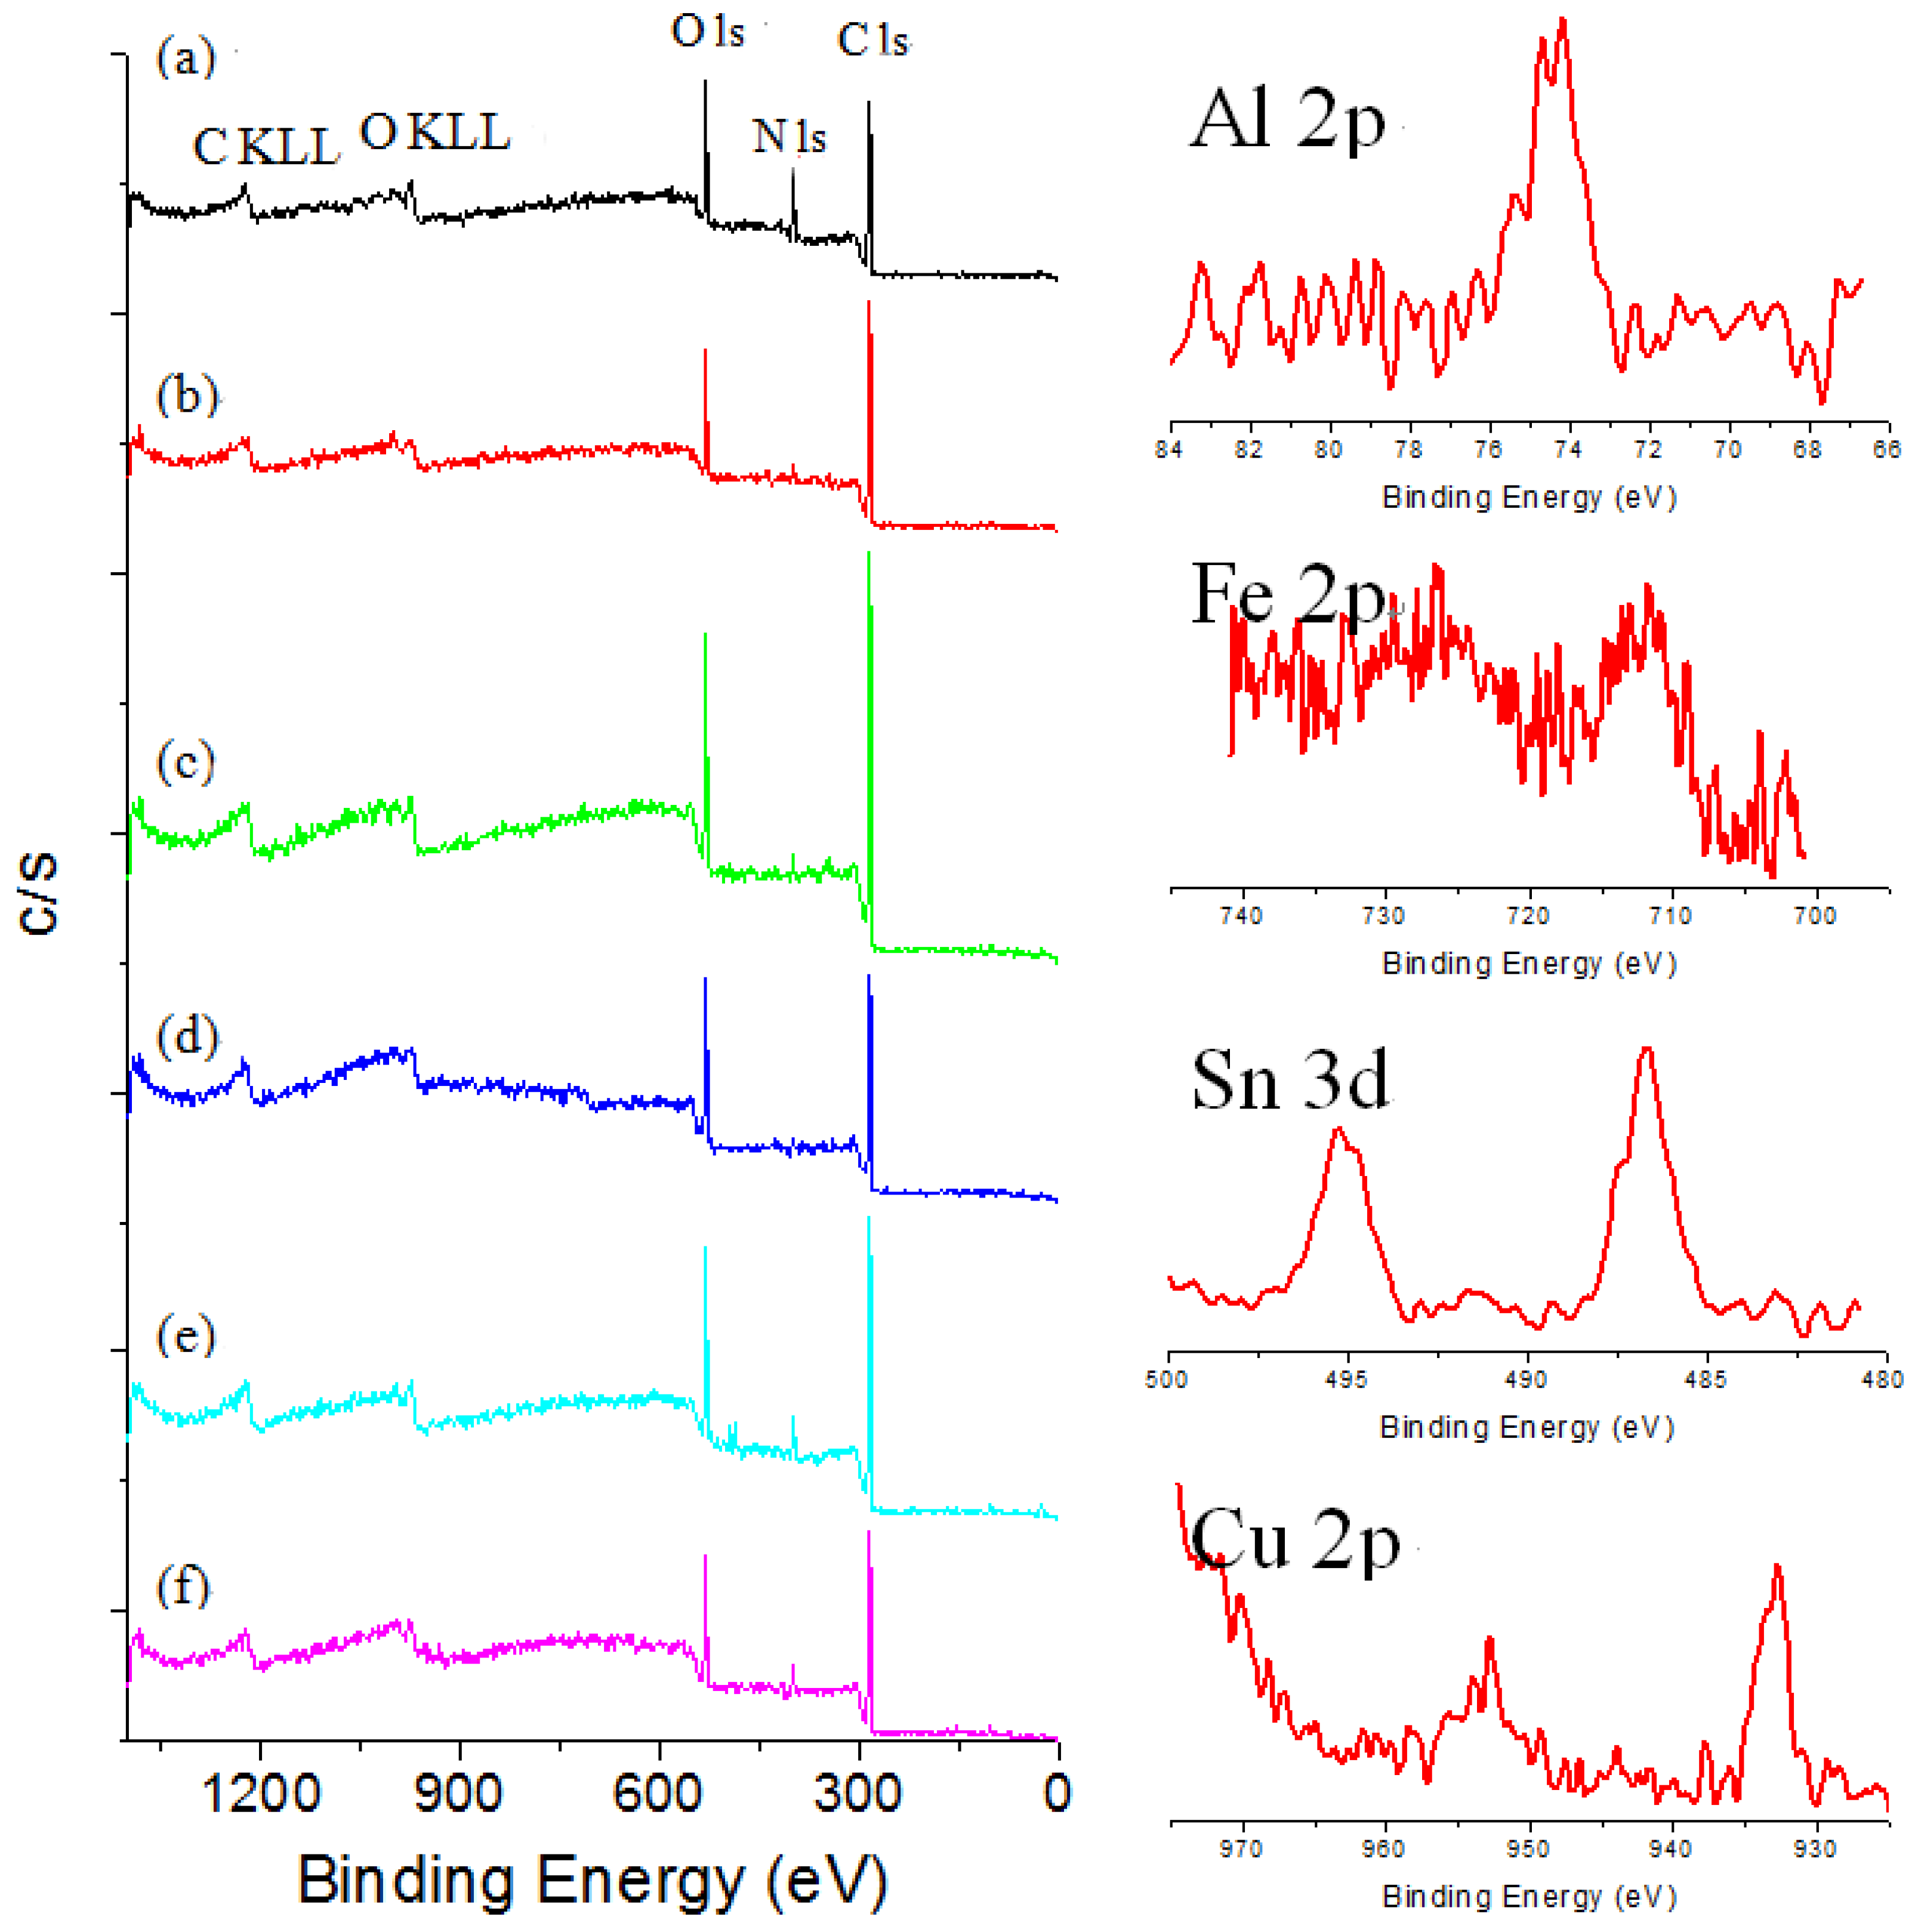
XPS techniques have rarely been applied to the identification of specific dyes in textiles, because signals due to the textile heavily interfere with the identification of coloring materials. The XPS survey spectra for dyed silk fabric were obtained to determine chemical compositions of silk textiles. C1s and O1s peaks are the main signals in the survey spectra of the silk fabric dyed with curcumin, brazilin, shikonin and quercetin, while C1s, O1s and N1s peaks are the main signals for those dyed with indigo. As can be seen in
Figure 3, the survey spectra of sappanwood-dyed silk fabric reveal the presence of aluminum, iron, tin and copper due to the addition of mordants during the dyeing process. The calculated atomic concentrations obtained by XPS for the sappanwood-dyed silk fabric are listed in
Table 3. As expected, the surface compositions of these silk textiles are similar. The discrepancy of carbon and oxygen concentrations from the theoretical values was probably caused by hydrocarbon and remaining vapor contamination, the textile surface and the surface degradation induced by X-ray. The amounts of mordants are rather low, so their peaks are not intense in the XPS spectra. However, quantitative results for various mordant elements in dyed silk fabric were obtained by the XPS technique.
Figure 3.
Survey XPS spectra of (a) undyed silk and sappanwood-dyed silk textiles; (b) without mordant and with various mordants: (c) KAl(SO4)2; (d) FeSO4; (e) SnCl4; and (f) CuSO4.
Figure 3.
Survey XPS spectra of (a) undyed silk and sappanwood-dyed silk textiles; (b) without mordant and with various mordants: (c) KAl(SO4)2; (d) FeSO4; (e) SnCl4; and (f) CuSO4.
Table 3.
XPS Surface compositions of silk fabric dyed with sappanwood extracts and different mordants.
Table 3.
XPS Surface compositions of silk fabric dyed with sappanwood extracts and different mordants.
| Sample/Mordant | Elements composition (%) |
|---|
| C (%) | O (%) | N (%) | Al (%) | Fe (%) | Sn (%) | Cu (%) |
|---|
| Sappanwood | 77.05 | 18.28 | 4.66 | – | – | – | – |
| Sappanwood/K,Al(SO4)2 | 76.28 | 21.14 | 1.53 | 1.04 | – | – | – |
| Sappanwood/FeSO4 | 74.21 | 22.77 | 2.17 | – | 0.85 | – | – |
| Sappanwood/SnCl4 | 73.18 | 20.34 | 6.12 | – | – | 0.36 | – |
| Sappanwood/CuSO4 | 73.66 | 20.62 | 4.63 | – | – | – | 1.09 |
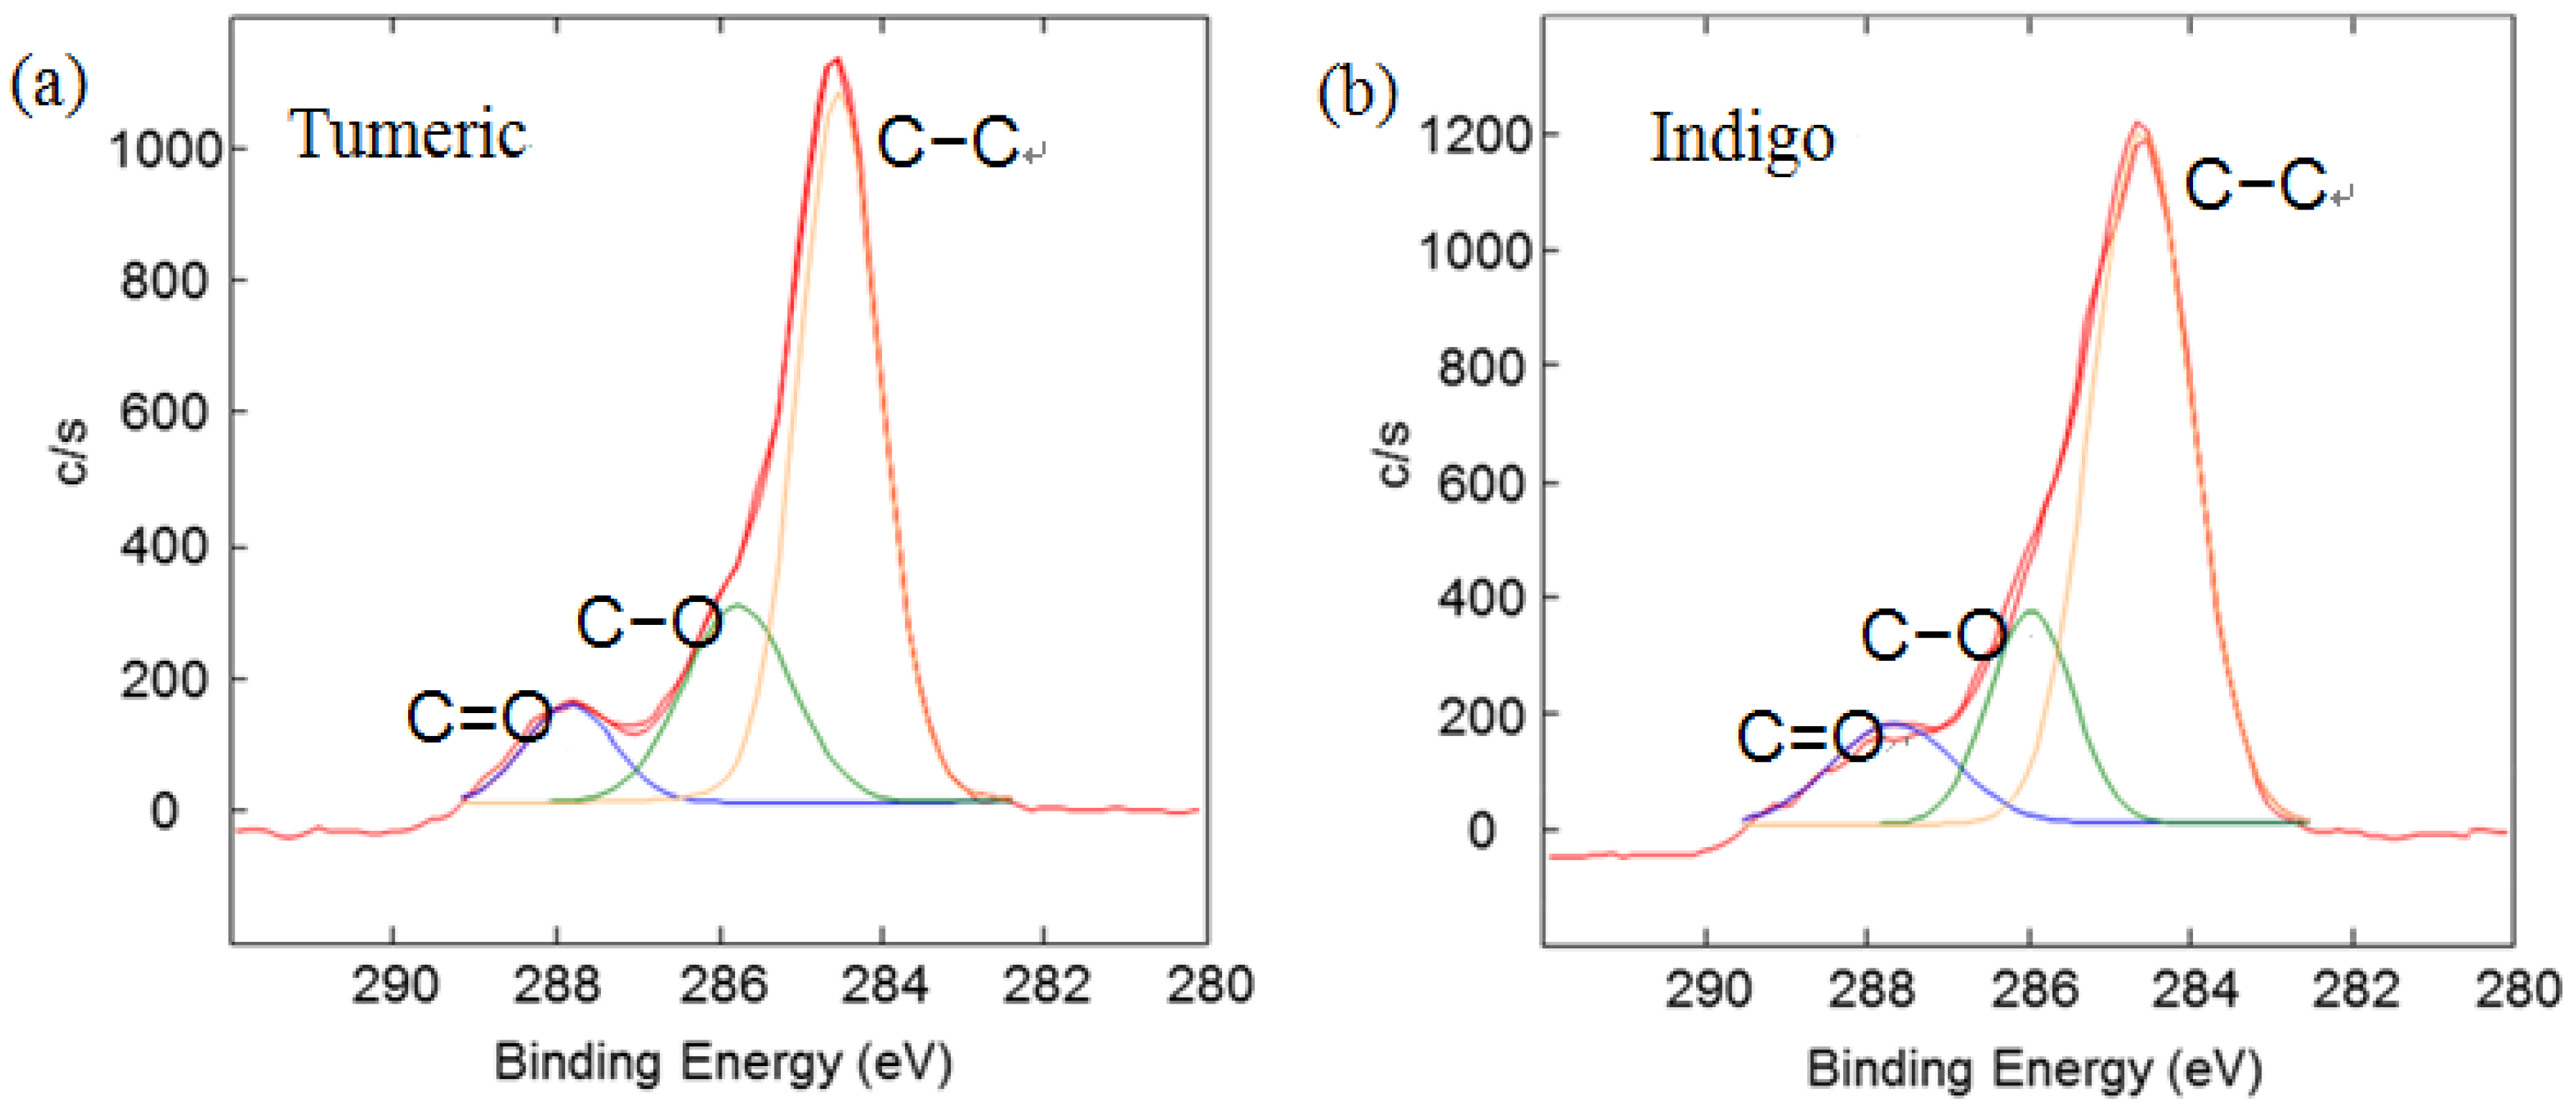
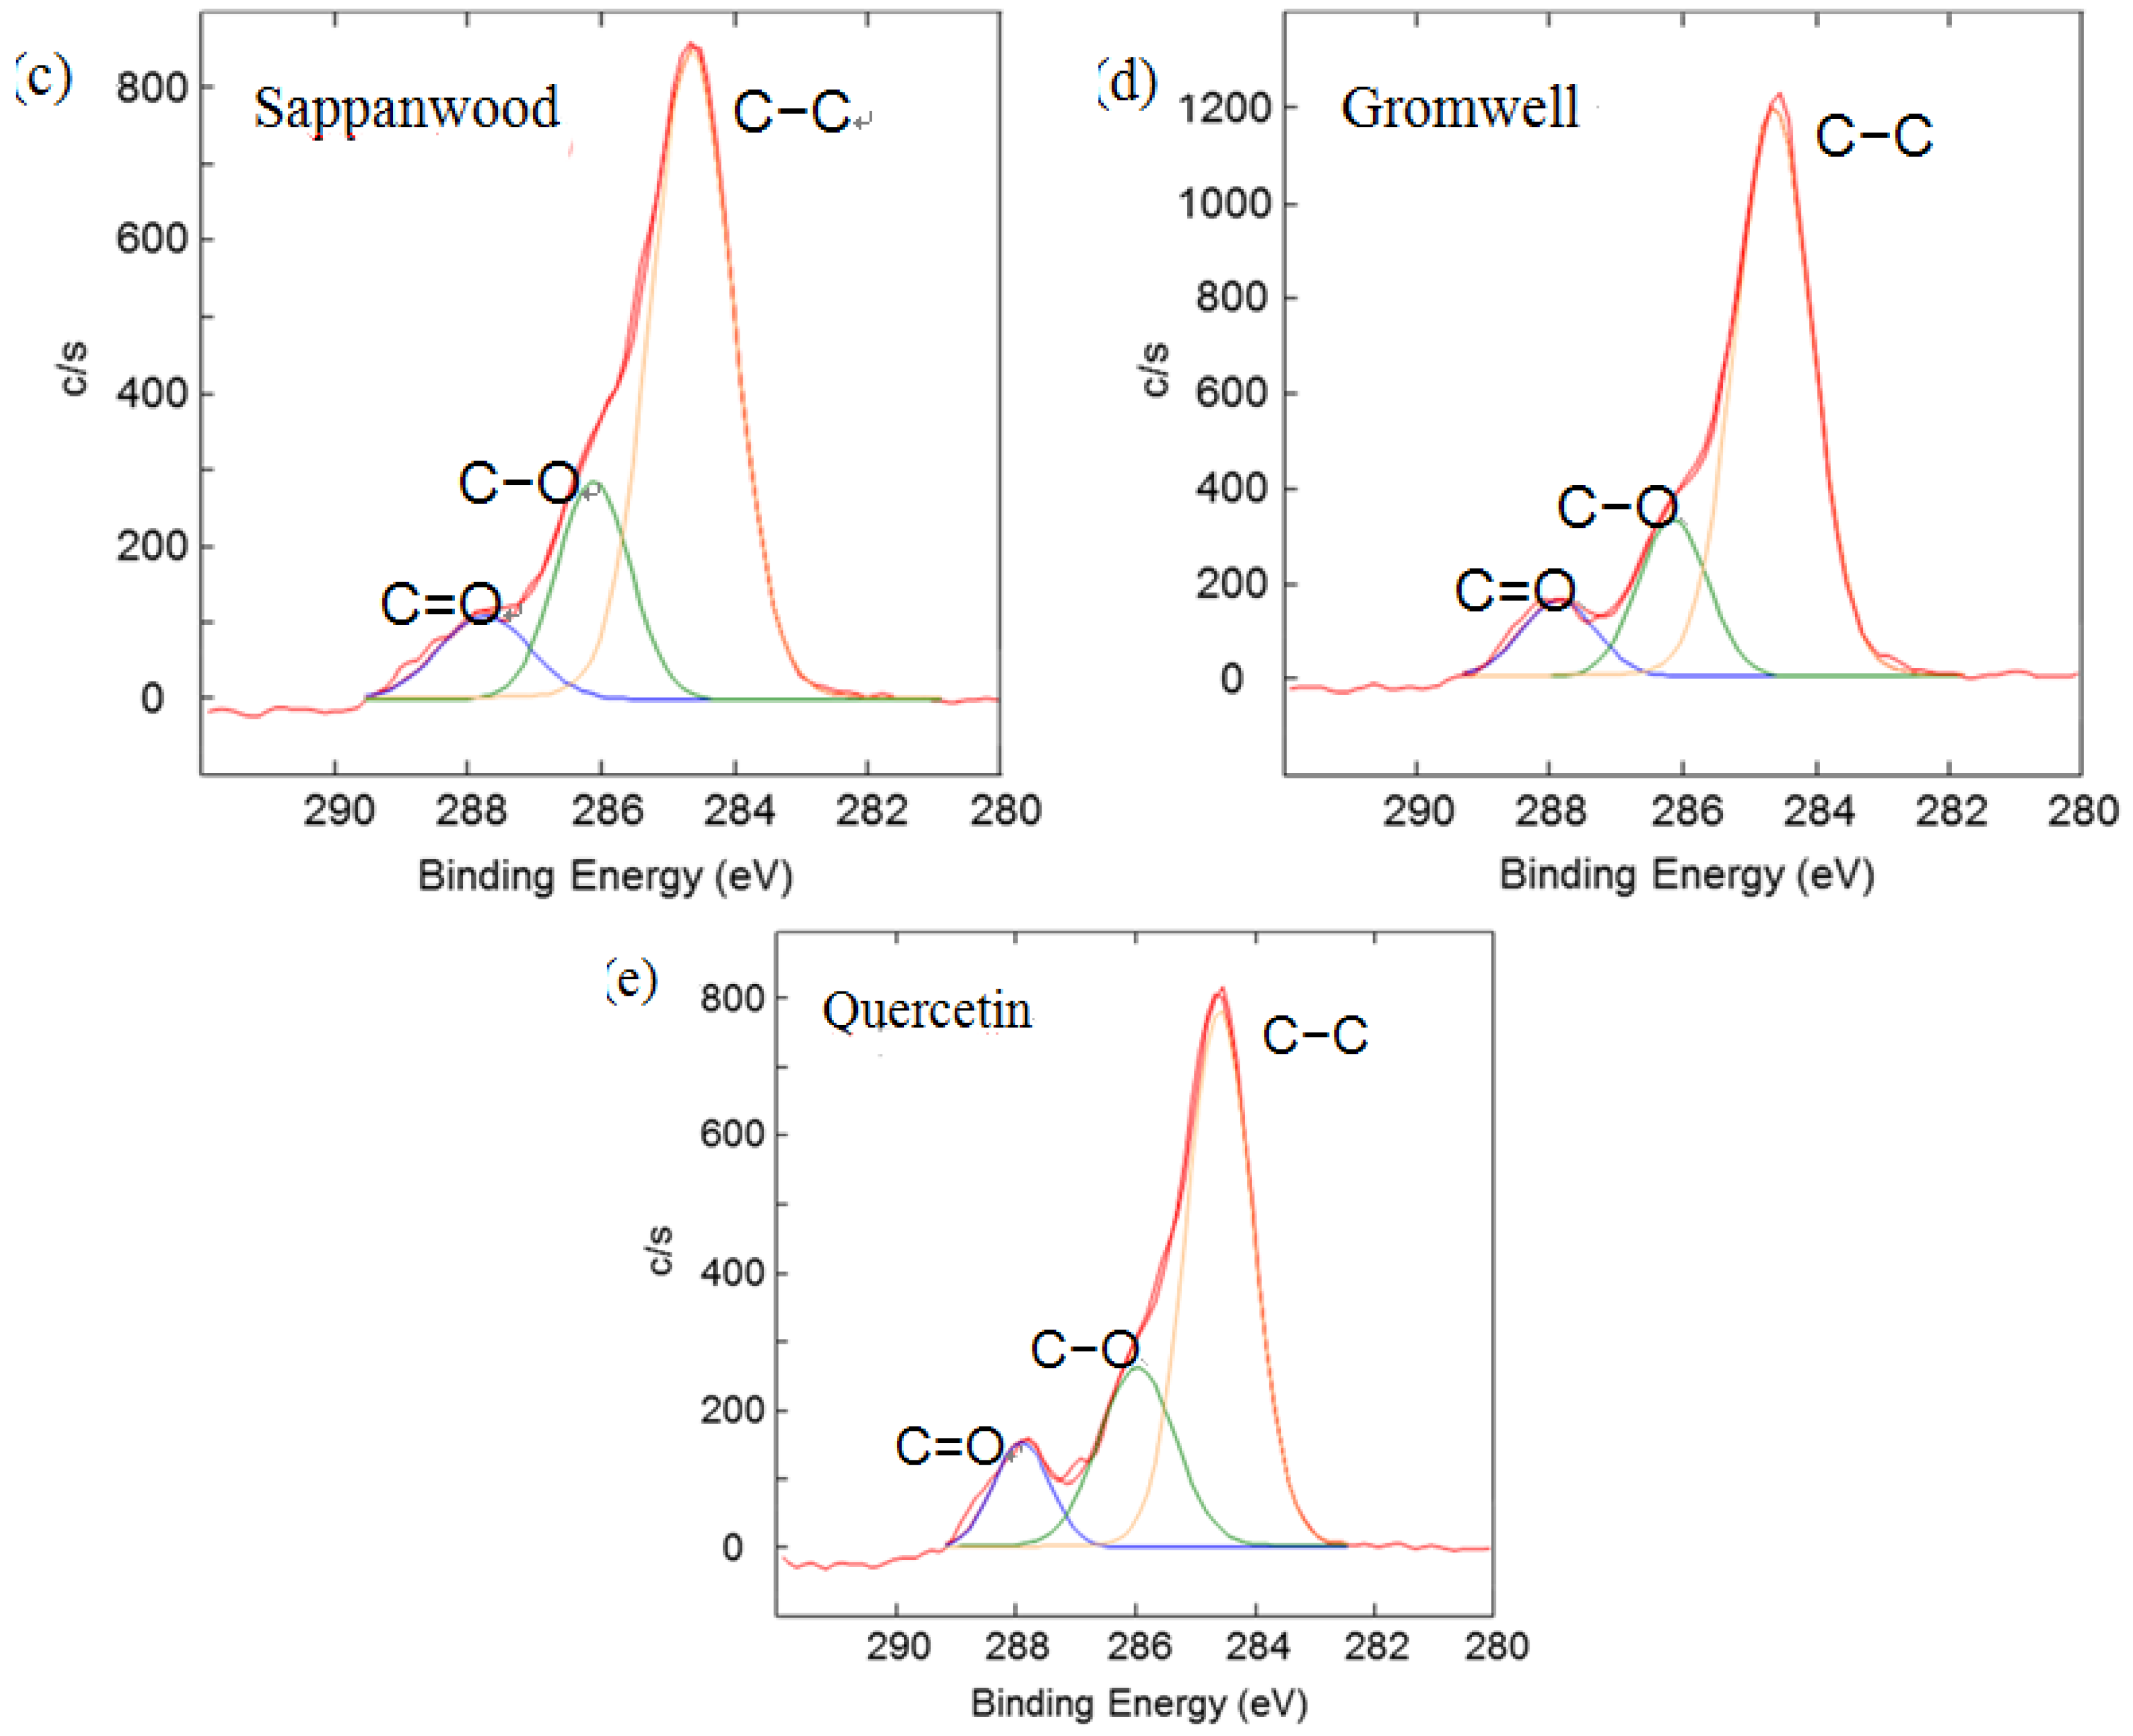
To offset the surface charging phenomena, all binding energies in the C1s core level spectra were referenced to the C–C peak centered at 284.6 eV. The peak deconvolution of the XPS result was performed by Gaussian-Lorentz mixture function using MULTI-PAK v9.1 software.
Figure 4 illustrates C1s peaks of dyed silk fabric resolved using curve fitting. The XPS results for the silk fabric dyed with turmeric, indigo, sappanwood, gromwell and quercetin are listed in
Table 4. The table presents the percentages of each carbon functional group presented in the spectra. The peak fitting was performed with a consideration of parameters, such as binding energy, full width at half maximum and Gaussian character. The fitting parameters for the dye components of the dyed silk textile in the C1s spectrum were determined by analyzing the C1s spectrum measured for a sample of commercial dye. Line-shape analysis using peak deconvolution shows that the C1s spectrum for undyed silk textile contains three distinct peaks at 284.6 (–C–C), 286.2 (–C–OH or –C–N) and 288.0 eV (N–C=O). These peaks may be attributed to the bonds present in the silk and to any residual surface contaminants. After the dyeing process with plant extracts, the intensity of C1s increased and C1s spectra showed peaks of oxygen-containing groups at 286.2 (–C–OH or –C–O–C) and 287.6 eV (–C=O) with different intensities. As shown in the chemical structures of
Table 1, turmeric and quercetin have more oxygen-containing functional groups, like hydroxyl and carboxyl groups, than gromwell. XPS results also indicated that turmeric and quercetin had more C–OH and C=O bonds than gromwell. The XPS technique provided the quantification results for the surface composition of the dyed silk textiles with various plant extracts and mordants.
Figure 4.
Results of the curve fitting analysis of C1s spectrum measured for silk textiles dyed with plant extracts. (a) Turmeric; (b) Indigo; (c) Sappanwood; (d) Gromwell; (e) Quercetin.
Figure 4.
Results of the curve fitting analysis of C1s spectrum measured for silk textiles dyed with plant extracts. (a) Turmeric; (b) Indigo; (c) Sappanwood; (d) Gromwell; (e) Quercetin.
Table 4.
Relative concentration of C1s components for silk fabric dyed with plant extracts.
Table 4.
Relative concentration of C1s components for silk fabric dyed with plant extracts.
| Sample | Relative chemical bond area Cls (%) |
|---|
| C−C (284.6 eV) | C−O C−N (286.2 eV) | C=O (287.7 eV) |
|---|
| Turmeric | 67.22 | 23.28 | 9.51 |
| Indigo | 69.55 | 18.08 | 12.37 |
| Sappanwood | 69.92 | 20.32 | 9.76 |
| Gromwell | 73.10 | 17.73 | 9.17 |
| Quercetin | 65.17 | 24.26 | 10.58 |
3.3. TOF-SIMS Measurement
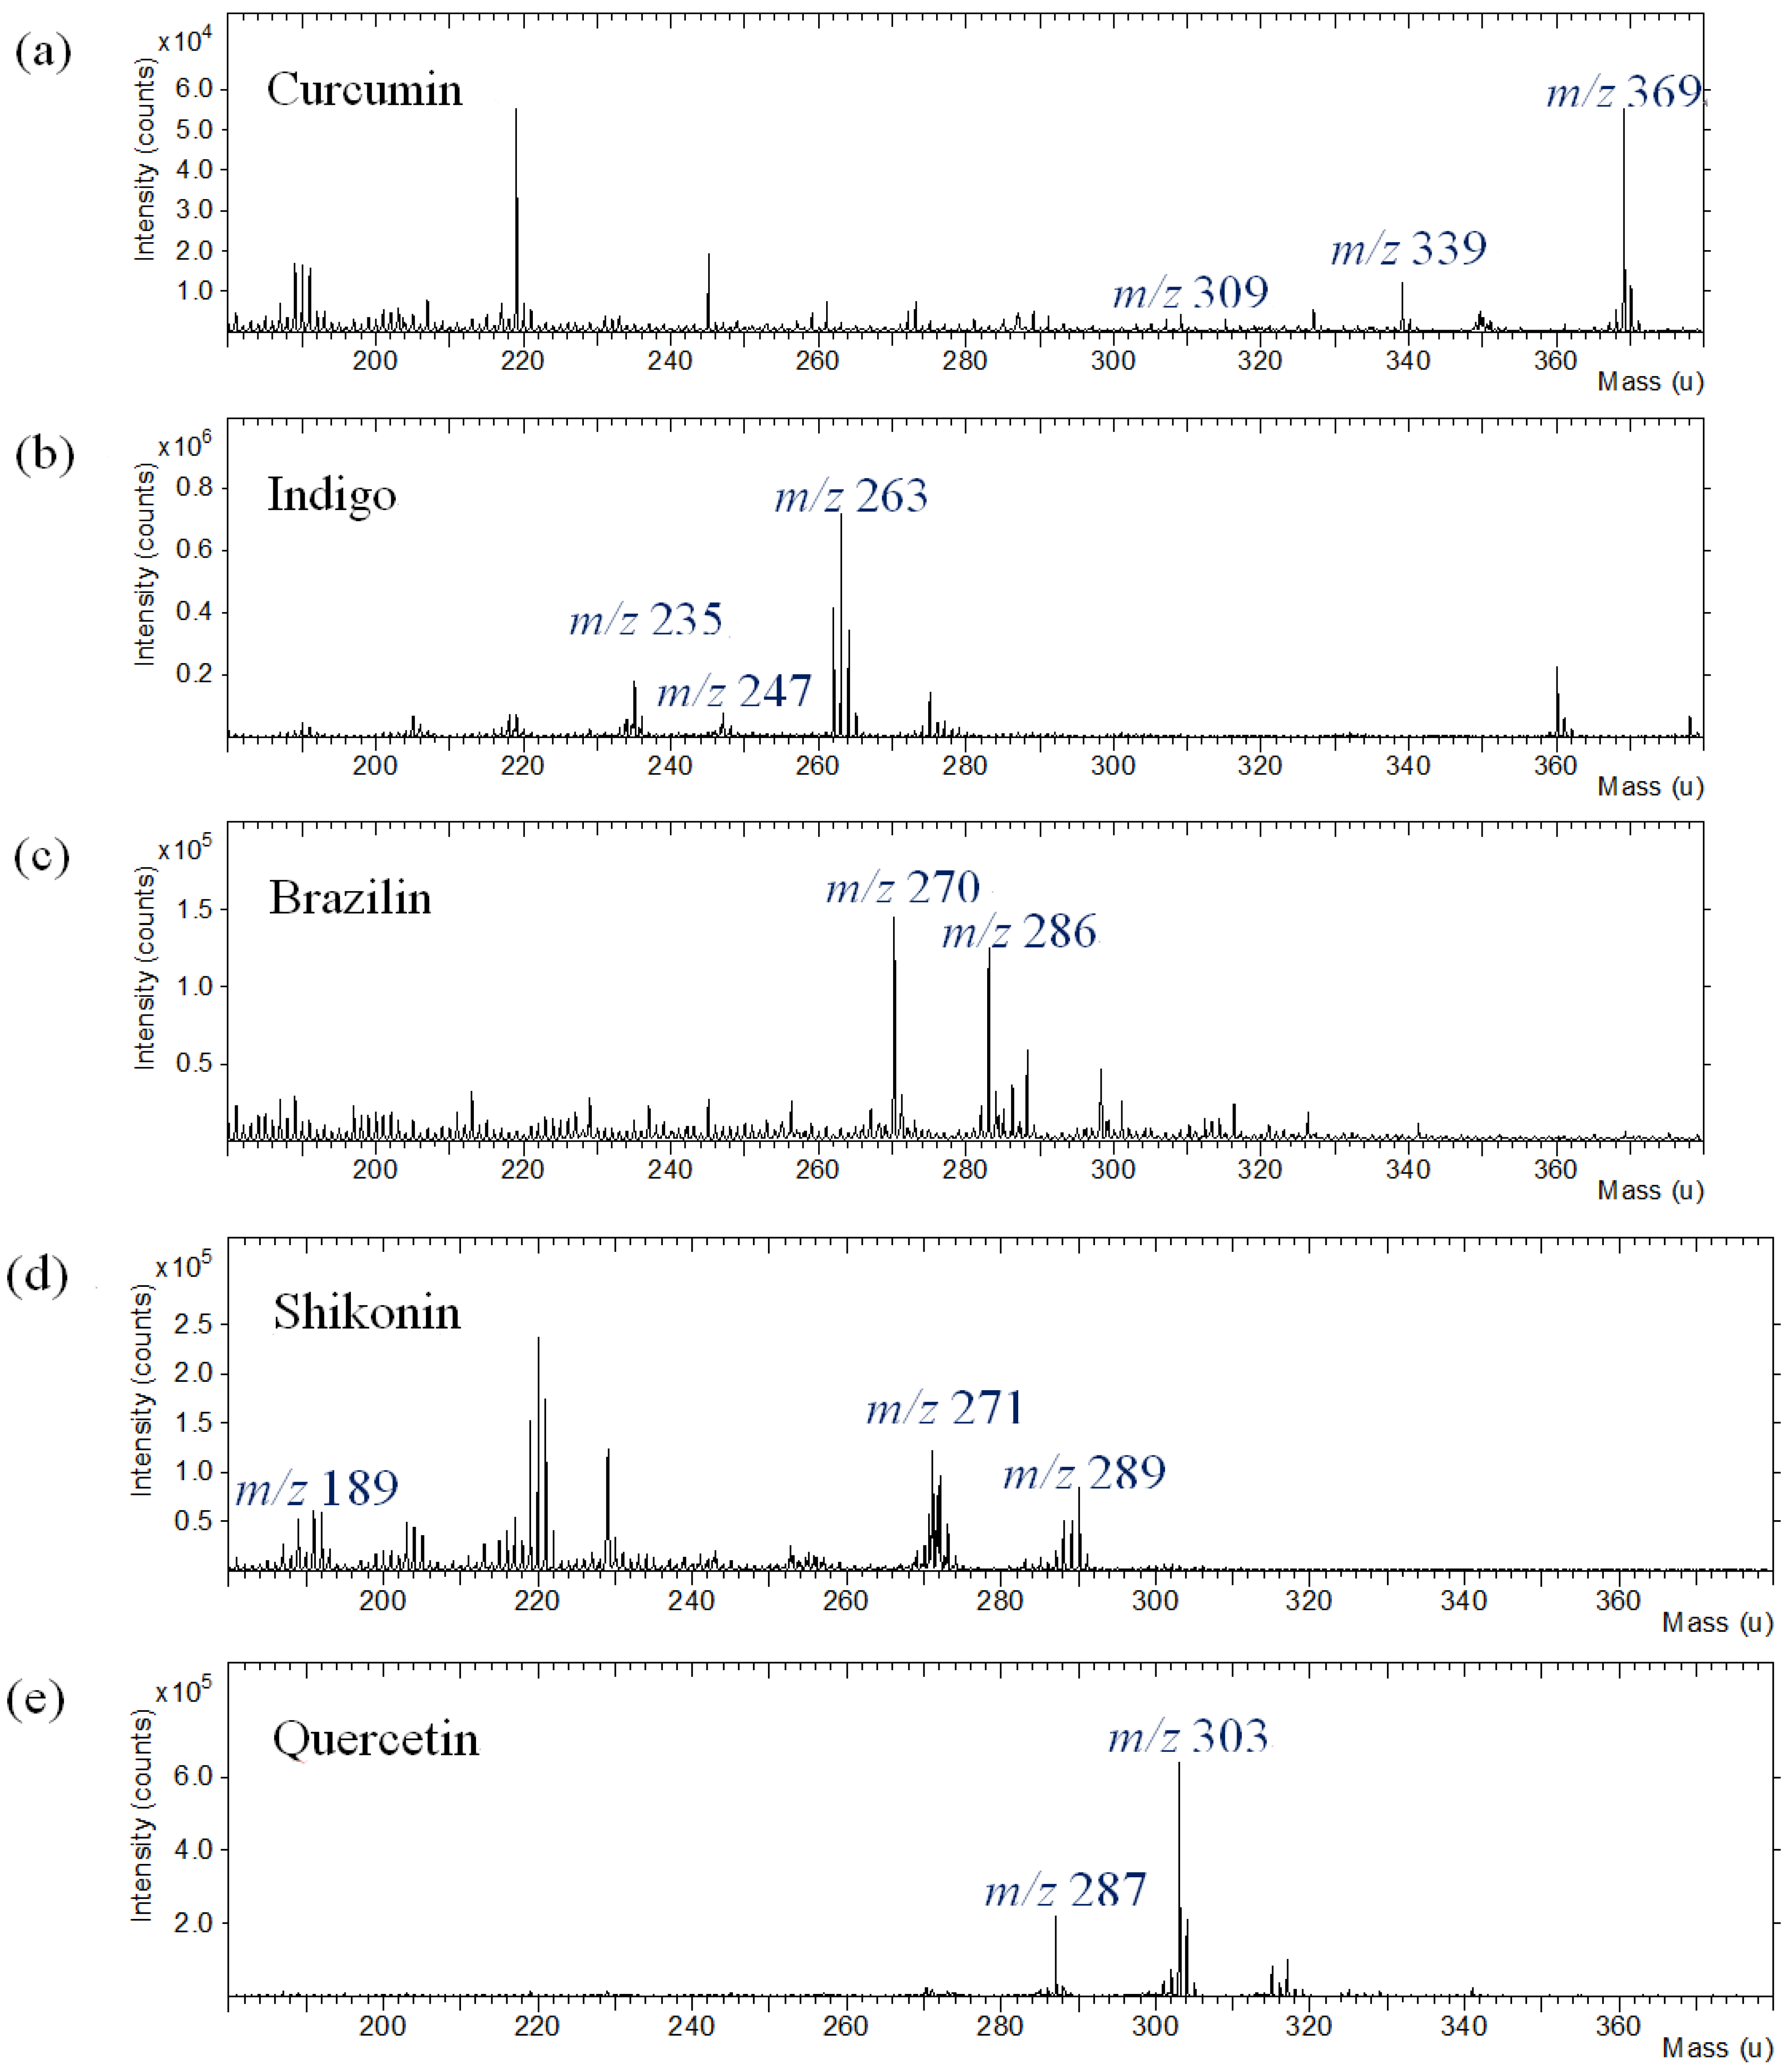
The commercial dyes used in this work were curcumin, indigo, brazilin, shikonin and quercetin. Five commercial natural dyes were purchased from the manufacturer, and their TOF-SIMS spectra were obtained from thin layer films cast from solutions of dyes in solvent on a silicon substate. The TOF-SIMS technique provides molecular structure and composition information from the uppermost layer of the dye components. To characterize the commercial natural dyes, the positive ion TOF-SIMS mass spectra were acquired at the film surface of the dyes. The positive ion mass spectra of the dyes were acquired using a Bi
+ primary ion beam under static SIMS conditions from a solution-cast dye film exposed to room temperature, as shown in
Figure 5.
Figure 5.
Positive ion TOF-SIMS spectra of commercial natural dyes on the silicon substrate. (a) curcumin; (b) indigo; (c) brazilin; (d) shikonin; (e) quercetin.
Figure 5.
Positive ion TOF-SIMS spectra of commercial natural dyes on the silicon substrate. (a) curcumin; (b) indigo; (c) brazilin; (d) shikonin; (e) quercetin.
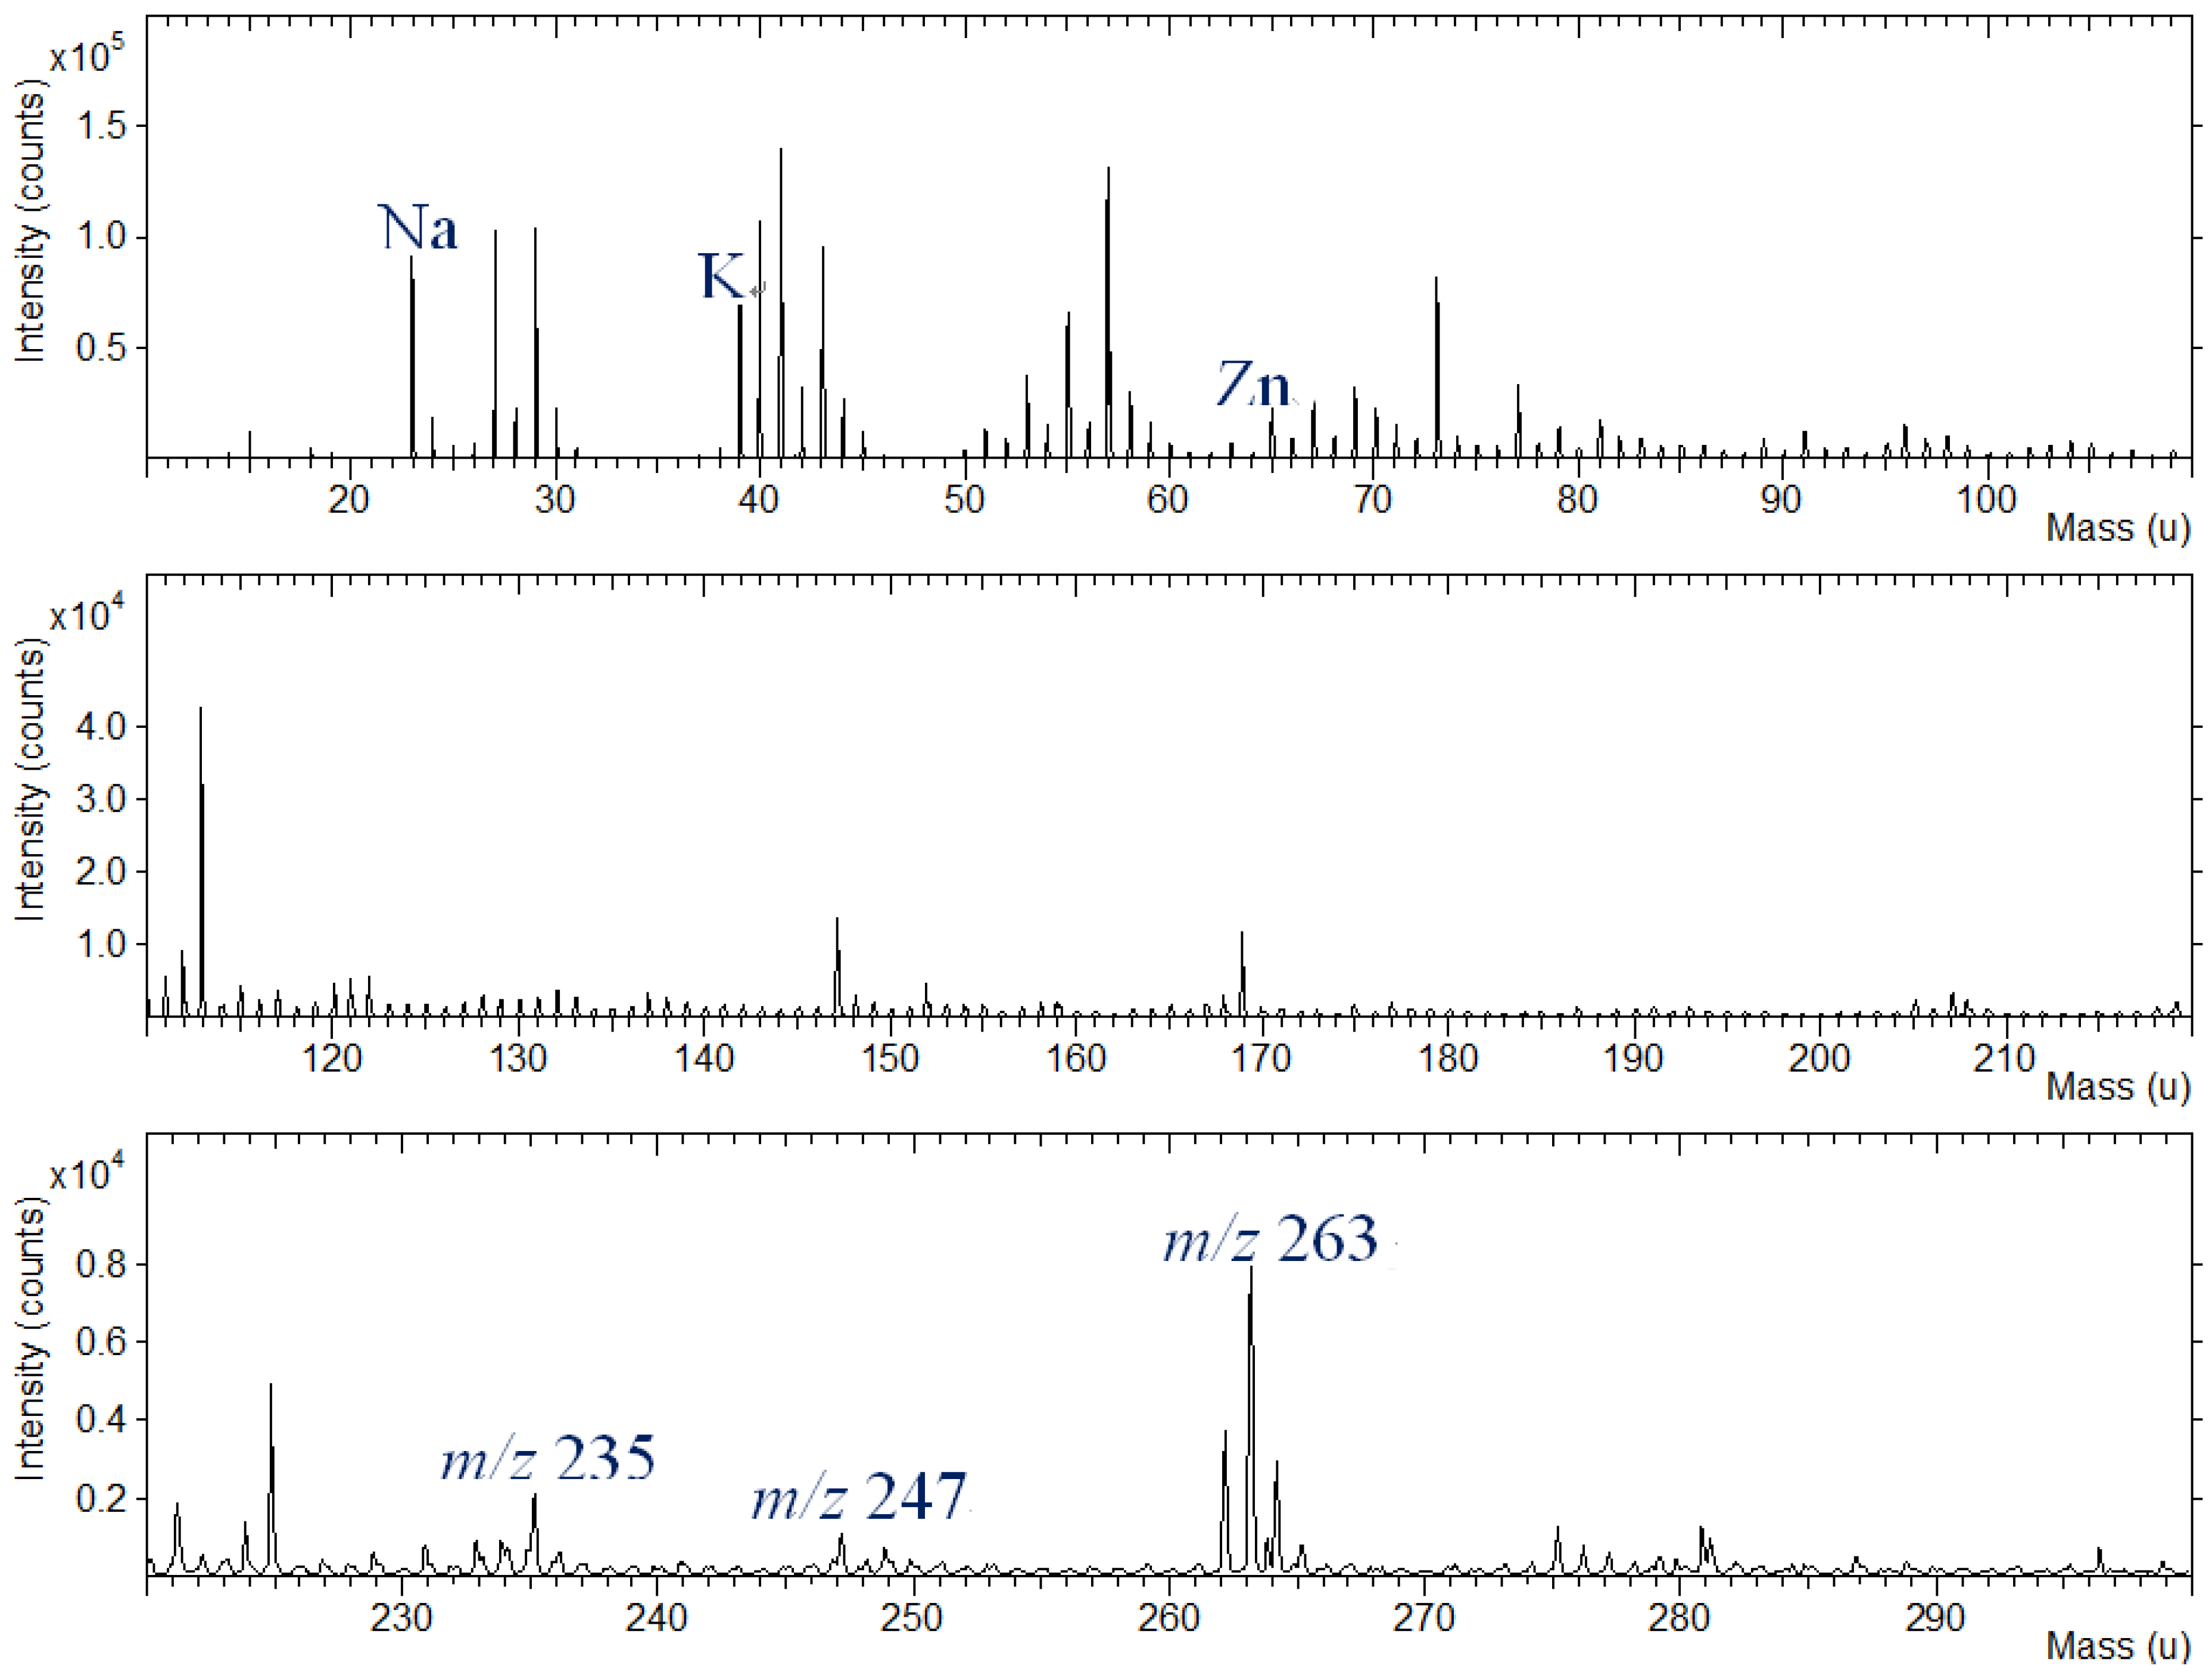
Interpretation of the spectra will focus on the information they provide for structural characterization. A segment from a typical spectrum of dyes in the mass range of m/z = 0–100 shows that the dominant peaks are C2H3+ (m/z 27.023), C2H5+ (m/z 29.039), C3H5+ (m/z 41.039), C3H7+ (m/z 43.055), C2H3O+ (m/z 43.018), C4H7+ (m/z 55.055), C3H3O+ (m/z 55.018), C4H9+ (m/z 57.070) and C3H5O+ (m/z 57.034). Na+ (m/z 22.990) and K+ (m/z 38.964) ions are also found in the spectra, as well as Si+ (m/z 27.977) from the silicon substrate (not shown in the figure). The other peaks in the lower mass range are due to carbon- and oxygen-containing ions that are found in the positive spectra of nearly all organic materials.
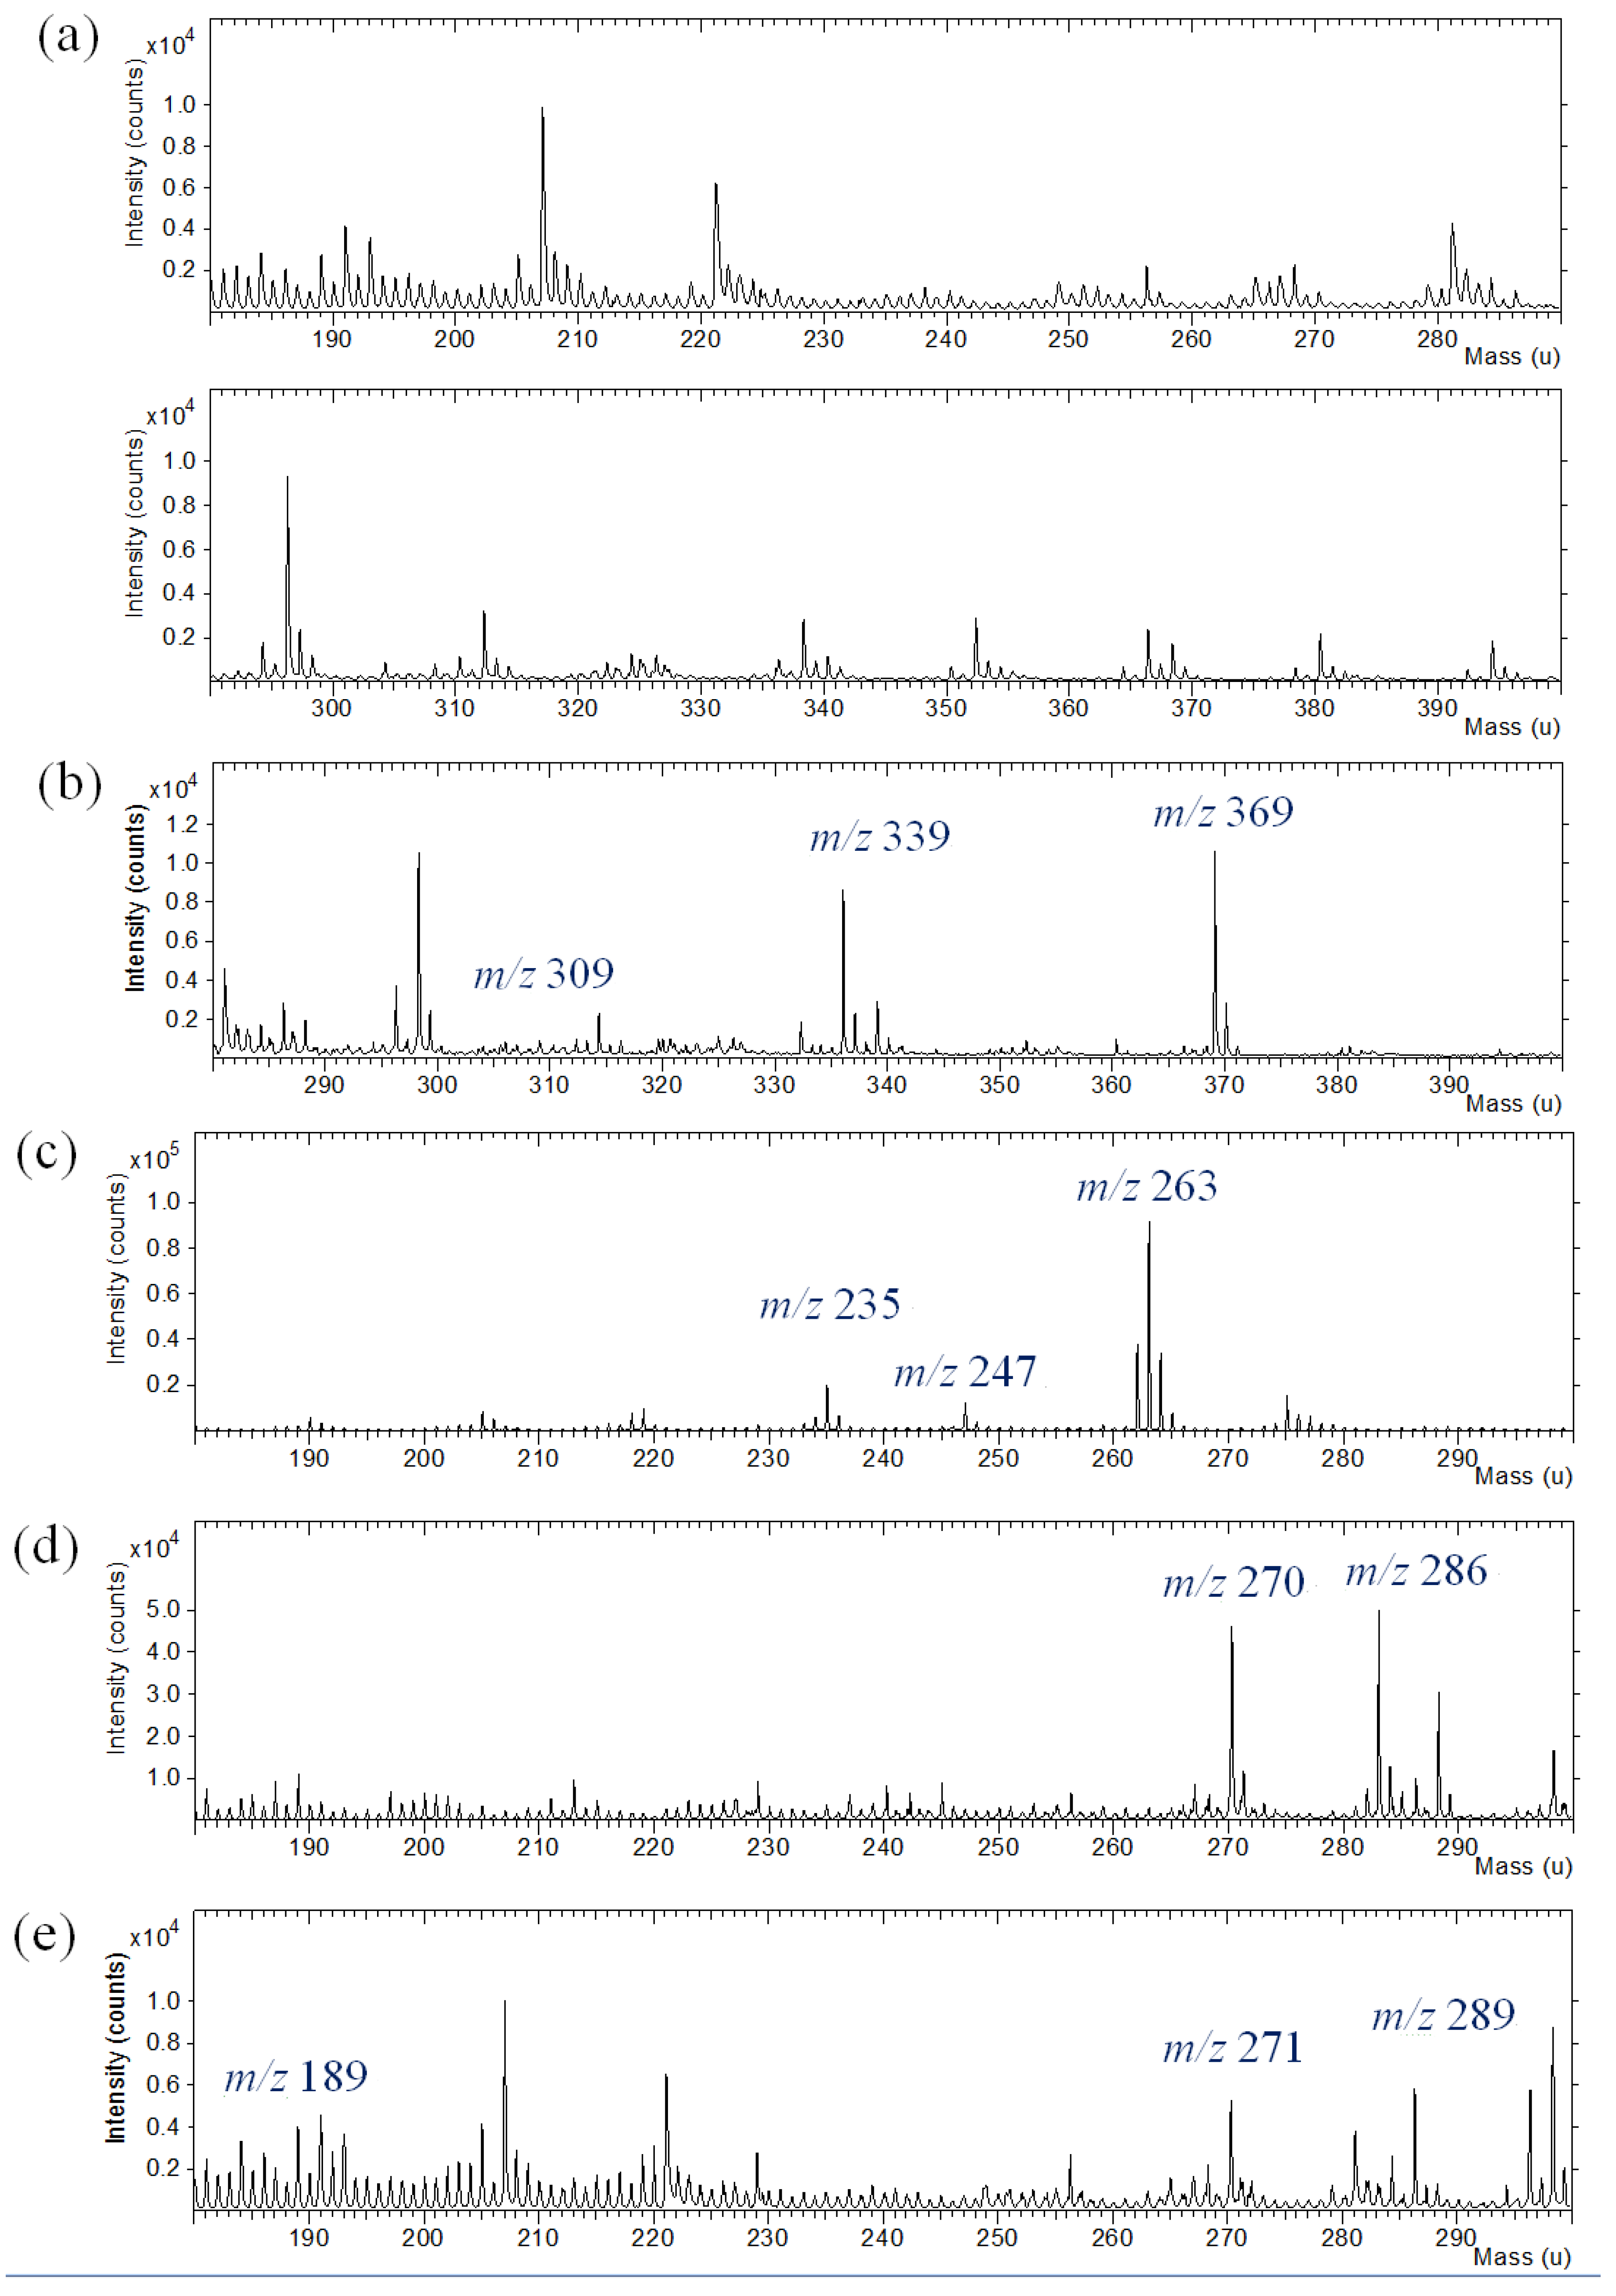
In the higher mass range between m/z 180 and 380, the positive TOF-SIMS spectra of curcumin (
Figure 5a) indicate the presence of molecular ions, M+H at m/z 369 and specific fragment ions,
i.e., C
10H
9O
3+ at m/z 177, C
19H
17O
4+ at m/z 309 and C
20H
19O
5+ at m/z 339. The positive ion spectrum of indigo shows characteristic ions at m/z 120 (C
7H
6NO
+), 132 (C
8H
6NO
+), 235(C
15H
11N
2O
+) and 247 (C
16H
11N
2O
+), as well as molecular ion (M+H) at m/z 263. TOF-SIMS spectra of the other dye compounds studied, such as brazilin, shikonin and quercetin, also show molecular ions at m/z 286 (M
+), m/z 289 (M+H) and m/z 303 (M+H) and specific fragment ions in the positive ion spectra.
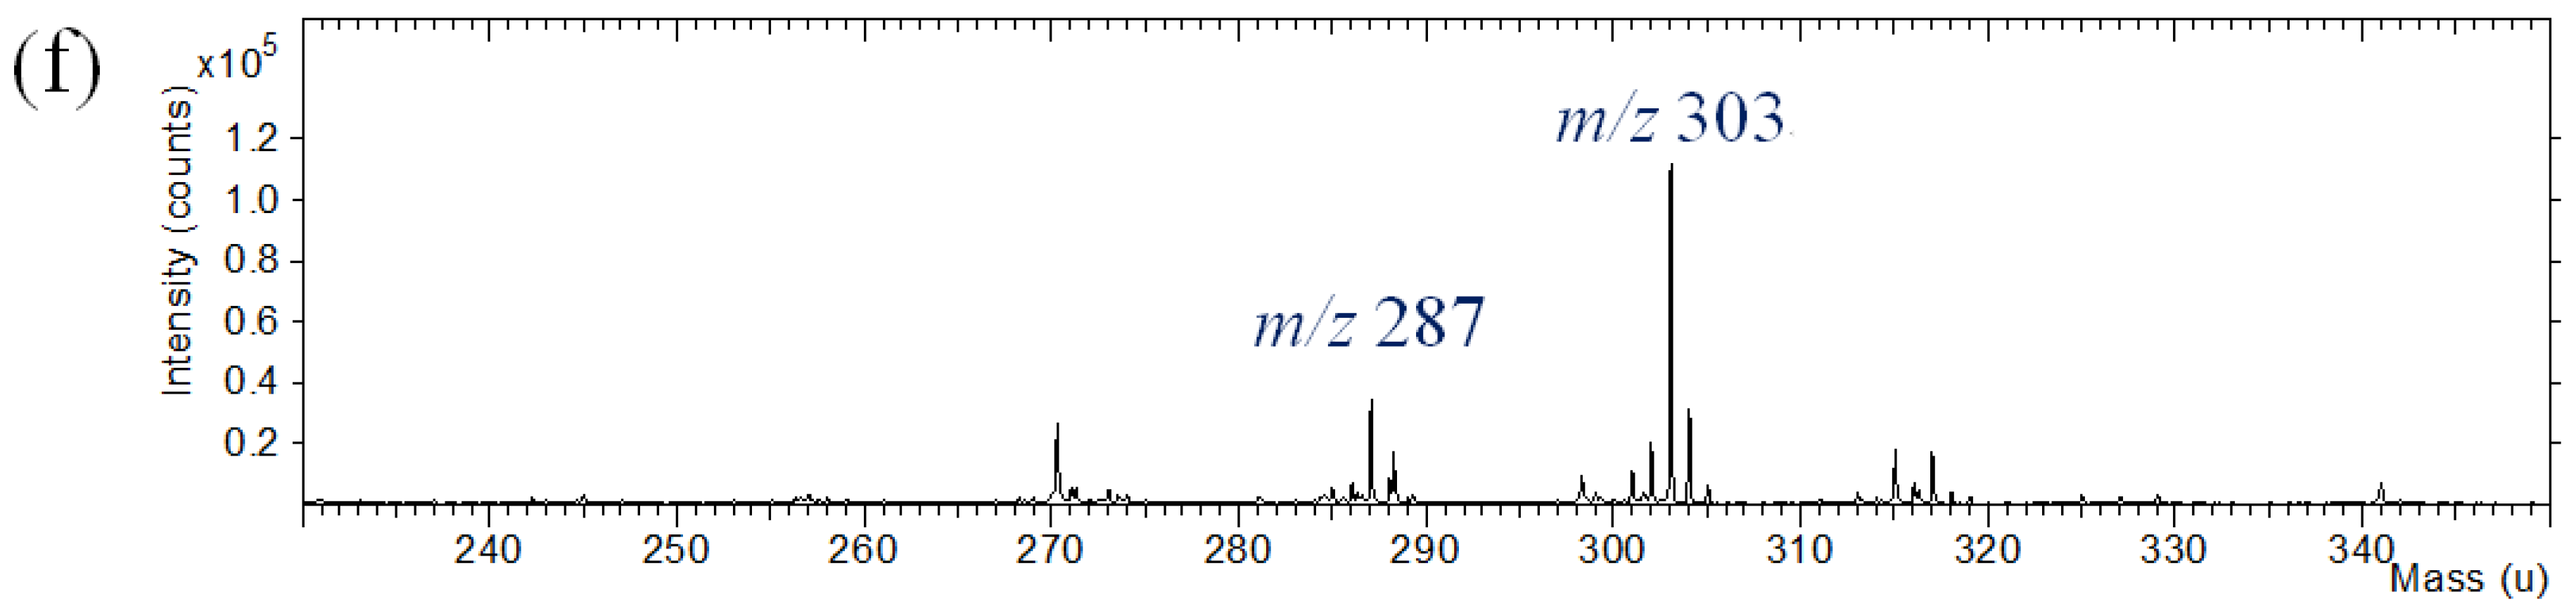
Silk fabric were dyed with commercial natural dyes. TOF-SIMS analysis of dyed silk textile provided complicated spectra composed of peaks from dyes, silk fabric and contaminants. The TOF-SIMS spectrum of silk textile was also obtained to discriminate the background information from the silk textile. The silk textile gives hydrocarbon ions and nitrogen-containing ions in the low mass range below m/z 200. TOF-SIMS spectra of silk fabric dyed with curcumin, indigo, brazilin, shikonin and quercetin are shown in
Figure 6. In the silk fabric dyed with curcumin, indigo, brazilin, shikonin and quercetin, molecular ions (M+H or M
+) at m/z 369, 263, 286, 289 and 303 were observed with strong intensity. The specific fragment ions from the dye molecules were also identified in the complicated background peaks from the silk textile.
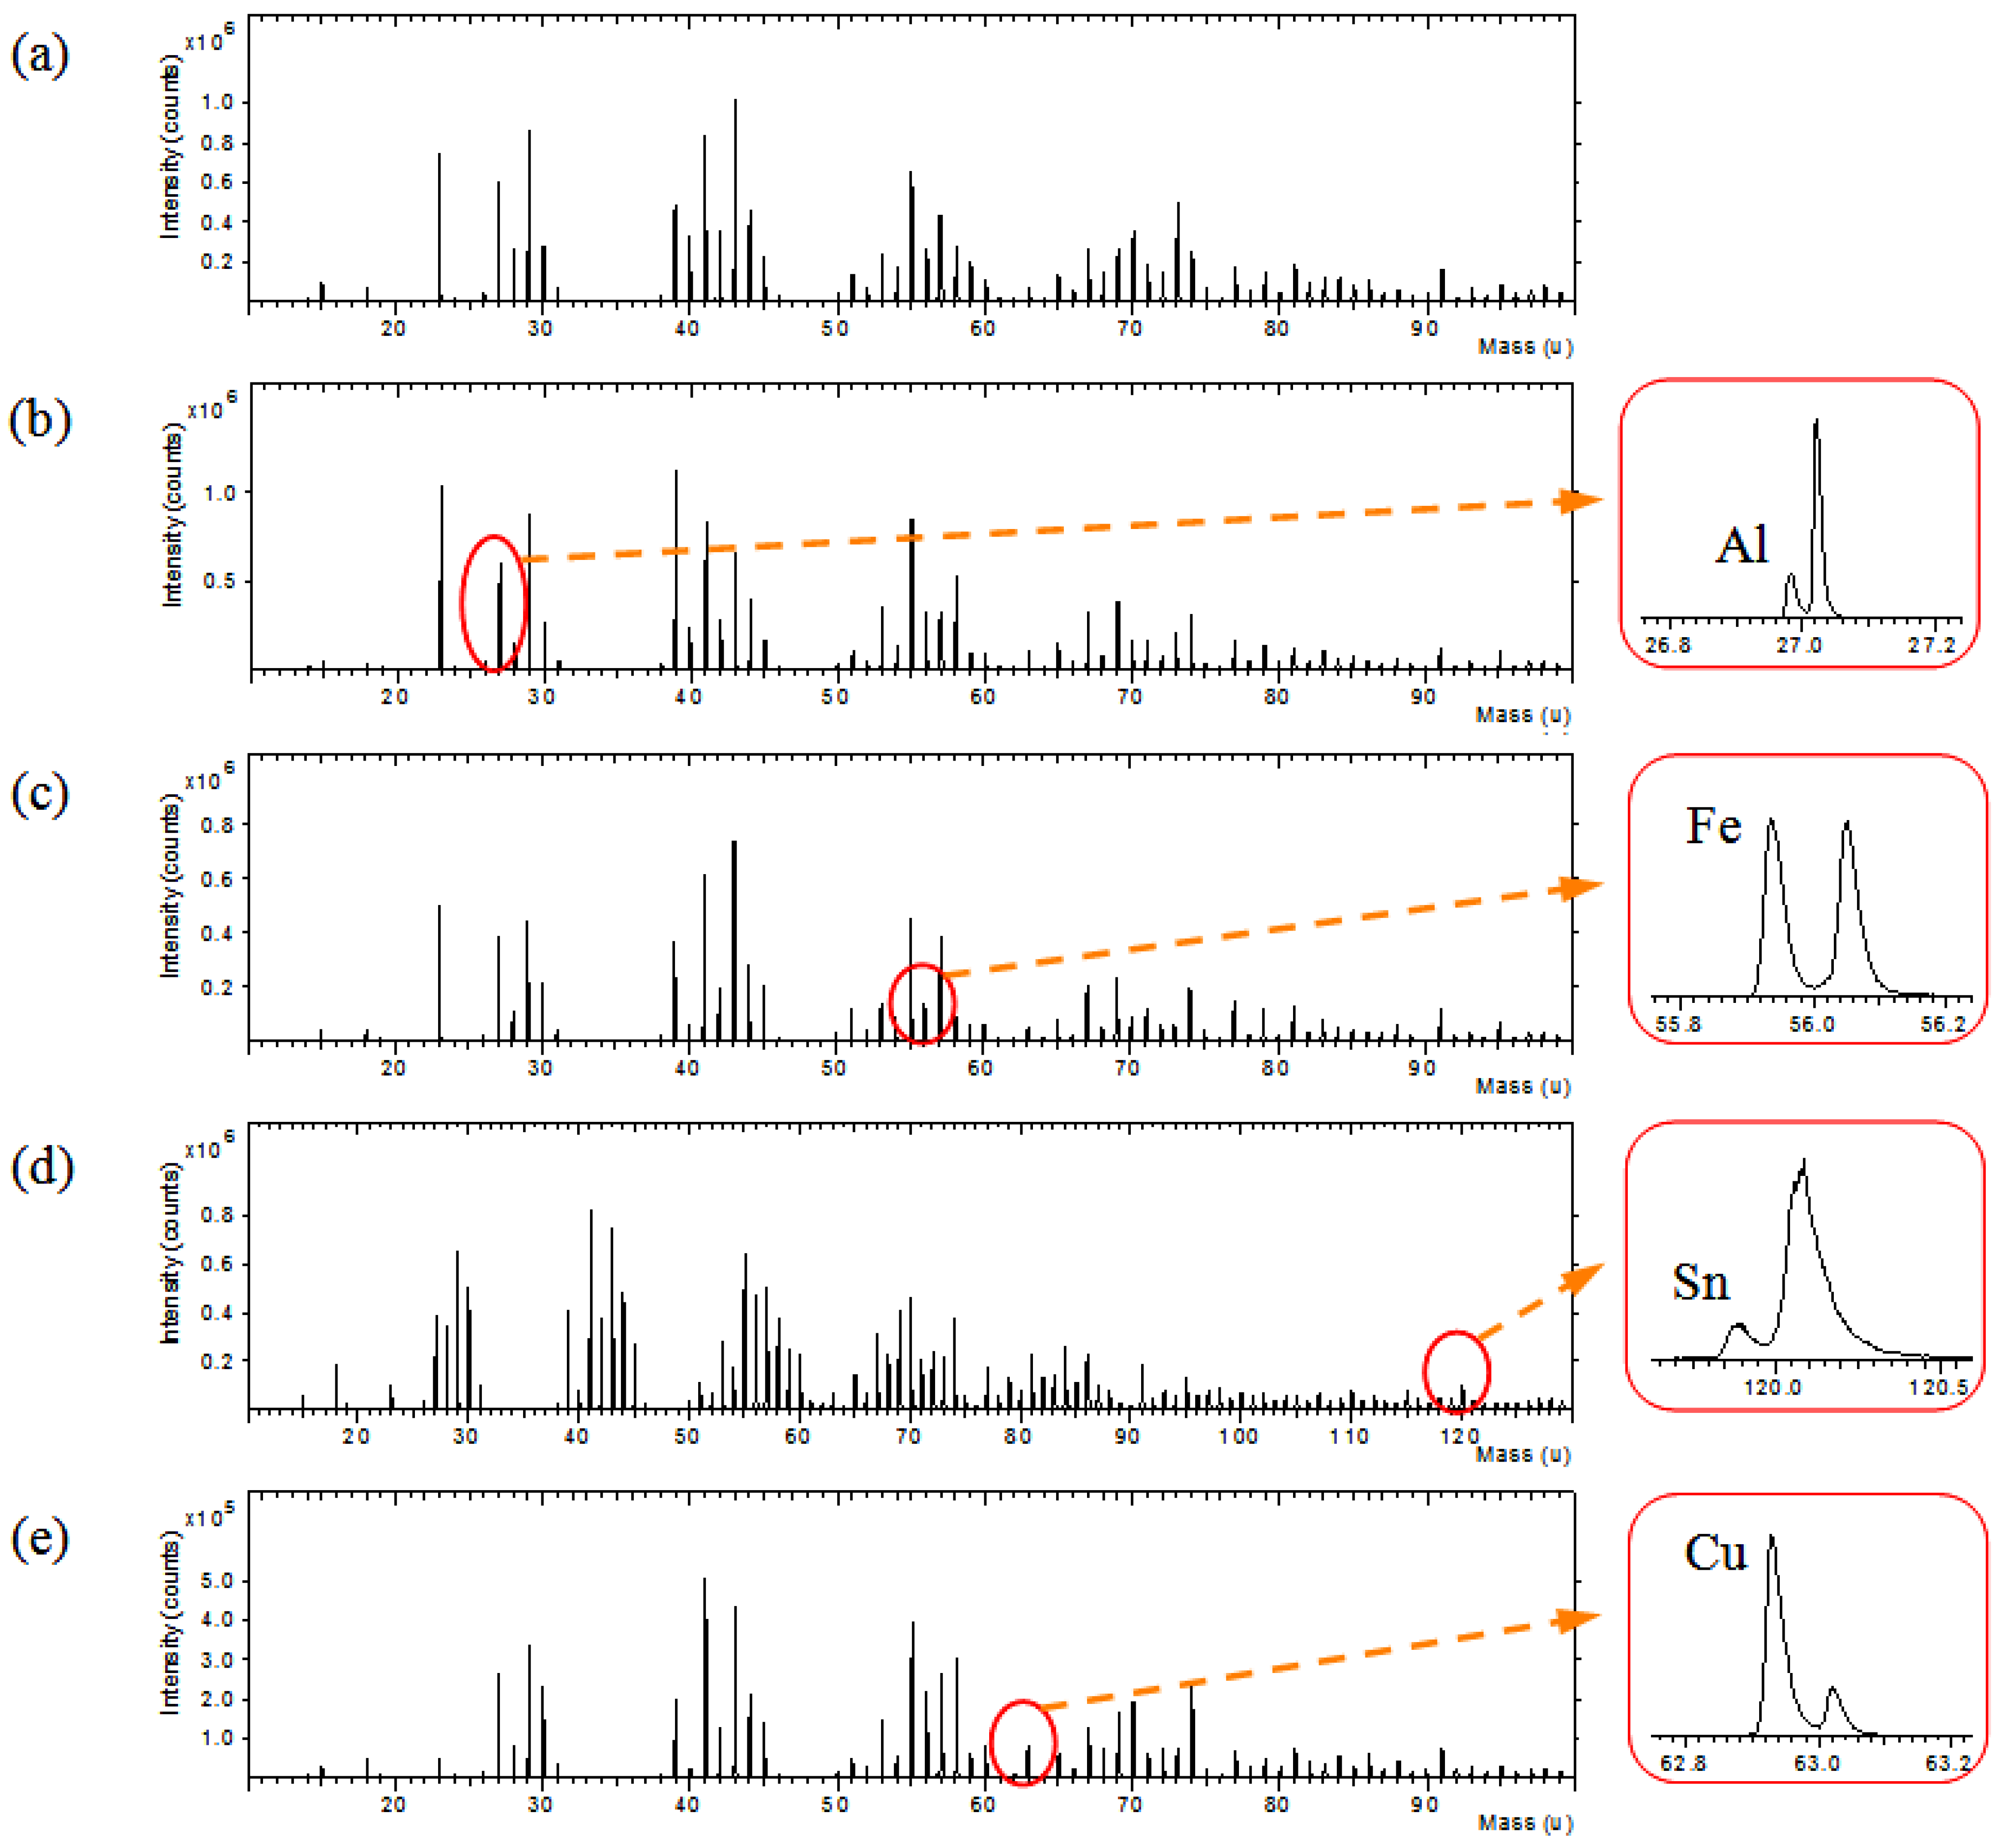
Silk textiles were prepared with plant dye extracts and mordants or fixing agents in the dyeing process, because many of natural dyes did not have a strong chemical affinity for the textile fibers. As shown in
Figure 7, TOF-SIMS spectra were obtained for the silk textiles dyed with sappanwood extracts and different kinds of mordants. In the low mass range of m/z 0–100, intense element ions from metal mordants were easily observed. Other metal ions in TOF-SIMS spectra were observed at the background level that might come from the contamination. The presence of aluminum, iron, tin and copper ion was due to the addition of mordants during the dyeing process of the silk fabric. High mass resolution TOF-SIMS spectra provided the characteristic ions from most mordant elements and dye molecules, separated with many hydrocarbon peaks. Therefore, TOF-SIMS is a useful technique to investigate natural dyes.
Figure 6.
Positive ion TOF-SIMS spectra of silk fabric (a) undyed and dyed with commercial natural dyes: (b) curcumin; (c) indigo; (d) brazilin; (e) shikonin; (f) quercetin.
Figure 6.
Positive ion TOF-SIMS spectra of silk fabric (a) undyed and dyed with commercial natural dyes: (b) curcumin; (c) indigo; (d) brazilin; (e) shikonin; (f) quercetin.
Figure 7.
Positive ion TOF-SIMS spectra of sappanwood-dyed silk textiles (a) without mordant and with various mordants: (b) KAl(SO4)2; (c) FeSO4; (d) SnCl4; and (e) CuSO4.
Figure 7.
Positive ion TOF-SIMS spectra of sappanwood-dyed silk textiles (a) without mordant and with various mordants: (b) KAl(SO4)2; (c) FeSO4; (d) SnCl4; and (e) CuSO4.
Silk fabric were dyed with various dye extracts of plants. Representative TOF-SIMS spectrum of silk textile dyed with indigo in the mass range of m/z 10–300 is shown in
Figure 8. As can be seen in the figure, the specific fragment ions are present at m/z 235 and 247; as well, the molecular ion (M+H) of indigo can be observed at m/z 263. The specific zinc peaks from the mordants are also shown in this figure.
Figure 8.
Positive ion TOF-SIMS spectrum of silk textile dyed with indigo plant extract and Zn powder.
Figure 8.
Positive ion TOF-SIMS spectrum of silk textile dyed with indigo plant extract and Zn powder.
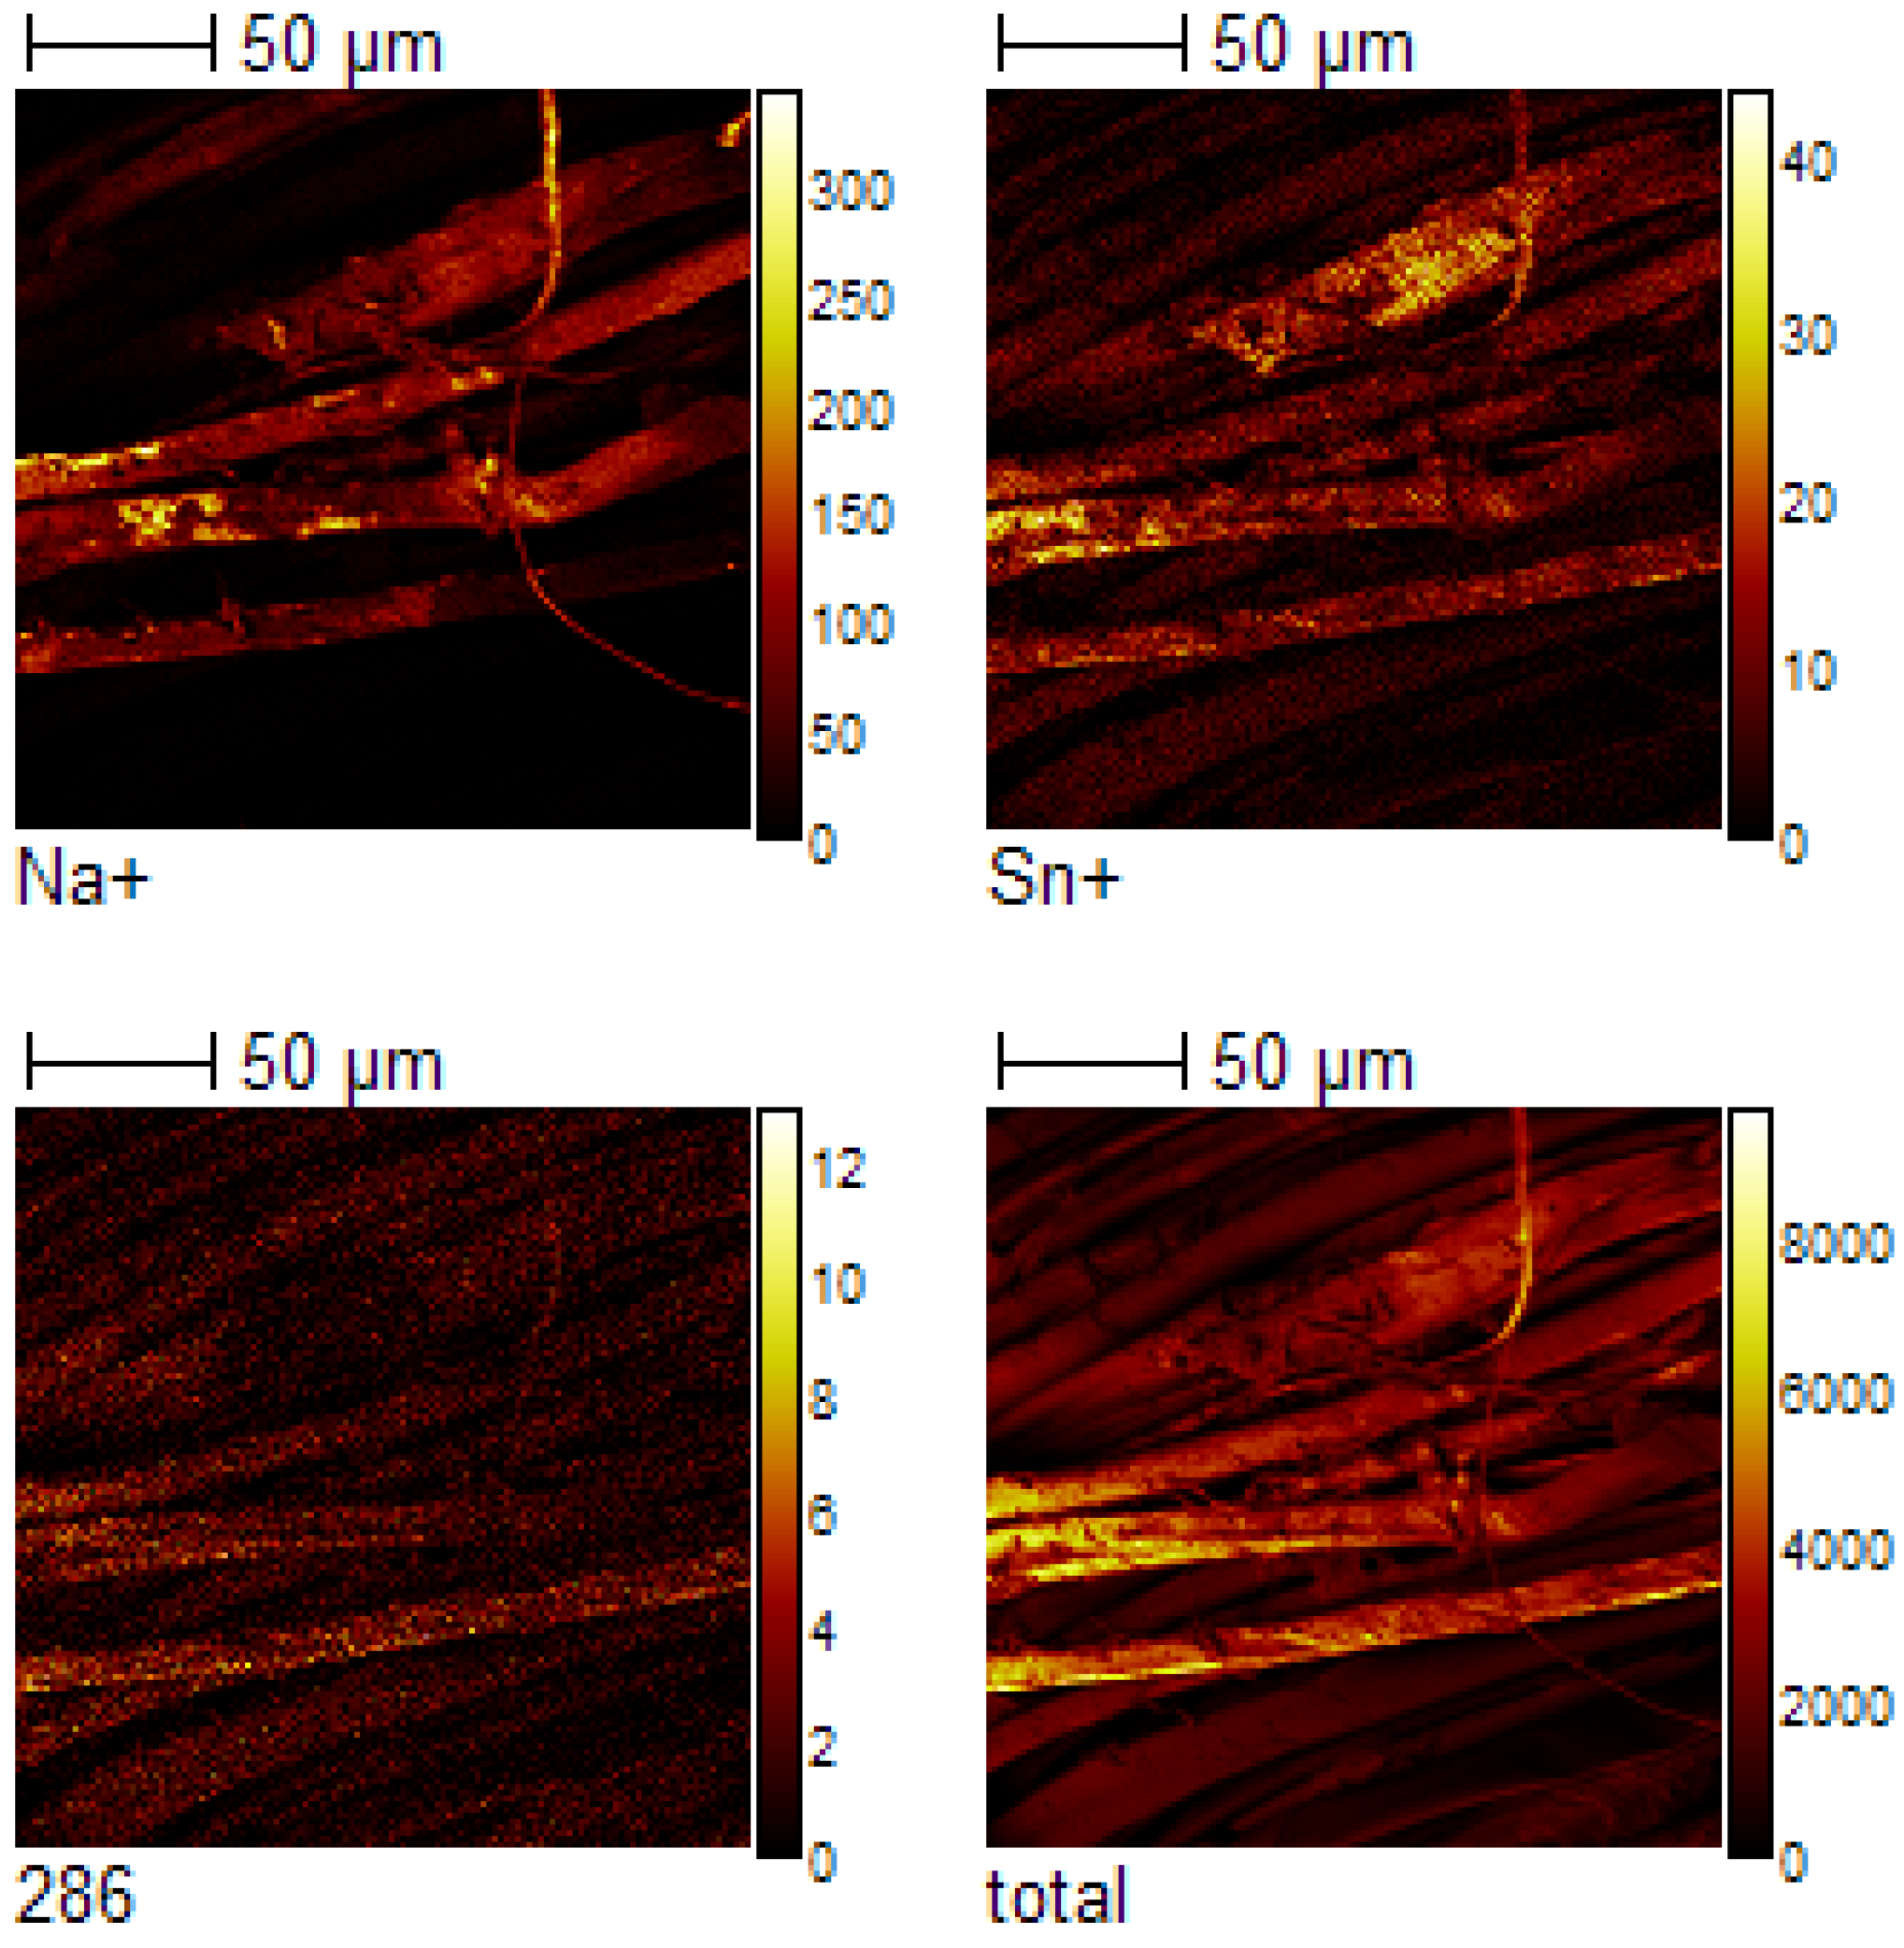
The use of TOF-SIMS to characterize the chemical distribution of dye components on silk fabric was explored. TOF-SIMS imaging data was obtained for the silk textile dyed with sappanwood and SnCl
4.
Figure 9 provides ion images obtained from the positive ion TOF-SIMS spectrum. No clear contrast between the dye distribution, and the silk textile surface is discernible. The TOF-SIMS images show the special distribution of Na
+, Sn
+, molecular ion (C
16H
14O
5+, 286) and total ions. The distribution of the molecular ion exhibits a uniform distribution over the analyzed area, whereas the sodium and tin appear to be located in small aggregates. The TOF-SIMS image results indicate that most fractions of the silk fibers are covered by the plant extracted dye component during the traditional dyeing process according to the old recipes. However, metallic ion from the mordant agent was not distributed uniformly in the silk fibers. Sodium is not an element included in sappanwood component or the mordant. Sodium usually comes from the contamination of the sample and is easily ionized by the primary ion beam. The area contaminated by sodium was different in TOF-SIMS image map from those of dye component and mordent element.
Figure 9.
Positive TOF-SIMS images of sappanwood on silk textile: Na(m/z 23), Sn(m/z 120), brazilin(m/z 286) and total ion.
Figure 9.
Positive TOF-SIMS images of sappanwood on silk textile: Na(m/z 23), Sn(m/z 120), brazilin(m/z 286) and total ion.
Therefore, plant extracted dyes on the silk textiles have been identified using the TOF-SIMS technique on a scale far below that which is possible when using the extractive technique. The TOF-SIMS technique provided information on both elements, including isotope discrimination and molecules, present on the surface of traditionally dyed silk fabric.

