Article

Structural, Transport and Electrochemical Properties of LiFePO4 Substituted in Lithium and Iron Sublattices (Al, Zr, W, Mn, Co and Ni)

Department of Hydrogen Energy, Faculty of Energy and Fuels, AGH University of Science and Technology, al. A. Mickiewicza 30, 30-059 Krakow, Poland
*
Author to whom correspondence should be addressed.
Materials 2013, 6(5), 1656-1687; https://doi.org/10.3390/ma6051656
Submission received: 18 December 2012 / Revised: 15 March 2013 / Accepted: 2 April 2013 / Published: 29 April 2013
(This article belongs to the Special Issue Advanced Materials for Lithium Ion Batteries)

Abstract

:
LiFePO4 is considered to be one of the most promising cathode materials for lithium ion batteries for electric vehicle (EV) application. However, there are still a number of unsolved issues regarding the influence of Li and Fe-site substitution on the physicochemical properties of LiFePO4. This is a review-type article, presenting results of our group, related to the possibility of the chemical modification of phosphoolivine by introduction of cation dopants in Li and Fe sublattices. Along with a synthetic review of previous papers, a large number of new results are included. The possibility of substitution of Li+ by Al3+, Zr4+, W6+ and its influence on the physicochemical properties of LiFePO4 was investigated by means of XRD, SEM/EDS, electrical conductivity and Seebeck coefficient measurements. The range of solid solution formation in Li1−3xAlxFePO4, Li1−4xZrxFePO4 and Li1−6xWxFePO4 materials was found to be very narrow. Transport properties of the synthesized materials were found to be rather weakly dependent on the chemical composition. The battery performance of selected olivines was tested by cyclic voltammetry (CV). In the case of LiFe1−yMyPO4 (M = Mn, Co and Ni), solid solution formation was observed over a large range of y (0 < y ≤ 1). An increase of electrical conductivity for the substitution level y = 0.25 was observed. Electrons of 3d metals other than iron do not contribute to the electrical properties of LiFe1−yMyPO4, and substitution level y > 0.25 leads to considerably lower values of σ. The activated character of electrical conductivity with a rather weak temperature dependence of the Seebeck coefficient suggests a small polaron-type conduction mechanism. The electrochemical properties of LiFe1−yMyPO4 strongly depend on the Fe substitution level.

1. Introduction

Due to high reversible capacity (ca. 170 mAh g−1), high chemical stability and suitable voltage vs. lithium anode (ca. 3.5 V), as well as due to lack of toxicity and the low cost of substrates, LiFePO4 lithium iron phosphate has drawn a vast amount of interest in terms of application in reversible lithium batteries, especially because of the possible usage in the automotive industry.
The LiMPO4 (M = Mn, Fe, Co, Ni) group of phosphates possesses an orthorhombic Pnma olivine structure. They consist of edge-sharing layers of disordered MO6 octahedra, which are connected by PO4 tetrahedra. The layers are parallel to the bc plane. Octahedral 4a positions are occupied by Li+ cations, which form one-dimensional chains along the b and c axis (Figure 1).
Figure 1. Visualization of LiFePO4 crystal structure, viewing along [010] direction.
Materials 06 01656 g001
The limiting factor for the performance of LiMPO4-based batteries is related to the material’s low electrical conductivity, both ionic and electronic. The electronic component of the conductivity is due to magnetic, hole-type polarons [1]. The spin of the hole, which in LiFePO4 is related to the Fe3+ cation exhibiting (tg↑)3(eg↑)2 electronic configuration, is ferromagnetically coupled to surrounding Fe2+ (tg↑)3(eg↑)2tg↓ cations via a double-exchange mechanism. Because of this, moving electrons, which are followed by polaron-type distortion, also carry a cloud of spin polarized charge [2]. Existence of Fe3+ cations is due to the presence of lithium vacancies, which may appear during the synthesis procedure as a result of evaporation of lithium and/or reaction with moisture.
The ionic component of electrical conductivity is related to the mobility of Li+ ions, which is preferential along [010] direction. Theoretical calculations by Islam et al. [3] show that in the olivine structure there are three types of diffusion paths for lithium cations: the mentioned one along [010] direction, which is characterized by 0.55 eV activation energy Ea; one along [001] direction with activation energy equal 2.89 eV and in [101] direction with Ea = 3.36 eV (Figure 1). Transfer of lithium ions between the pathways is impossible due to the high value of the energy barrier equal to 2.2 eV and the long distance >4.5 Å. As can be deduced from Ea values, [010] direction is favored, and can be considered as a 1-dimensional pathway for Li+ migration, which occurs during charge and discharge of the lithium battery. Such an anisotropic structure with one-dimensional diffusion ways results in the conclusion that a plate-like grain shape with a well-developed (010) surface should exhibit enhanced performance while working in Li-ion cells.
Literature data regarding transference numbers of electronic and ionic conductivity in phosphoolivine are not consistent [4,5]. However, on the basis of results presented by Maier [6] it is plausible that the electronic component should be dominant. The observed, total conductivity of LiFePO4 at room temperature is of the order of 10−9 Scm−1, with activation energy equal to about 0.65 eV [2,7].
There are literature works suggesting relationship between electronic and ionic conductivity in LiFePO4 [8]. It was observed that faster transport of the small polaron appears together with disordering of lithium cations, which hints at their mutual connection. Therefore high electrical resistivity may be considered responsible for the low values of lithium diffusion coefficient D. Values of D reported in the literature fall over quite a wide range from 10−16 to 10−11 cm2 s−1 and their poor reproducibility indicates the strong influence of the material’s preparation method [9,10,11,12,13].
Delithiation of LiFePO4 can be generally described as a two phase-type mechanism: LiFePO4xLi+xe ↔ (1 − x)LiFePO4 + xFePO4. There are several simplified models explaining the nature of this reaction, among them, the so-called shrinking core (core-shell) [14], mosaic [15], new core-shell [16] and domino-cascade [17] models are of interest. Moreover, extensive research into the theoretical description of chemical kinetics performed by Bazant’s group [18,19,20] allowed authors to describe quantitatively the observed behavior of LixFePO4 during the lithium intercalation/deintercalation process without ad hoc assumptions made for simplified models [14,15,16,17].
There are only a few ways to overcome issues related to low conductivity of phosphoolivine. Among them: addition of the appropriate amount of carbonaceous additive, modification of the synthesis procedure, which yields flat nanocrystallites with a well-developed (010) surface, and substitution of iron by aliovalent cations are the most common [21,22]. While there are many works proving the possibility of substitution of iron by other 3d metals [23,24], results obtained for Li-site substituted materials are not decisive and this issue still seems to be an open question [25,26,27,28,29,30,31,32,33,34,35,36]. It is worth noting that for quite a long time research papers showing metallic-like properties of pure and Li-site substituted LiFePO4 were being published [25,27].These experimental works were followed and supported by theoretical calculations [35]. However, finally these results were questioned, and metallic-like behavior of the samples was shown to originate from metallic phosphides and carbo-phosphides, which were present on the surface of phosphoolivine grains [37,38]. Therefore, there is an ongoing discussion about possibility, range of substitution and influence of other cations with higher valence in lithium sublattices on the physicochemical properties of LiFePO4.
As already mentioned, there is a vast amount of papers devoted to Fe-site substituted materials. The conducted research concerns both, end-members with LiMnPO4 [39], LiNiPO4 [40], and LiCoPO4 [41] compositions, as well as partially substituted LiFe1−xMxPO4 compounds [42,43]. The published data shows mostly only electrochemical properties of the samples. Additionally, the available data shows no significant influence of a type of 3d metal on the values of lithium diffusion coefficient in all studied LiMPO4 (M = Fe, Ni, Co) compositions [44]. Many authors suggest that the energy barrier for movement of M3+ polarons in the case of LiMnPO4 and LiCoPO4 is higher than for LiFePO4, which leads to worse transport properties of these materials [45,46]. Looking at the available literature data one notices a lack of systematic studies on the transport properties of 3d metal substituted compounds.
In this review-type paper, systematic studies, conducted by our research group are presented. Complex measurements of structural, transport and electrochemical properties of phosphoolivines substituted in Li sublattices by Al3+, Zr4+ and W6+ cations, as well as Fe-site substituted materials LiFe1−xMxPO4 (M = Mn, Co and Ni) are provided. All materials were synthesized by a standard ceramic high-temperature method. Crystal structure was investigated by means of XRD, SEM-EDX and TEM techniques. Electrical conductivity was examined by DC 4-probe as well as impedance a spectroscopy method, Seebeck coefficient was evaluated from the slope of the dependence of thermoelectric voltage vs. applied thermal gradient. Electrochemical studies were performed in Li/Li+/phospholivine type cells. More details about synthesis and experimental methods can be found in references [7,47,48,49].

2. Results and Discussion

2.1. Phosphoolivines Substituted in Li Sublattice by Al3+, Zr4+ and W6+ Cations

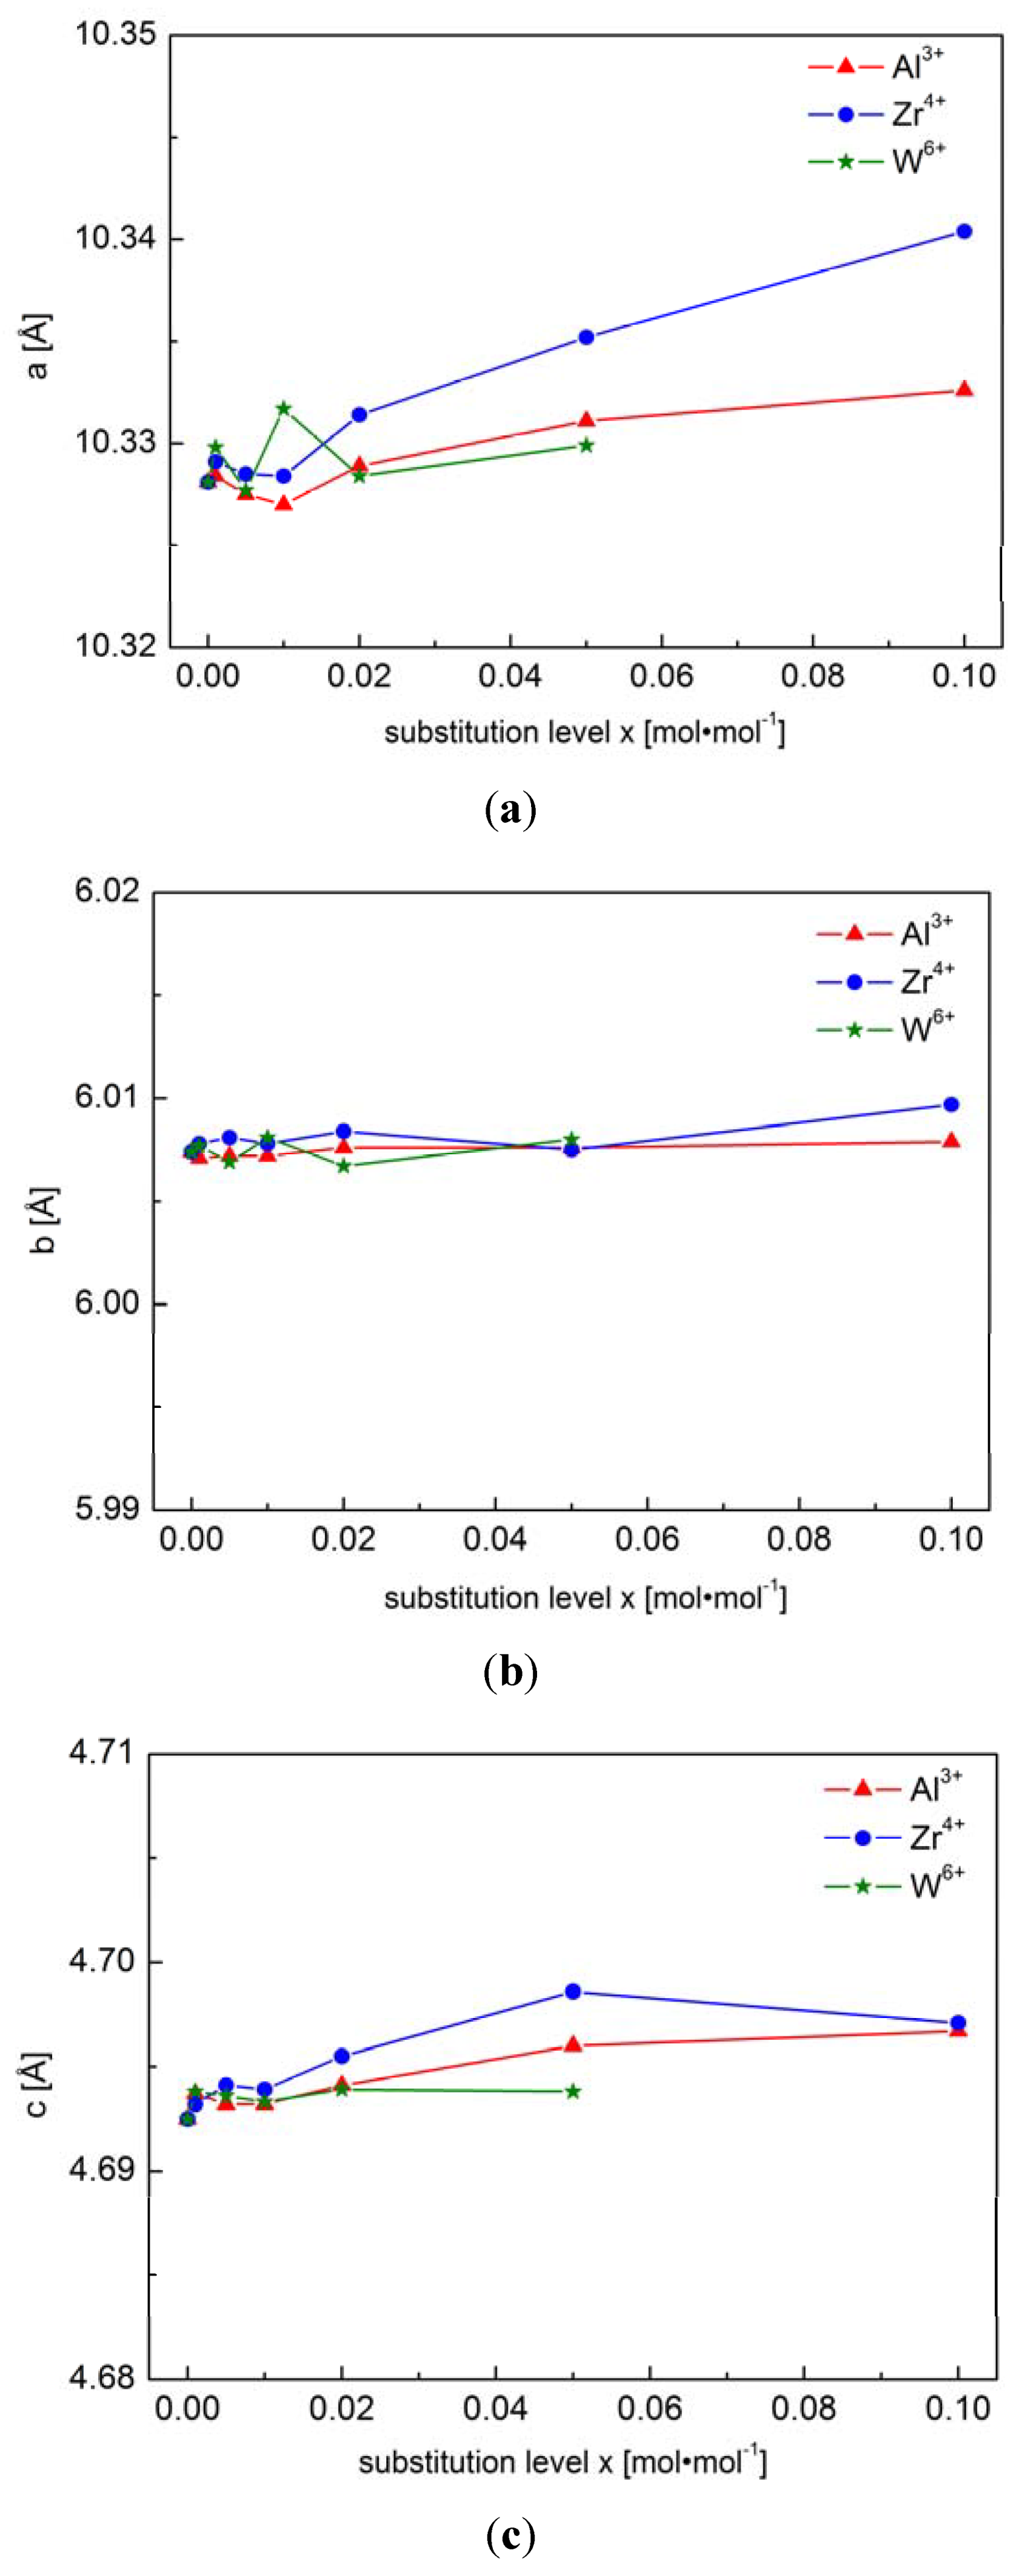
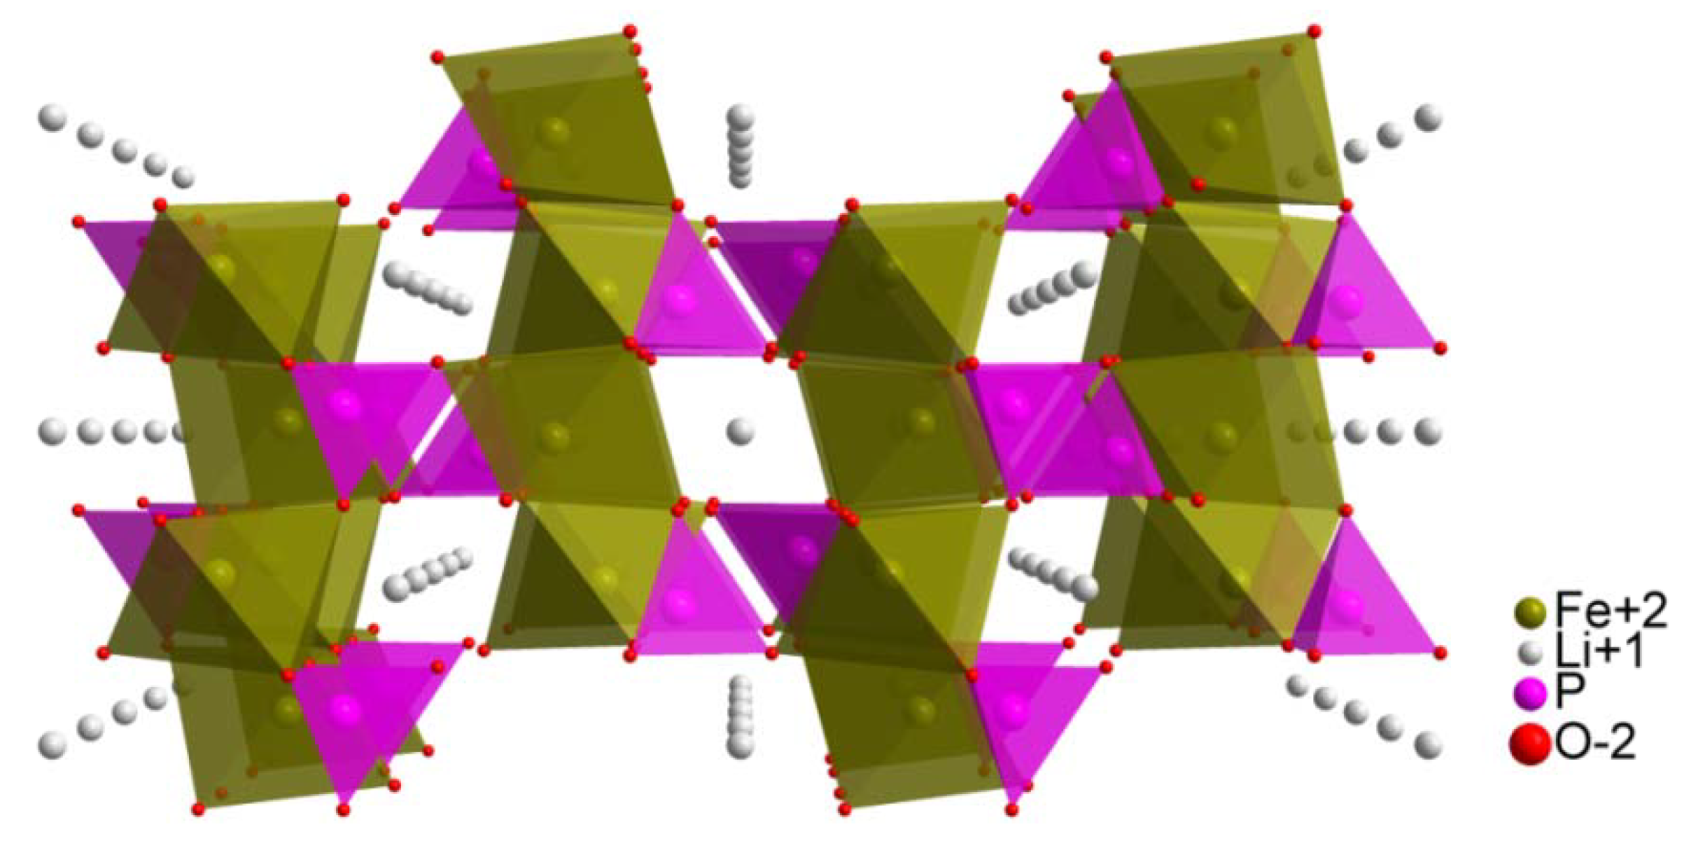
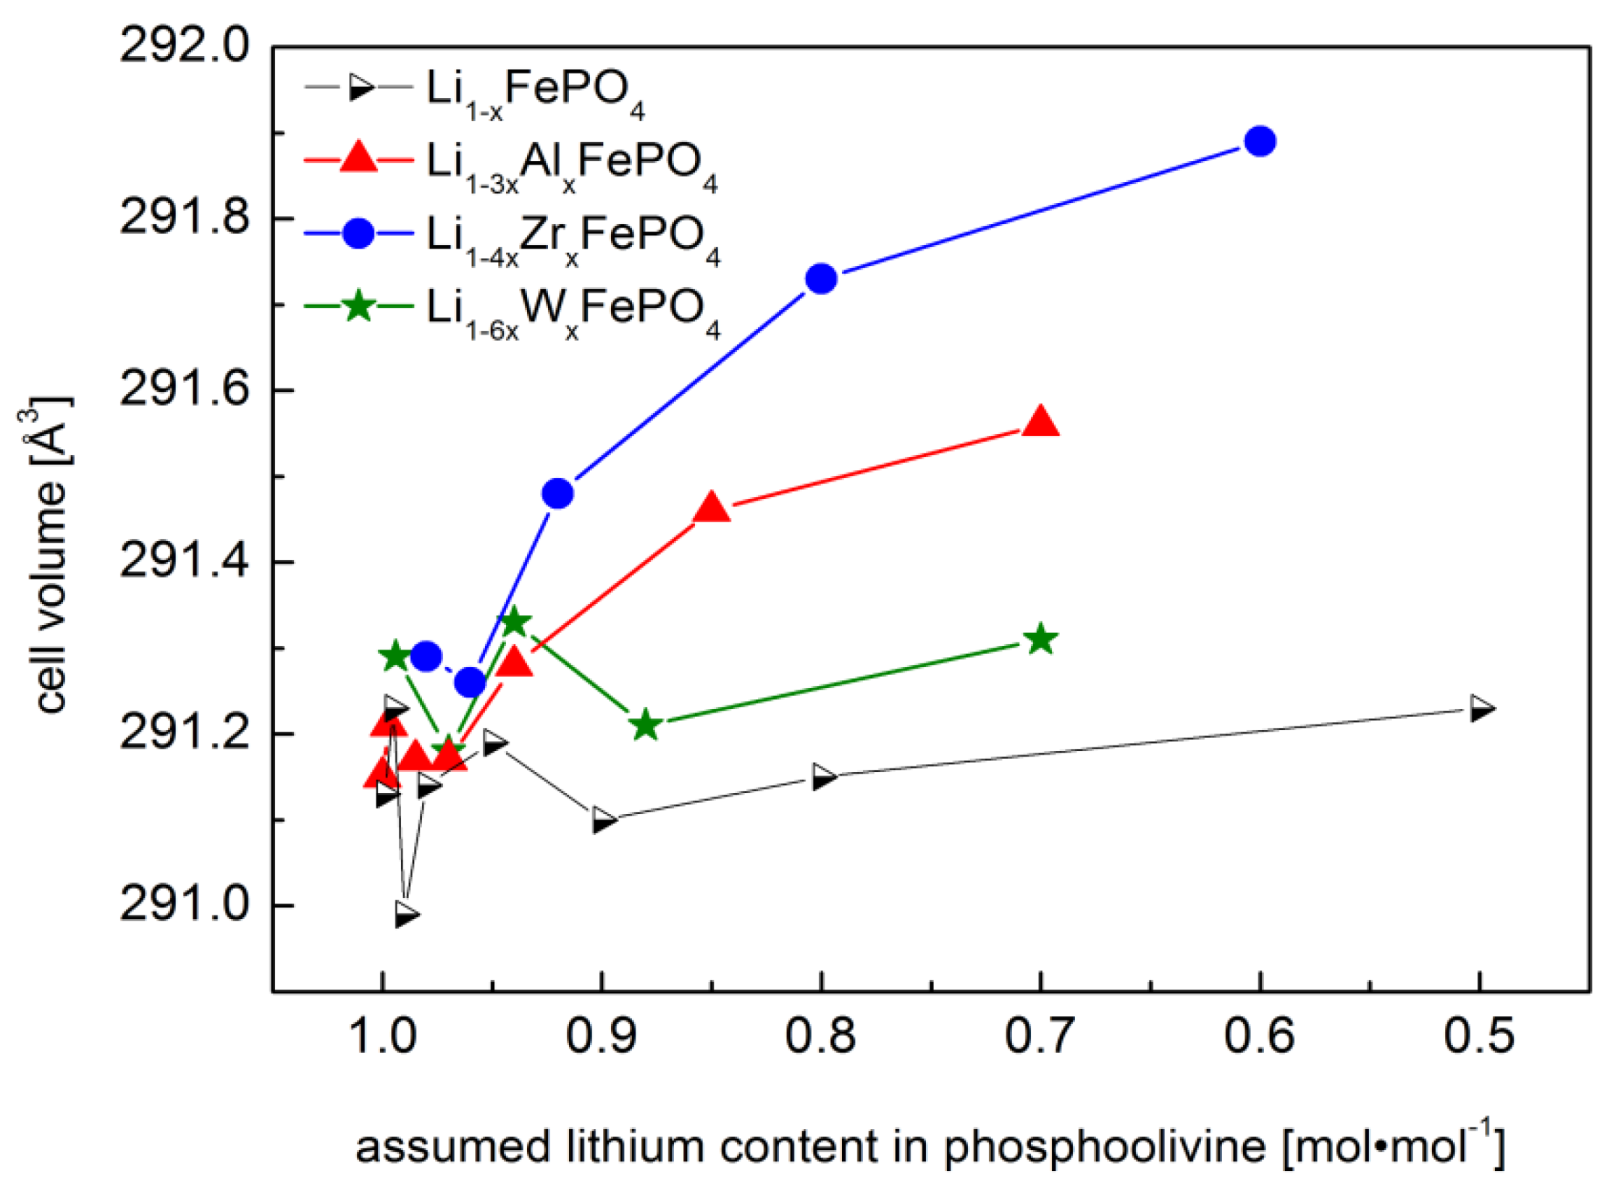
2.1.1. Structural Properties

Figure 2 shows unit cell parameters of Al3+, Zr4+ and W6+-substituted phosphoolivines as a function of concentration of introduced cations. No simple, linear dependence can be observed between level of substitution and unit cell parameters. Additionally, XRD-based phase analysis indicates a limited range of “solubility”. In the case of Zr4+-substituted compounds, the presence of additional Fe3(PO4)2 and Li2ZrP2O8 phases was confirmed for concentrations of x ≥ 0.02 mol mol−1. For W6+-substituted materials, Fe2P2O7 and FeWO4 phases were identified for doping level x ≥ 0.01 mol mol−1. Interestingly, in the case of the whole Li1−3xAlxFePO4 series, apart from the main orthorhombic Pnma phase, no secondary phases were visible on XRD patterns. However, the XRD data showed low signal/noise ratio, which further decreases with increasing Al3+ concentration, suggesting poor crystallinity of the samples and the possibility of formation of amorphous, glass-like phases. High noise level may also obscure the presence of peaks originating from secondary phases.
In the course of the studies, an experiment was performed, which could further explain the influence of concentration of lithium vacancies on the unit cell volume V of non-substituted Li1−xFePO4 and could help in the separation of effects induced by aliovalent substitution at the Li-site together with lithium deficiency. XRD results obtained for materials from the Li1−xFePO4 series, together with data for the Al3+, Zr4+ and W6+-substituted compounds are collated in Figure 3, in which the measured values of unit cell volume are presented as a function of lithium content.
Figure 2. Unit cell parameters a, b and c for Li1−3xAlxFePO4, Li1−4xZrxFePO4 and Li1−6xWxFePO4 materials [47].
Materials 06 01656 g002
Figure 3. Effect of dopant concentration on the unit cell volume for pure and substituted phosphoolivines [47].
Materials 06 01656 g003
A nonlinear relationship between the unit cell volume and the lithium vacancy concentration in pure Li1−xFePO4 phosphoolivine is observed. In the case of Al3+ or Zr4+-substituted materials, an increase of unit cell volume can be noticed at higher concentration of dopant metals. However, it is present outside of the solid solution range for Li1−4xZrxFePO4, while in the case of Li1−3xAlxFePO4 it concerns poorly crystallized samples. In the case of W6+-substituted materials no similar effect was observed. Taking into account ionic radii only (according to Shannon [50], octahedral coordination: Li+—0.76 Å, Al3+—0.535 Å, Zr4+—0.72 Å and W6+—0.6 Å), one may assume that the observed results do not follow the anticipated trends for changes of unit cell volume of substituted materials. Therefore, other effects must be taken into account, i.e., the presence of additional lithium vacancies, and the presence of secondary phases, whose level does not permit detection during standard XRD experiments. Another reason may be related to the difference of valence and electronegativity of the dopant metals. Introduction of d-type cations into octahedral lithium sites may cause stronger Coulomb repulsion between cations, and electrons originating from ligands, which, in turn, may generate internal stress.
The investigations conducted on Li-site substituted phosphoolivine proved that the range of the formation of solid solution is strongly dependent on the valence and radii of the introduced metal and is limited. The solid solution formation range can be ordered as follows: xmaxW6+ < xmaxZr4+ < xmaxAl3+, with the real values being less than, respectively: xmaxW6+ < 0.01, xmaxZr4+ < 0.02, xmaxAl3+ < 0.1.

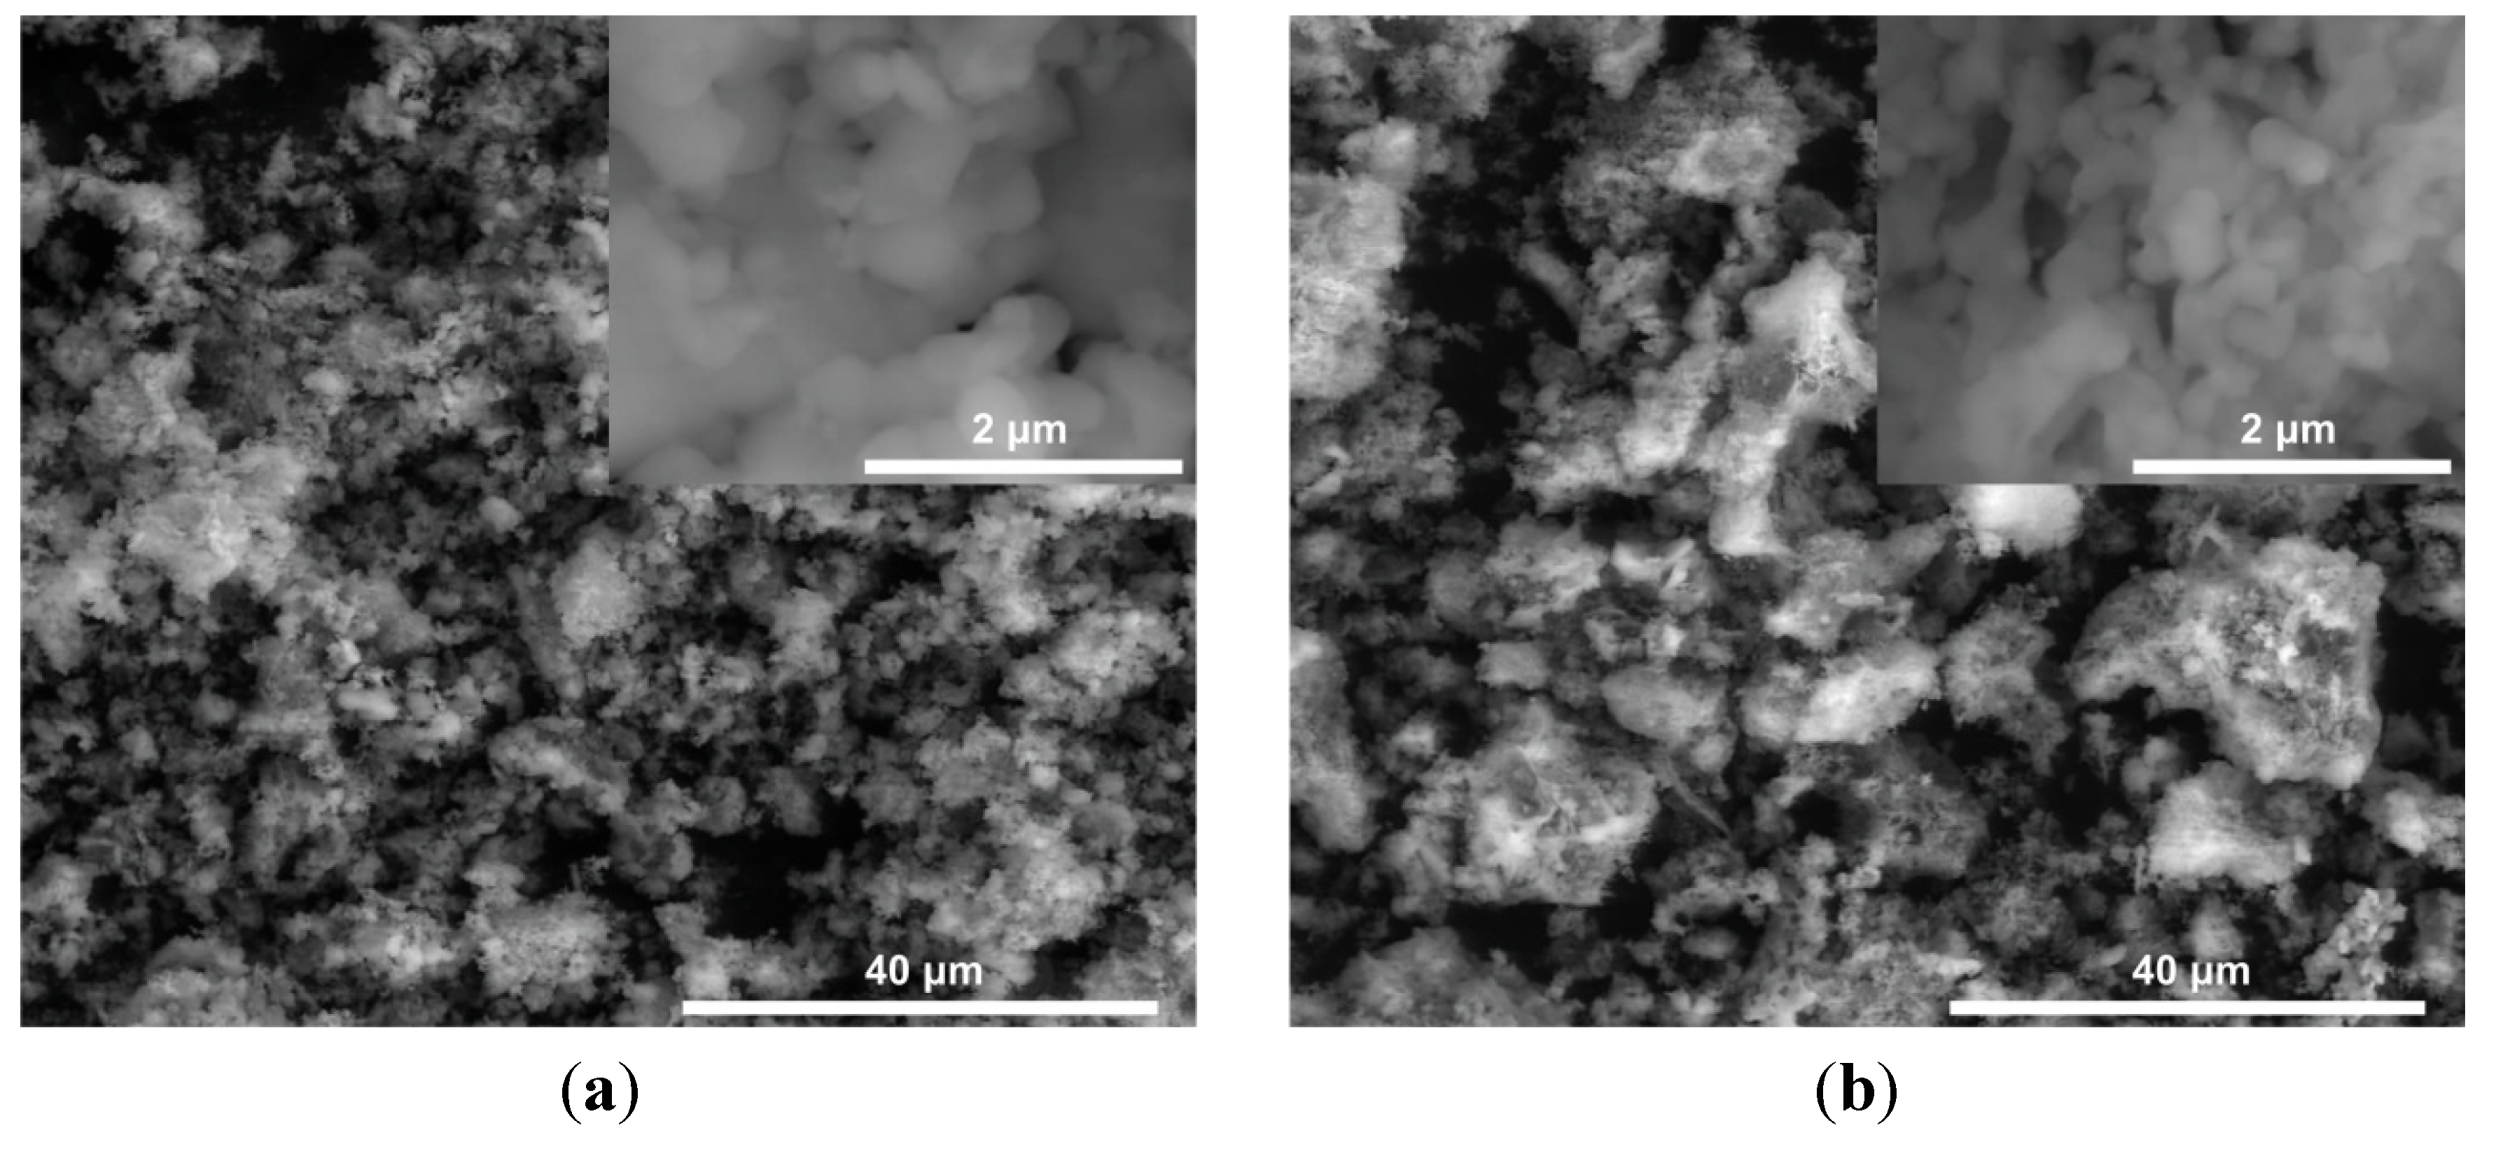
2.1.2. Morphology of LiFePO4 and Li0.97Al0.01FePO4 Powders

Figure 4 and Figure 5 show exemplary results of microstructural analysis of LiFePO4 and Li0.97Al0.01FePO4 powders, conducted by SEM and TEM techniques. Studies were supported by additional EDX measurements. As can be seen, both powders consist of irregular, few-hundred-nanometer size crystallites, which are grouped into irregular aggregates and agglomerates. Higher magnification (inlets) allows the visualization of well-sintered crystallites with the possible presence of a glass-like phase.
EDX spectroscopy analysis of a Li0.97Al0.01FePO4 sample indicated homogenous distribution of Al within resolution of the method (several μm2). Additionally, the presence of oxygen-depleted grains was confirmed, which indicates the possibility of the formation of phosphides. Further measurements on a TEM Tecnai G2 F20 microscope, equipped with a high-resolution EDX probe, enabled the confirmation of homogenous distribution of Al also in nano-scale. These measurements also confirmed the presence of regions with lower-than-expected concentration of oxygen. Additionally, neutron diffraction data (not shown in this paper, A. Braun, private communication) indicate increasing oxygen deficiency with increasing dopant amount. Interestingly, HRTEM measurements conducted on a Li0.97Al0.01FePO4 sample showed the presence of an amorphous phase within single grains of the material (Figure 5). These regions, present in virtually all particles, have almost the same chemical composition as the surrounding crystalline phase.
Figure 4. SEM microphotographs of (a) LiFePO4 and (b) Li0.97Al0.01FePO4 powders.
Materials 06 01656 g004
Figure 5. (a) HRTEM micrograph; (b) electron diffraction picture; and (c) HRTEM-based, FFT-analyzed picture of the structure of Li0.97Al0.01FePO4 material.
Materials 06 01656 g005
The results presented above allows us to draw conclusion that while actual substitution in the Li-sublattice by Al3+ in phosphoolivine is likely, it also causes formation of a significant amount of amorphous phase. The solid solution range x is definitely lower than 0.1 mol·mol−1, but precise determination of the limit is not possible.

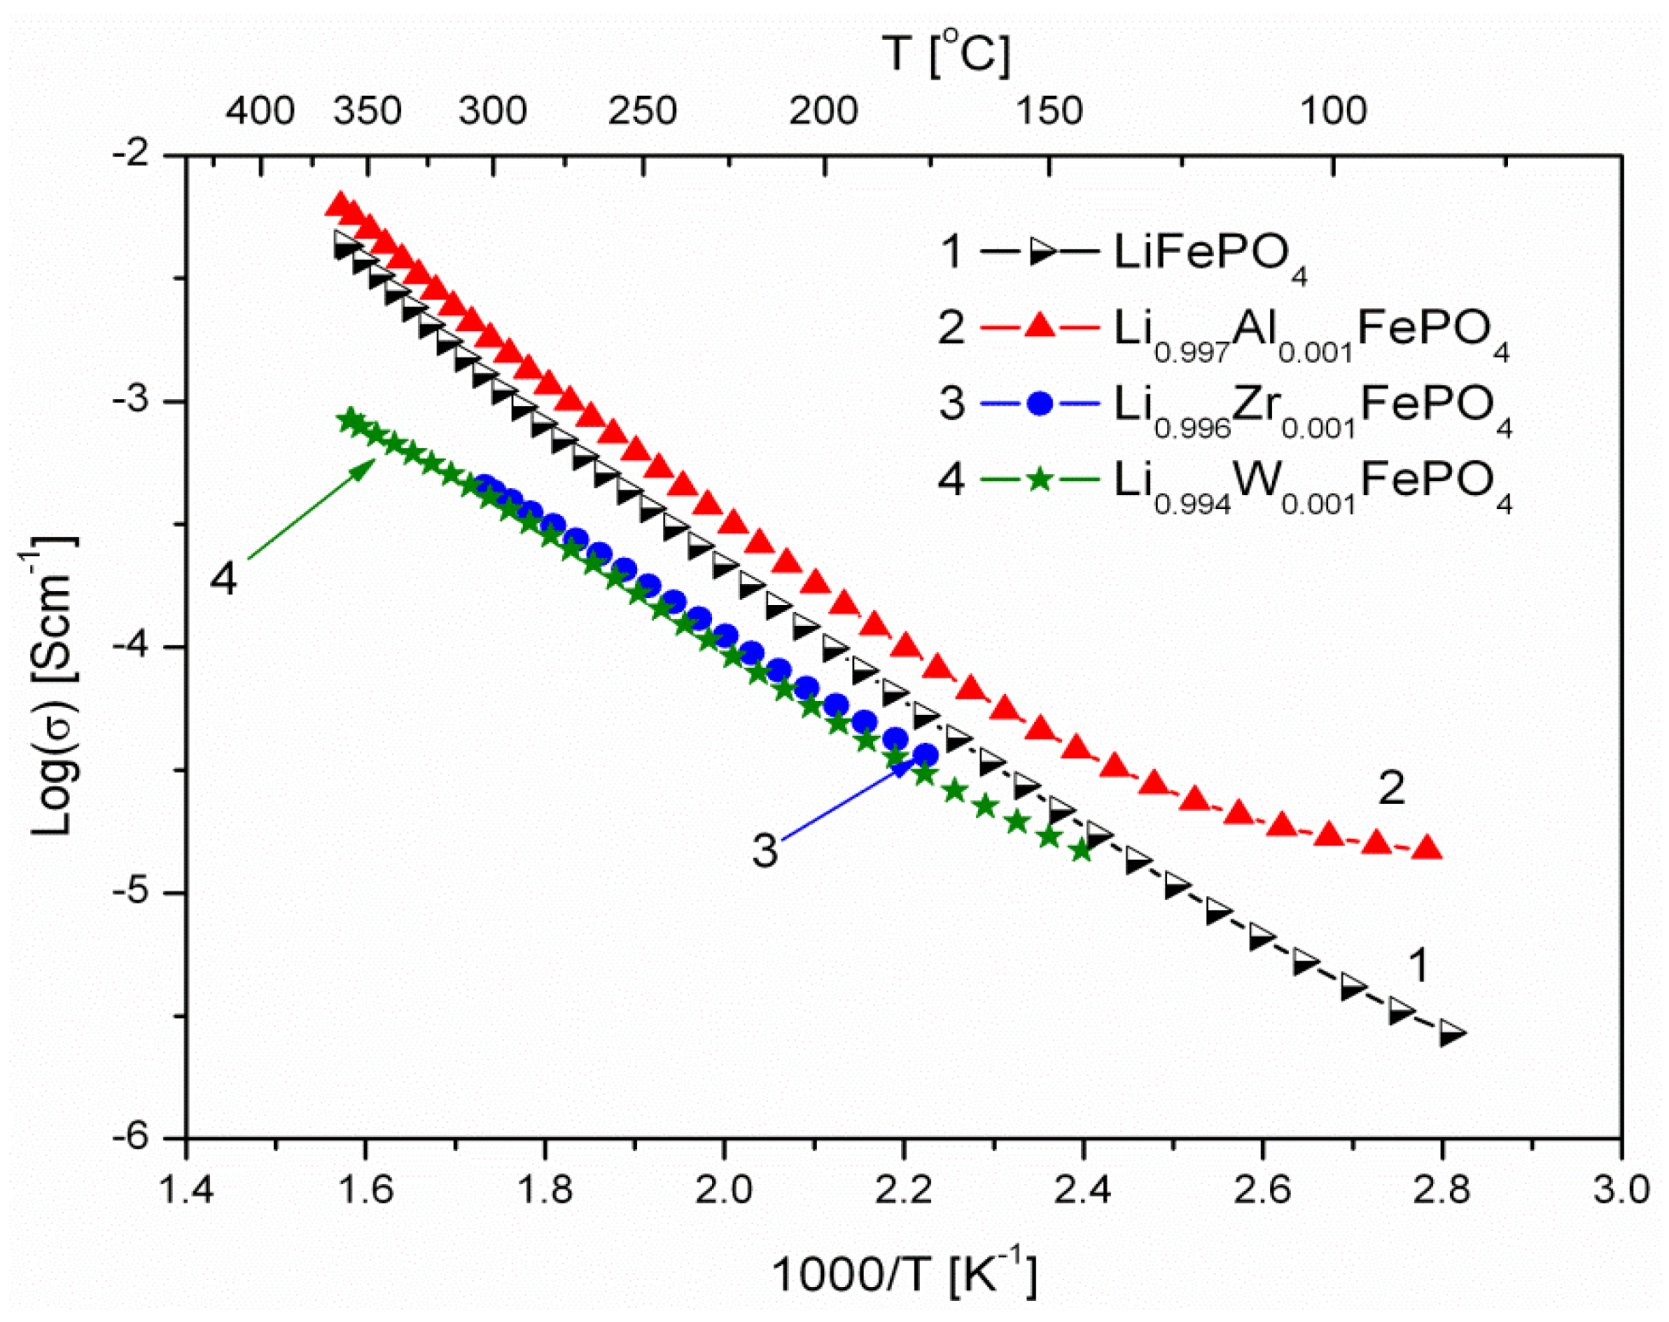
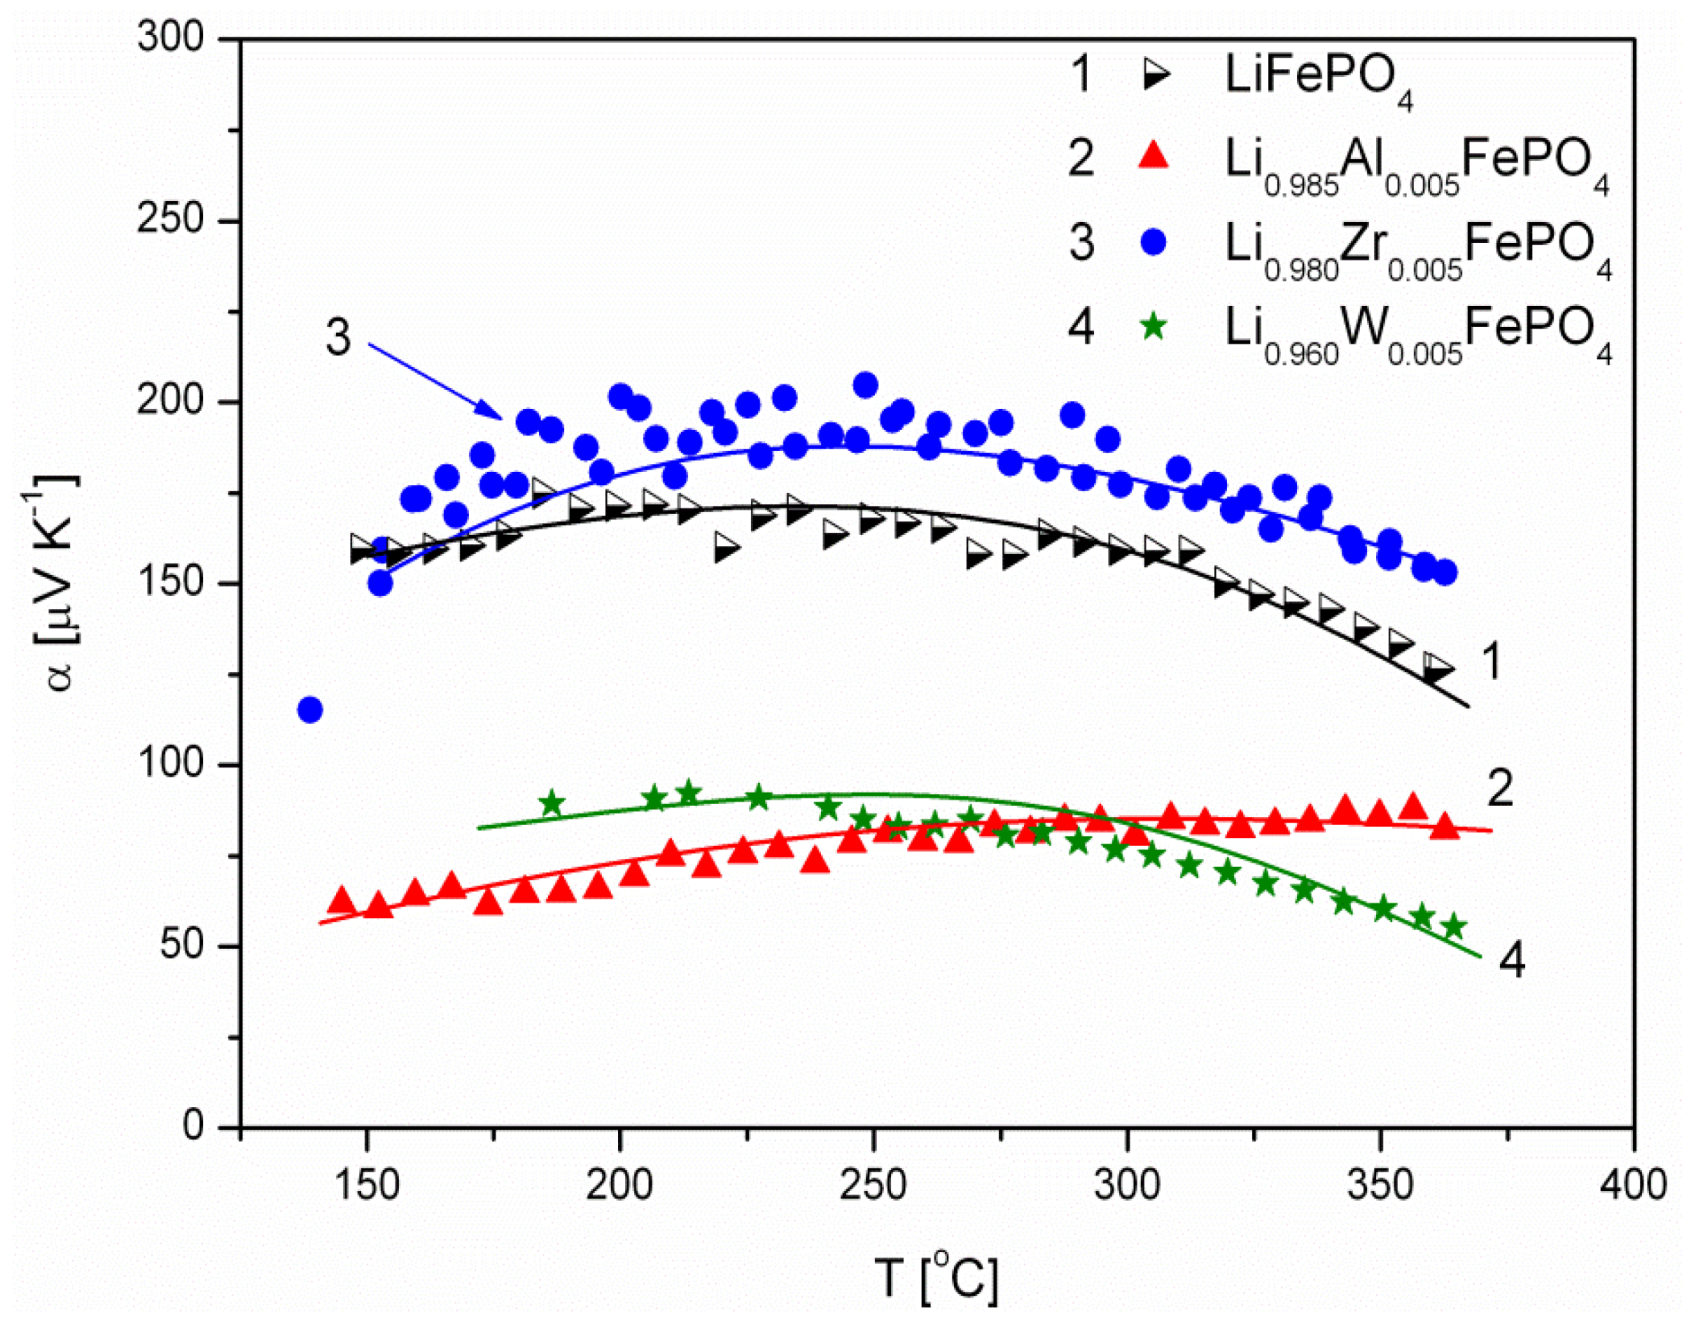
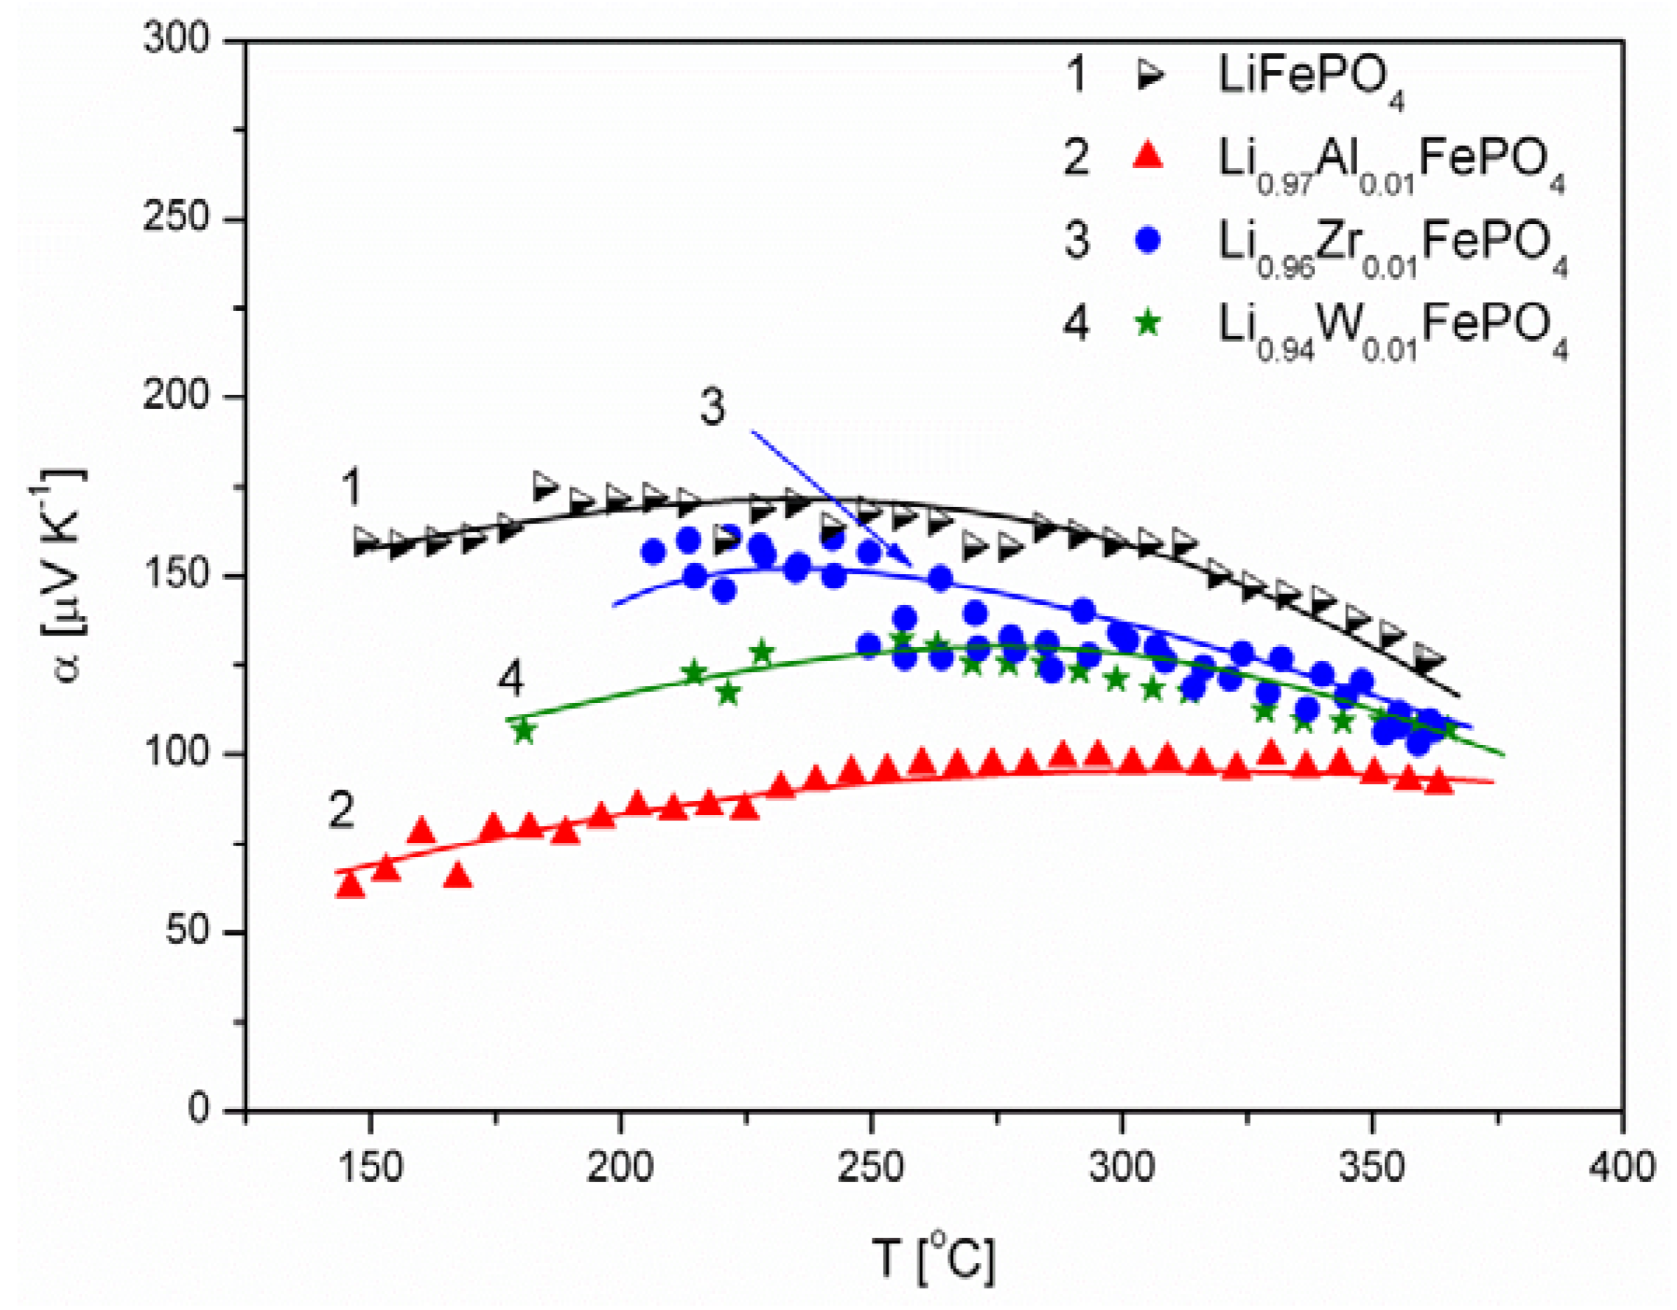
2.1.3. Transport Properties

Figure 6, Figure 7, Figure 8, Figure 9, Figure 10 and Figure 11 show the results of the measurements of total electrical conductivity σ and thermoelectric power α of phosphoolivines substituted in the Li-sublattice by Al3+, Zr4+ and W6+ cations, respectively, data taken from [47]. All the results are shown for samples within the assumed range of formation of solid solution (xW6+ < 0.01, xZr4+ < 0.02, xAl3+ < 0.1). For comparison, data for pristine LiFePO4 is also given. Data for Li1−3xAlxFePO4 is taken from [48].
Figure 6. Temperature dependence of electrical conductivity of Li-site substituted phosphoolivines with x = 0.001 mol mol−1.
Materials 06 01656 g006
Figure 7. Temperature dependence of electrical conductivity of Li-site substituted phosphoolivines with x = 0.005 mol mol−1.
Materials 06 01656 g007
Figure 8. Temperature dependence of electrical conductivity of Li-site substituted phosphoolivines with x = 0.01 mol mol−1.
Materials 06 01656 g008
As indicated by results shown in Figure 6, Figure 7 and Figure 8, the temperature dependence of electrical conductivity for all studied samples exhibits activated character. In the case of Al3+-substituted materials, no significant effect of aluminum on σ values can be seen, apart from a somewhat unexpected behavior for Li0.997Al0.001FePO4 at lower temperatures. Assuming Li substitution by Zr and W causes a decrease of electrical conductivity of the materials, however this effect may also originate from the secondary phases, whose presence is evident at higher concentration levels. Estimated values of the activation energy of electrical conductivity Ea are in the 0.44–0.6 eV range, and do not differ significantly from pristine LiFePO4, for which a similar range of Ea values was reported, dependent on the synthesis method.
Figure 9. Temperature dependence of thermoelectric power of Li-site substituted phosphoolivines with x = 0.001 mol mol−1.
Materials 06 01656 g009
Figure 10. Temperature dependence of thermoelectric power of Li-site substituted phosphoolivines with x = 0.005 mol mol−1.
Materials 06 01656 g010
Figure 11. Temperature dependence of thermoelectric power of Li-site substituted phosphoolivines with x = 0.01 mol mol−1.
Materials 06 01656 g011
The positive sign of thermoelectric power (Figure 9, Figure 10 and Figure 11) for Al3+, Zr4+ and W6+-substituted materials indicates positive charge carries (holes) as dominant. This is characteristic for phosphoolivines obtained by the high-temperature method, and can be related to the evaporation of lithium during the procedure over the 650–750 °C temperature range, formation of lithium vacancies (V′Li) and charge compensation by creation of holes (Fe˙Fe). Lower values of α, measured for substituted phosphoolivines in comparison to LiFePO4, may be related to the presence of phosphides on the phosphoolivine grains.
The authors’ studies on synthesis methods show that depending on the conditions of preparation of the substituted materials (Li1−3xAlxFePO4, Li1−4xZrxFePO4 and Li1−6xWxFePO4, 0.001 < x < 0.1), i.e., final temperature and heating rate, Ar flow rate, its purity and type of substrates, the observed values of electrical conductivity may vary as much as in the range 10−9–10−4 S cm−1 at room temperature. Also, the activation energy Ea changes from 0.7 eV down to as low as 0.02 eV. However, critical analysis of the observed electrical properties, which were measured for a large group of substituted phosphoolivines as a function of concentration and type of introduced cation, unambiguously falsifies the hypothesis that high values of the order of 10−4 S cm−1 at room temperature are related to a bulk conductivity. This is because of the following fundamental objections:
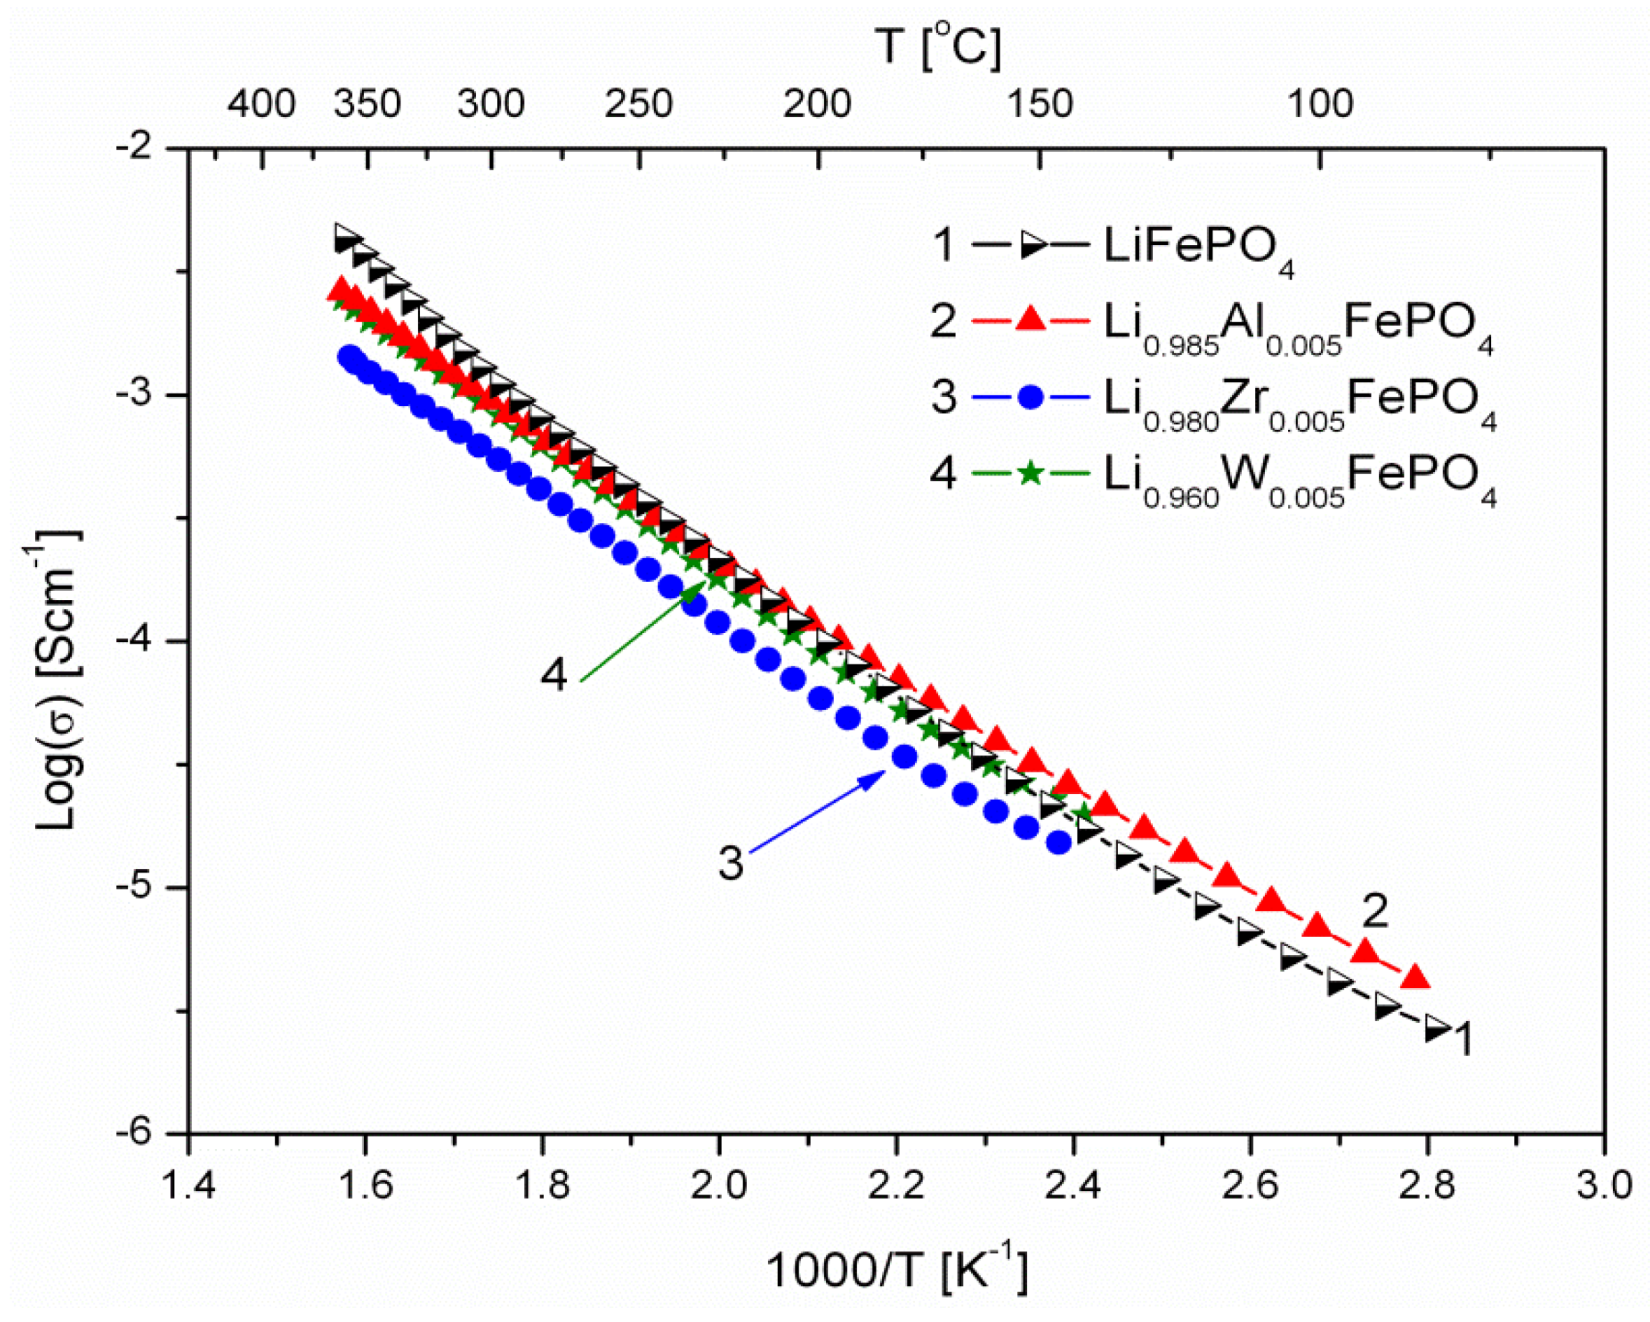
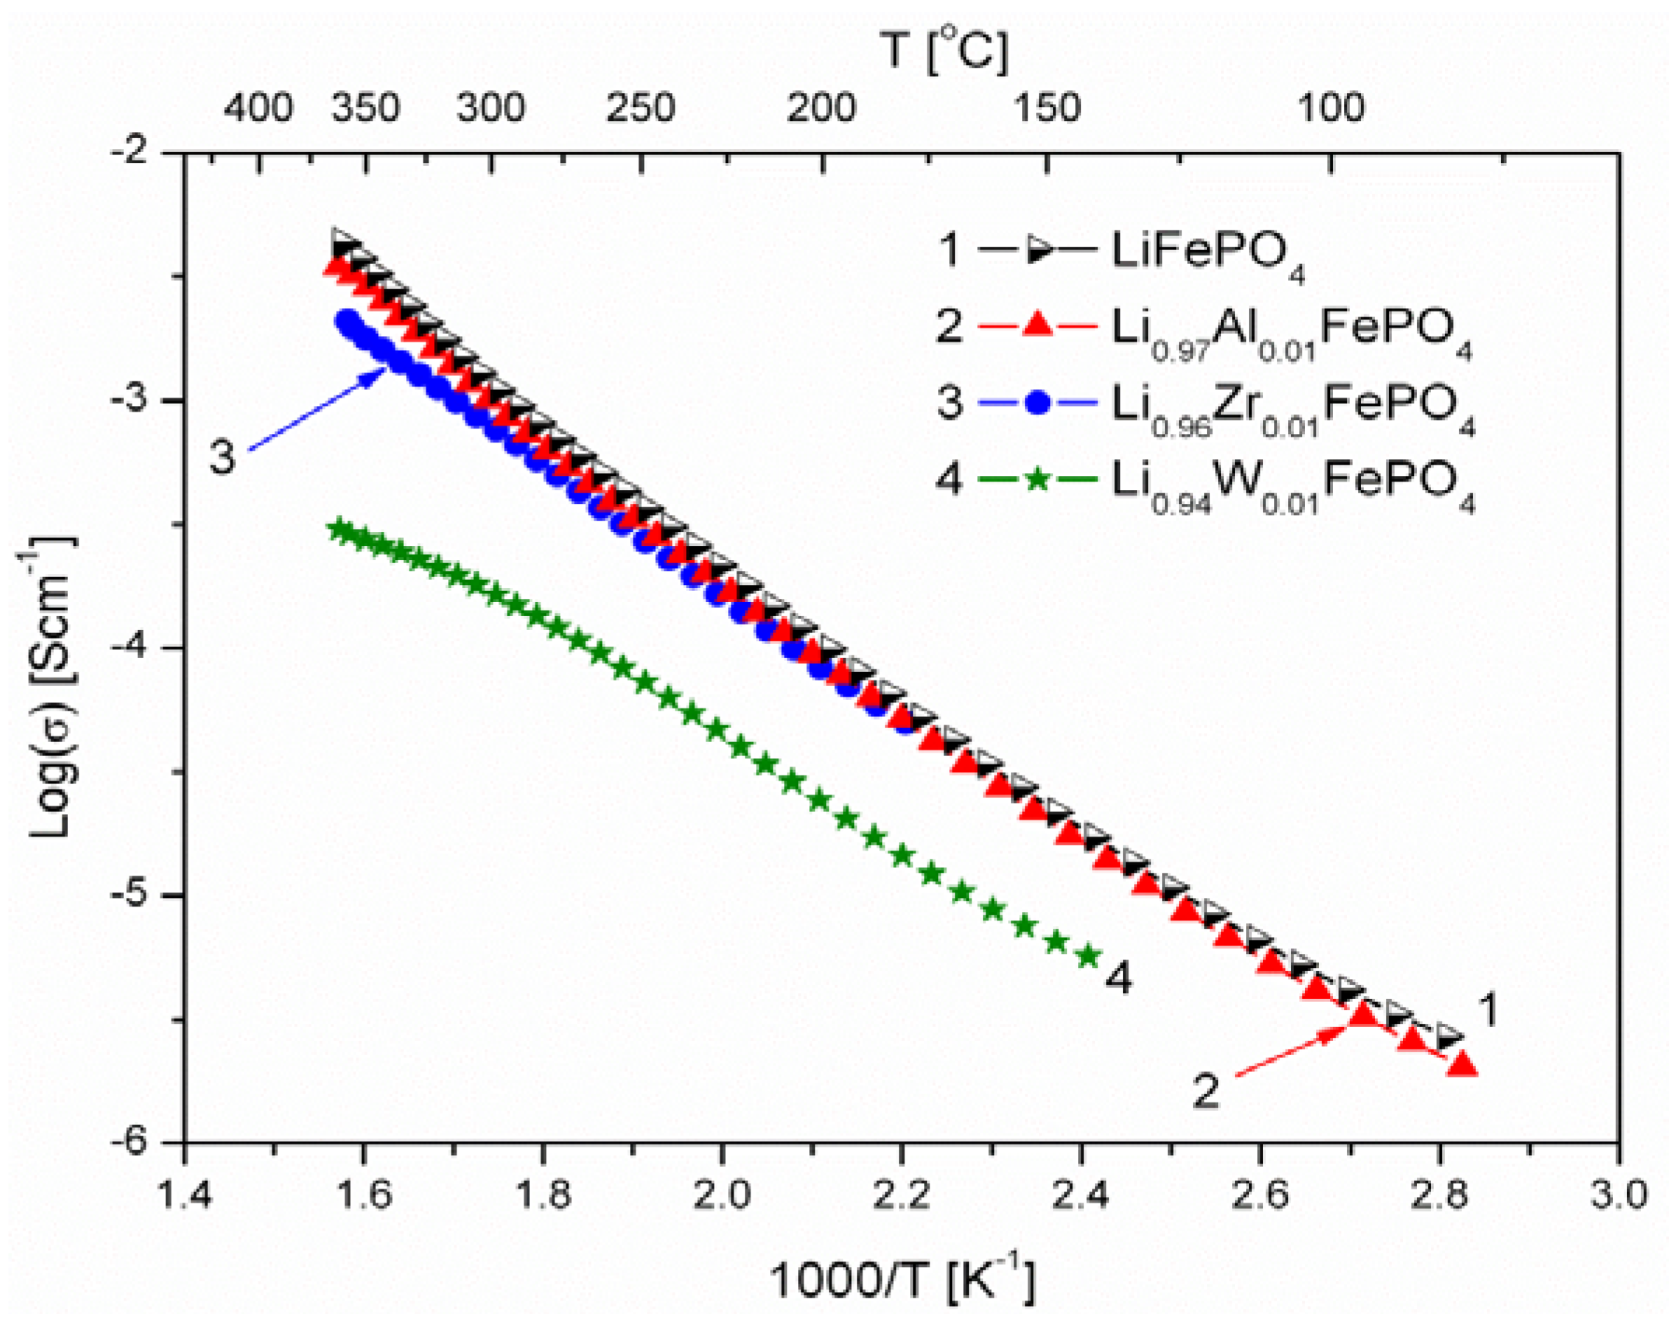
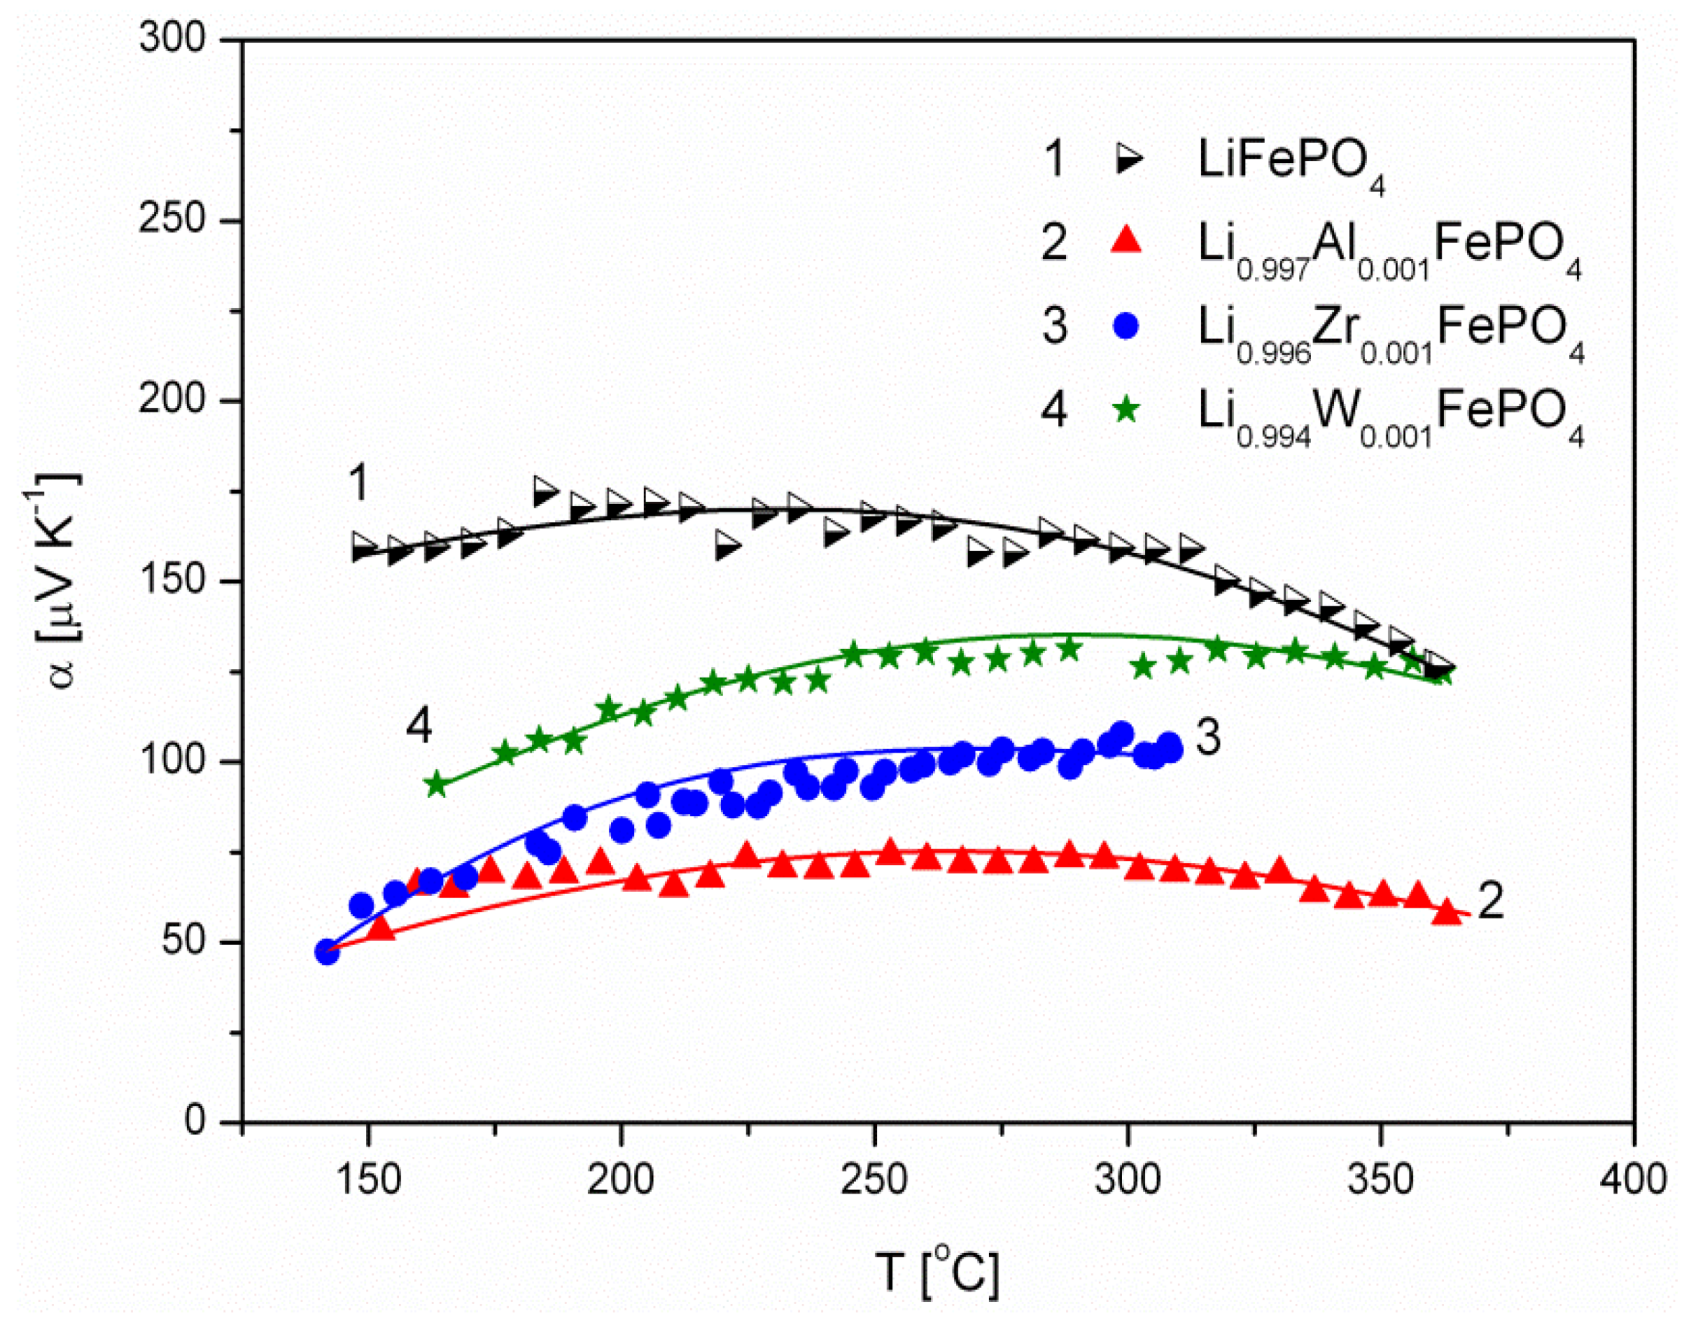
  • concentration and type of dopant have no significant influence on the values of electrical conductivity,
  • no critical concentration was observed, for which an effective conduction band could be created as an in Mott-type metal-insulator transition,
  • inhomogeneous distribution of dopant elements may also lead to high conductivity values,
  • the delithiation process proceeds as a two-phase type reaction, the same as in the case of insulating LiFePO4 (see the following section).
The analysis of synthesis procedure conditions for phosphoolivine materials and the type of selected substrates lead to the conclusion that enhanced conductivity appears as a result of formation of a conduction path, due to precipitation of carbon (from organic precursors) and/or formation of a thin conduction path consisting of metallic-type iron phosphides (Fe2P), which appear in reductive synthesis conditions. Traces of such iron phosphides, estimated as 3–4 wt %, were detected by the surface-sensitive CEMS Moessbauer technique [49] and TEM studies [37]. It can be therefore stated [38] that conductive phosphoolivine is in fact a composite material comprising an insulating LiFePO4 core and a non-continuous layer of conducting Fe2P and carbon on the surface of the grains. Iron phosphides and carbon precipitates form a conducting percolation path, which is manifested macroscopically in a form of enhanced, like metallic conductivity. Using the following substrates: FeC2O4·H2O, NH4H2PO4 and Li2CO3, in the course of the synthesis, and with oxygen partial pressure <10−5 atm, there are several internal reducing agents: pyrophoric Fe (the strongest one), iron carbonyls Fex(CO)y, as well as C, CO and NH3. All of them together lead to partial reduction of LiFePO4 to Fe2P. Furthermore, an assumed lithium deficiency (in Li1−xFePO4), causes the appearance of the Fe2+/Fe3+ redox pair, which may further catalyze reduction of LiFePO4 to Fe2P.
Impedance spectroscopy measurements of the electrical conductivity of pristine LiFePO4, performed over the 300–700 K temperature range [7], allowed the determination of an ionic and an electronic component of electrical conductivity. Both components are comparable and are of the order of 10−9 S cm−1 at room temperature. Also, the activation energies of both components are comparable and are equal to 0.66 eV and 0.63 eV for electronic and ionic conductivity, respectively. It is generally acknowledged that iron ions in the octahedral position in Li1−xFePO4 possess high-spin configuration: t3t2g(↑)e2g(↑)tt2g(↓) for Fe2+ and t3t2g(↑)e2g(↑) for Fe3+. The energy gap Eg in LiFePO4 was determined by theoretical [51] and experimental [2] methods and is of the order of 3.8 eV. Therefore, the observed activation energy of the electronic component of electrical conductivity (0.66 eV) may be explained as the migration energy of Fe˙Fe-V′Li pairs, which form so called magnetic polarons. Studies of magnetic properties [2] confirmed the presence of such magnetic polarons and their concentration was estimated as being equal to 0.2–0.3 mol %.
As was confirmed by our studies, the effect of non-symmetrical cation mixing, which leads to the formation of complex Fe˙Li-V′Li defects with Fe2+ions present in lithium sites, results in the increase of the activation energy of lithium migration, even up to 0.8 eV.
Analysis of the effect of Al3+, Zr4+ and W6+ cations on the transport properties of LiFePO4 leads to the conclusion that it manifests itself mainly through an increase in concentration of lithium vacancies, due to charge compensation requirements and associated changes of unit cell parameters. Therefore, it affects ionic conductivity much stronger, which can be observed as a decrease of activation energy of ionic conductivity from 0.7 eV down to 0.48–0.45 eV. This is mainly associated with an increase of unit cell parameters and volume, as well as with an increase in concentration of lithium vacancies.

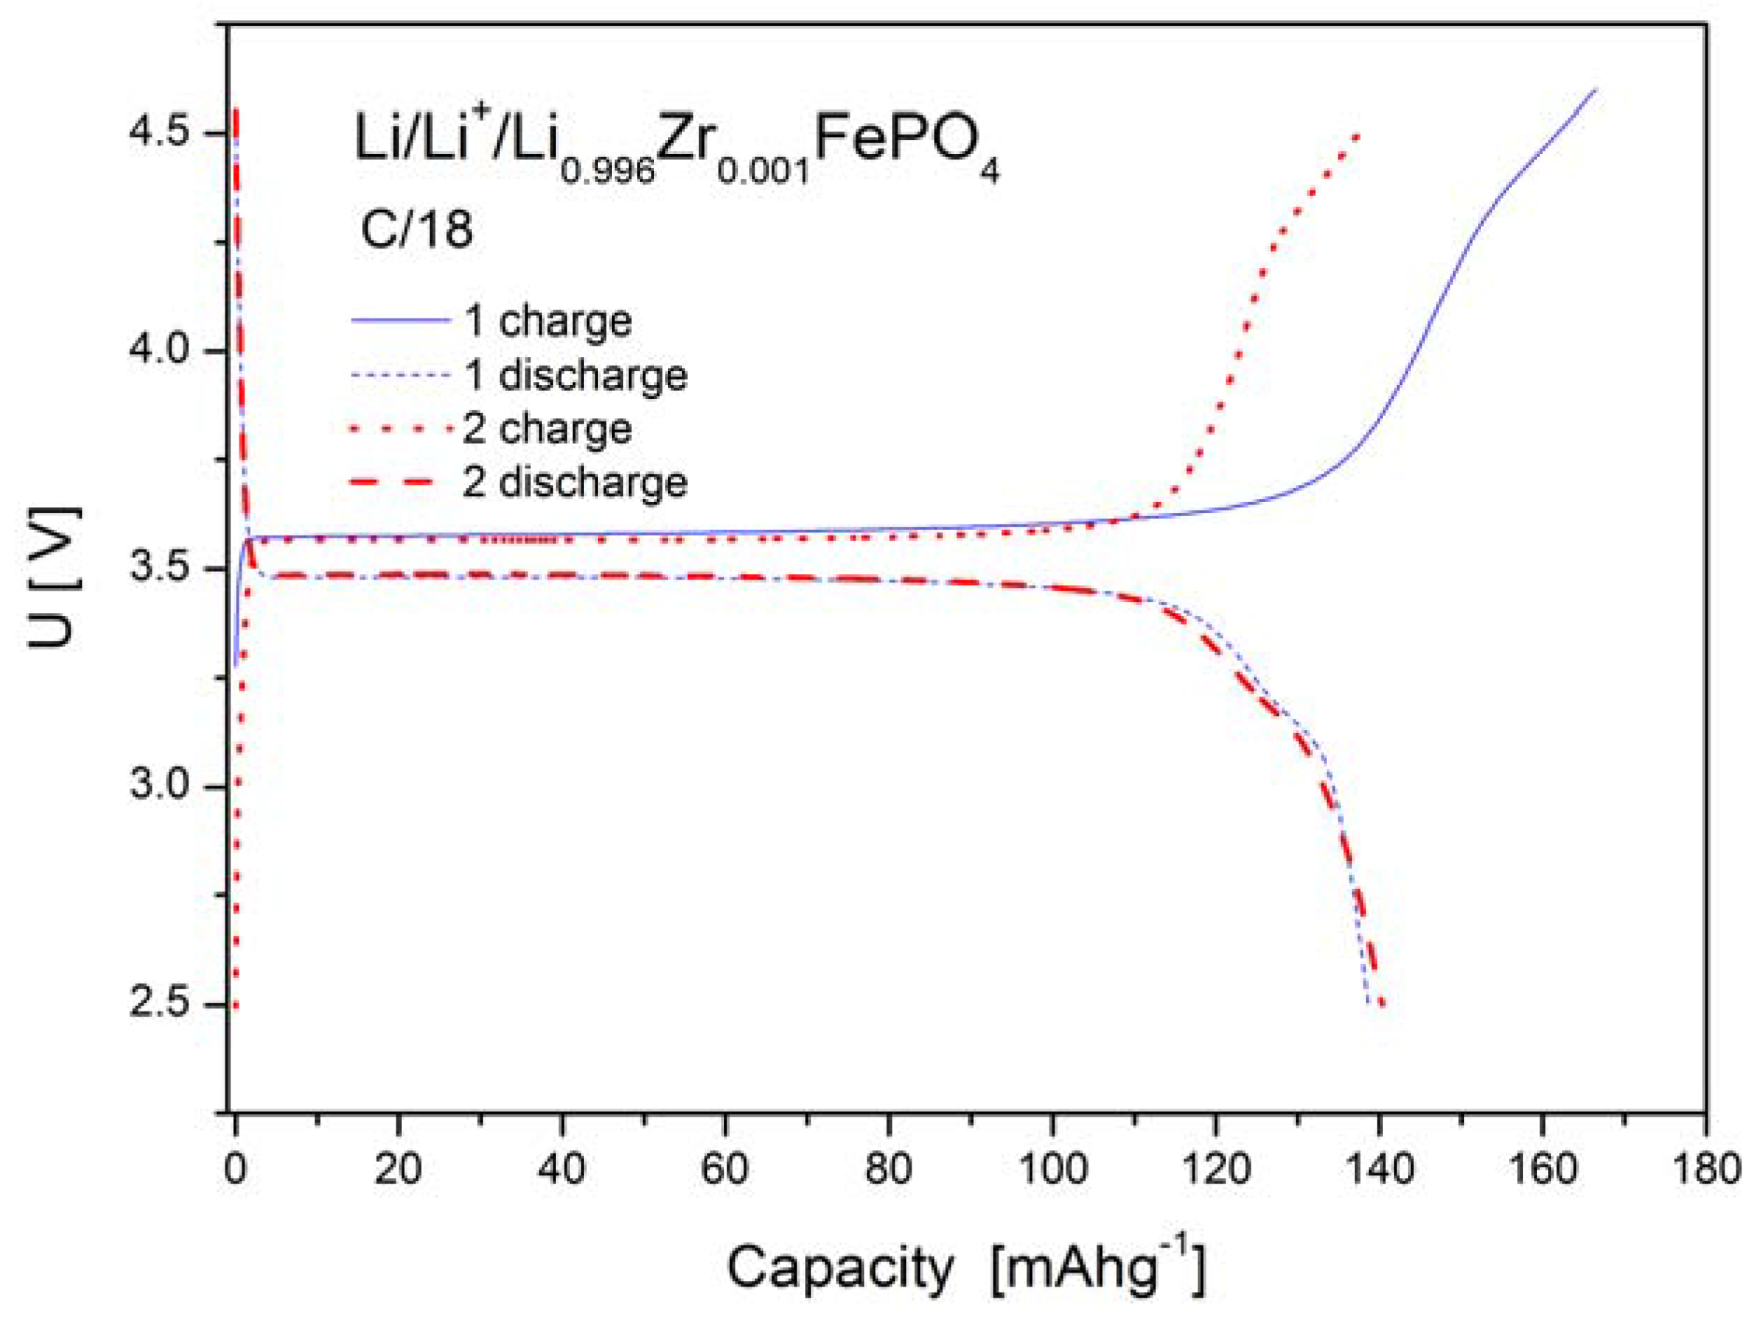
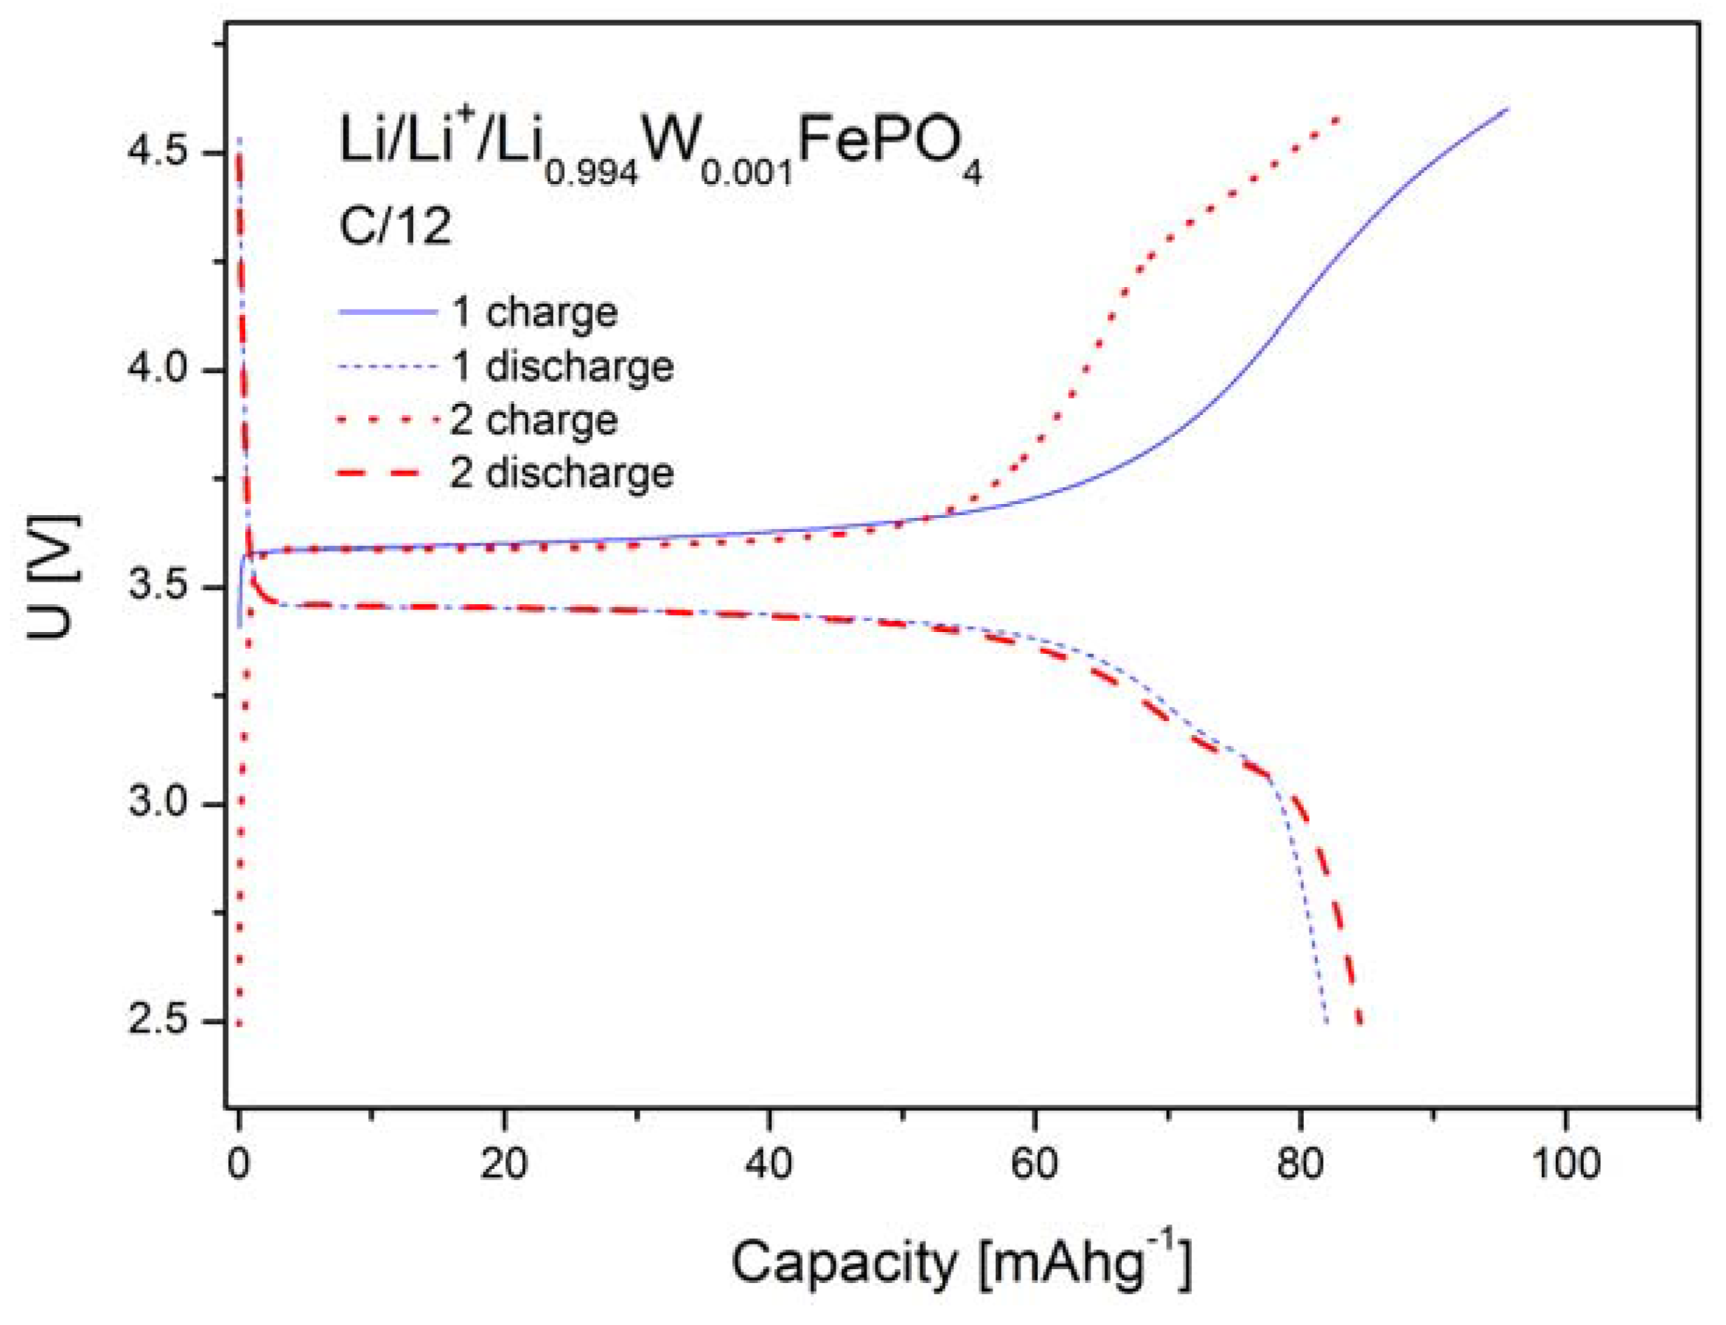
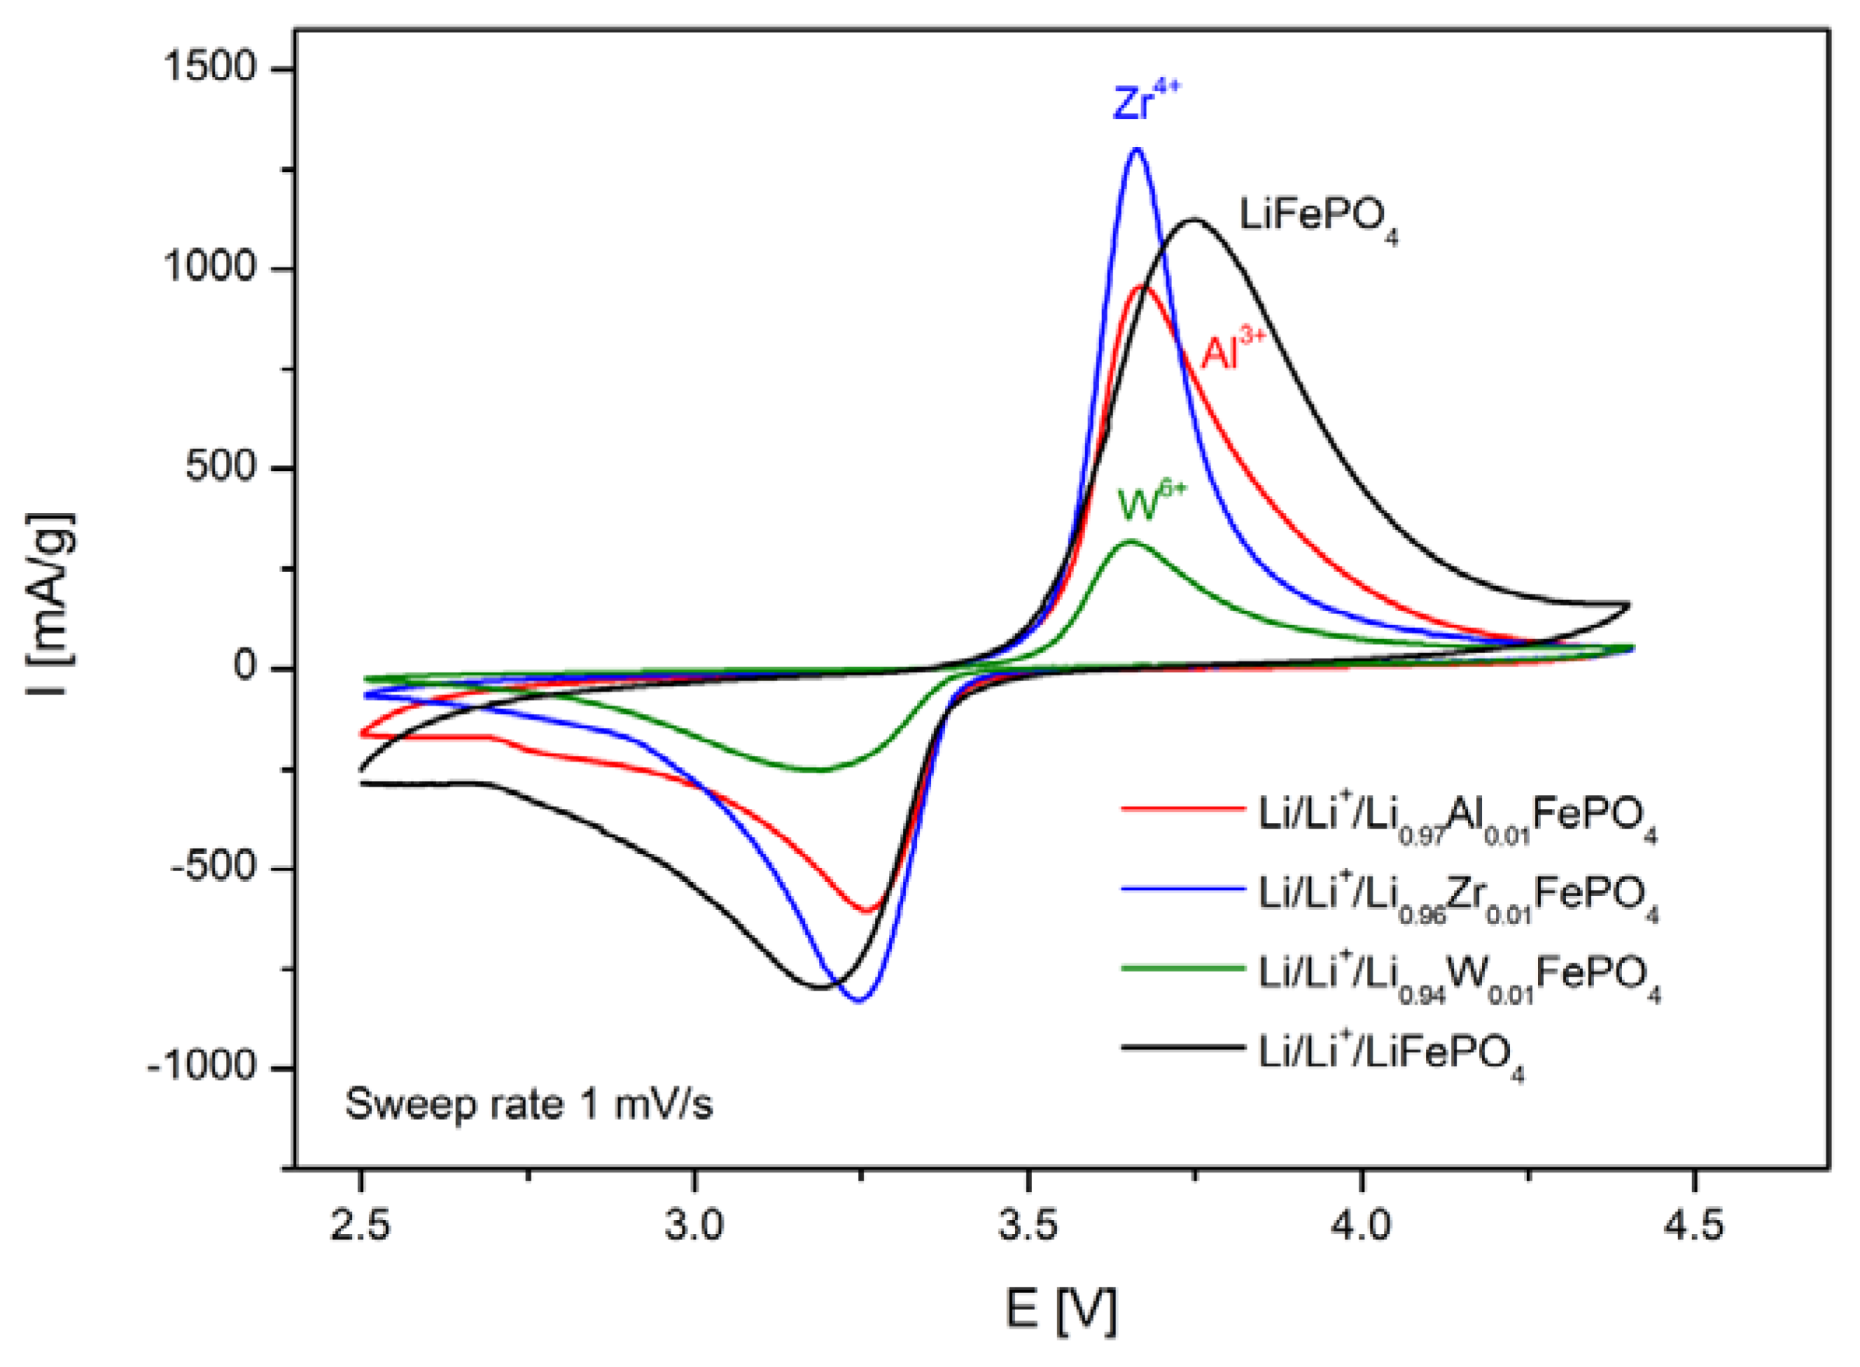
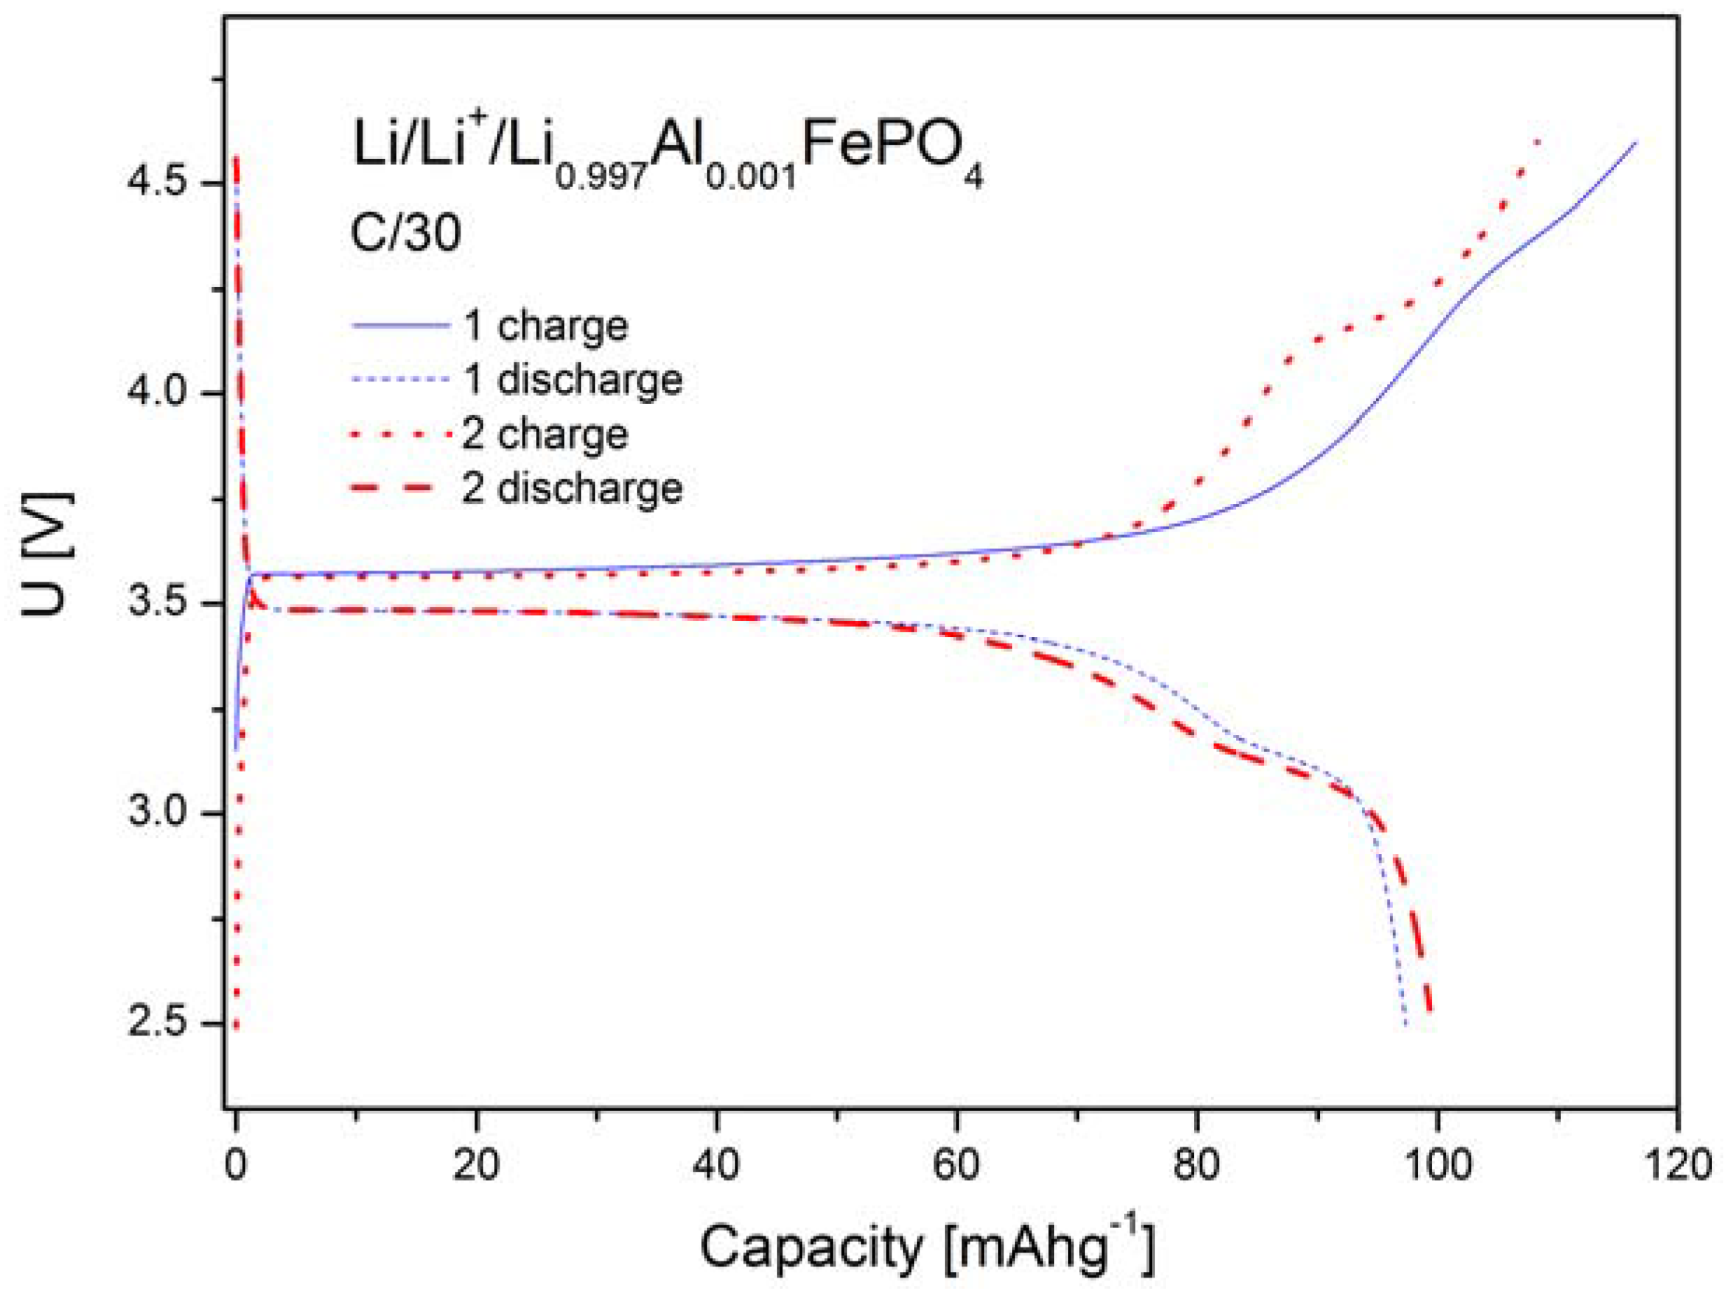
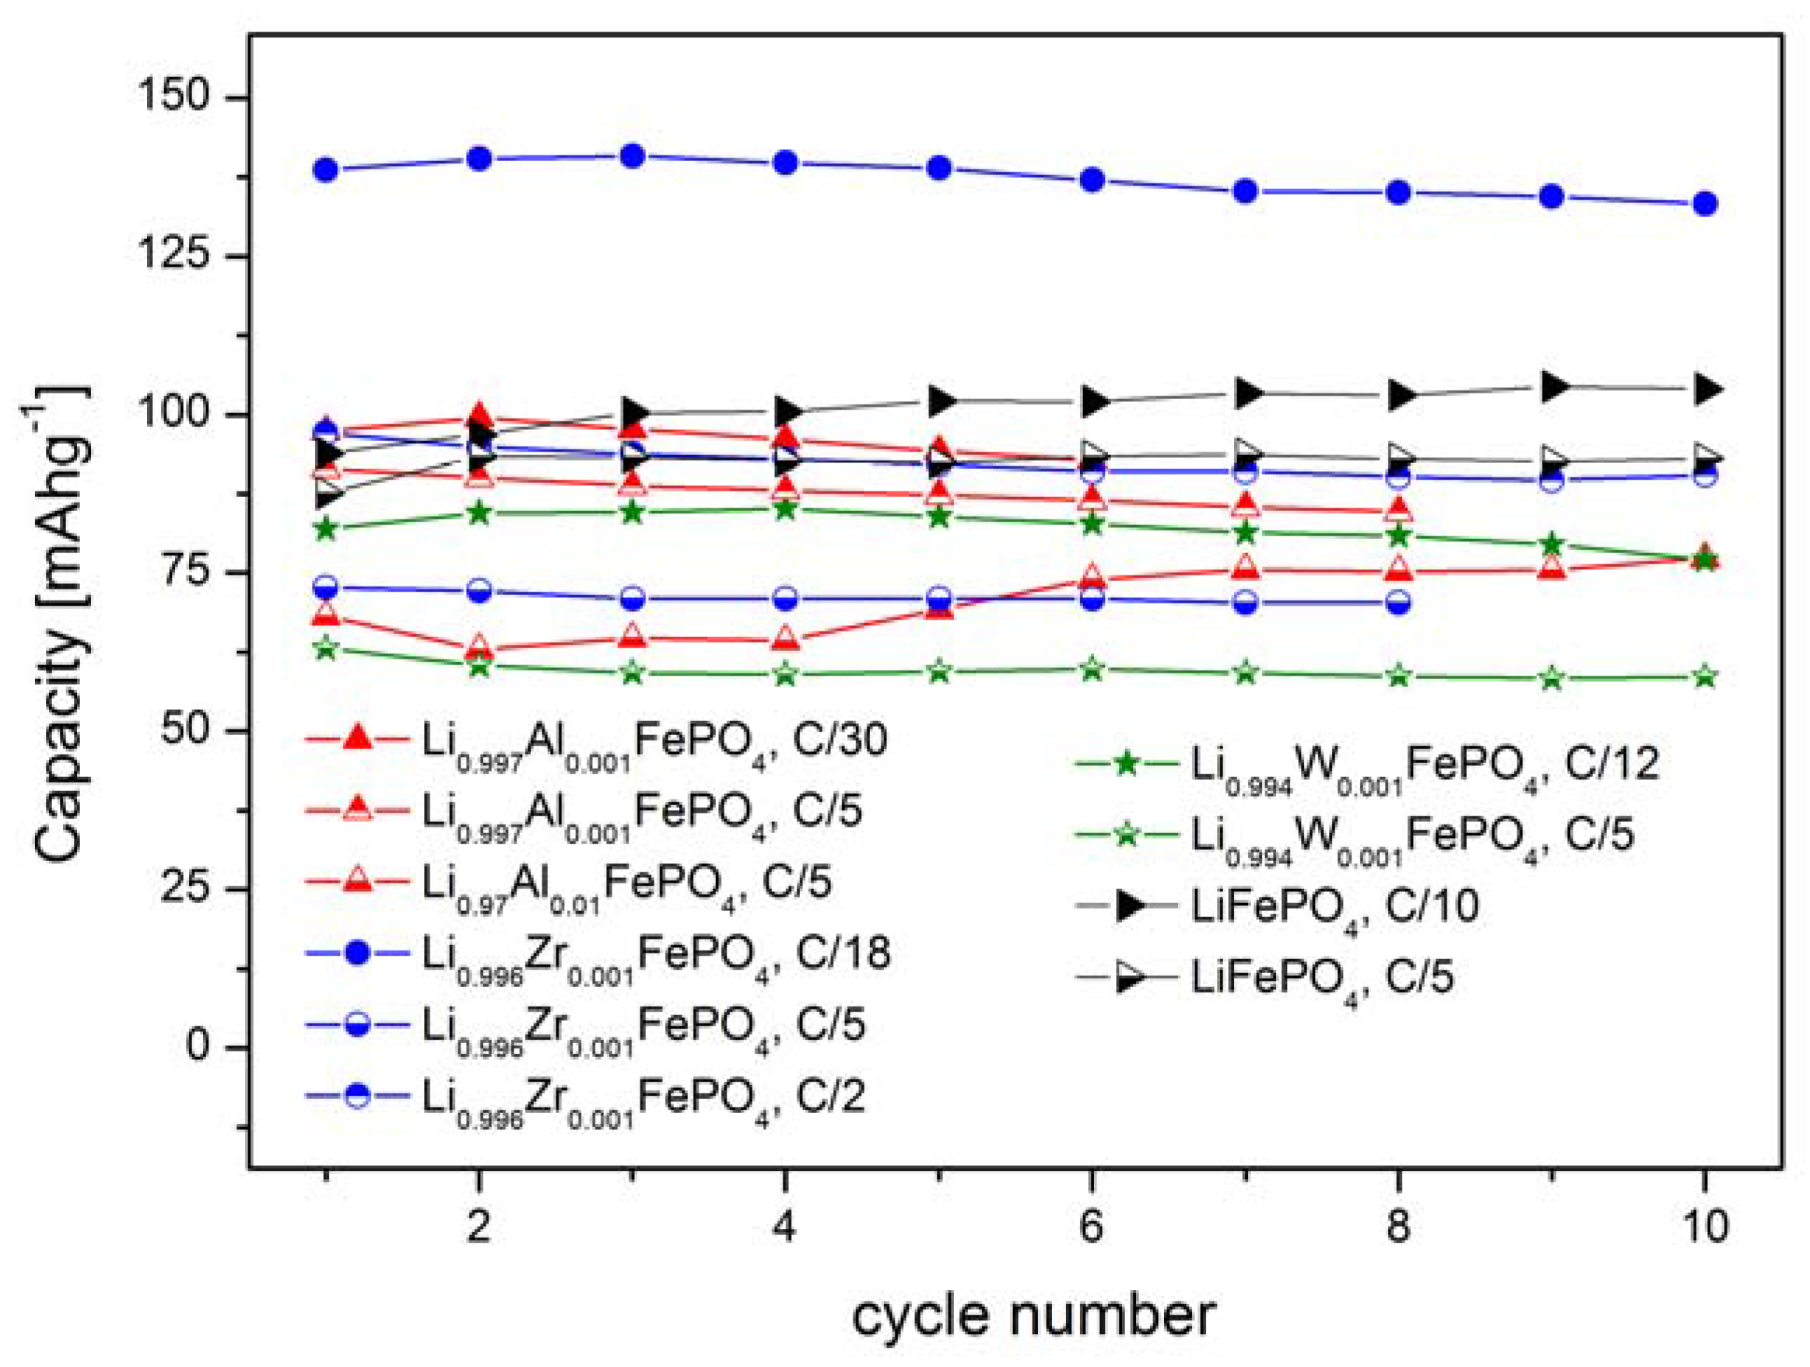
2.1.4. Electrochemical Properties

Figure 12, Figure 13 and Figure 14 show charge and discharge curves of selected lithium cells, in which studied, Li-site substituted phosphoolivines were used as the cathode material.
As can be seen in Figure 12, Figure 13 and Figure 14, charge and discharge processes present plateaux, of which voltage versus lithium anode is equal to about 3.6 V and slightly below 3.5 V, respectively. During the charging of the cell, lithium cations, together with an equal amount of electrons from tt2g(↓) level, are taken out from the cathode material, which causes oxidation of Fe2+ to Fe3+. The reverse process takes place during the cell’s discharge. The plateau-type character of the curves indicates a two-phase type mechanism of the cathode process and is in general agreement with predictions of state-of-the-art theoretical models [18,19,20] for low density current regime and in the morphology of investigated powders Simplifying, the following equation can describe the intercalation/deintercalation mechanism of phosphoolivine:
L i F e P O     4 x L i   + x e d i s c h a r g e c h a r g e ( 1 x ) L i   1 F e P O     4 + x F e P O     4
Figure 12. Charge and discharge curves (two initial cycles) for Li/Li+/Li0.997Al0.001FePO4 cell.
Materials 06 01656 g012
Figure 13. Charge and discharge curves (two initial cycles) for Li/Li+/Li0.996Zr0.001FePO4 cell.
Materials 06 01656 g013
Figure 14. Charge and discharge curves (two initial cycles) for Li/Li+/Li0.994W0.001FePO4 cell.
Materials 06 01656 g014
Figure 15 shows results of cyclic voltammetry studies obtained for selected cells based on LiFePO4, Li0.97Al0.01FePO4, Li0.96Zr0.01FePO4 and Li0.94W0.01FePO4 cathode materials. For all phosphoolivine cathode materials only a single redox peak is present. It can be observed that cathodic peaks are significantly higher, compared to anodic ones, which effect may be connected to different kinetics of delithiation and lithiation. Also, the shape and size of redox peaks depend on the dopant type. The highest and most narrow peaks can be seen on voltammetric curves recorded for Li0.96Zr0.01FePO4-based cells, while the smallest occurs for Li0.94W0.01FePO4-based cathode material. This is in agreement with charge/discharge curves and the corresponding capacity of the cathode materials, presented in Figure 12, Figure 13 and Figure 14. In summary, Zr4+ and Al3+doped materials exhibit similar properties to undoped LiFePO4, while the W6+ doped compound behaves much worse.
Figure 15. Cyclic voltammograms recorded for lithium cells with Li0.97Al0.01FePO4, Li0.96Zr0.01FePO4, Li0.94W0.01FePO4 and LiFePO4 cathode materials [47].
Materials 06 01656 g015
Such an effect of substitution can be further confirmed by data regarding reversible capacities of cells with Li0.997Al0.001FePO4, Li0.996Zr0.001FePO4, Li0.994W0.001FePO4 and Li0.97Al0.01FePO4-based cathodes, which were obtained for different charge/discharge rates (Figure 16). The best results were obtained for Li0.996Zr0.001FePO4 cathode material.
Figure 16. Reversible capacity of studied lithium cells with Li0.997Al0.001FePO4, Li0.996Zr0.001FePO4, Li0.994W0.001FePO4 and Li0.97Al0.01FePO4 cathode materials as a function of cycle number. Data obtained for different charge/discharge rates.
Materials 06 01656 g016

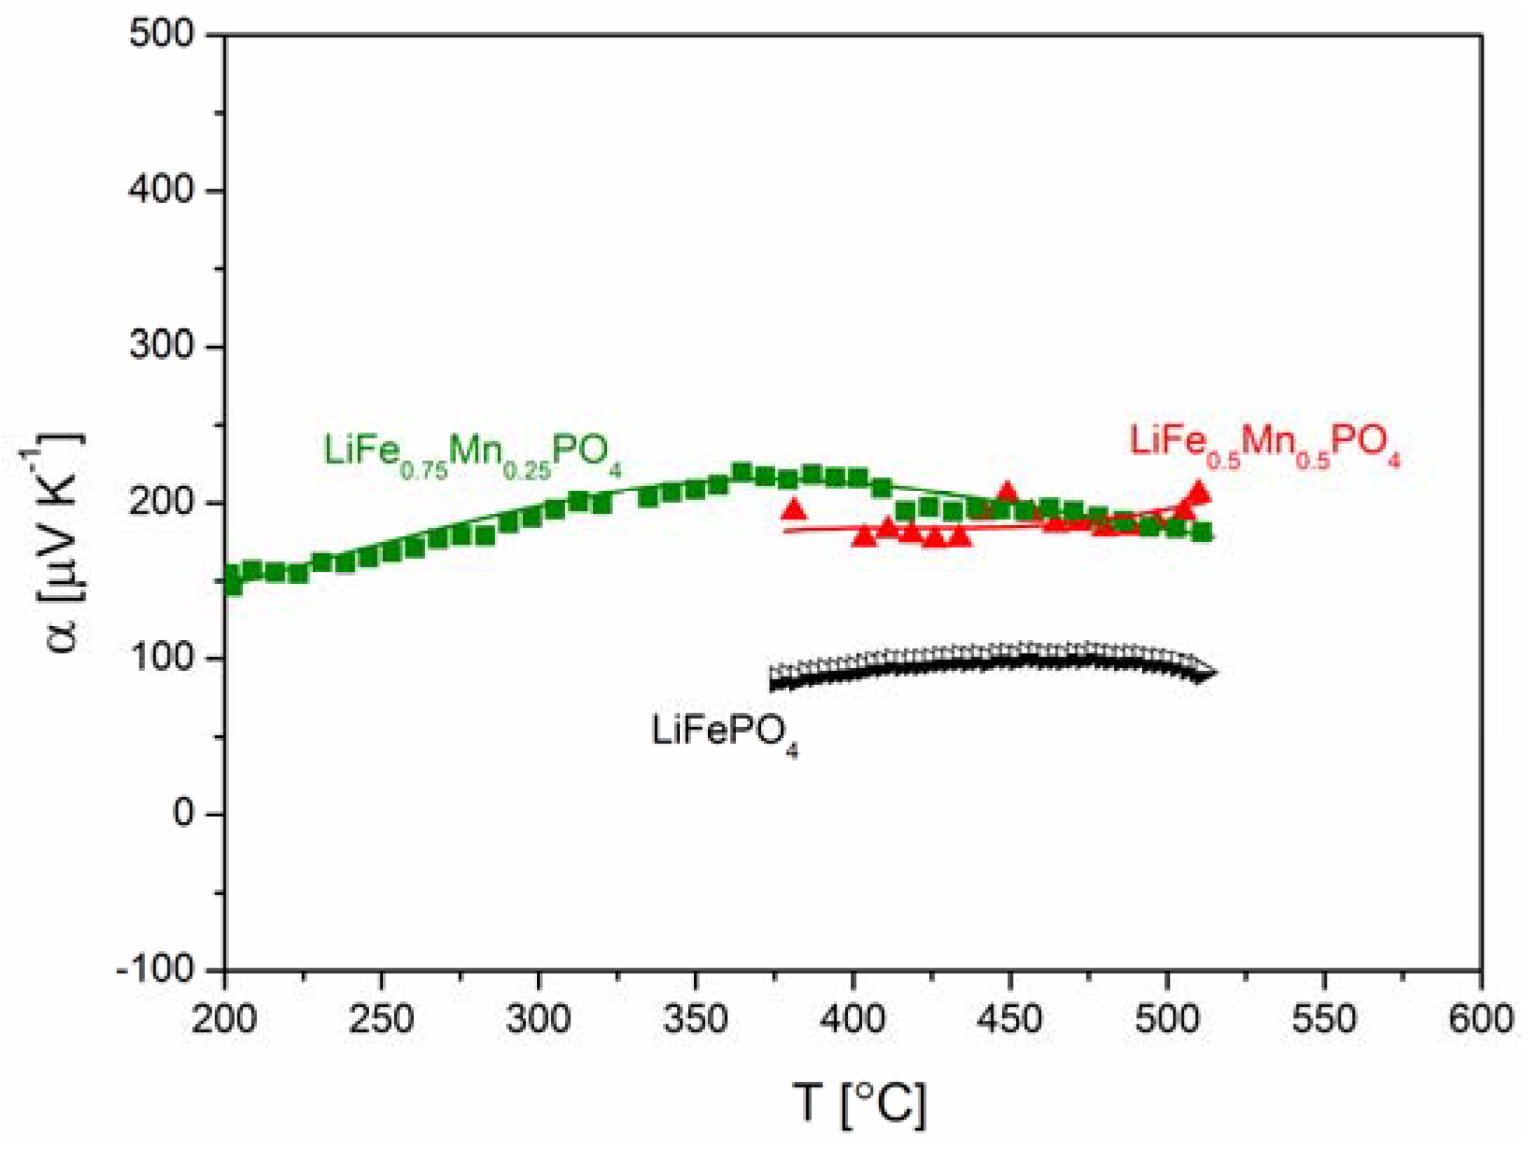
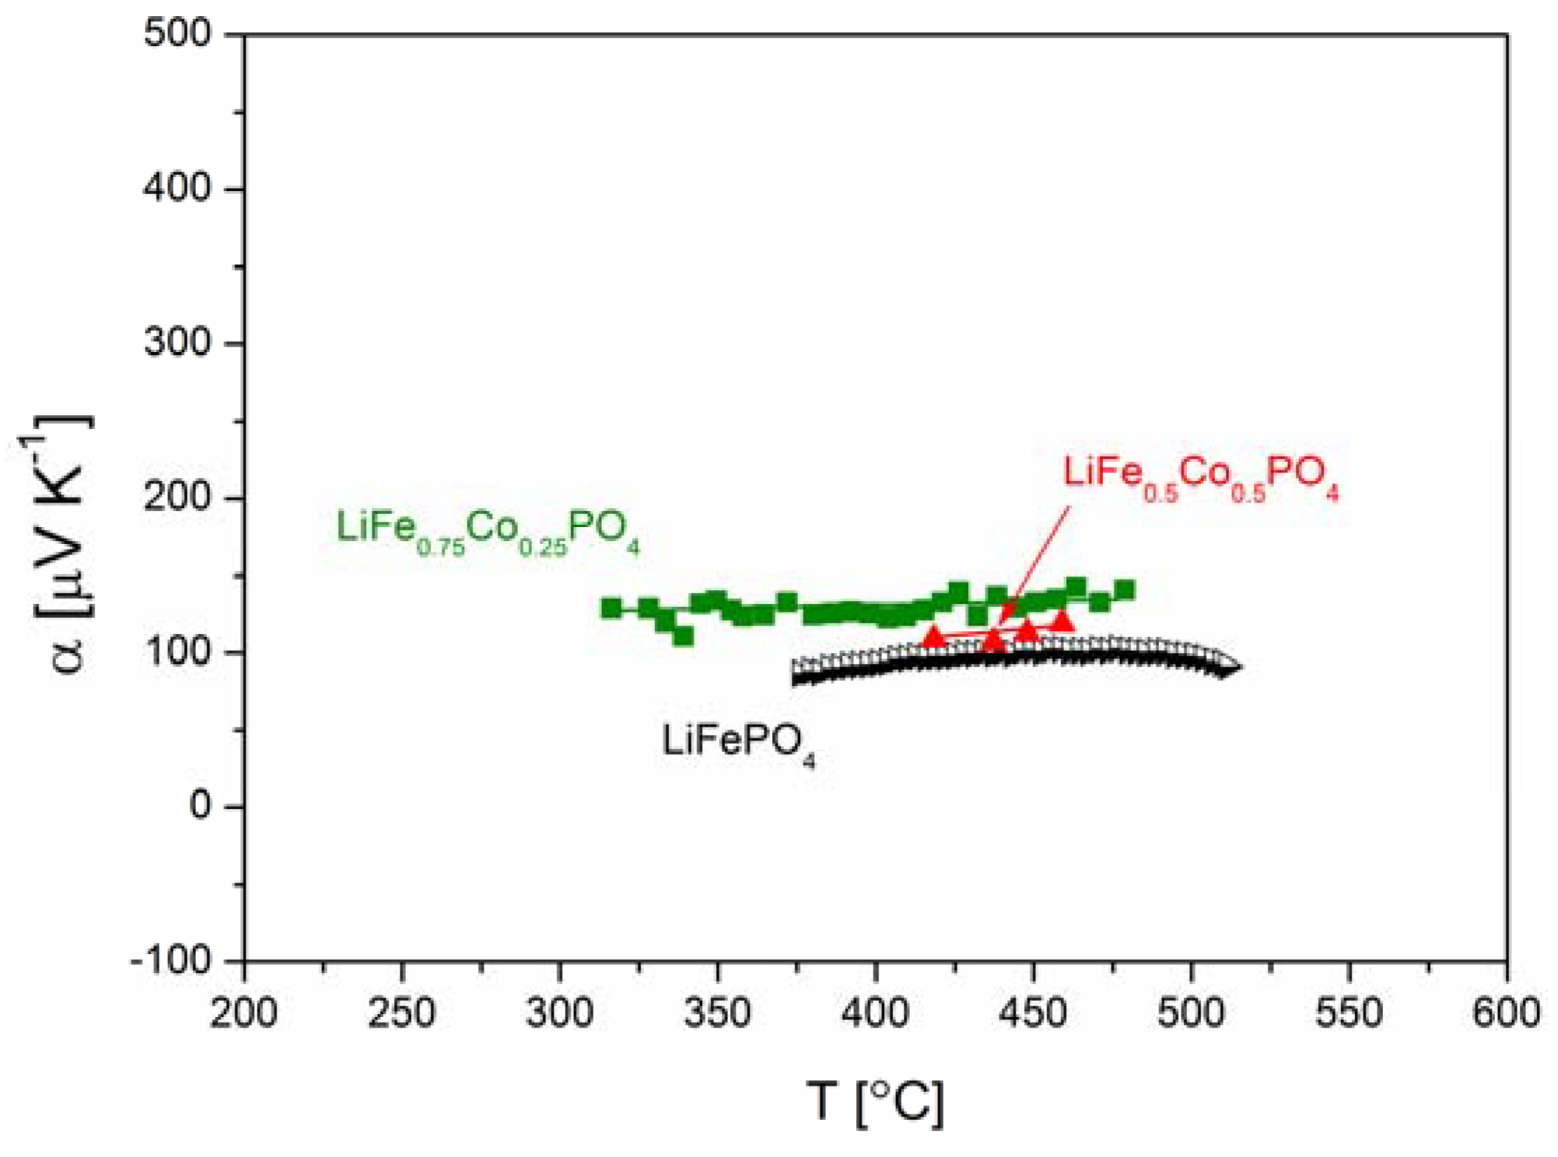
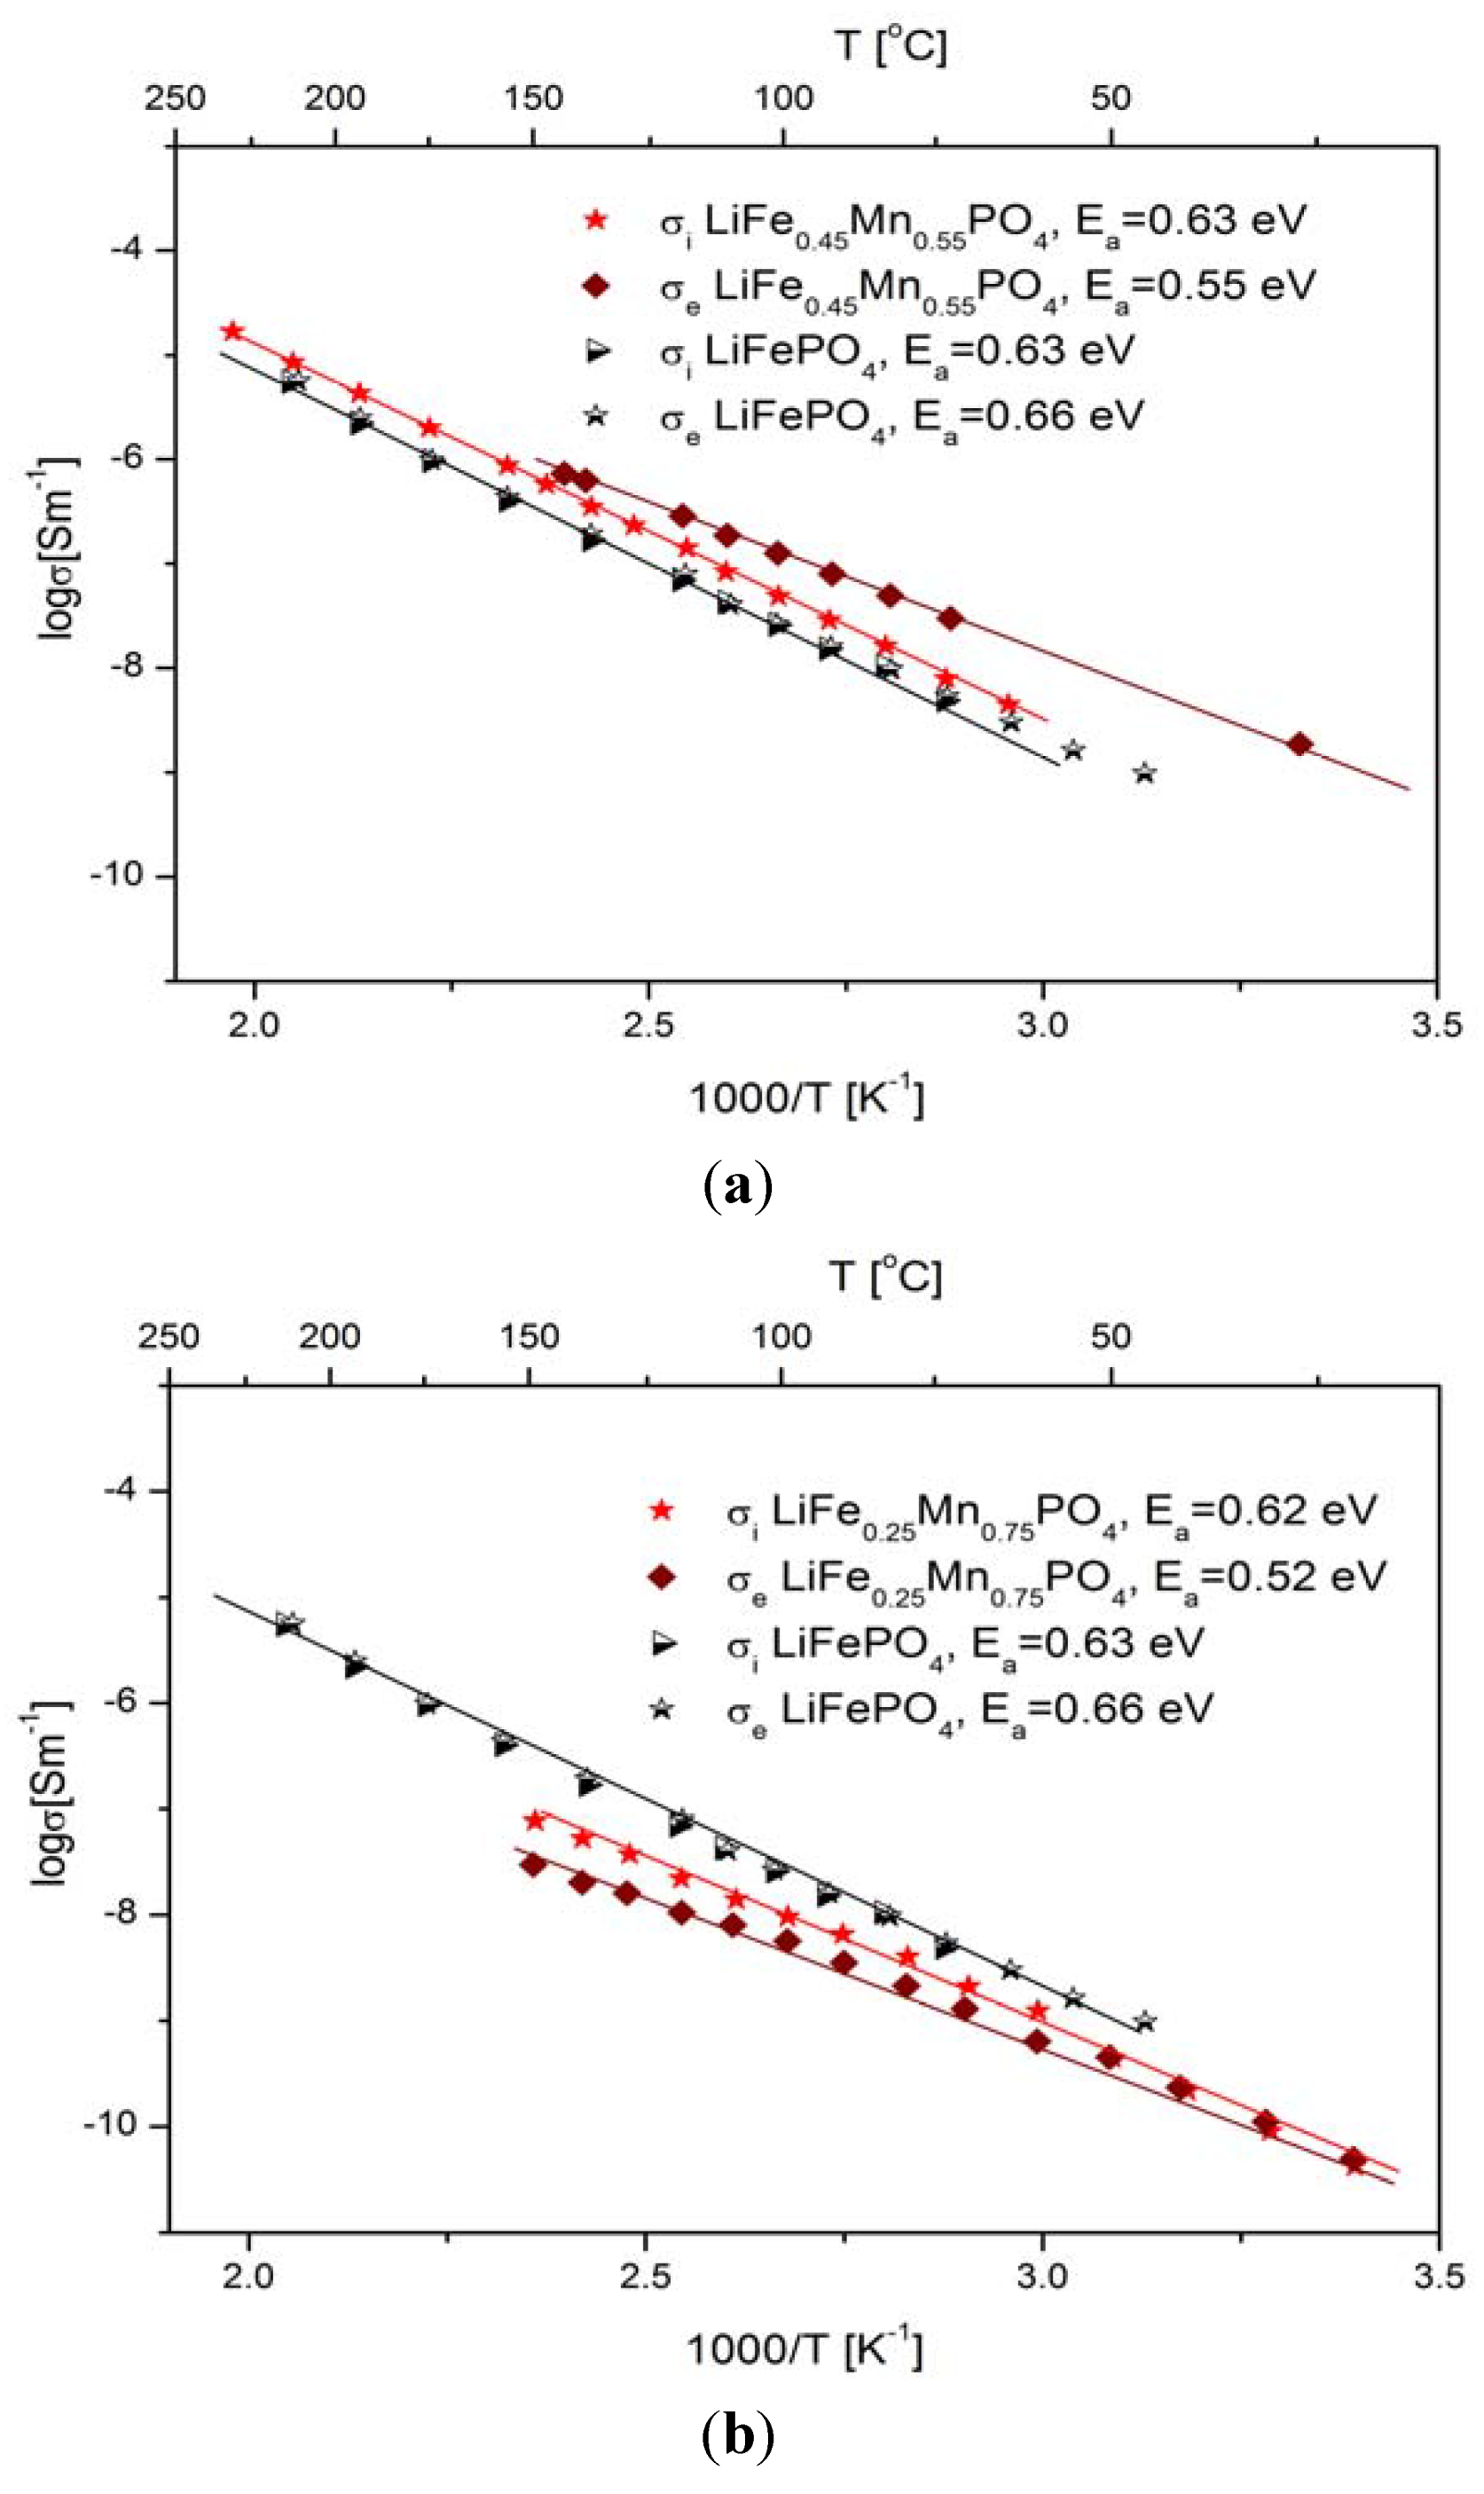
2.2. LiFePO4 Substituted by Mn2+, Co2+, Ni2+ and Cu2+ Cations in the Iron Sublattice

Three series of LiFe1−yMyPO4 materials were studied, in which the amount of substitution y of metal M = Mn2+, Co2+ and Ni2+ was equal to 0, 0.25, 0.5, 0.75 and 1 mol mol−1. An attempt to synthesize LiFe1−yCuyPO4 phosphoolivines for y = 0.01, 0.02 and 0.05 mol mol−1 was also conducted. In all cases a high-temperature solid state reaction method was applied.

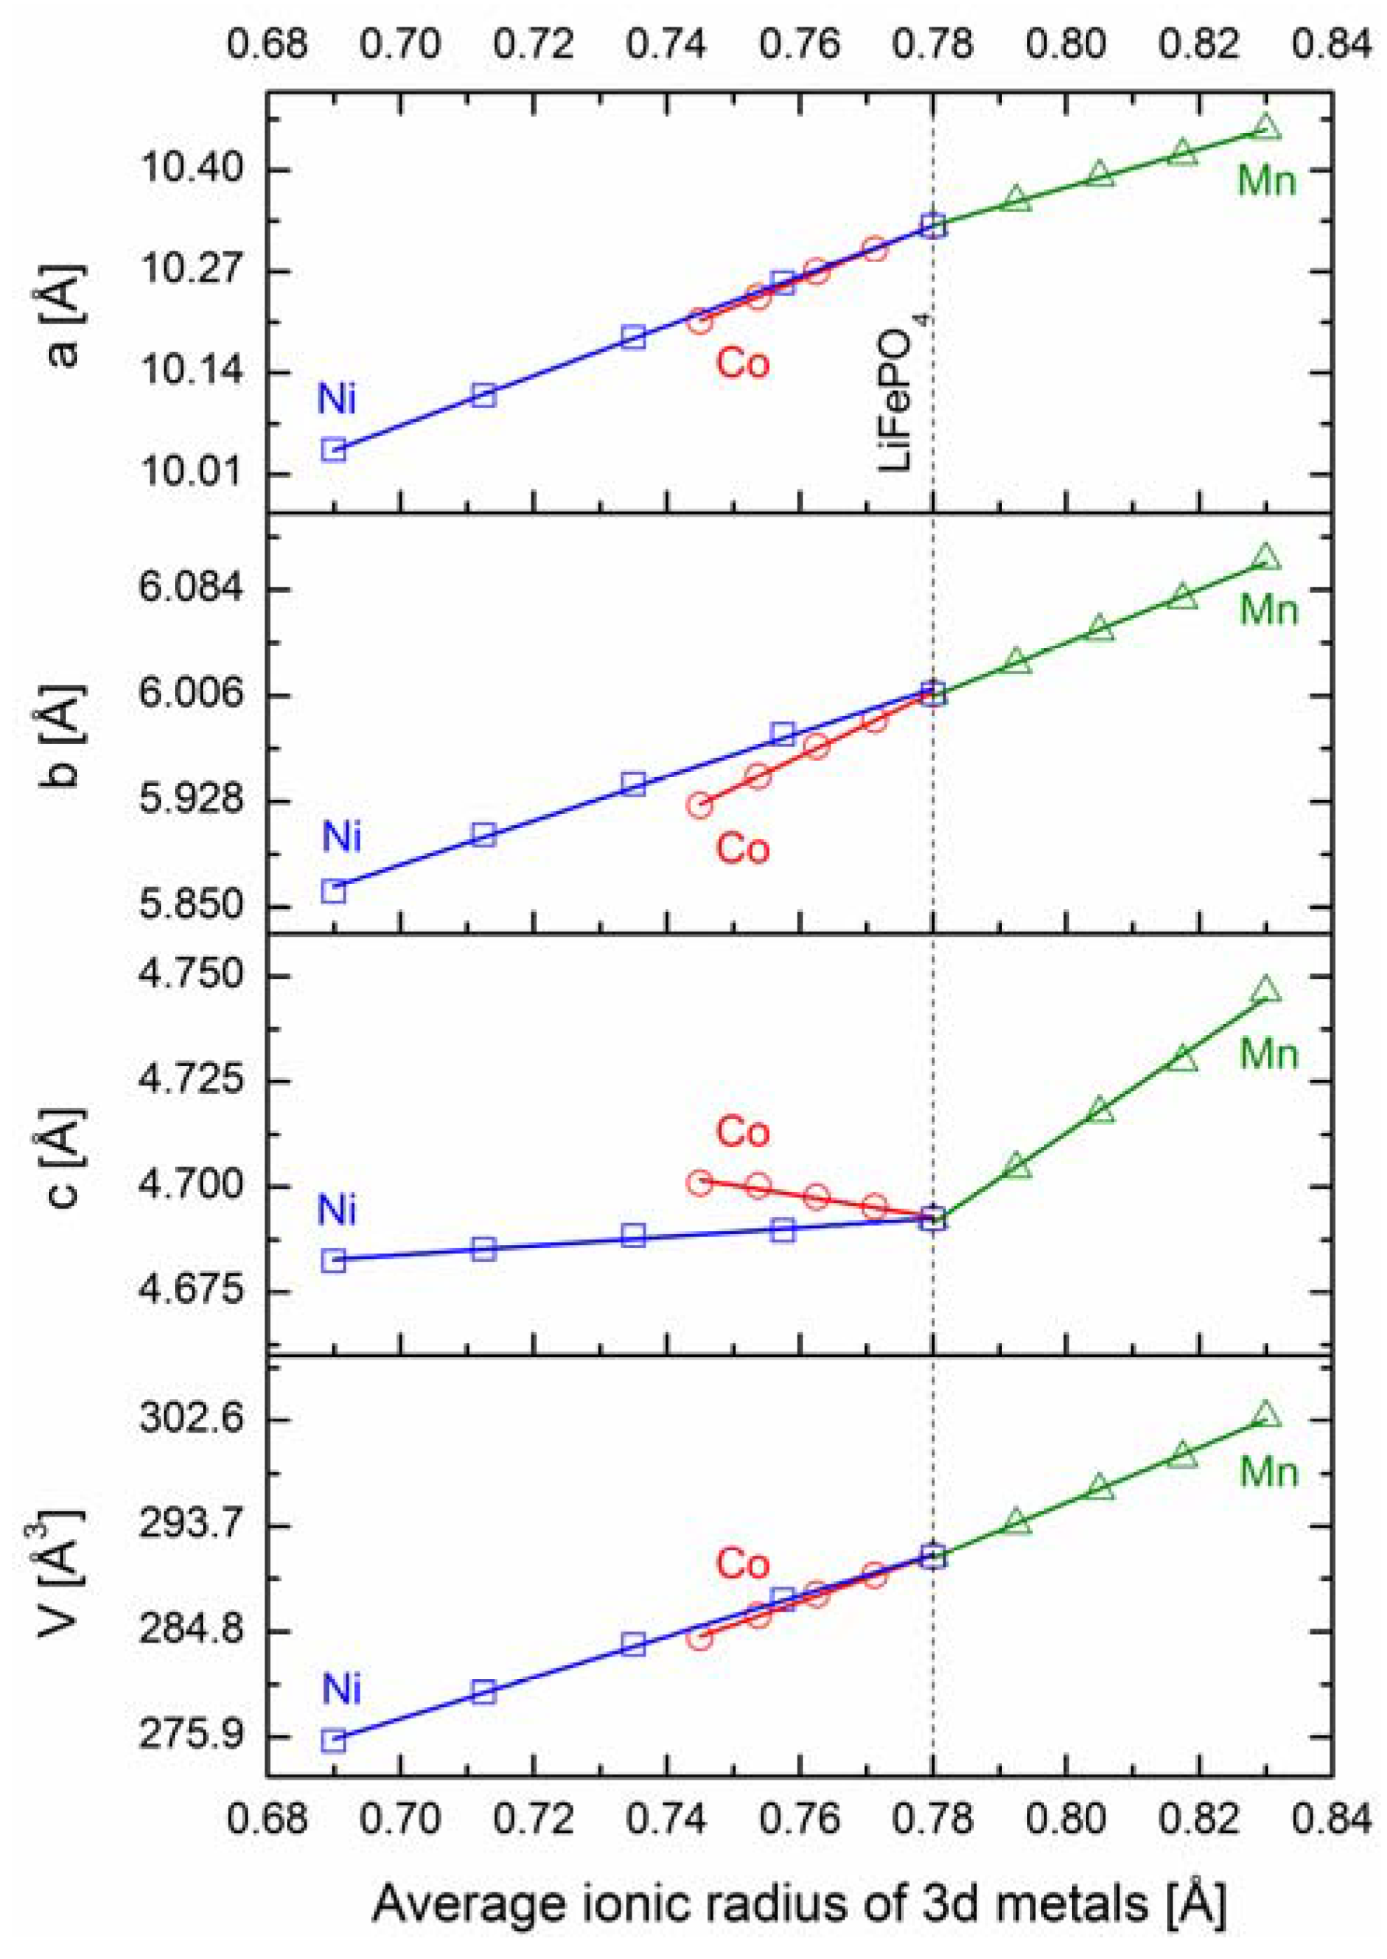
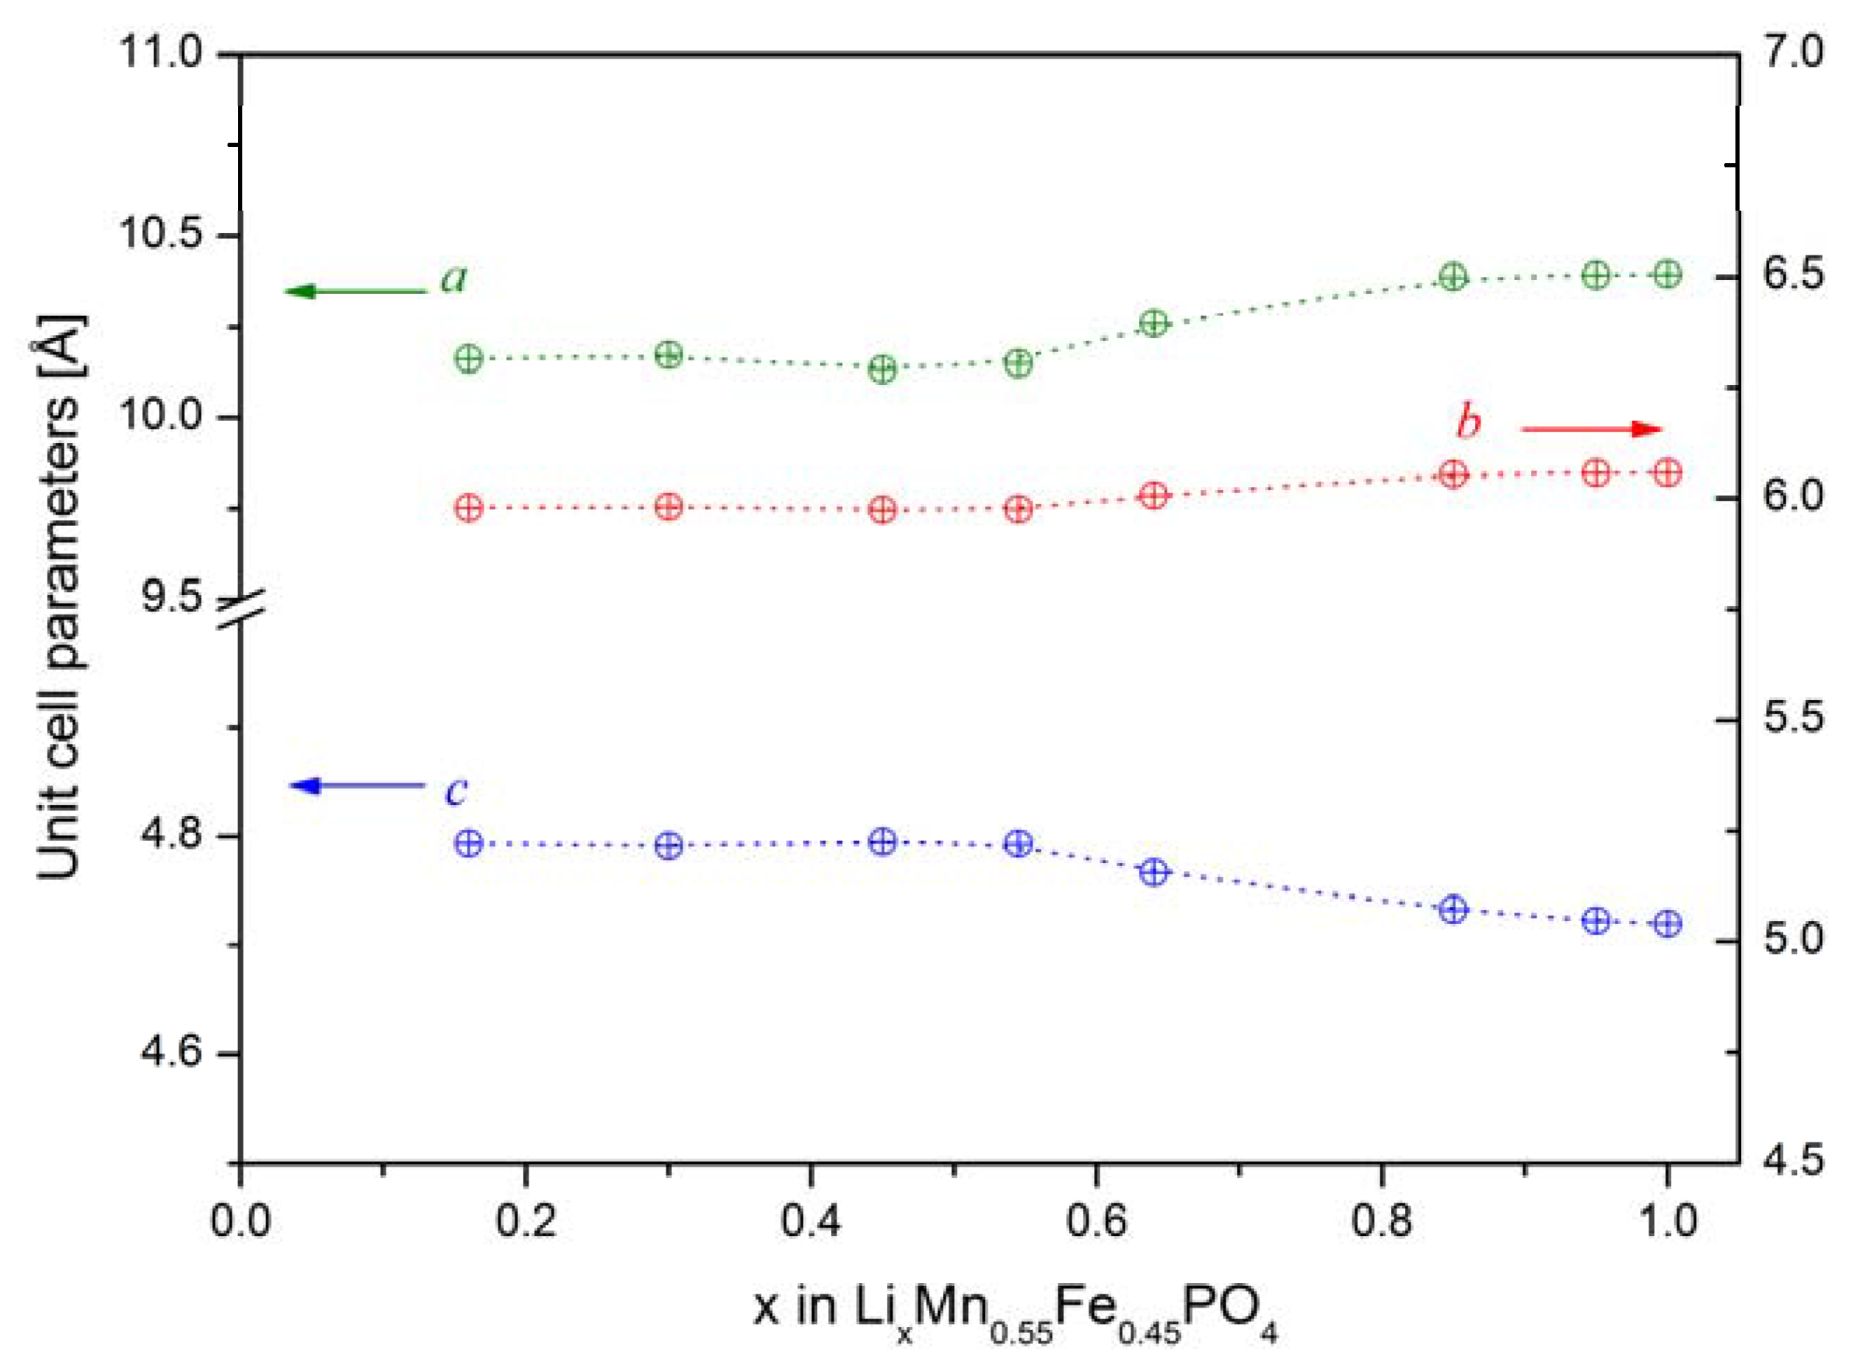
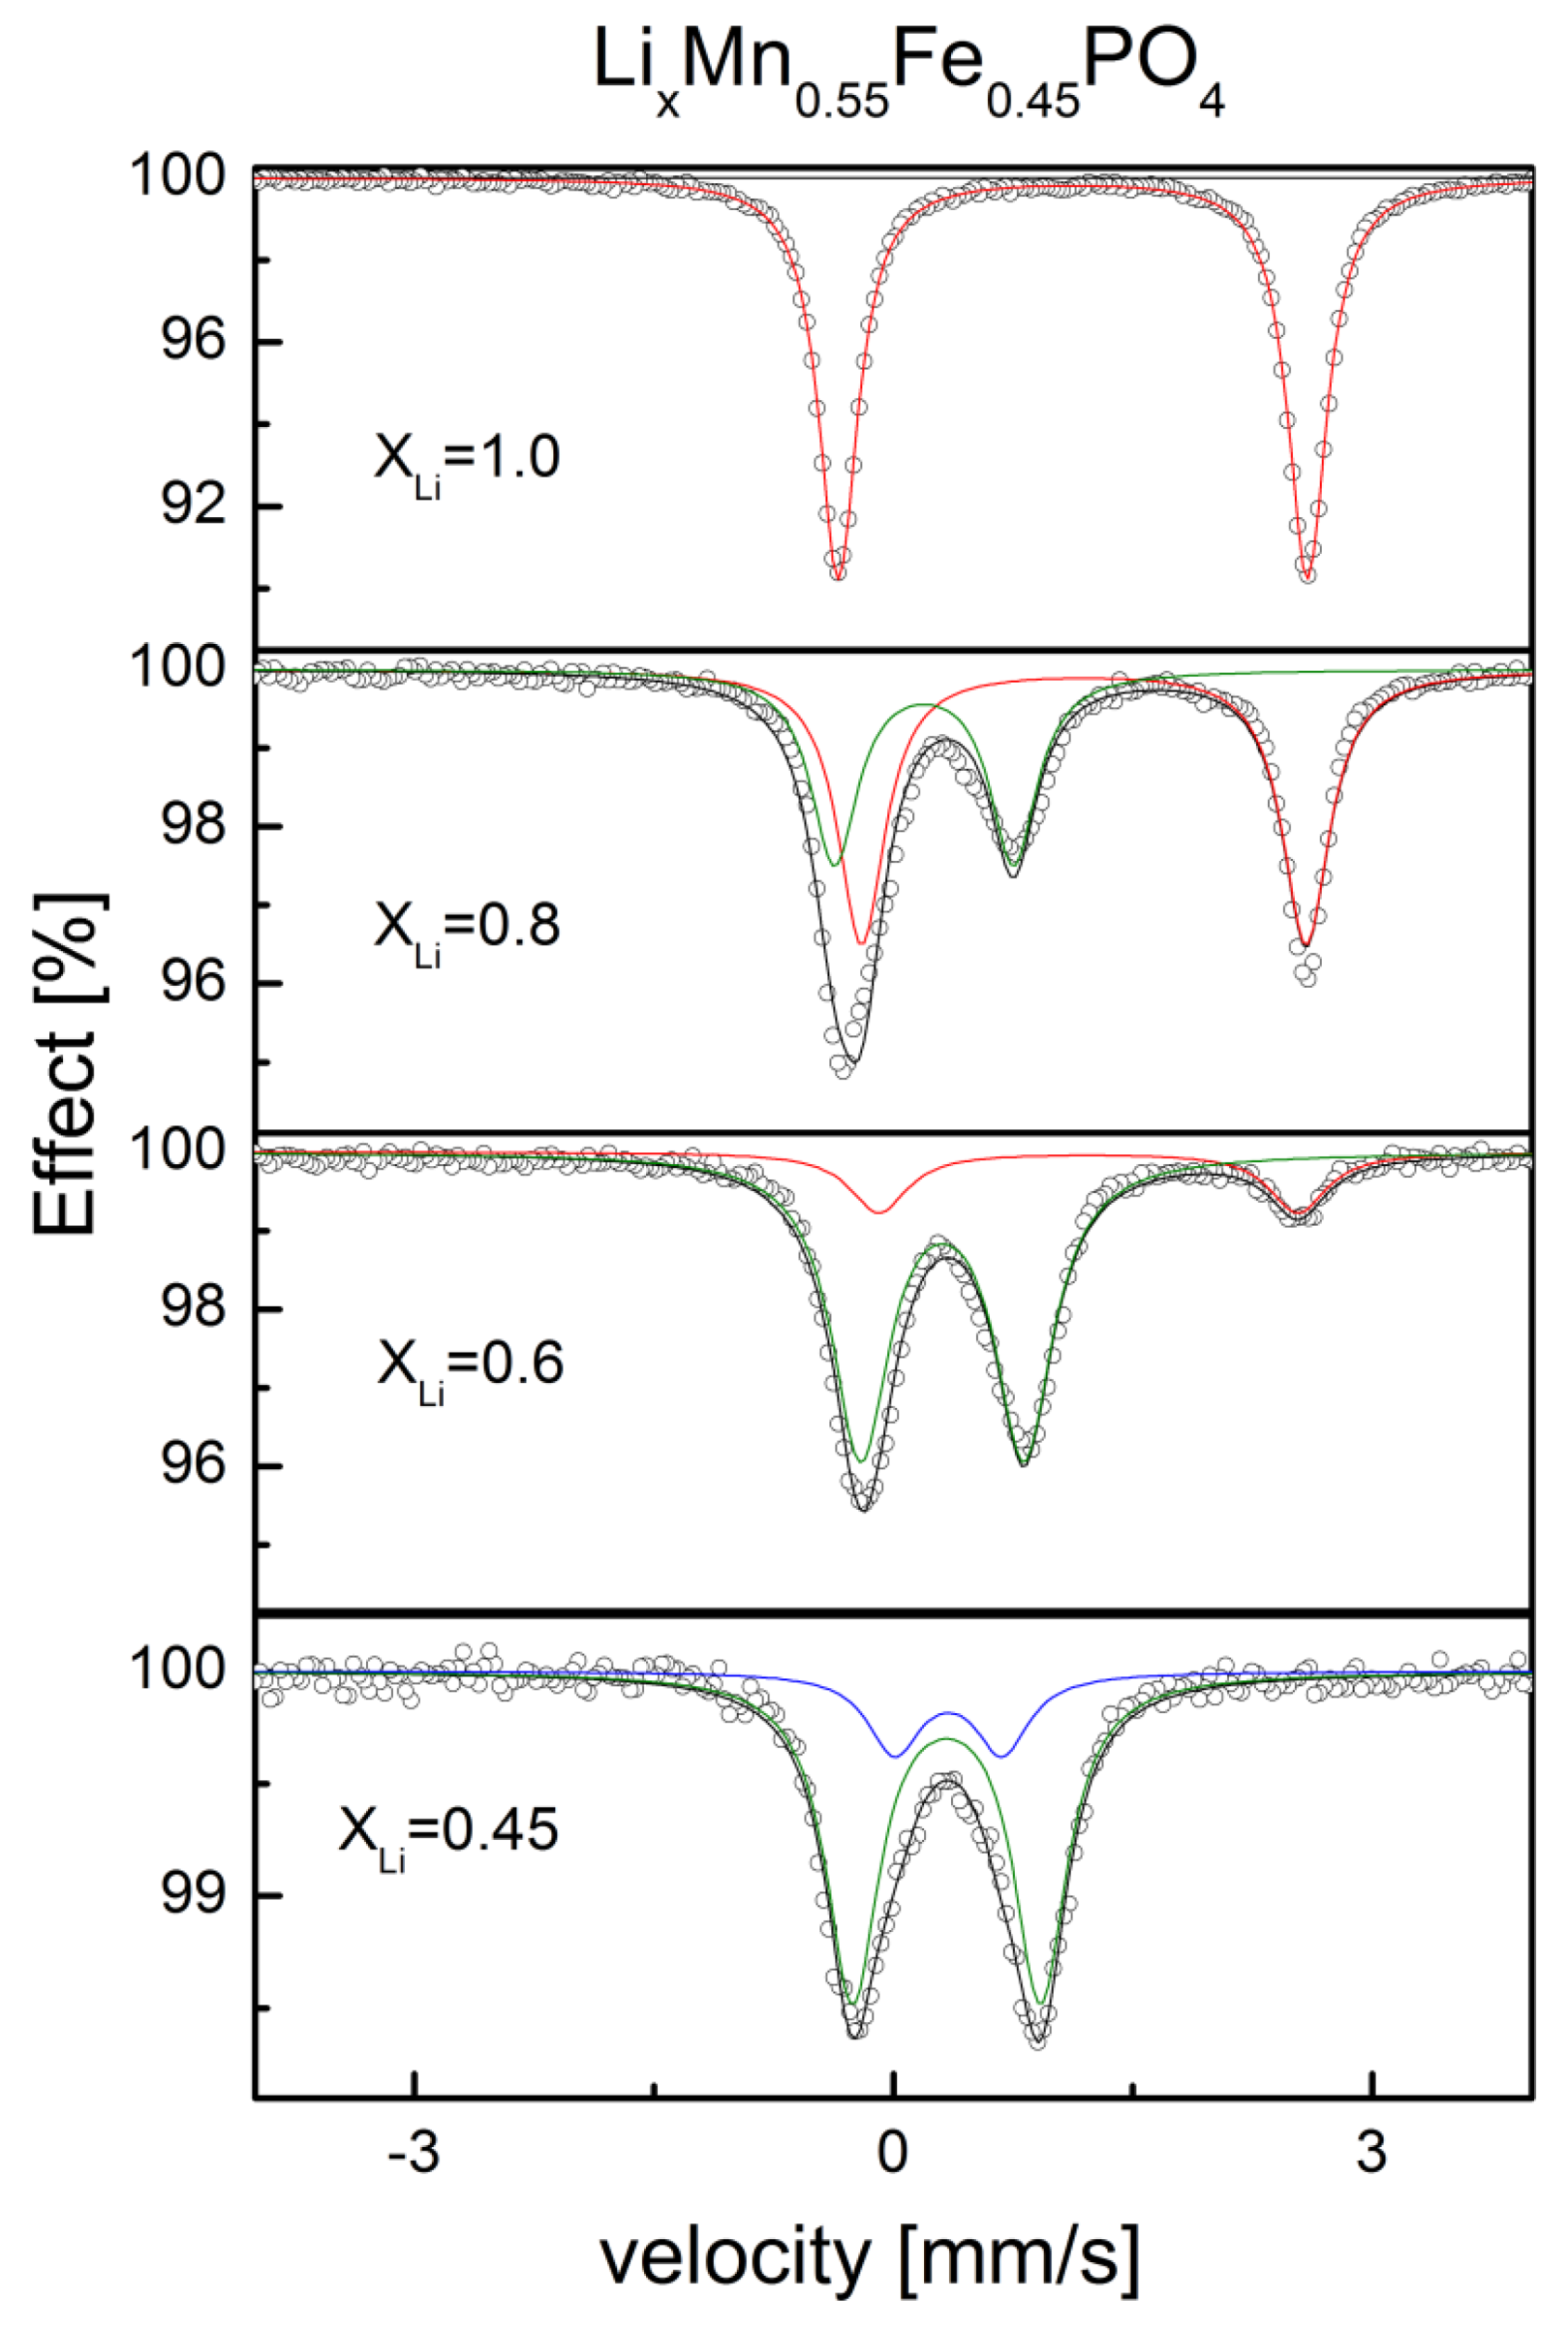
2.2.1. Structural Properties

Figure 17 shows the dependence of unit cell parameters a, b and c, as well as the unit cell volume V of studied LiFe1−yMyPO4 (M = Mn, Co, Ni) materials as a function of average ionic radius of 3d metal cations Fe1−yMy. The average radius was calculated as the weighted average using Shannon’s ionic radii data for octahedral coordination, assuming +2 valence and high-spin state of 3d metals [50].
Figure 17. Unit cell parameters and volumes for LiFe1−yMyPO4 (M = Mn, Co, Ni) as a function of average ionic radius of Fe1−yMy.
Materials 06 01656 g017
According to Vegard’s law, the observed linear dependence indicates formation of solid solution in the whole range of studied compositions. In all cases, however, a and b parameters behave in a different way to parameter c. This can be justified taking into account two features of phosphoolivine-type crystal structure: stiffness of P–O bonds and placement of PO4 tetrahedra (Figure 1). Along the a-axis this structure can be considered as a layered one, in which layers of MO6 octahedra are connected by PO4 polyanions and lithium cations [1]. Therefore, the thickness of such layers is not dependent on the size of PO4 tetrahedra, which affects only the interlayer distance. As a result, the thickness of these layers and the corresponding unit cell parameter a will change linearly with changes of the average radius of 3d metal cations. However, PO4 tetrahedra may affect the size of MO6 octahedra along the b and c direction. This is caused by the fact that these tetrahedra and octahedra have common edges (along b axis) and vertices (along c axis). Substitution of iron by 3d metals which are too small would cause an unfavorably high decrease of the P–O bong length, which in pristine LiFePO4 is already relatively short, compared to typical values of tetrahedrally coordinated P5+ cation by O2− anions. This effect seems to explain the observed asymmetry between compressive and tensile stresses in the substituted materials. In the case of phosphoolivine substituted by Ni, only a small decrease of the P–O bond length (decrease of parameter c) was observed, while in the case of LiFe1−yMnyPO4, a substantial increase of unit parameter c indicates relaxation of the P–O bond length. For LiFe1−yCoyPO4 materials, parameter c increases unexpectedly, with the increase of cobalt content, as Co2+ cations are smaller, compared to Fe2+. This suggests the existence of some additional interactions.
Substitution of iron by Cu2+ cations is not possible over a wide range of chemical composition. For samples, in which the amount of copper did not exceed 5 mol % no additional phases were detected in the XRD patterns, however, the lack of systematic changes of unit cell parameters suggests that the range of formation of solid solutions is very narrow and does not exceed 1–2 mol %.

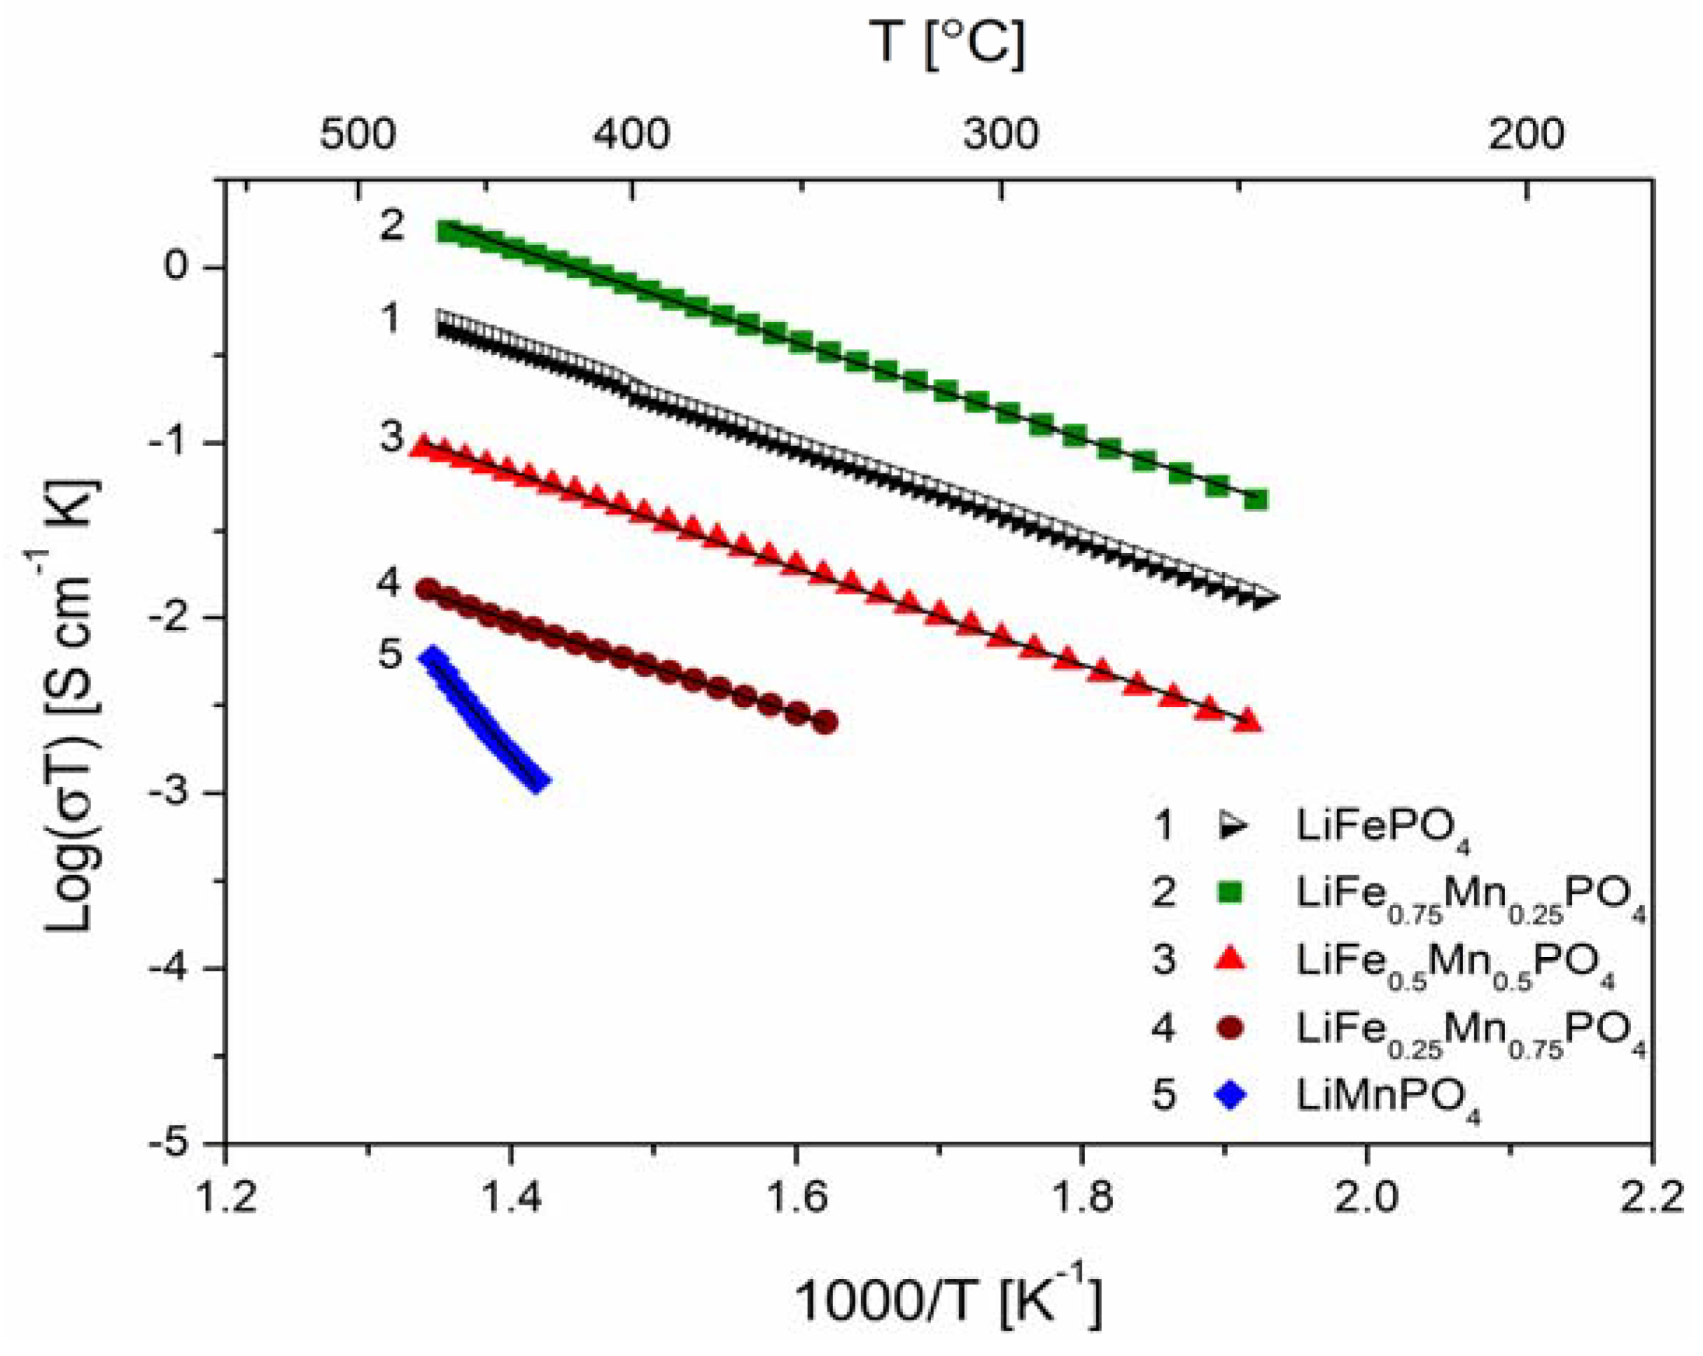
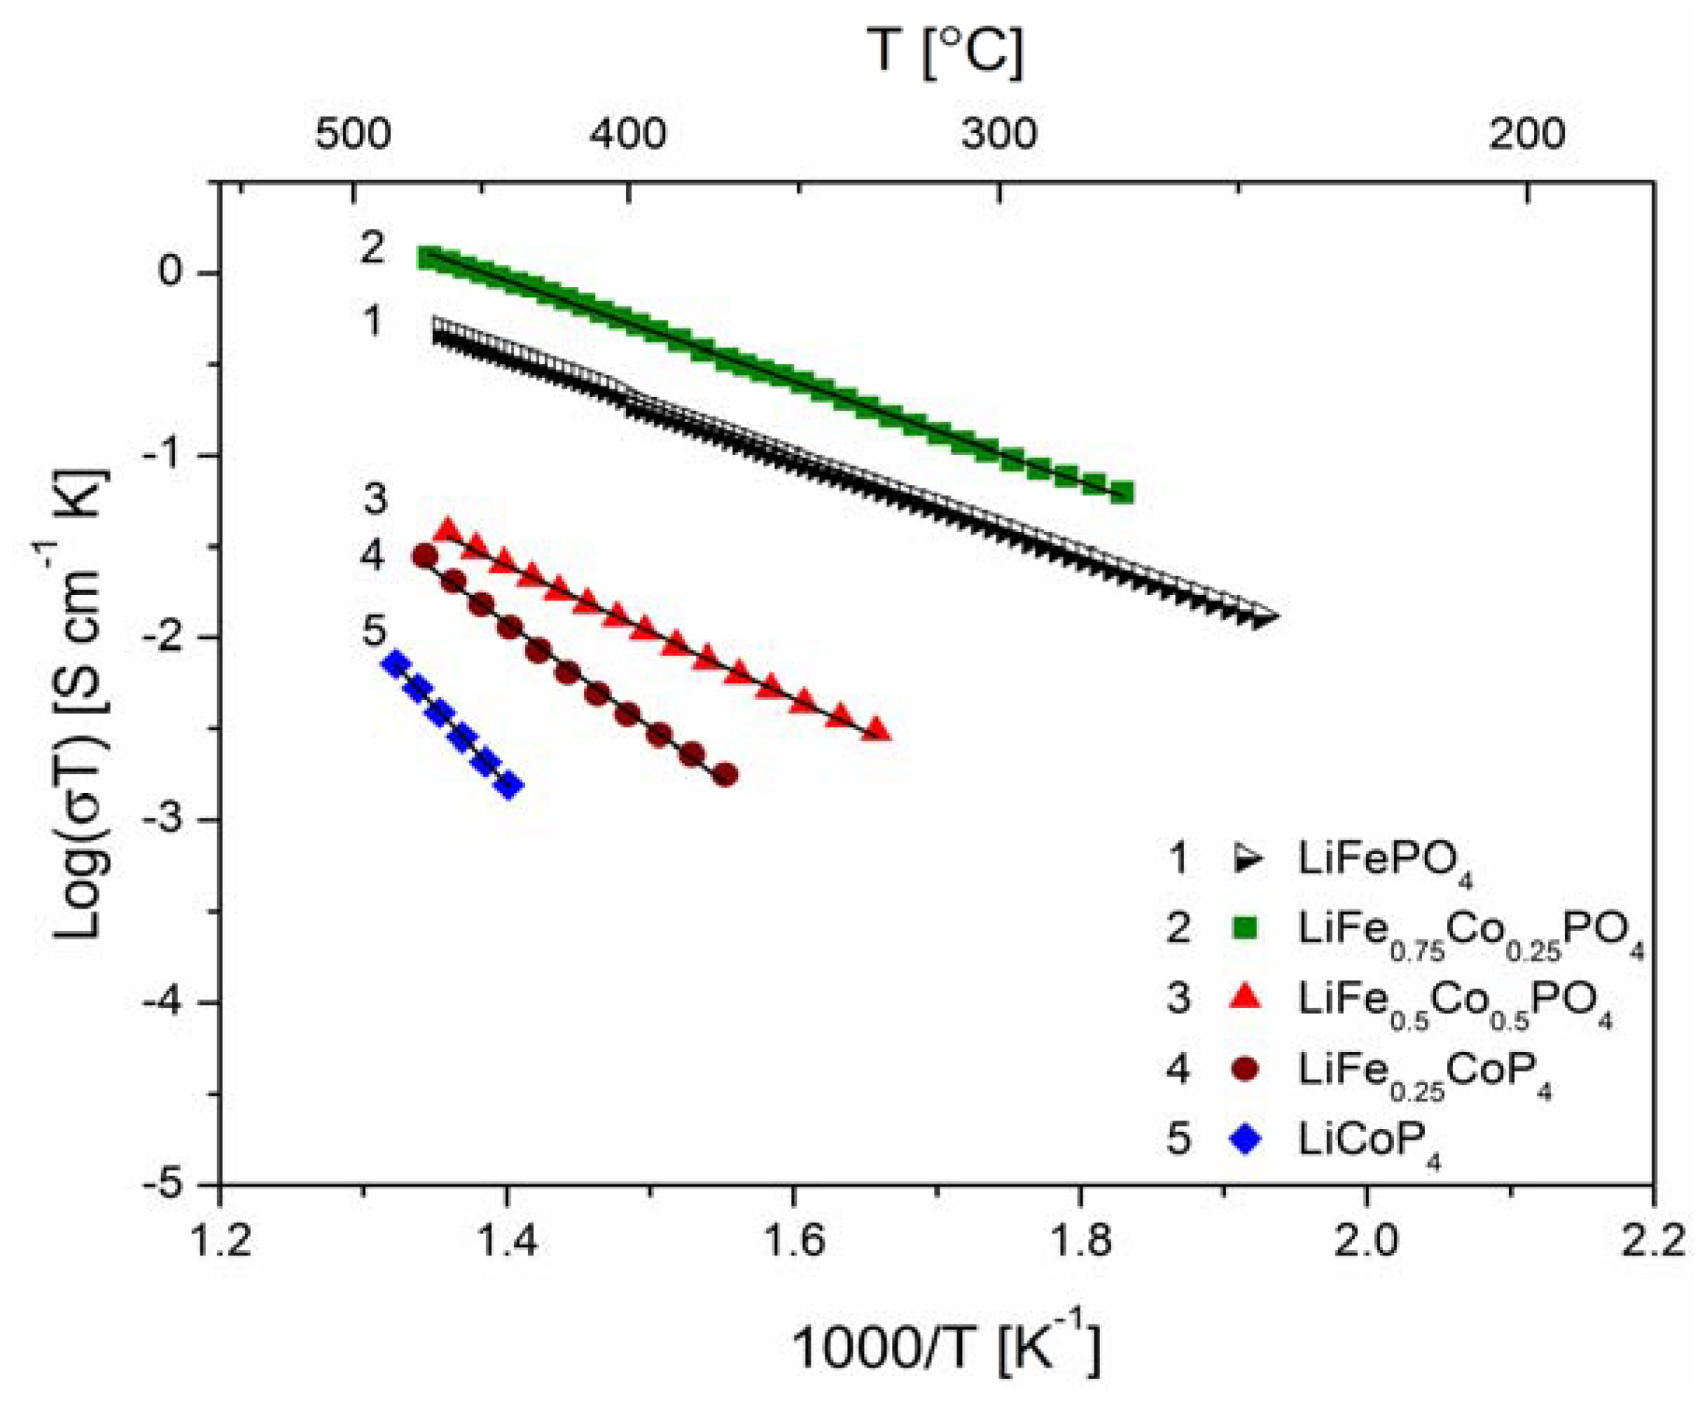
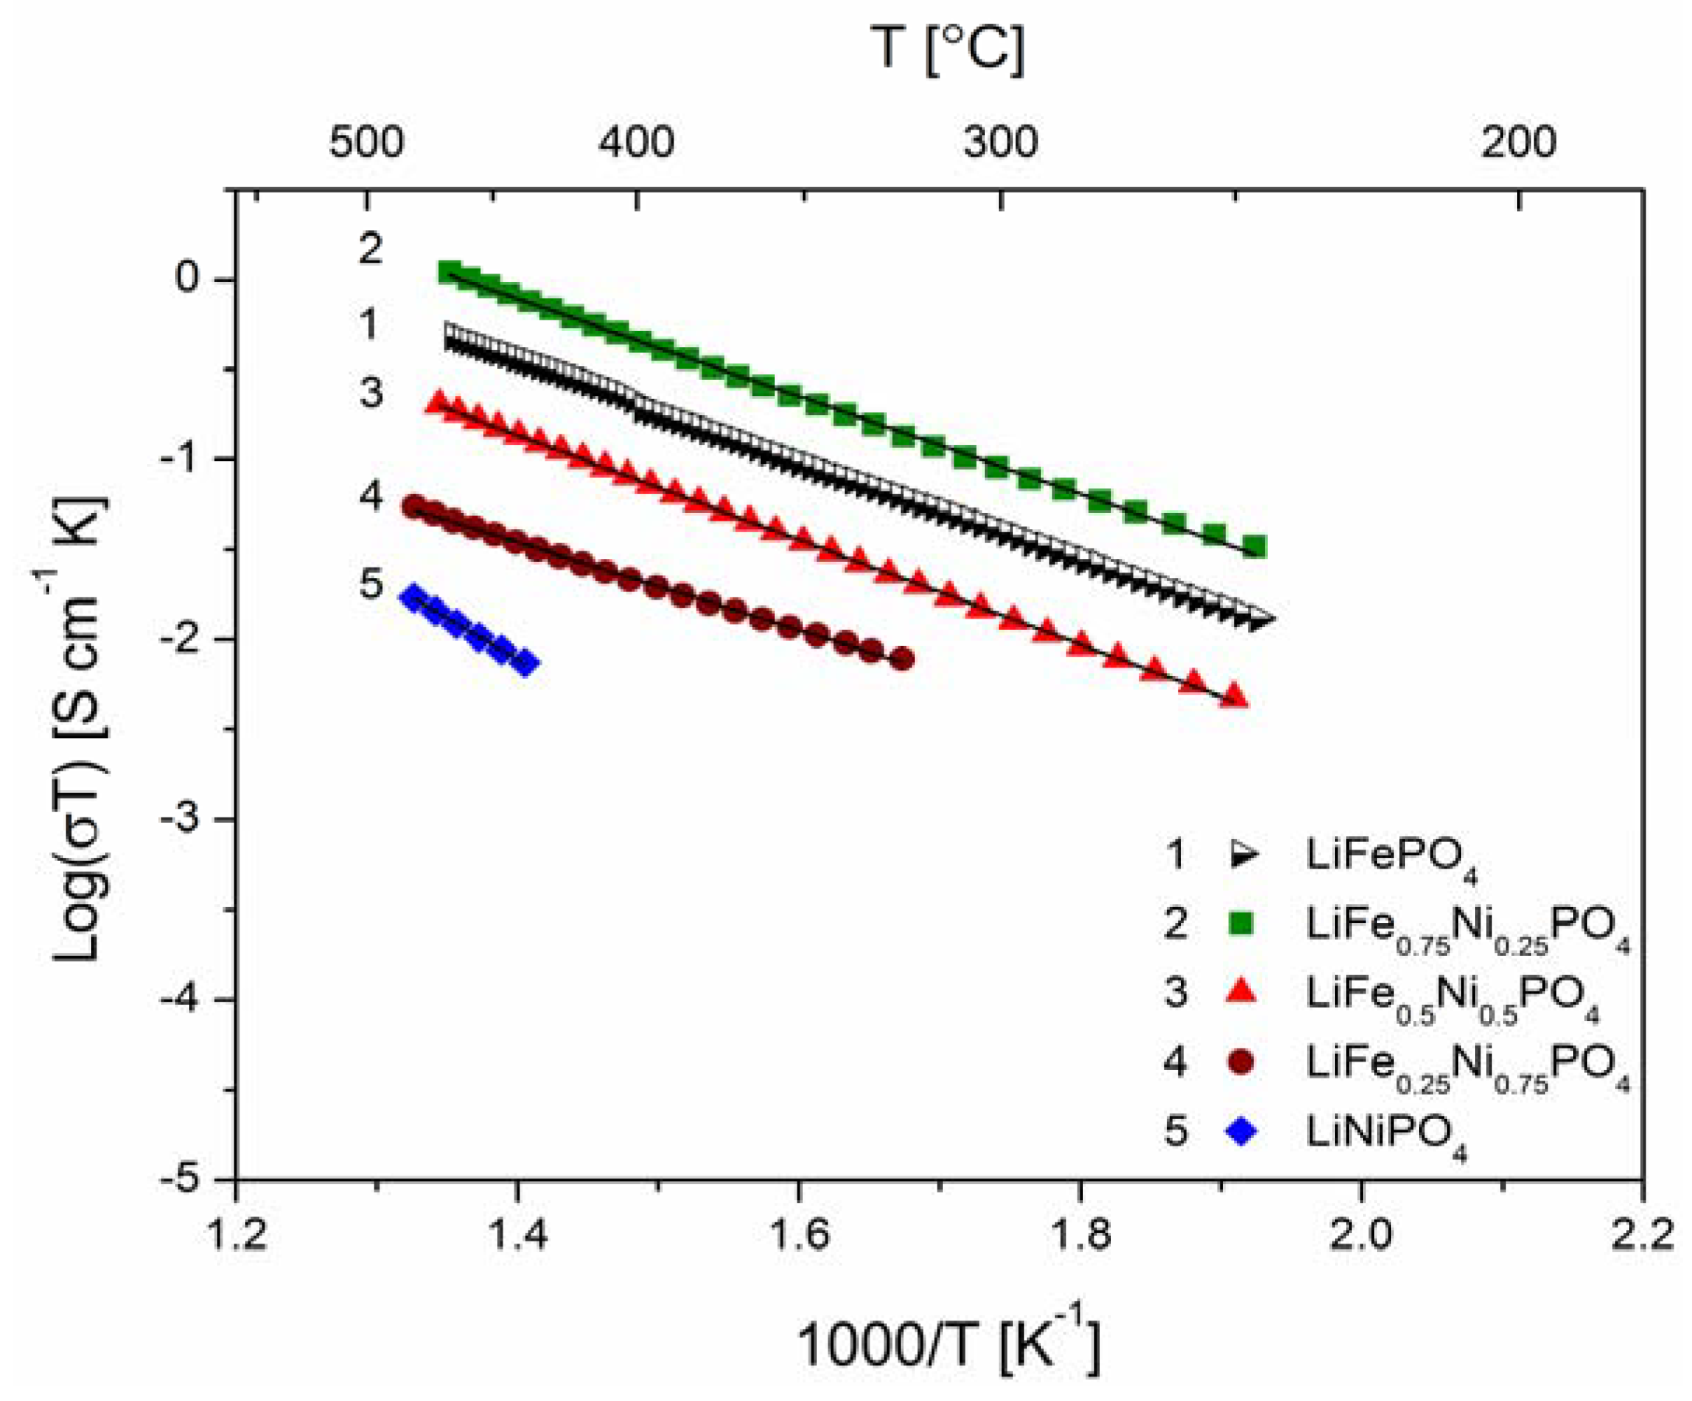
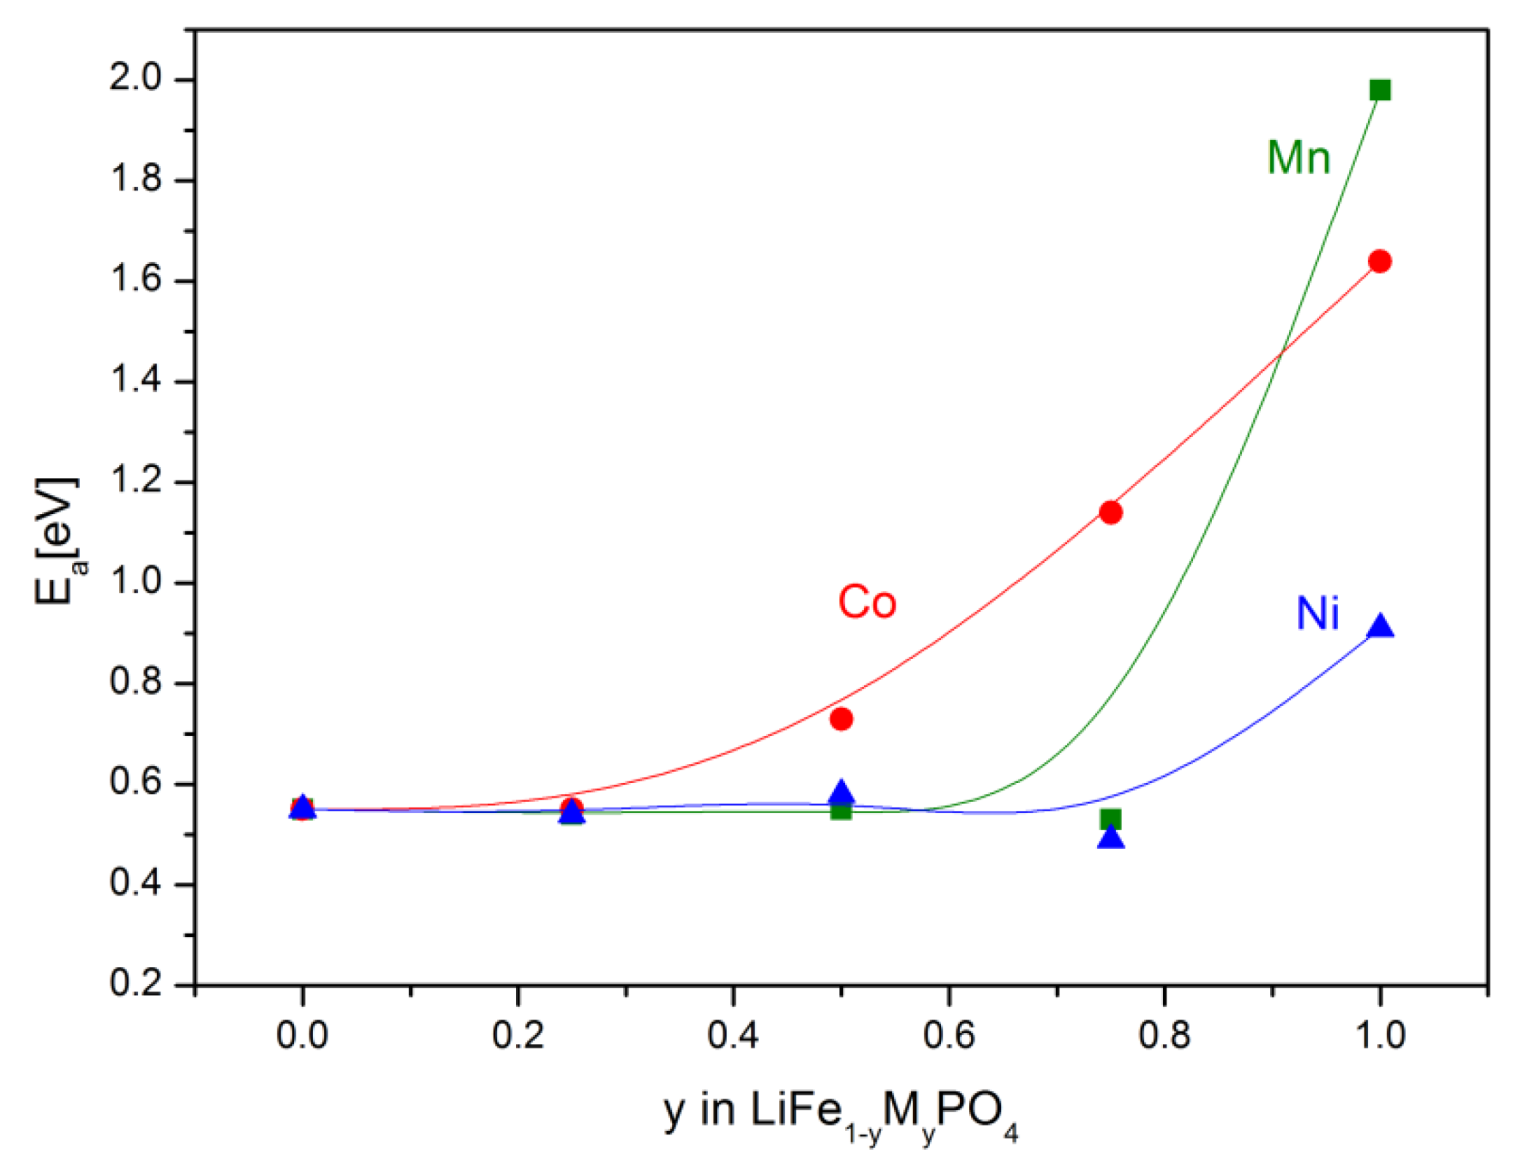
2.2.2. Transport Properties

Figure 18, Figure 19, Figure 20, Figure 22, Figure 23 and Figure 24 show results of the measurements of electrical conductivity and thermoelectric power for phosphoolivines substituted by Mn2+, Co2+ and Ni2+ cations: LiFe1−xMnxPO4, LiFe1−xCoxPO4 and LiFe1−xNixPO4 respectively. For comparison, data for pure LiFePO4 are also presented. Estimated values of the activation energy of electrical conductivity are collated in Figure 21.
Figure 18. Temperature dependence of electrical conductivity of LiFe1−yMnyPO4.
Materials 06 01656 g018
Figure 19. Temperature dependence of electrical conductivity of LiFe1−yCoyPO4.
Materials 06 01656 g019
Figure 20. Temperature dependence of electrical conductivity of LiFe1−yNiyPO4.
Materials 06 01656 g020
The obtained results of electrical conductivity for materials with 0 ≤ y ≤ 1 show that substitution of iron by other 3d metals (Mn2+, Co2+, Ni2+) initially causes a slight increase (half order of magnitude) of the values of σ for samples with y = 0.25, however, for materials with higher substitutions levels a pronounced deterioration of electrical conductivity, up to two orders of magnitude, is observed, with activation energy above 0.8 eV in some cases (Figure 21).
Figure 21. Chemical composition dependence of activation energy of electrical conductivity Ea for LiFe1−yMyPO4 (M = Mn, Co, Ni) olivines.
Materials 06 01656 g021
Figure 22. Temperature dependence of thermoelectric power of Li1−yMnyPO4.
Materials 06 01656 g022
Figure 23. Temperature dependence of thermoelectric power of LiFe1−yCoyPO4.
Materials 06 01656 g023
Figure 24. Temperature dependence of thermoelectric power of LiFe1−yNiyPO4.
Materials 06 01656 g024
Figures 25a,b show the temperature dependence of the ionic and electronic component of the electrical conductivity for phosphoolivine substituted by Mn cations. In the case of LiFe0.45Mn0.55PO4 compound, an increase of electronic component, of the order of one magnitude can be noticed, however, the ionic component remains almost unchanged.
The effect of substitution of iron by other 3d metals (Mn2+, Co2+, Ni2+) on the transport properties of phosphoolivine may be analyzed by taking into account their influence on the electronic structure of the substituted materials and their electrochemical properties in Li/Li+/LixFe1−yMyPO4 cells. Due to a small split of energy of 3d orbitals in the octahedral crystal field in the phosphoolivine structure, all iron and M2+ metals exhibit high-spin configuration [52]. Therefore it may be written that the electronic configuration of these cations is as follows: Mn2+(tg↑)3(eg↑)2, Co2+(tg↑)3(eg↑)2(tg↓)2 and Ni2+(tg↑)3(eg↑)2(tg↓)3. During the electrochemical extraction of lithium from the structure (charging of the battery), in the case of 0 < y < 1, all substituted LixFe1−yMyPO4 phosphoolivines show a 3.5 V potential plateau related to the Fe2+/Fe3+ redox pair, as well as a second one related to the M2+/M3+ pair. For samples with y = 1 (end-members) the potential plateaux are equal to 4.1 V, 4.8 V and 5.1 V, respectively for Mn2+/Mn3+, Co2+/Co3+ and Ni2+/Ni3+. Exemplary data for the LixFe1−yMnyPO4 series is shown in Figure 26. Therefore, it can be stated that in the case of initial LiFe1−yMyPO4 materials the Fermi level is situated in the vicinity of Fe2+tg↓ energy and the observed change of potential between the two plateaux reflects the change of energy between this level (Fe2+tg↓) and, respectively, the Mn2+eg↑, Co2+tg↓ and Ni2+tg↓ levels. It may be assumed that these electrons originating from Mn2+ , Co2+ and Ni2+ cations are situated deeper on the energy scale, about 1–1.5 eV deeper than the Fermi level, and therefore do not participate in the electrical conduction in the substituted samples. This in turn allows us to draw a general conclusion that in the case of the studied Fe-site substituted materials, the mechanism of magnetic polaron conduction is retained. Only the concentration of Fe2+tg↓ electrons is decreased.
Figure 25. Temperature dependence of electronic and ionic component of electrical conductivity for LiFe1−yMnyPO4 phosphoolivines with y = 0, 0.55 (a) and 0.75 (b). Data taken from [7].
Materials 06 01656 g025
According to a general equation given by Mott [53], electrical conductivity σ is correlated with concentration of polarons, in this case c F e F e · :
σ = c F e F e · ( 1 c F e F e · ) e 2 v e r · k T exp ( 2 β · r )   e x p   ( E a k T )
where β: parameter describing distribution of wave function, r: distance between neighboring Fe sites, ve: frequency of hops, c F e F e · : concentration of charge carriers (holes), e: charge of electron, k: Boltzmann constant, T: temperature.
Equation (2) describes the relationship between thermoelectric power α and the concentration of polarons [54]:
α = k e l n ( c F e F e · 1 c F e F e · + S k )
where S: entropy (S/k < 10 μV K−1)
According to Equation (1), electrical conductivity is dependent on the concentration of effective charge carriers c F e F e · , so a decrease of concentration of Fe2+tg↓ electrons, caused by the substitution of iron by 3d metals, deteriorates the electrical conductivity and increases the values of thermoelectric power.

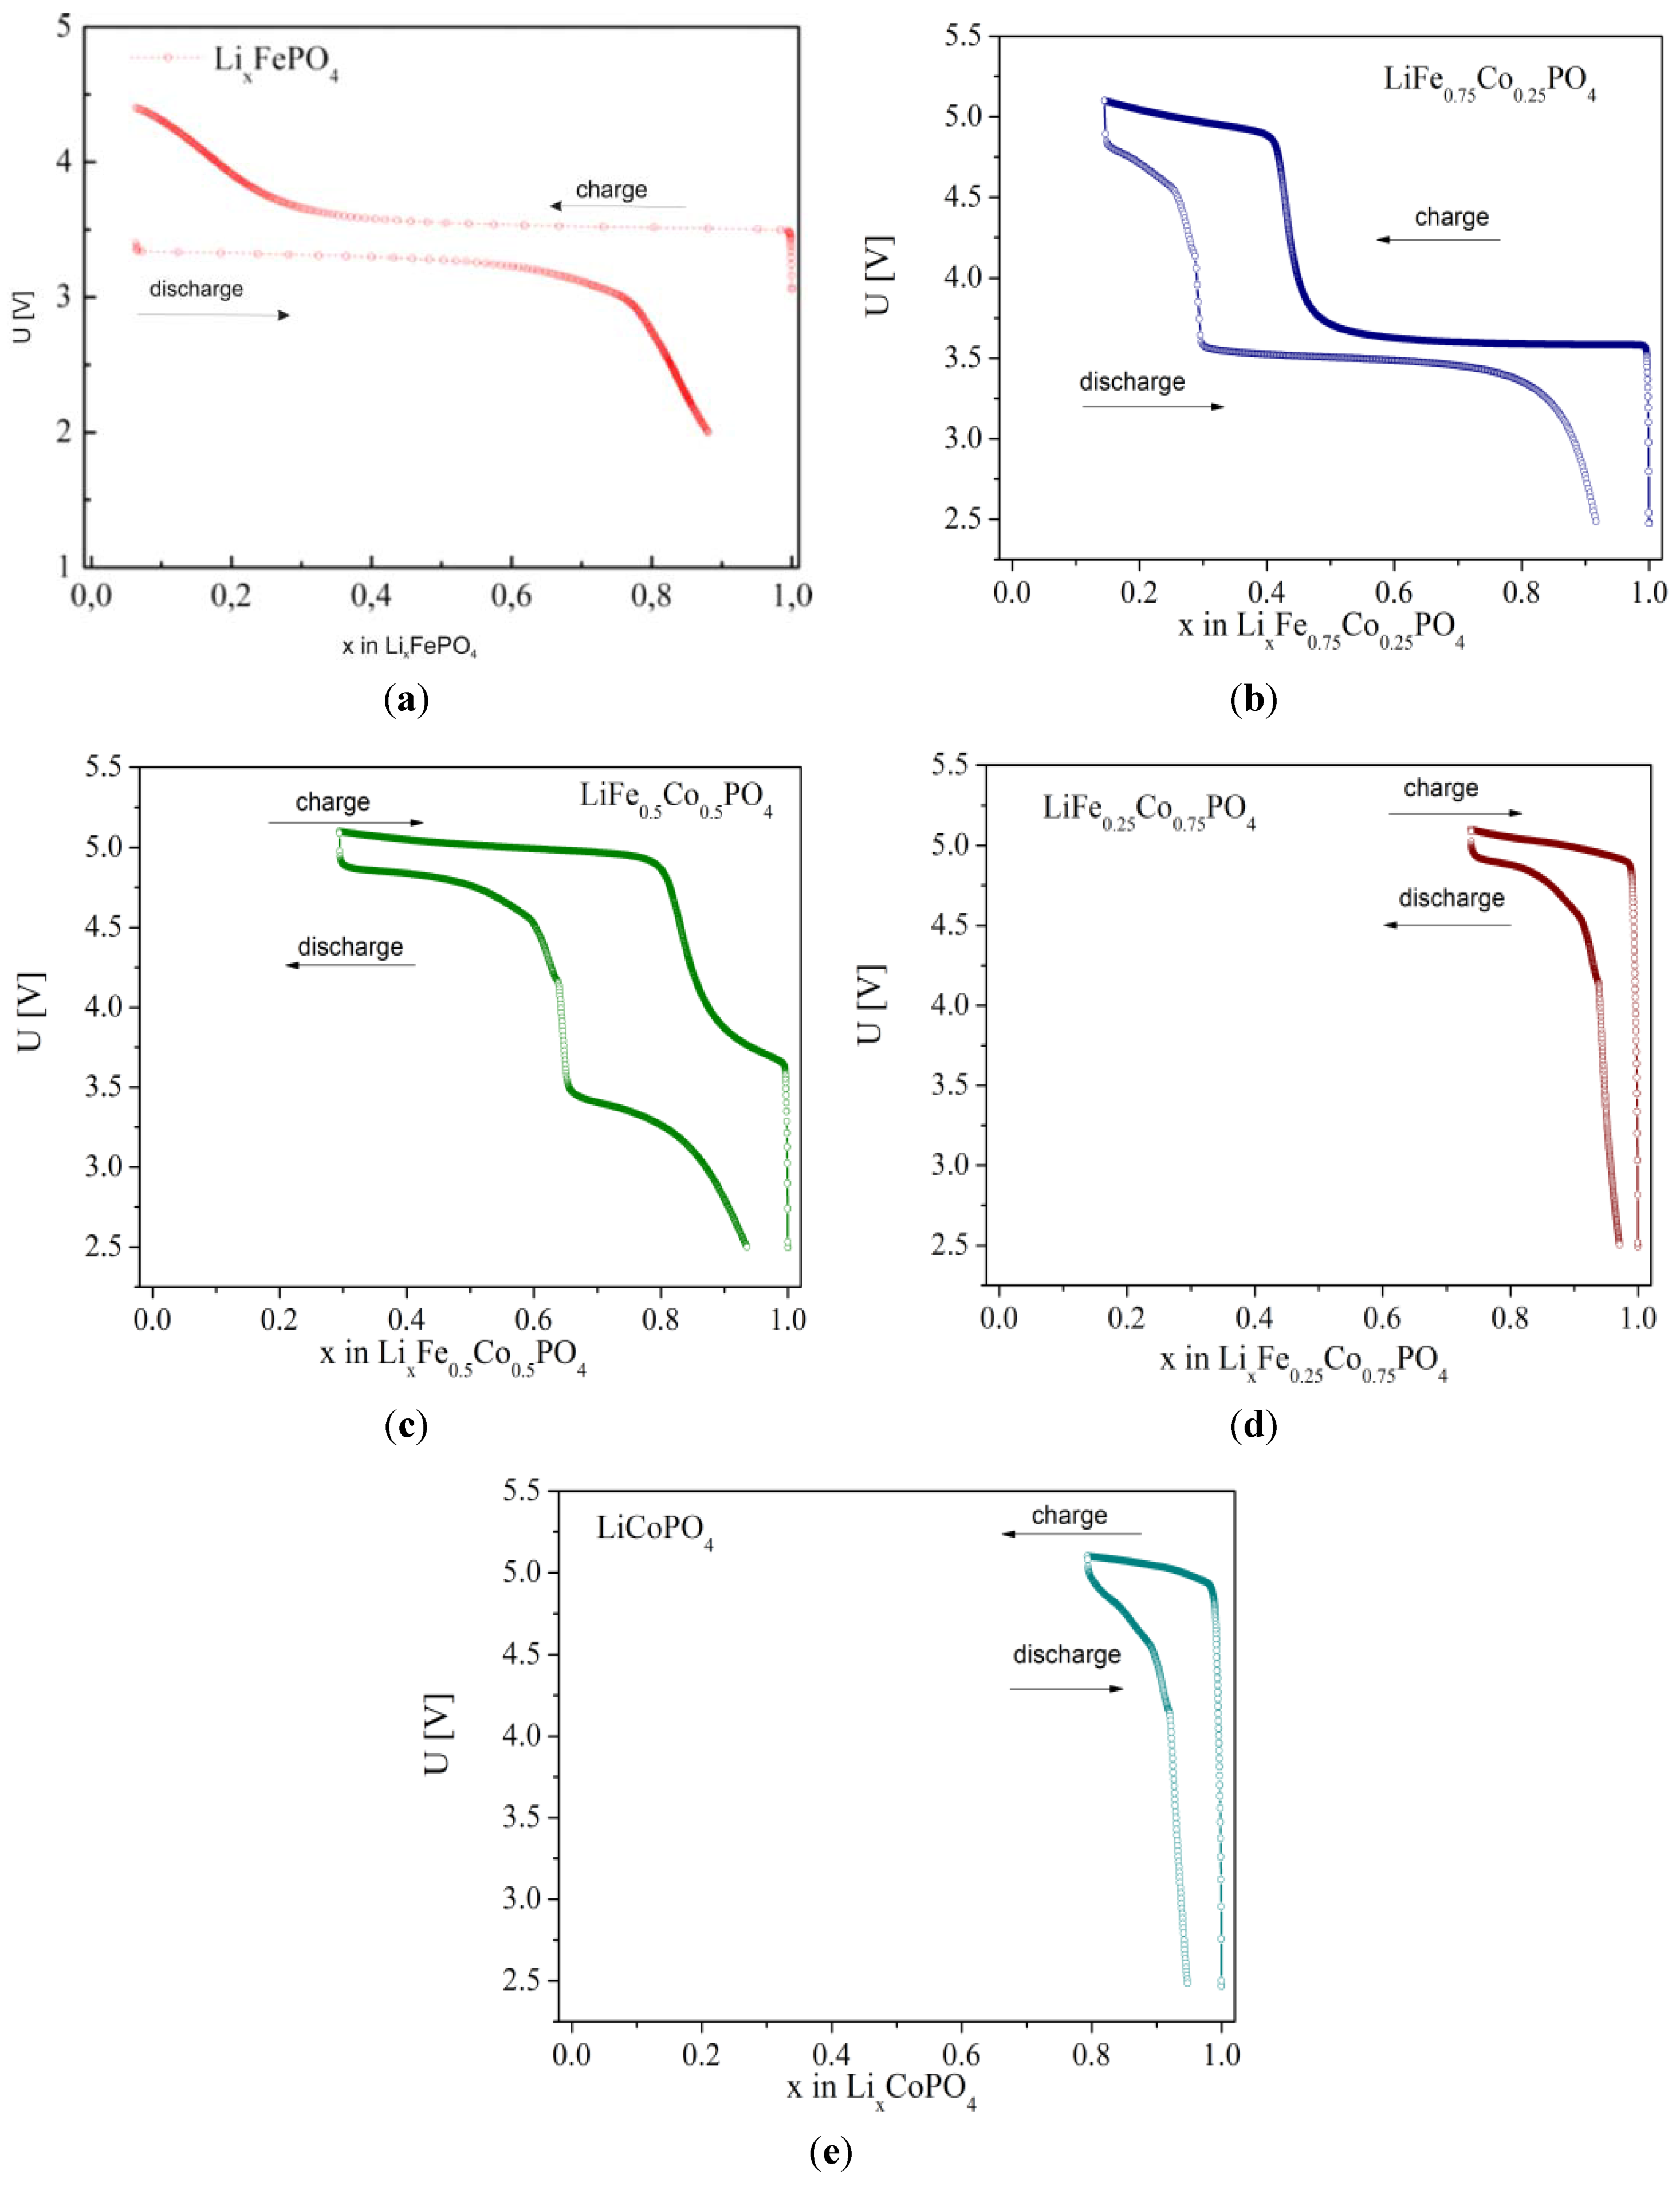
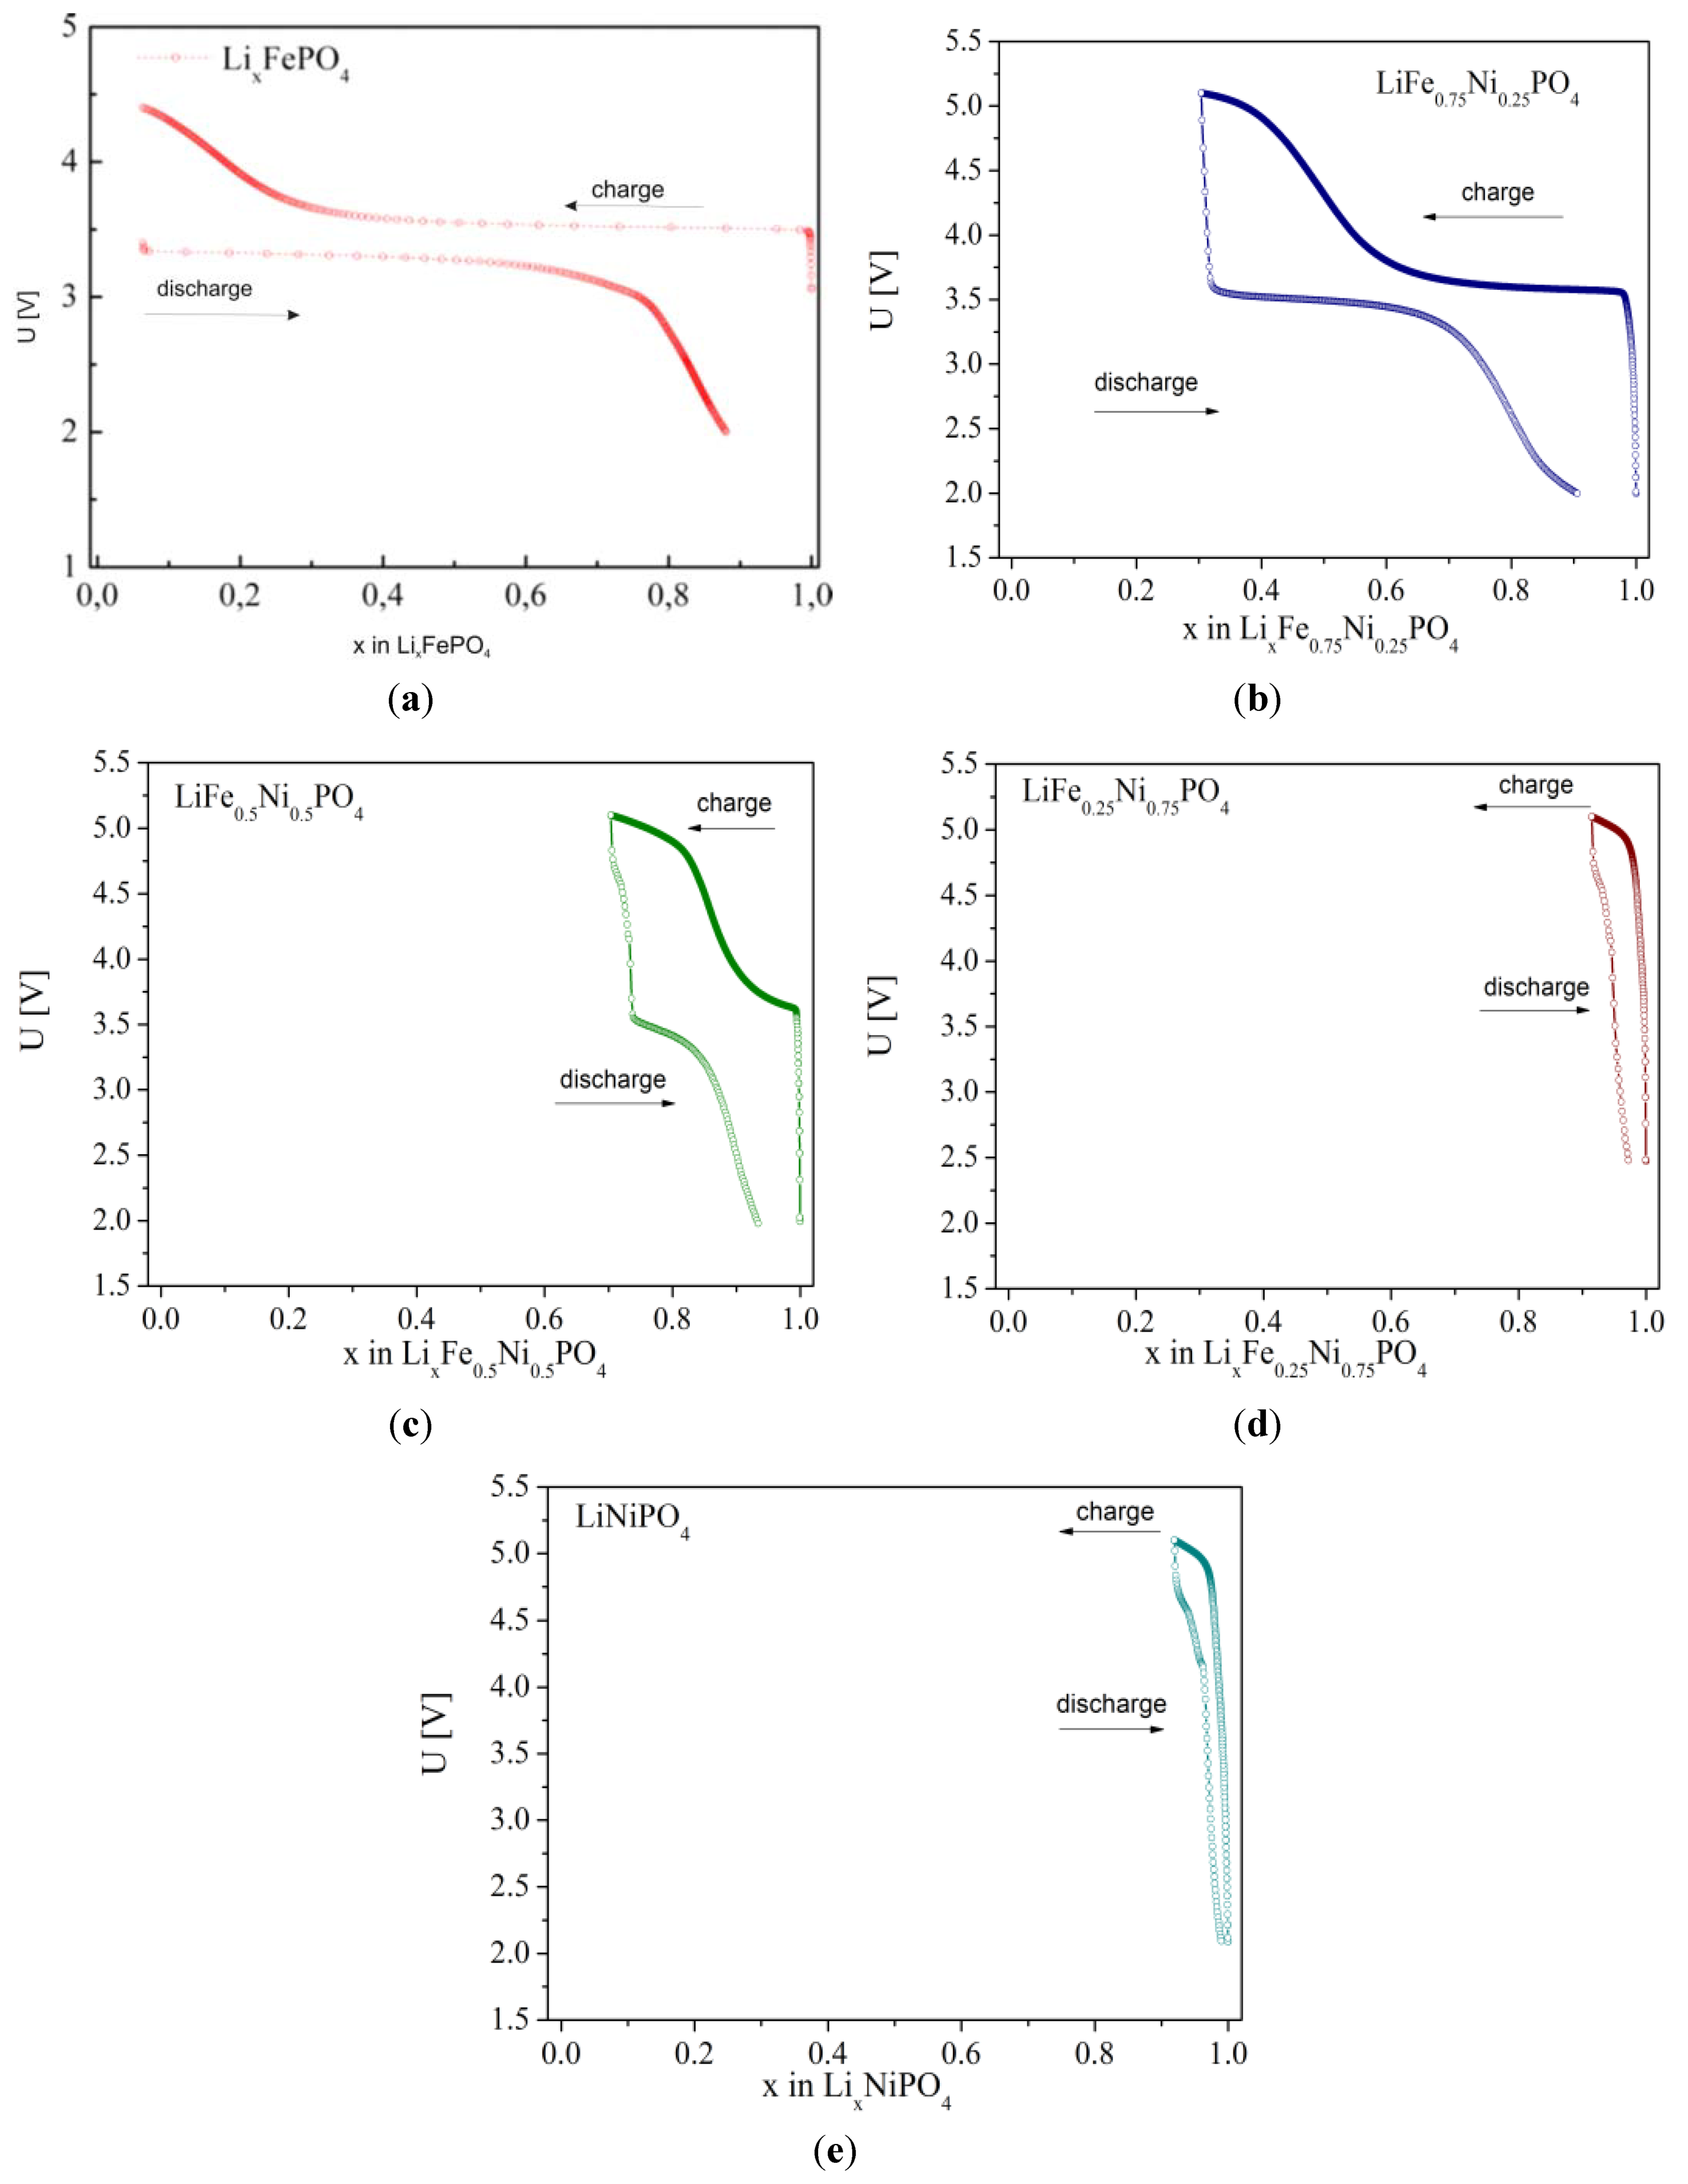
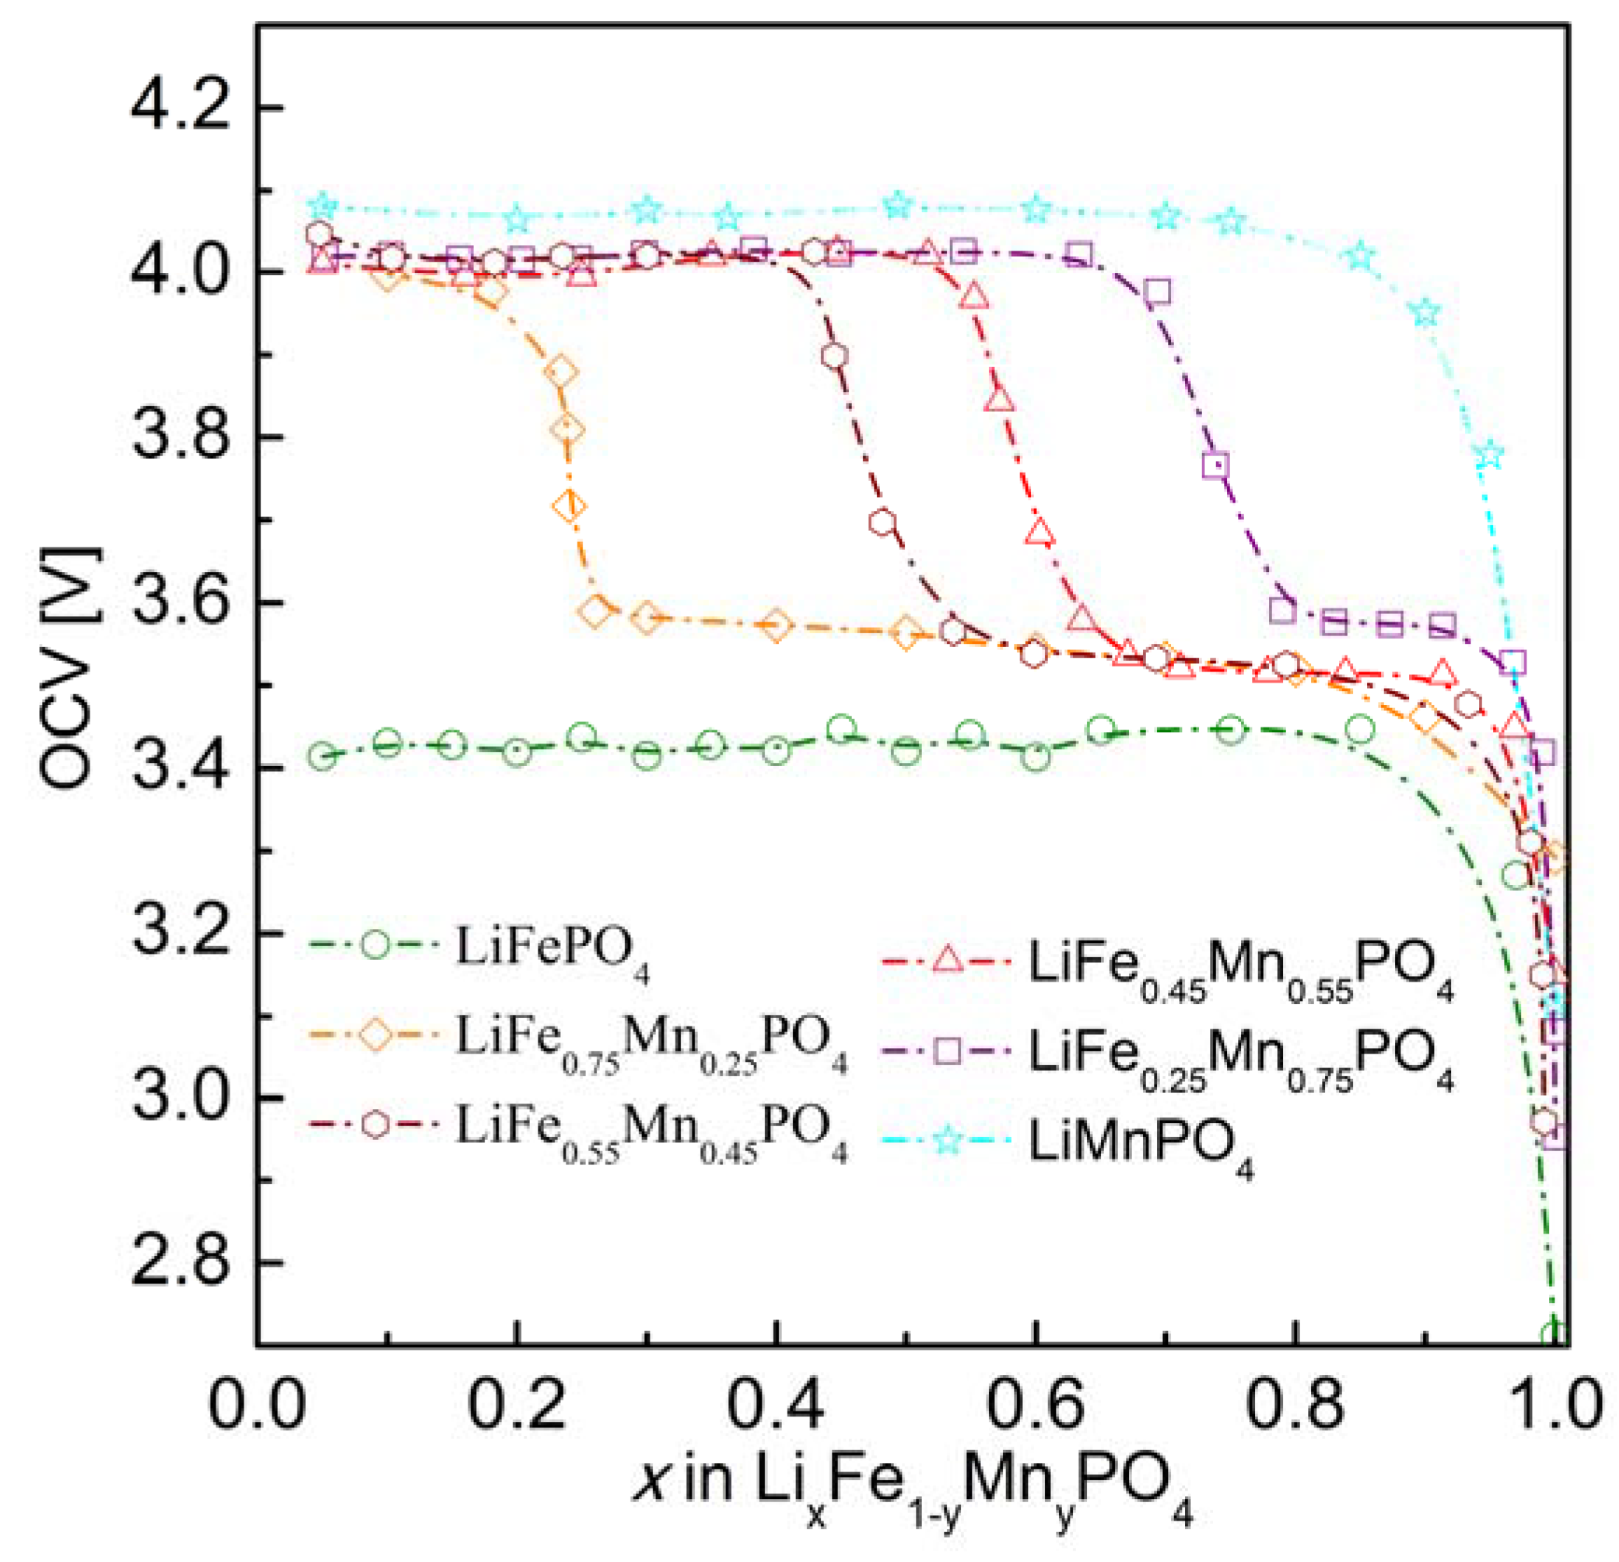
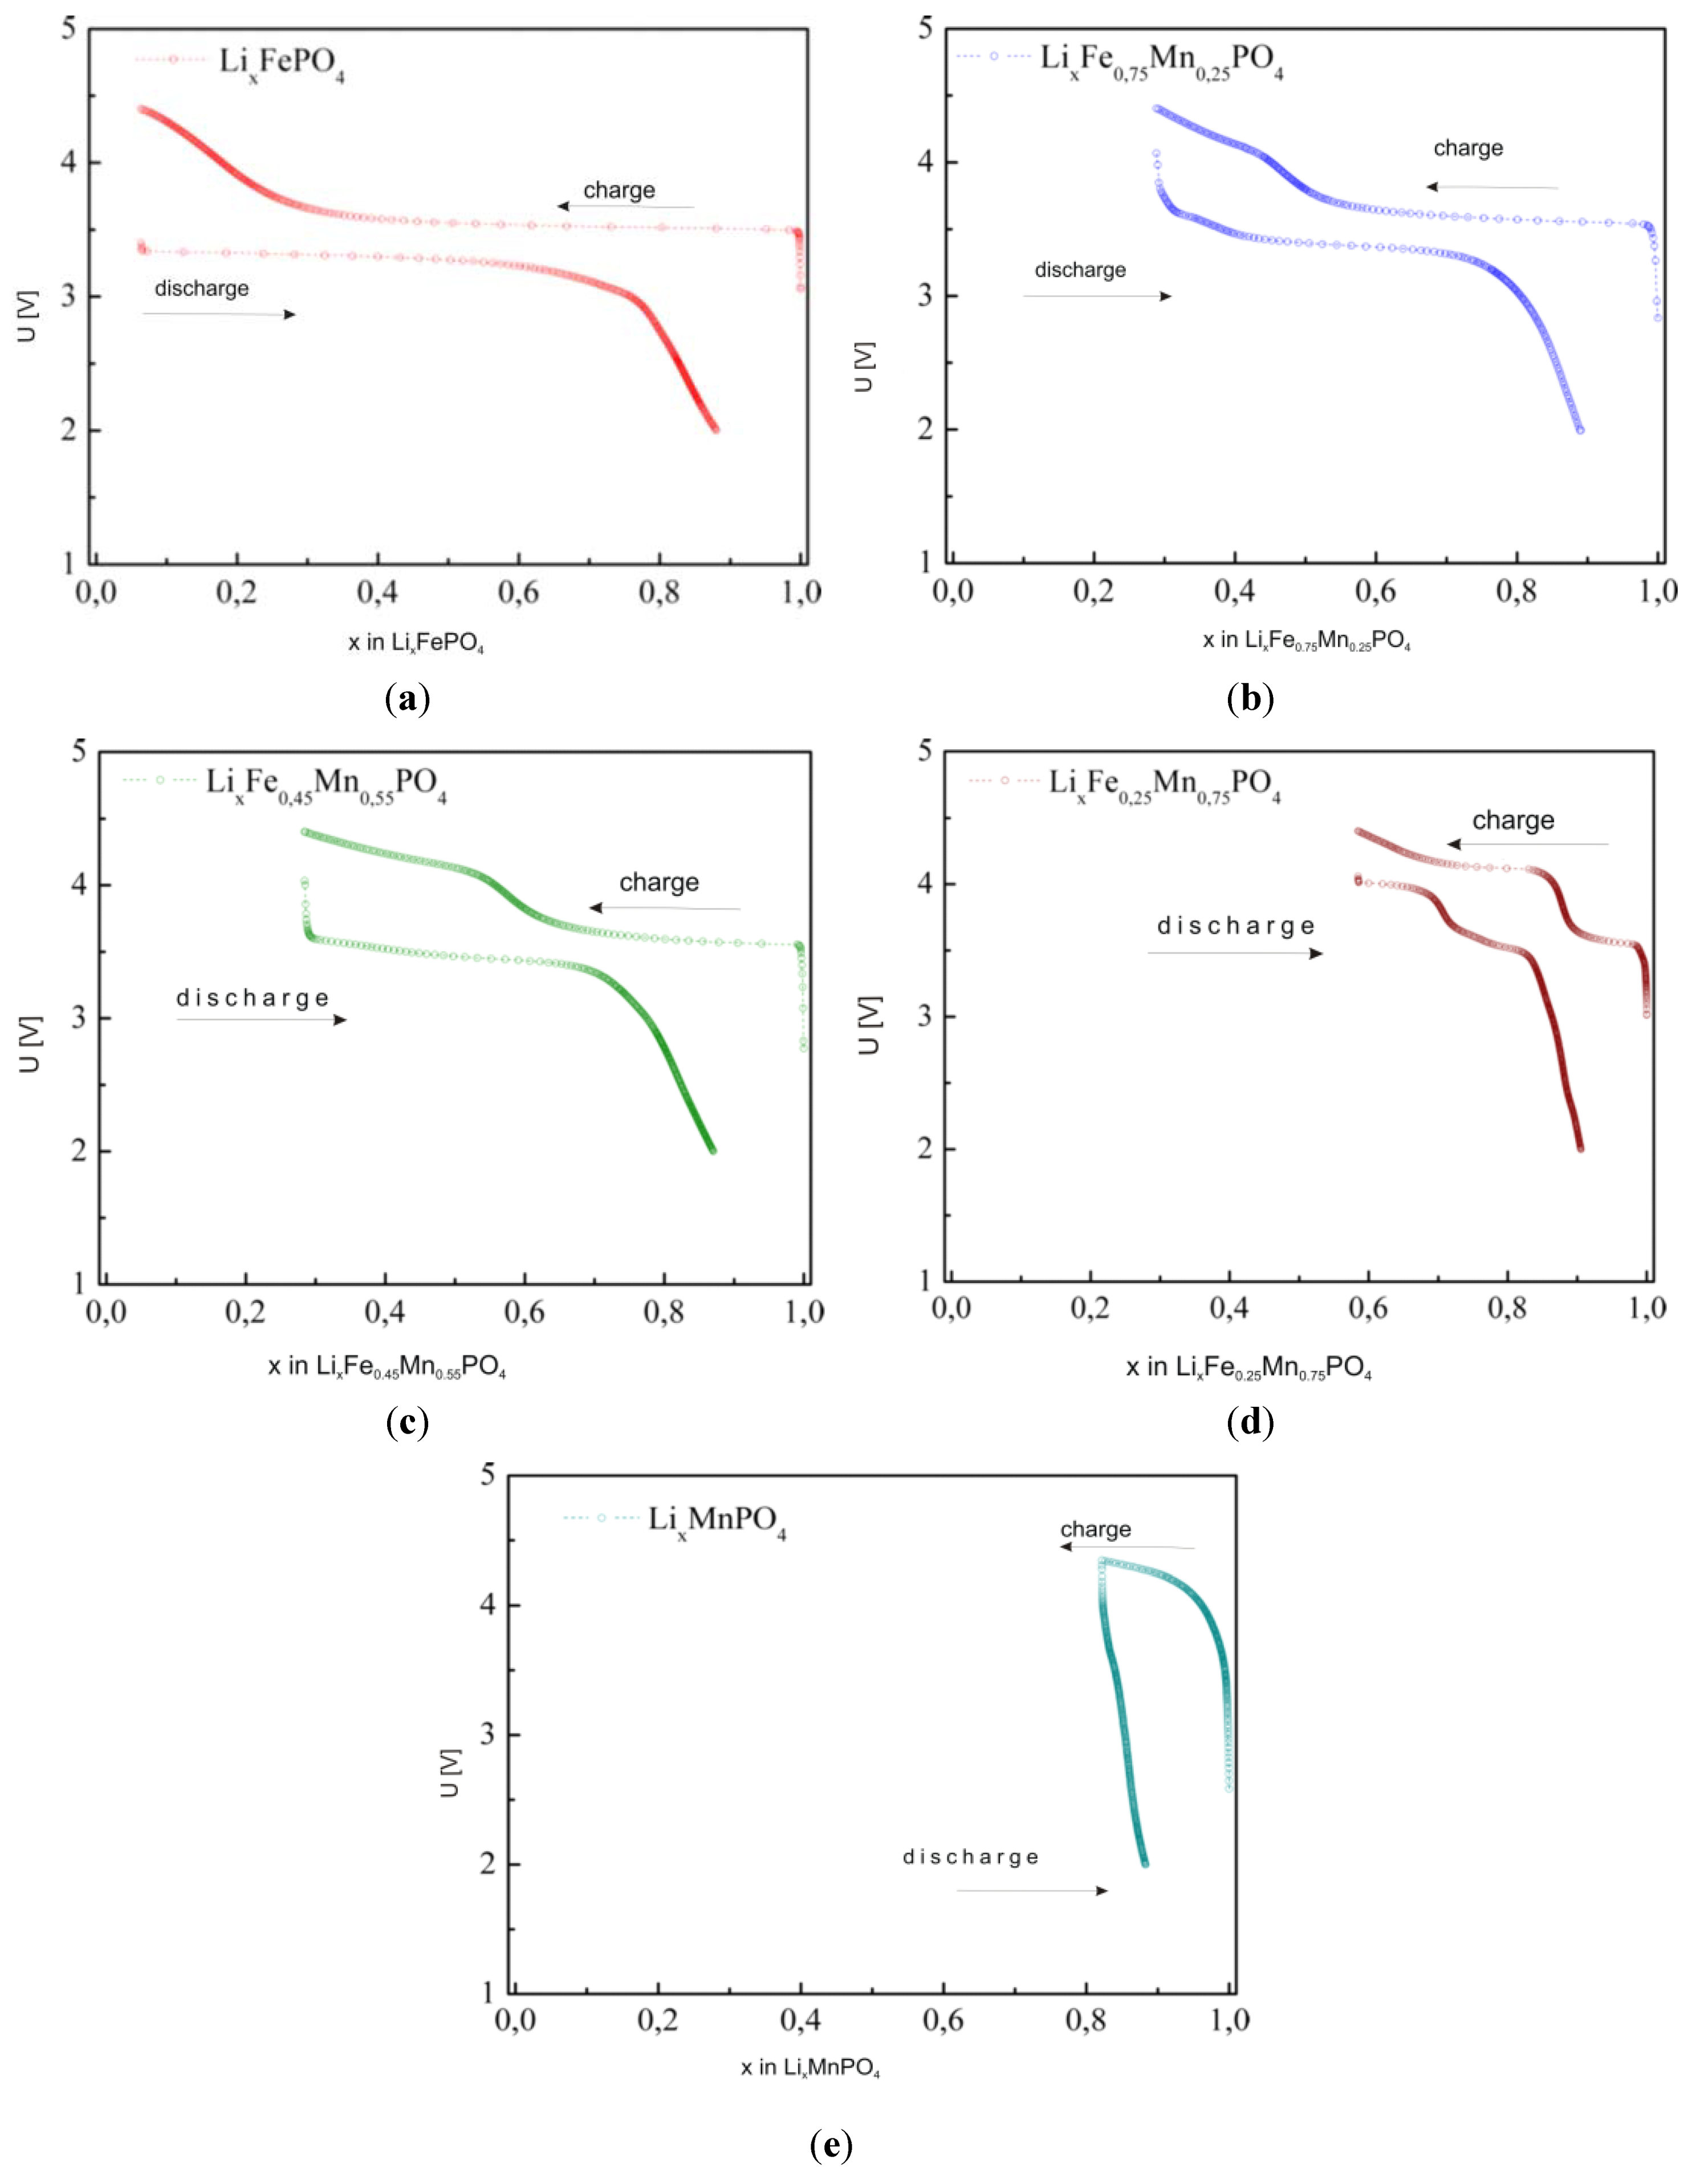
2.2.3. Electrochemical Properties

Figure 26 shows exemplary electrochemical OCV data for Li/Li+/LixFe1−yMnyPO4 cells (y = 0, 0.25, 0.45, 0.55, 0.75 and 1). As mentioned in the previous section the lower-voltage plateau (≈3.5 V) corresponds to oxidation of Fe2+ to Fe3+ (removal of Fe2+tg↓ electrons), while the higher-voltage plateau (≈4 V) is related to the oxidation of Mn2+ to Mn3+ and the associated removal of Mn2+eg↑ electrons.
Figure 26. OCV curves for Li/Li+/LixFe1−yMnyPO4 cells (y = 0, 0.25, 0.45, 0.55, 0.75 and 1) [55].
Materials 06 01656 g026
In order to determine the mechanism of the delithiation process in LixFe1−yMnyPO4, structural studies were performed for materials with different concentrations of lithium (at different stages of the electrochemical delithiation process). Data were collected for the highest-conducting material with initial composition LiFe0.45Mn0.55PO4 (Figure 25a). Analysis of the patterns clearly shows that the observed process is a single-phase one (diffusional deintercalation-type) over the whole range of concentration 0.16 < xLi ≤ 1. No visible reflections from the lithium-poor phase could be seen. Such a phase was evidently present in the case of electrochemical delithiation of LiFePO4, LiMnPO4 and LiFe0.75M0.25PO4 (M = Mn, Co and Ni).
Figure 27 shows changes of the unit cell parameters of deintercalated LixFe0.45Mn0.55PO4 as a function of lithium content x, obtained from Rietveld analysis of XRD data. It can be observed that in the 0.55 ≤ xLi < 1 range, corresponding to Fe2+ → Fe3+ oxidation, unit cell parameters vary rather strongly, in opposition to further deintercalation (xLi < 0.55, Mn2+ → Mn3+ oxidation), for which a rather insignificant variation is observed. Structural studies presented by Yamada et al. [56,57,58] for LixFe1−yMnyPO4 (0 < y < 1) confirm that reaction with lithium occurring at 3.5 V is a single-phase type, however these results show that at the 4 V range a change of the mechanism of electrode reaction into a two-phase type takes place.
Figure 27. Unit cell parameters of electrochemically deintercalated LixFe0.45Mn0.55PO4 as a function of lithium content. Data taken from [7].
Materials 06 01656 g027
Moessbauer studies of deintercalated LixFe0.45Mn0.55PO4 (Figure 28) proved that with decreasing lithium content, the Fe2+/Fe3+ ratio decreases as well. For xLi < 0.55 in the spectra only the single charge state of iron, identified as Fe3+ exists, but there are two quadrupole components present, which are due to a proceeding Mn2+ → Mn3+ oxidation and the presence of different amounts of Mn2+ and Mn3+ cations in the surrounding Fe3+ ions. Figure 29, Figure 30 and Figure 31 show charge/discharge curves recorded for Li/Li+/LixFe1−yMyPO4 (M = Mn, Co, Ni) cells.
On analyzing charge/discharge curves, a highest reversible capacity for unsubstituted LiFePO4 material can be observed. Among substituted cathode materials, LixFe0.75Co0.25PO4 and LixFe0.75Mn0.25PO4 show relatively high values, respectively, 136 mAh g−1 and 106 mAh g−1. For higher substitutions, a significant deterioration of the reversibility of the cathode processes is clearly visible, which can be related to the low ionic-electronic conductivity of the materials. Additionally, the determined values of the lithium diffusion coefficient are very low, of the order of 10−15–10−13 cm2 s−1 and decrease with increasing concentration of metal M. Figure 32 shows current-voltage characteristics of Li/Li+/LixFe1−yMnyPO4 cells for cathode materials with y = 0, 0.25, 0.45, 0.75 and 1. Two anode and cathode peaks can be observed, corresponding to oxidation/reduction of Fe2+/Fe3+ and Mn2+/Mn3+ pairs in the case of samples with 0 < y < 1. The highest voltage related to the Fe2+ → Fe3+ oxidation (≈3.5 V) was recorded for LiFe0.25Mn0.75PO4 cathode material, which is about 0.05 V higher compared to the undoped phosphoolivine. The voltage of the cathodic peak corresponding to the higher plateau, which is related to the Mn2+/Mn3+ pair, changes from 4.2 V for LiFe0.75Mn0.25PO4 up to 4.4 V for LiFe0.25Mn0.75PO4 material. With an increasing amount of substitution, the kinetics of the cathodic process worsens considerably. Evident anode and cathode peaks, which are present for LiFePO4, diminish and are barely visible for LiMnPO4. These results are in agreement with previously discussed charge-discharge curves, and are related to the deterioration of transport properties for materials with a higher concentration of metal M.
Figure 28. Moessbauer spectra for electrochemically deintercalated LixFe0.45Mn0.55PO4 phosphoolivines with varying lithium concentration. Data from [49].
Materials 06 01656 g028
Figure 29. Charge/discharge curves for Li/Li+/LixFe1−yMnyPO4 cells recorded with C/10 rate for materials with: (a) y = 0; (b) y = 0.25; (c) y = 0.55; (d) y = 0.75 and (e) y = 1 [55].
Materials 06 01656 g029
Figure 30. Charge/discharge curves for Li/Li+/LixFe1−yCoyPO4 cells recorded with C/10 speed for materials with: (a) y = 0; (b) y = 0.25; (c) y = 0.5; (d) y = 0.75 and (e) y = 1.
Materials 06 01656 g030
Figure 31. Charge/discharge curves for Li/Li+/LixFe1−yNiyPO4 cells recorded with C/10 speed for materials with: (a) y = 0; (b) y = 0.25; (c) y = 0.5; (d) y = 0.75 and (e) y = 1.
Materials 06 01656 g031
Figure 32. Cyclic voltammograms recorded for Li/Li+/LixFe1−yMnyPO4 cells with cathode material with different concentration of manganese: (a) y = 0; (b) y = 0.25; (c) y = 0.55; (d) y = 0.75 and (e) y = 1 [55].
Materials 06 01656 g032

3. Conclusions

Based on the obtained results, the possibility of chemical modification of phosphoolivine by introduction of cation dopants in Li and Fe sublattices was evaluated. The range of solid solution formation in Li1−3xAlxFePO4, Li1−4xZrxFePO4 and Li1−6xWxFePO4 materials was found to be very narrow, and consequently, transport properties of the compounds are rather weakly dependent on the chemical composition. By contrast, in the case of 3d metal doping in LiFe1−xMxPO4 (M = Mn, Co and Ni) systems, formation of solid solutions is possible in the whole composition range (0 ≤ x ≤ 1). Slight improvement of electrical conductivity was observed for LiFe1−xMxPO4 samples with x = 0.25. In addition, small polaron-type charge transport mechanism (hole related to Fe3+ (tg↑)3(eg↑)2 cation) is preserved for all substituted samples. In the case of LixFe0.45Mn0.55PO4 sample, substitution of Fe2+ by Mn2+ ions leads to the diffusional mechanism of lithium deintercalation for xLi < 0.55. The highest reversible capacity was observed for unsubstituted LiFePO4, also LiFe0.75Co0.25PO4 and LiFe0.75Mn0.25PO4 showed relatively high capacity. The highest voltage related to the Fe2+ → Fe3+ oxidation (≈3.5 V) was recorded for LiFe0.25Mn0.75PO4 cathode material, and it is about 0.05 V higher comparing to the undoped phosphoolivine. The voltage of the cathodic peak corresponding to the Mn2+/Mn3+ redox couple, changes from 4.2 V for LiFe0.75Mn0.25PO4 up to 4.4 V for LiFe0.25Mn0.75PO4 material. For higher substitution levels, deterioration of the electrochemical performance owing to the low ionic-electronic conductivity of the materials, was detected.

Acknowledgments

This work was financially supported by EU under the grant No. UDA-POIG 01.01.02-00-108/09-05 and by National Science Center under grant No. DEC-2011/02/A/ST5/00447.

References

  1. Zaghib, K.; Mauger, A.; Julien, C.M. Overview of olivines in lithium batteries for green transportation and energy storage. J. Solid State Electrochem. 2012, 16, 835–845. [Google Scholar] [CrossRef]
  2. Zaghib, K.; Mauger, A.; Goodenough, J.B.; Gendron, F.; Julien, C.M. Electronic, optical, and magnetic properties of LiFePO4: Small magnetic polaron effects. Chem. Mater. 2007, 19, 3740–3747. [Google Scholar] [CrossRef]
  3. Fisher, G.A.J.; Prieto, V.M.H.; Islam, M.S. Lithium battery materials LiMPO4 (M = Mn, Fe, Co, and Ni): Insights into defect association, transport mechanisms, and doping behavior. Chem. Mater. 2008, 20, 5907–5915. [Google Scholar] [CrossRef]
  4. Amin, R.; Maier, J.; Balaya, P.; Chen, D.P.; Lin, C.T. Ionic and electronic transport in single crystalline LiFePO4 grown by optical floating zone technique. Solid State Ionics 2008, 179, 1683–1687. [Google Scholar] [CrossRef]
  5. Li, J.; Yao, W.; Martin, S.; Vaknin, D. Lithium ion conductivity in single crystal LiFePO4. Solid State Ionics 2008, 179, 2016–2019. [Google Scholar] [CrossRef]
  6. Amin, R.; Balaya, P.; Maier, J. Anisotropy of electronic and ionic transport in LiFePO4 single crystals. Electrochem. Solid-State Lett. 2007, 10, A13–A16. [Google Scholar] [CrossRef]
  7. Molenda, J.; Ojczyk, W.; Świerczek, K.; Zając, W.; Krok, F.; Dygas, J.; Liu, R.-S. Diffusional mechanism of deintercalation in LiFe1−yMnyPO4 cathode material. Solid State Ionics 2006, 177, 2617–2624. [Google Scholar] [CrossRef]
  8. Ellis, B.; Perry, L.K.; Ryan, D.H.; Nazar, L.F. Small polaron hopping in LixFePO4 solid solutions: Coupled lithium-ion and electron mobility. J. Am. Chem. Soc. 2006, 128, 11416–11422. [Google Scholar] [CrossRef] [PubMed]
  9. Prosini, P.P.; Lisi, M.; Zane, D.; Pasquali, M. Determination of the chemical diffusion coefficient of lithium in LiFePO4. Solid State Ionics 2002, 148, 45–51. [Google Scholar] [CrossRef]
  10. Yu, D.Y.W.; Fietzek, C.; Weydanz, W.; Donoue, K.; Inoue, T.; Kurokawa, H.; Fujitani, S. Study of LiFePO4 by cyclic voltammetry. J. Electrochem. Soc. 2007, 154, A253–A257. [Google Scholar] [CrossRef]
  11. He, P.; Zhang, X.; Wang, Y.-G.; Cheng, L.; Xia, Y.-Y. Lithium-ion intercalation behavior of LiFePO4 in aqueous and nonaqueous electrolyte solutions. J. Electrochem. Soc. 2008, 155, A144–A150. [Google Scholar] [CrossRef]
  12. Tang, X.-C.; Li, L.-X.; Lai, Q.-L.; Song, X.-W.; Jiang, L.-H. Electrochemical performance of LiFePO4 thin films with different morphology and crystallinity. Electrochim. Acta 2009, 54, 2329–2334. [Google Scholar] [CrossRef]
  13. Ma, J.; Li, B.; Du, H.; Xu, C.; Kang, F. The Effect of Vanadium on Physicochemical and Electrochemical Performances of LiFePO4 Cathode for Lithium Battery. J. Electrochem. Soc. 2011, 158, A26–A32. [Google Scholar] [CrossRef]
  14. Padhi, A.K.; Nanjundaswamy, K.S.; Goodenough, J.B. Phospho-olivines as Positive-Electrode Materials for Rechargeable Lithium Batteries. J. Electrochem. Soc. 1997, 144, 1188–1194. [Google Scholar] [CrossRef]
  15. Andersson, A.S.; Thomas, J.O. The source of first-cycle capacity loss in LiFePO4. J. Power Sources 2001, 498, 97–98. [Google Scholar]
  16. Laffont, L.; Delacourt, C.; Gibot, P.; Wu, M.Y.; Kooyman, P.; Masquelier, C.; Tarascon, J.M. Study of the LiFePO4/FePO4 two-phase system by high-resolution electron energy loss spectroscopy. Chem. Mater. 2006, 18, 5520–5529. [Google Scholar] [CrossRef]
  17. Delmas, C.; Maccario, M.; Croguennec, L.; Cras, F.L.; Weill, F. Lithium deintercalation in LiFePO4 nanoparticles via a domino-cascade model. Nat. Mater. 2008, 7, 665–671. [Google Scholar] [CrossRef] [PubMed]
  18. Bai, P.; Cogswell, D.A.; Bazant, M.Z. Suppression of phase separation in LiFePO4 Nanoparticles during battery discharge. Nano Lett. 2011, 11, 4890–4896. [Google Scholar] [CrossRef] [PubMed]
  19. Daniel, A.; Cogswell, D.A.; Bazant, M.Z. Coherency strain and the kinetics of phase separation in LixFePO4. ACS Nano. 2012, 6, 2215–2225. [Google Scholar] [CrossRef] [PubMed]
  20. Bazant, M.Z. Theory of Chemical Kinetics and Charge Transfer based on Nonequilibrium Thermodynamics. Acc. Chem. Res. 2013, in press. [Google Scholar]
  21. Molenda, J.; Marzec, J. Functional cathode materials for Li-ion batteries—Part I: Fundamentals. Funct. Mater. Lett. 2008, 1, 91–95. [Google Scholar] [CrossRef]
  22. Nazri, G.-A.; Pistoia, G. Lithium Batteries Science and Technology; Springer: New York, NY, USA, 2003. [Google Scholar]
  23. Rissoul, K.; Benkhouja, K.; Ramos-Barrado, J.R.; Julien, C. Electrical conductivity in lithium orthophosphates. Mater. Sci. Eng. B 2003, 98, 185–189. [Google Scholar] [CrossRef]
  24. Delacourt, C.; Laffont, L.; Bouchet, R.; Wurm, C.; Leriche, J.-B.; Morcrette, M.; Tarascon, J.-M.; Masquelier, C. Toward understanding of electrical limitations (electronic, ionic) in LiMPO4 (M = Fe, Mn) electrode materials. J. Electrochem. Soc. 2005, 152, A913–A921. [Google Scholar] [CrossRef]
  25. Islam, M.S.; Driscoll, D.J.; Fisher, C.A.J.; Slater, P.R. Atomic-scale investigation of defects, dopants, and lithium transport in the LiFePO4 olivine-type battery material. Chem. Mater. 2005, 17, 5085–5092. [Google Scholar] [CrossRef]
  26. Chung, S.Y.; Chiang, Y.-M. Microscale measurements of the electrical conductivity of doped LiFePO4. Electrochem. Solid-State Lett. 2003, 6, A278–A281. [Google Scholar] [CrossRef]
  27. Chung, S.Y.; Bloking, J.T.; Chiang, Y.M. Electronically conductive phospho-olivines as lithium storage electrodes. Nat. Mater. 2002, 1, 123–128. [Google Scholar] [CrossRef] [PubMed]
  28. Wagemaker, M.; Ellis, B.L.; Lutzenkirchen-Hecht, D.; Mulder, F.M.; Nazar, L.F. Proof of Supervalent Doping in Olivine LiFePO4. Chem. Mater. 2008, 20, 6313–6315. [Google Scholar] [CrossRef]
  29. Li, D.; Huang, Y.; Jia, D.; Guo, Z.; Juan, B.S. Synthesis and electrochemical properties of nanosized carbon-coated Li1–3xLaxFePO4 composites. J. Solid State Electrochem. 2010, 14, 889–895. [Google Scholar] [CrossRef]
  30. Roberts, M.R.; Vitins, G.; Owen, J.R. High-throughput studies of Li1−xMgx/2FePO4 and LiFe1−yMgyPO4 and the effect of carbon coating. J. Power Sources 2008, 179, 754–762. [Google Scholar] [CrossRef]
  31. Wen, X.Y.; Zheng, M.P.; Tong, Z.F. Effect of Ti4+ ion doping on the performance and structure of lithium iron phosphate. J. Inorg. Mater. 2006, 21, 115. [Google Scholar]
  32. Hong, J.; Wang, C.S.; Kasavajjula, U. Kinetic behavior of LiFeMgPO4 cathode material for Li-ion batteries. J. Power Sources 2006, 162, 1289–1296. [Google Scholar] [CrossRef]
  33. Delacourt, C.; Wurm, C.; Laffont, L.; Leriche, J.-B.; Masquelier, C. Electrochemical and electrical properties of Nb- and/or C-containing LiFePO4 composites. Solid State Ionics 2006, 3–4, 333–341. [Google Scholar] [CrossRef]
  34. Ouyang, C.Y.; Shi, S.Q.; Wang, Z.X.; Li, H.; Huang, X.J.; Chen, L.Q. The effect of Cr doping on Li ion diffusion in LiFePO4 from first principles investigations and Monte Carlo simulations. J. Phys. Condens. Matter. 2004, 16, 2265–2272. [Google Scholar] [CrossRef]
  35. Shi, S.; Liu, L.; Ouyang, C.Y.; Wang, D.-S.; Wang, Z.; Chen, L.; Huang, X. Enhancement of electronic conductivity of LiFePO4 by Cr doping and its identification by first-principles calculations. Phys. Rev. B 2003, 68, 195108:1–195108:5. [Google Scholar]
  36. Ellis, B.; Herle, P.S.; Rho, Y.H.; Nazar, L.F.; Dunlap, R.; Perry, L.K.; Ryan, D.H. Nanostructured materials for lithium-ion batteries: Surface conductivity vs. bulk ion/electron transport. Faraday Discuss. 2007, 134, 119–141. [Google Scholar] [CrossRef] [PubMed]
  37. Herle, P.S.; Ellis, B.; Coombs, N.; Nazar, L.F. Nano-network electronic conduction in iron and nickel olivine phosphates. Nat. Mater. 2004, 3, 147–152. [Google Scholar] [CrossRef] [PubMed]
  38. Ojczyk, W.; Marzec, J.; Świerczek, K.; Zając, W.; Molenda, M.; Dziembaj, R.; Molenda, J. Studies of selected synthesis procedures of the conducting LiFePO4-based composite cathode materials for Li-ion batteries. J. Power Sources 2007, 173, 700–706. [Google Scholar] [CrossRef]
  39. Martha, S.K.; Markovsky, B.; Grinblat, J.; Gofer, Y.; Haik, O.; Zinigrad, E.; Aurbach, D.; Drezen, D.; Wang, T.; Deghenghi, G.; et al. LiMnPO4 as an Advanced Cathode Material for Rechargeable Lithium Batteries. J. Electrochem. Soc. 2009, 156, A541–A552. [Google Scholar] [CrossRef]
  40. Wolfenstine, J.; Allen, J. Ni3+/Ni2+ redox potential in LiNiPO4. J. Power Sources 2005, 136, 150–153. [Google Scholar] [CrossRef]
  41. Prabu, M.; Selvasekarapandian, S.; Reddy, M.V. Impedance studies on the 5-V cathode material, LiCoPO4. J. Solid State Electrochem. 2012, 16, 1833–1839. [Google Scholar] [CrossRef]
  42. Chowdari, B.V.R.; Zhang, Y.; Sun, C.S.; Zhou, Z. Fast synthesis of core-shell LiCoPO4/C nanocomposite via microwave heating and its electrochemical Li intercalation performances. Electrochem. Comm. 2009, 11, 1183–1186. [Google Scholar]
  43. Yamada, A.; Hosoya, M.; Chung, S.-C.; Kudo, Y.; Hinokuma, K.; Liu, K.-Y.; Nish, Y.I. Olivine-type cathodes achievements and problems. J. Power Sources 2003, 119, 232–238. [Google Scholar] [CrossRef]
  44. Sugiyama, J.; Nozaki, H.; Harada, M.; Kamazawa, K.; Ikedo, Y.; Miyake, Y.; Ofer, O.; Mansson, M.; Ansaldo, E.J.; Chow, K.H.; et al. Diffusive behavior in LiMPO4 with M = Fe, Co, Ni probed by muon-spin relaxation. Phys. Rev. B 2012, 85, 054111:1–054111:9. [Google Scholar]
  45. Johannes, M.D.; Hoang, K.; Allen, J.L.; Gaskell, K. Hole polaron formation and migration in olivine phosphate materials. Phys. Rev. B 2012, 85, 115106:1–115106:6. [Google Scholar] [CrossRef]
  46. Ong, S.P.; Chevrier, V.L.; Ceder, G. Comparison of small polaron migration and phase separation in olivine LiMnPO4 and LiFePO4 using hybrid density functional theory. Phys. Rev. B 2011, 83, 075112:1–075112:7. [Google Scholar]
  47. Kulka, A.; Milewska, A.; Zając, W.; Świerczek, K.; Hanc, E.; Molenda, J. Possibility of modification of phosphoolivine by substitution in Li sublattice. Solid State Ionics 2012, 225, 575–579. [Google Scholar] [CrossRef]
  48. Kimura, M.; Świerczek, K.; Marzec, J.; Molenda, J. Influence of aluminium on physico-chemical properties in phosphate. Funct. Mater. Lett. 2011, 4, 123–127. [Google Scholar] [CrossRef]
  49. Marzec, J.; Ojczyk, W.; Molenda, J. Delithiation of olivine—Structured LiFexMn1−xPO4 cathode materials. Mossbauer studies. Mater. Sci. Pol. 2006, 24, 69–74. [Google Scholar]
  50. Shannon, R.D. Revised effective ionic radii and systematic studies of interatomic distances in halides and chalocogenidesa. Acta Cryst. 1976, 32, 751–767. [Google Scholar] [CrossRef]
  51. Zhou, F.; Kang, K.; Maxish, T.; Ceder, G.; Morgan, D. The Li intercalation potential of LiMPO4 and LiMSiO4 olivines with M = Fe, Mn, Co, Ni. Electrochem. Commun. 2004, 132, 181–186. [Google Scholar]
  52. Dai, D.; Whangbo, M.-H.; Koo, H.-J.; Rocquefelte, X.; Jobic, S.; Villesuzanne, A. Analysis of the spin exchange interactions and the ordered magnetic structures of lithium transition metal phosphates LiMPO4 (M = Mn, Fe, Co, Ni) with the olivine structure. Inorg. Chem. 2005, 44, 2407–2413. [Google Scholar] [CrossRef] [PubMed]
  53. Austin, I.G.; Mott, N.F. Polarons in crystalline and non-crystalline materials. Adv. Phys. 1969, 18, 41–102. [Google Scholar] [CrossRef]
  54. Rao, C.N.R.; Raveau, B. Transition Metal Oxides, 2nd ed.; Wiley-Vch: New York, NY, USA, 1998. [Google Scholar]
  55. Ojczyk, W. Transport and electrochemical properties of cathode materials from the group of transition metals phosphates with olivine structure. Ph. D thesis, AGH University of Science and Technology, Cracow, Poland, 18 March 2011. [Google Scholar]
  56. Yamada, A.; Chung, S.-C. Crystal Chemistry of the Olivine-Type Li(MnyFe1−y)PO4 and (MnyFe1−y)PO4 as Possible 4 V Cathode Materials for Lithium Batteries. J. Electrochem. Soc. 2001, 148, A960–A967. [Google Scholar] [CrossRef]
  57. Yamada, A.; Kudo, Y.; Liu, K.-Y. Reaction Mechanism of the Olivine-Type Lix(Mn0.6Fe0.4)PO4 (0 ≤ x ≤ 1). J. Electrochem. Soc. 2001, 148, A747–A754. [Google Scholar] [CrossRef]
  58. Yamada, A.; Kudo, Y.; Liu, K.-Y. Phase Diagram of Lix(MnyFe1−y)PO4 (0 ≤ x, y ≤ 1). J. Electrochem. Soc. 2001, 148, A1153–A1158. [Google Scholar] [CrossRef]

