2. Experimental
First, graphite oxide (GO) was synthesized from graphite powder with an average size of 500 μm (Nippon Carbon Co., Ltd.) in accordance with the Hummers method [
1] with some modifications, and the intercalation of octylamine into graphite (GO-OA) was performed as described previously [
2,
3]. Next, octylamine-intercalated graphite oxide (GO-OA) was added to fullerene solution (100 mg of C
60 dissolved in 100 ml toluene), and after that, the toluene used was evaporated at room temperature, leaving behind in the products (GO-OA-C
60). The C
60 fullerene used in this experiment was purchased from Frontier Carbon Co., Ltd, in Japan. The products of GO-OA-C
60 were treated with 0.1 N hydrochloric acid solution at room temperature for at least 30 minutes and dried in air at 80 °C overnight to remove the octylamine, resulting in the C
60-intercalated graphite oxide (GO-C
60). Finally, in order to remove C
60 powders that are not intercalated into the graphite, and moreover, to remove octylamines that are intercalated into the graphite, GO-C
60 was heated for at least 80 minutes at 600 °C under a high vacuum of 10
−6 Torr, which results in the nanocomposite consisting alternately of a stacked single graphene sheet and a C
60 monolayer. All specimens were analyzed by using X-ray diffraction (Rigaku RINT 2200/PC diffractometer: CuKα radiation at 40 kV and 30 mA), FT-IR spectroscopy (FTIR:JASCO 480 Plus FT-IR spectrometer: the samples in KBr pellets), NMR (our original 7.1 T spectrometer with a Tecmag Apollo spectrometer and a Doty SuperSonic MAS 7 mm probe head).
3. Results and Discussion
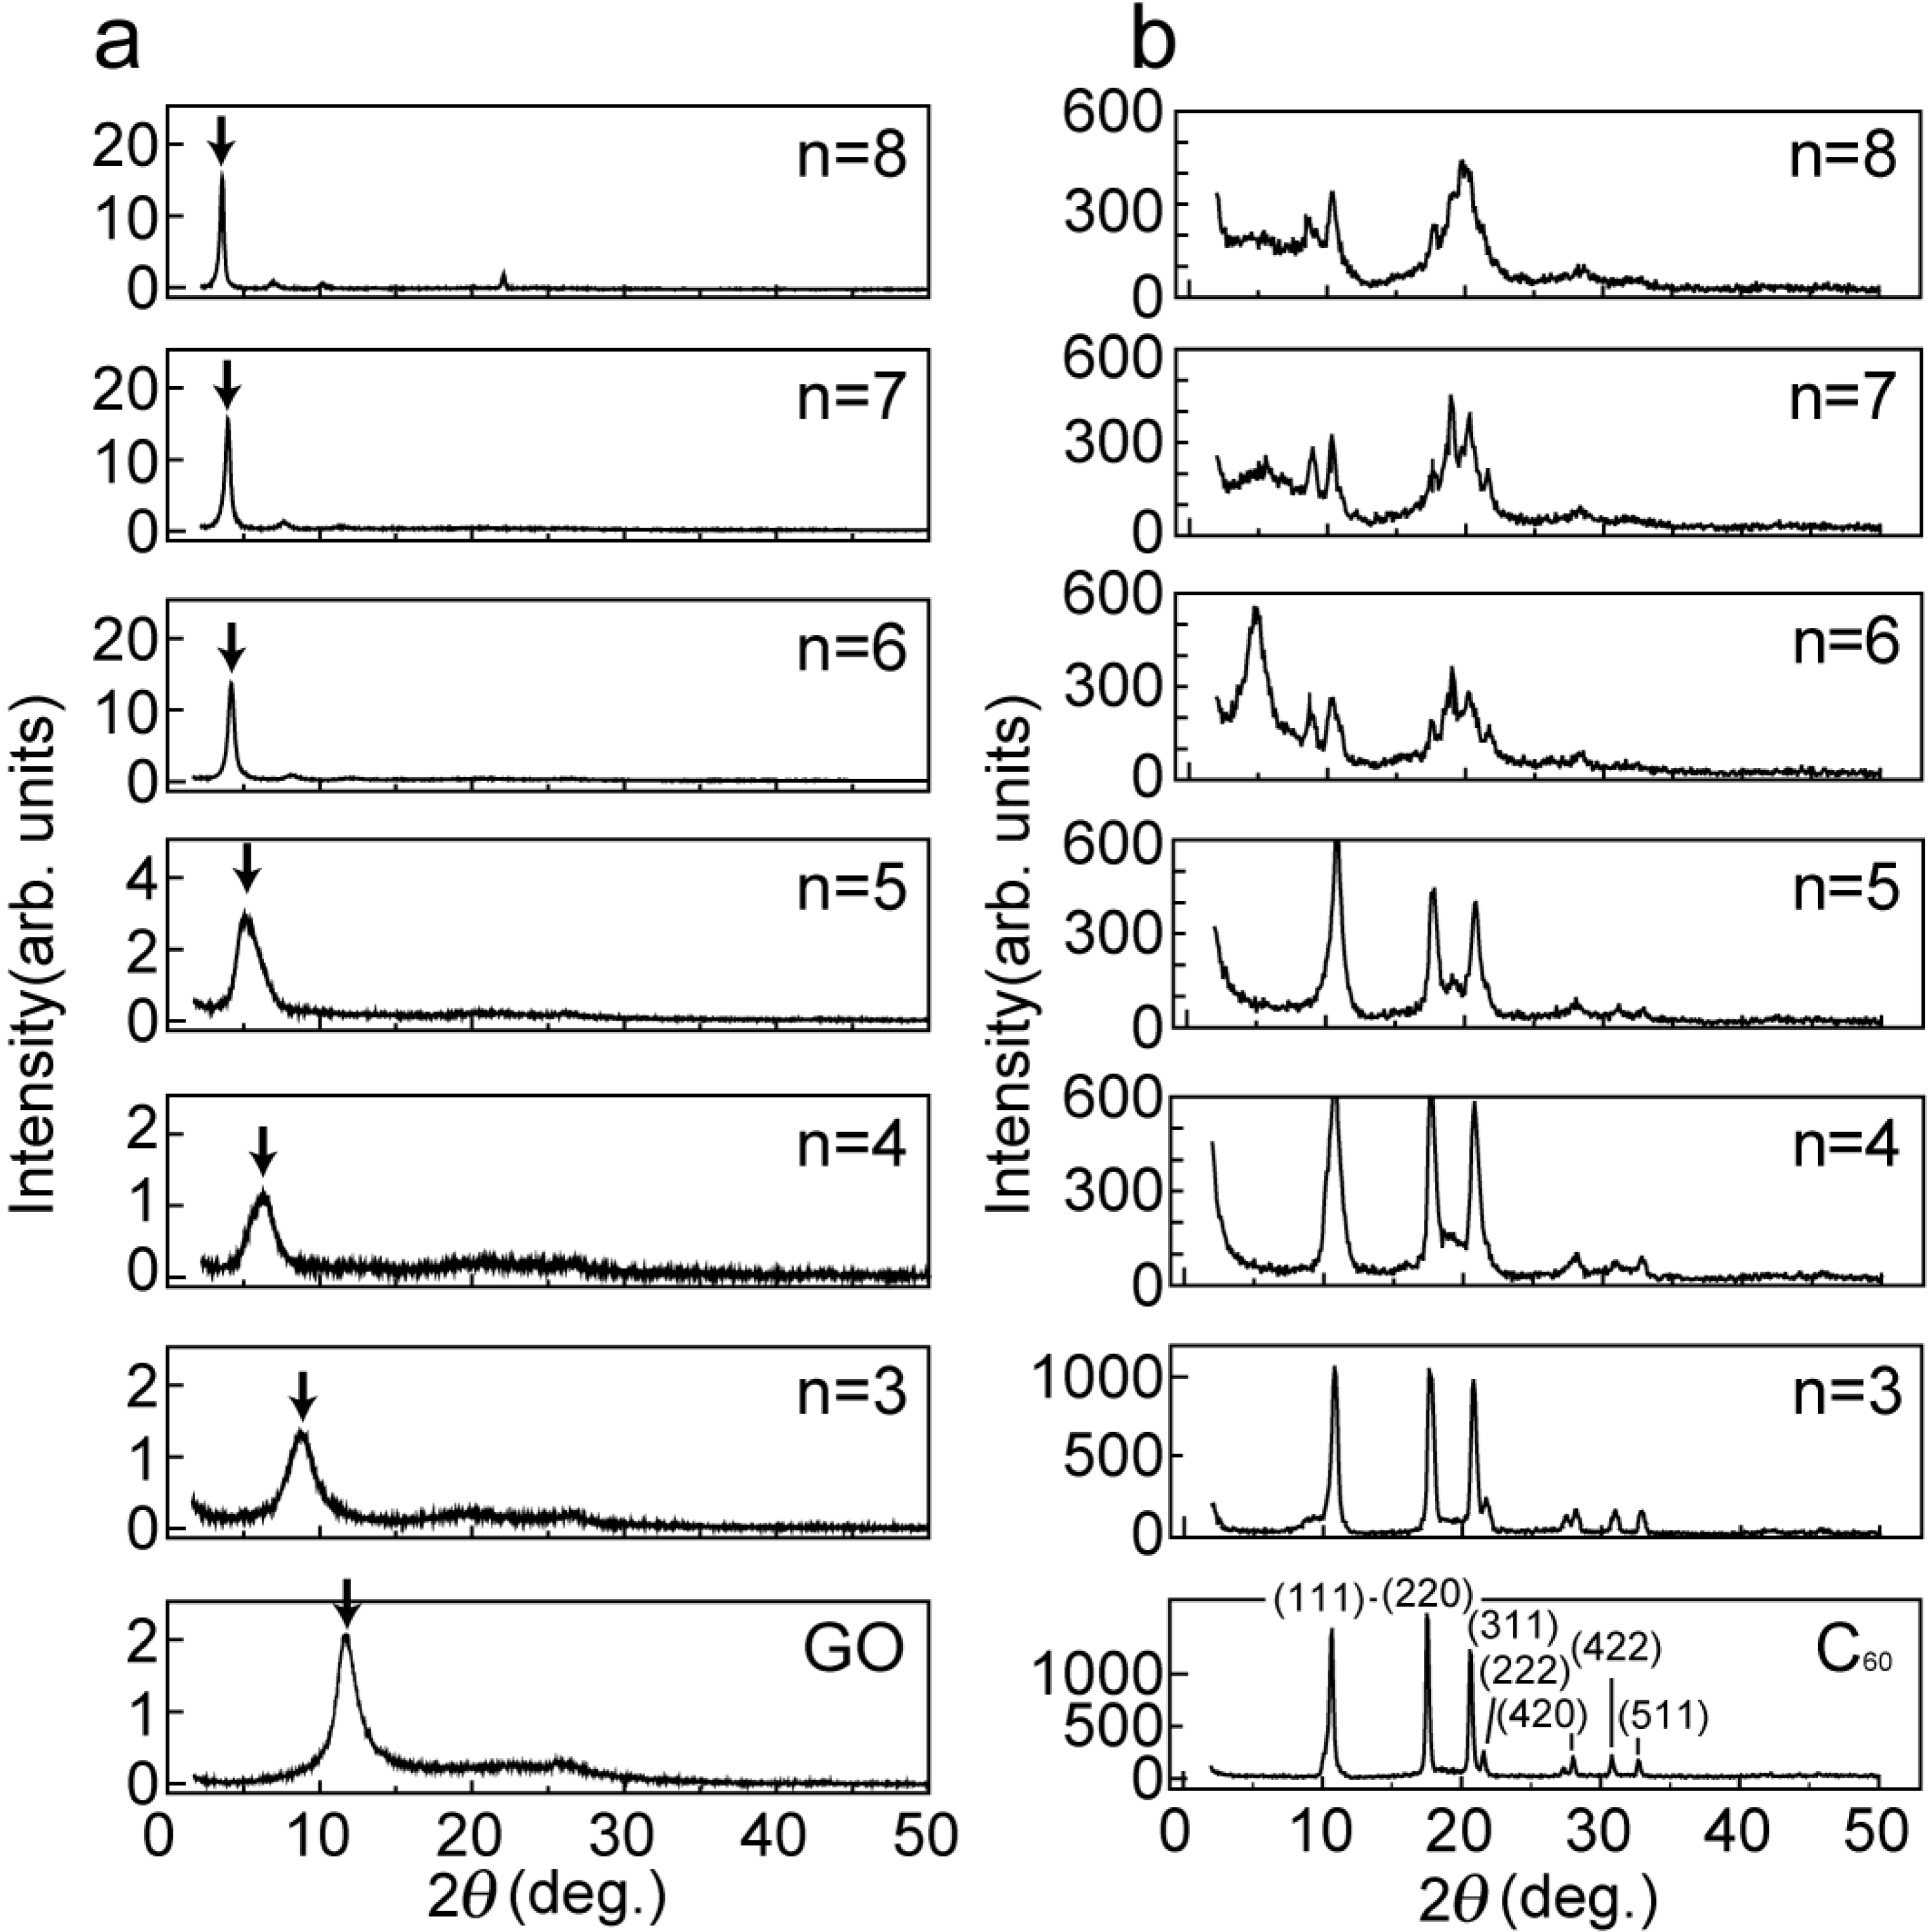
Figure 1a shows the X-ray diffraction (XRD) intensity of graphite oxide (GO) and alkylamine-intercalated graphite oxide (GO-amine) with different alkyl chain lengths (C
nH
2n+1NH
2) (n = 3 to 8). The appearance of a peak in the GO sample of
Figure 1a shows that the spacing between graphite oxide sheets is approximately 8 Å, which is identical to the published data [
1]. It was found that the spacing between graphite oxide sheets in the case of the GO-amine (n = 3 to 8) increases with the increase in the length of the alkyl chain incorporated in the interlayer space of the GO.
Figure 1b shows the XRD intensity of the GO-amine (n = 3 to 8) in C
60 solution, which we call the C
60-intercalated graphite oxide (GO-C
60). It should be noted that there appear drastic changes in the XRD intensity between n = 5 and n = 6 in
Figure 1b, which indicates that C
60 molecules are intercalated in the interlayer space of the GO by the driving force of alkylamine situated between the graphene oxide sheets when the interlayer space is sufficiently larger than the C
60 molecule. However, there exist many C
60 powders which are not intercalated into the GO in these GO-C
60 specimens, because the stronger XRD intensity peaks, (111), (220), (311), (222), (331), (420), (422) and (511), from C
60 powders (JCPDS file No.44-0558) appear in the spectra of
Figure 1b. In order to remove C
60 powders that are not intercalated into the GO, and moreover, to expel the alkylamines that are intercalated into the graphite, the GO-C
60 specimens shown in
Figure 1b were heated for 80 minutes at 600 °C under a high vacuum of 10
−6 Torr, as shown in
Figure 2a.
Figure 1.
XRD intensity from as-prepared samples. (a) XRD intensity from graphite oxide (GO) and alkylamine-intercalated graphite oxides (GO-amine) with different chain lengths (CnH2n+1NH2) (n = 3–8). The peaks of GO and GO-amine are indicated by the arrows in the figure; (b) XRD intensity from GO-amine with different chain lengths in C60 solution (n = 3–8).
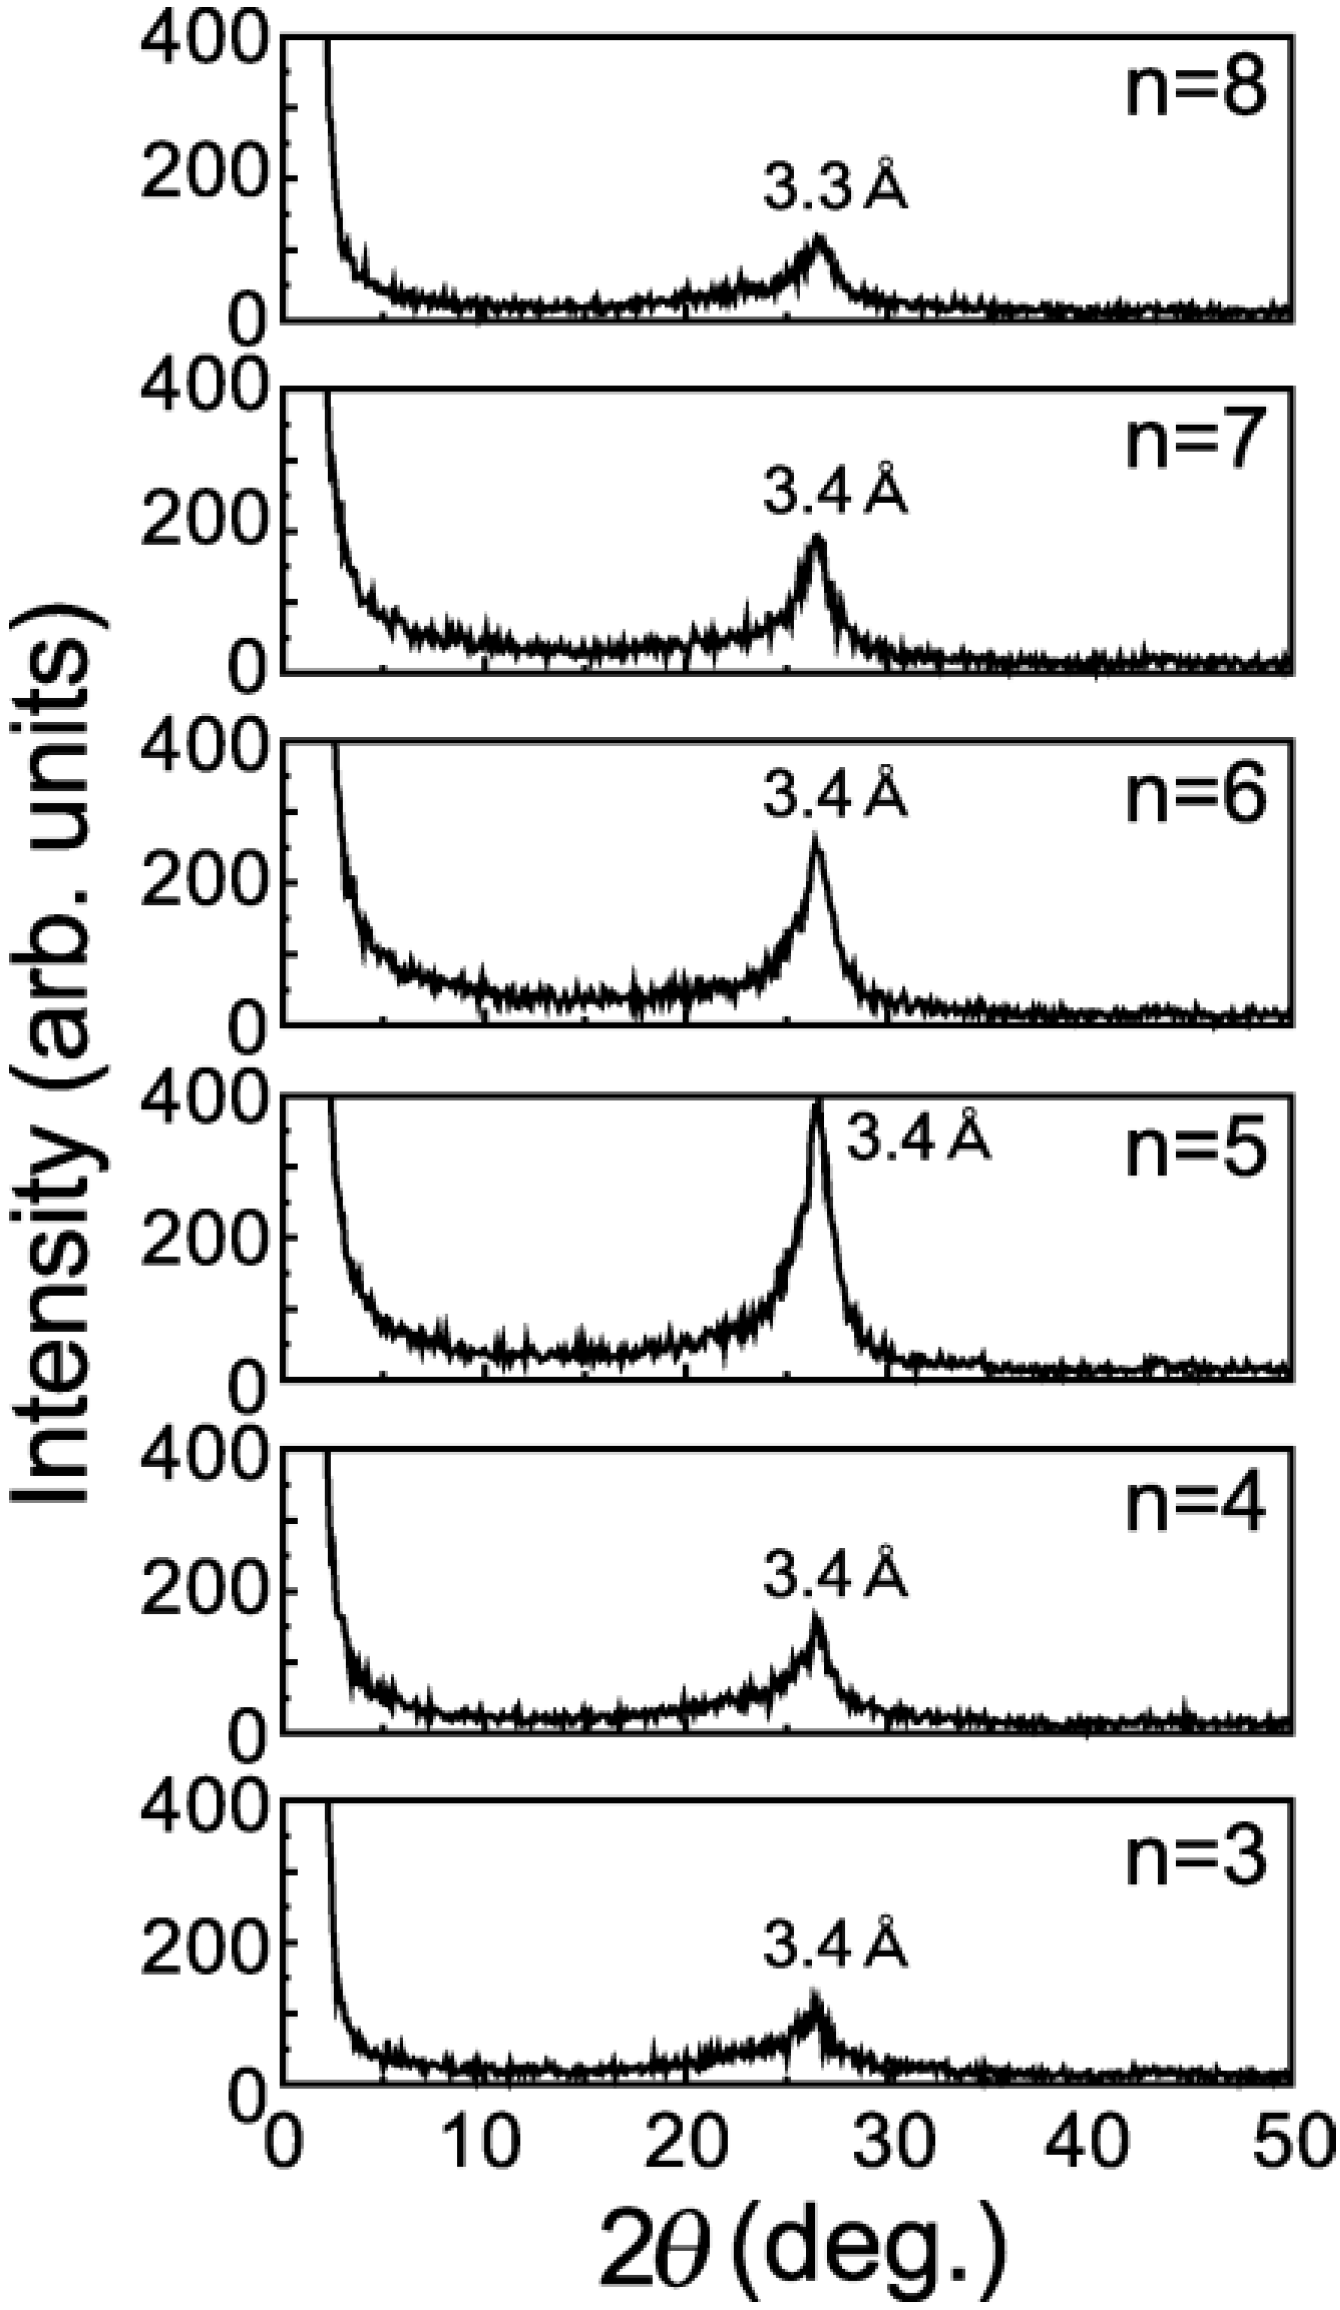
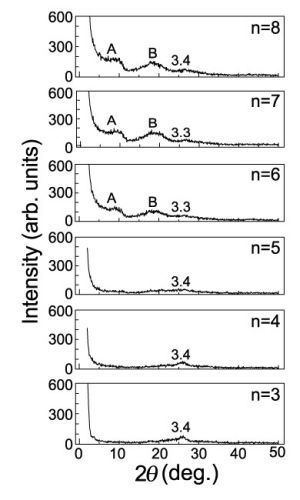
It should be noted that n = 6, n = 7 and n = 8 have broad peaks of A and B (as shown in
Figure 2) corresponding to
d-spacings of 9 Å and 4.6 Å, respectively, in addition to a broad peak of
d = 3.3 Å corresponding to the spacing of graphite layers. n = 3, n = 4 and n = 5 have only a single broad peak of
d = 3.3 Å. Since the GO-amine reverts to the graphite layers when alkylamines leave the GO-amine host after heating at up to 100 °C, as shown in the XRD intensity of
Figure 3, the graphene oxide layers in the GO-C
60, which do not include C
60 molecules, also revert to the graphite layers when alkylamines go out from it after heating. It is expected that the peaks of A and B (n = 6 to 8) in
Figure 2 are due to the
d-spacing between the graphenes intercalating the C
60 monolayer and their stacking faults, respectively. However, since peak A is also widely distributed, the
d-spacings between the graphenes intercalating the C
60 monolayer are considered to be widely distributed.
Figure 2.
XRD intensity from the GO-C
60 specimens of
Figure 1b after heating for 80 minutes at 600 °C under a high vacuum of 10
−6 Torr.
Figure 2.
XRD intensity from the GO-C
60 specimens of
Figure 1b after heating for 80 minutes at 600 °C under a high vacuum of 10
−6 Torr.
Figure 3.
XRD intensity from the alkylamine-intercalated graphite oxide (GO-amine) specimens after heating for 80 minutes at 100 ºC under a high vacuum of 10−6 Torr.
Figure 3.
XRD intensity from the alkylamine-intercalated graphite oxide (GO-amine) specimens after heating for 80 minutes at 100 ºC under a high vacuum of 10−6 Torr.
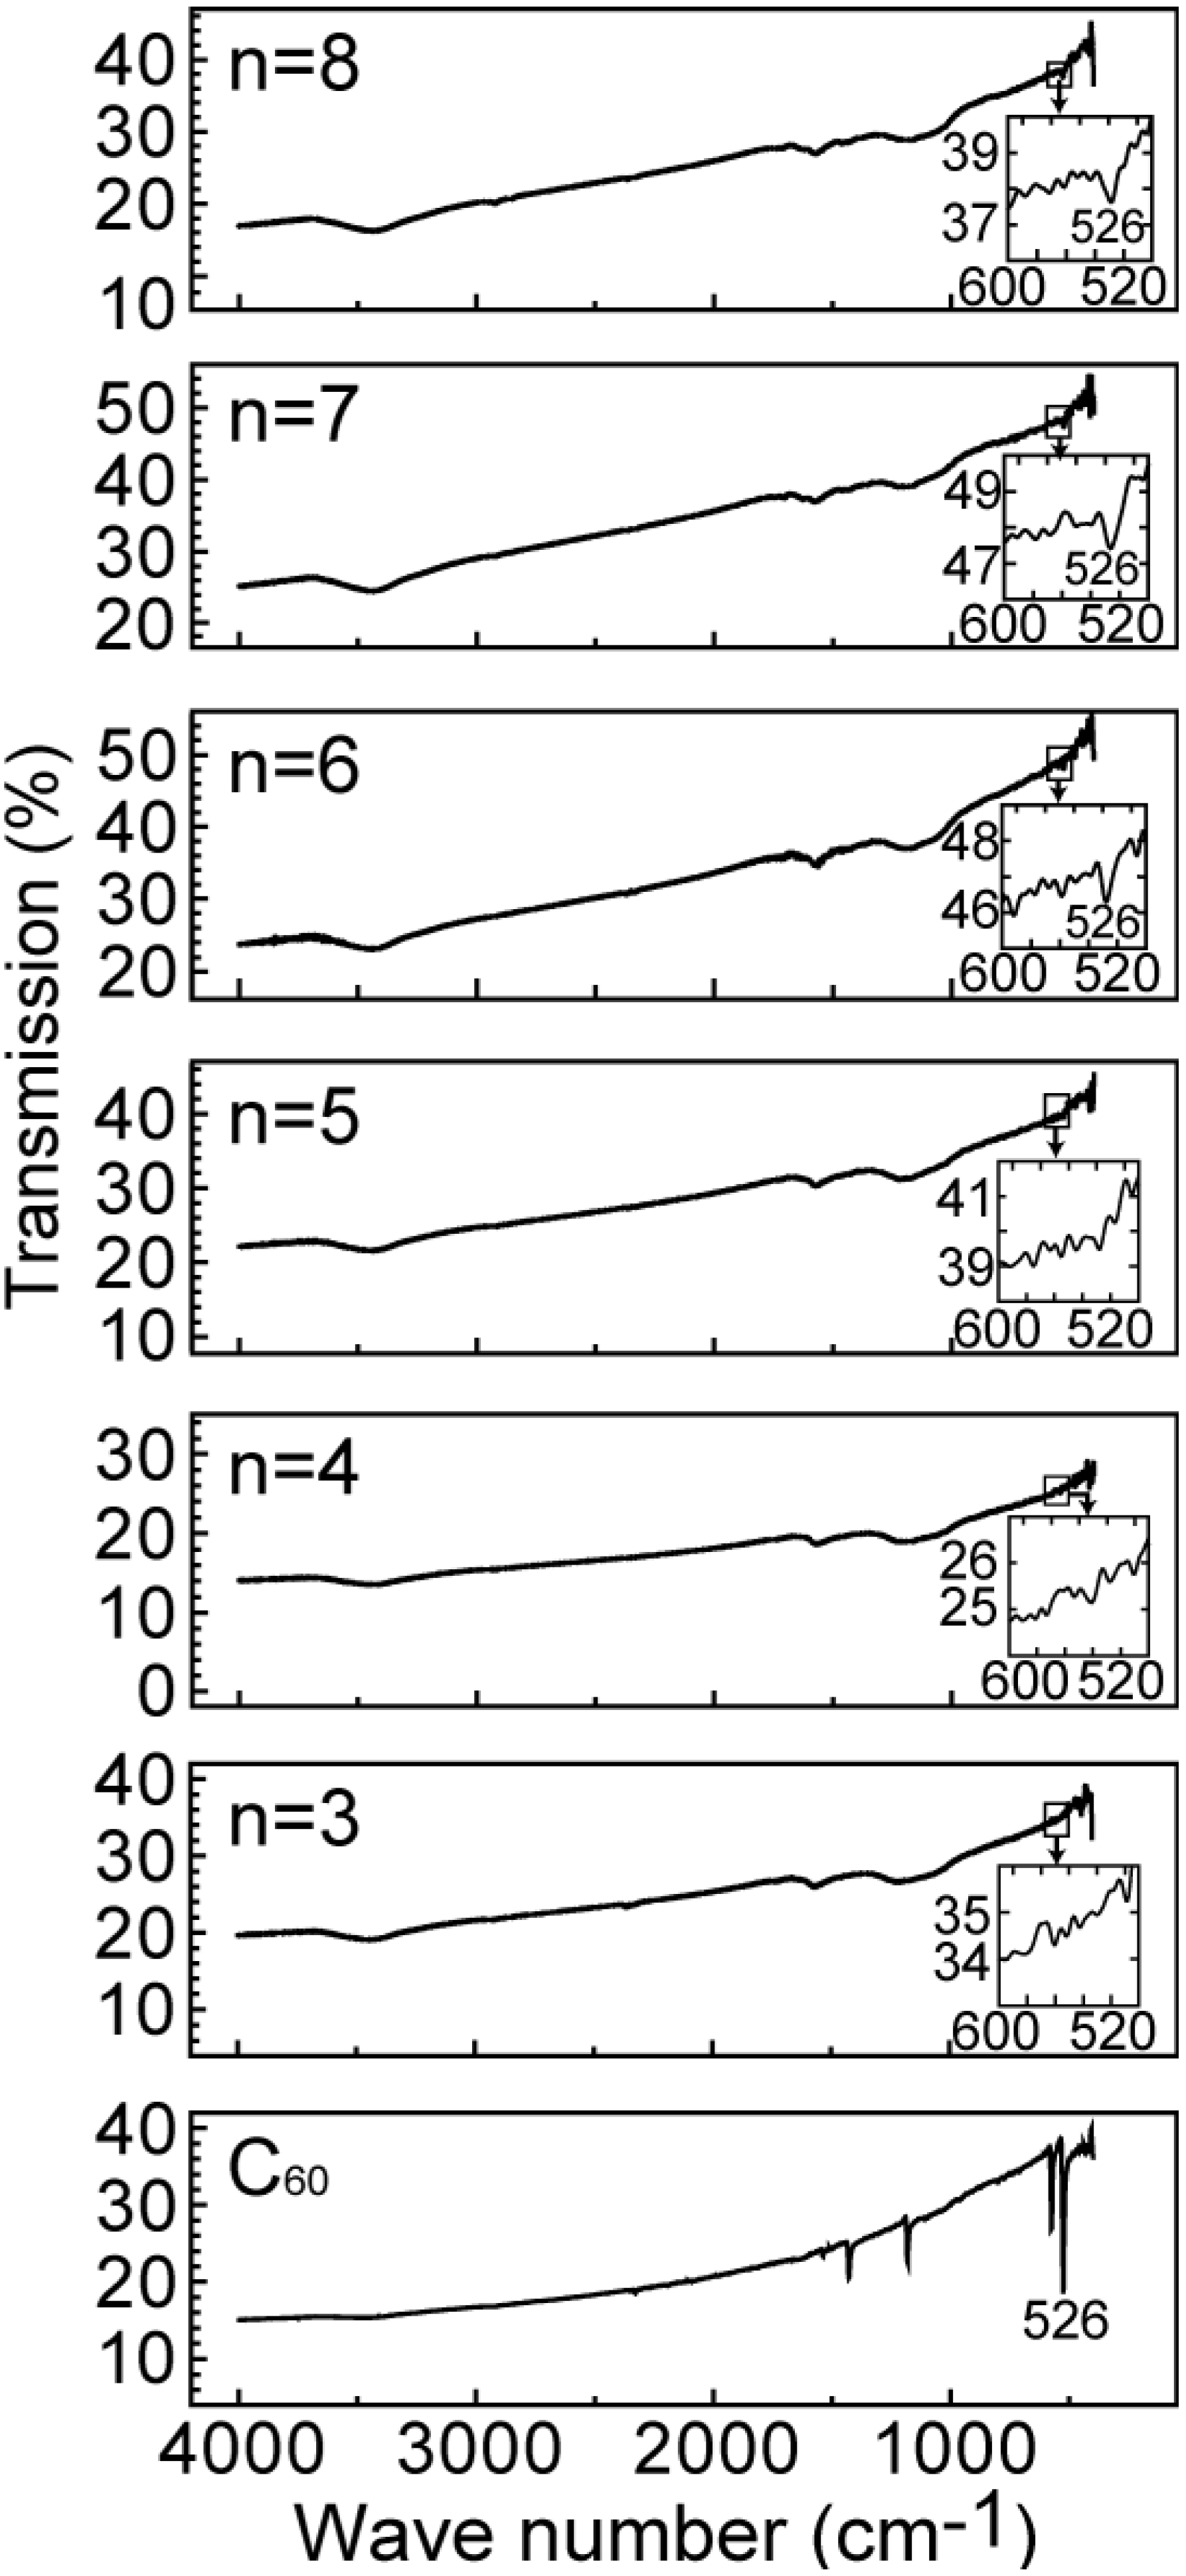
Figure 4 show the FT-IR spectra for the specimens of
Figure 2. The FT-IR spectra from n = 6, n = 7 and n = 8 in
Figure 2b exhibit the C
60 intermolecular IR-active (
F1u) modes [
4], although those with the shorter alkylamine chains do not exhibit these modes. This result is consistent with the conclusion based on
Figure 2 that C
60 molecules can be intercalated into the GO with alkylamine chains longer than that of n = 5. However, one mode of 526 cm
−1 among IR-active (
F1u) modes only appears in these FT-IR spectra because the number of C
60 molecules included in the specimens is rather small.
Figure 4.
FT-IR spectra for the specimens of
Figure 2. The C
60 intermolecular IR-active (
F1u) modes are indicated by the inset of each panel of the figure.
Figure 4.
FT-IR spectra for the specimens of
Figure 2. The C
60 intermolecular IR-active (
F1u) modes are indicated by the inset of each panel of the figure.
The rotational dynamics of C
60 molecules between graphenes have been investigated by
13C NMR in the temperature range from room temperature to −80 °C. We prepared C
60 materials 20–30% enriched in
13C in order to increase the
13C NMR signal. The present specimen was mixed with Na
2SO
4 in a weight ratio of 1:50 to avoid arcing in an NMR probe. The NMR experiments were performed at 75.4 MHz for
13C in an external field of 7.1 T by the pulse inversion recovery method.
13C NMR spectra were taken by Fourier transforming the signal following the π/2 pulse. The typical π/2 pulse width was 5.4 μs. It is well known that for C
60 molecules in solid C
60 at room temperature, large rotational motion averages out the chemical-shift anisotropy (CSA) and the
13C NMR spectra show motional narrowing of 2.5 ppm in width. In contrast, spectra broaden at low temperature and develop the CSA power pattern with a CSA tensor with the principle values δ
11 = 213 ppm, δ
22 = 182 ppm, and δ
33 = 33 ppm [
4].
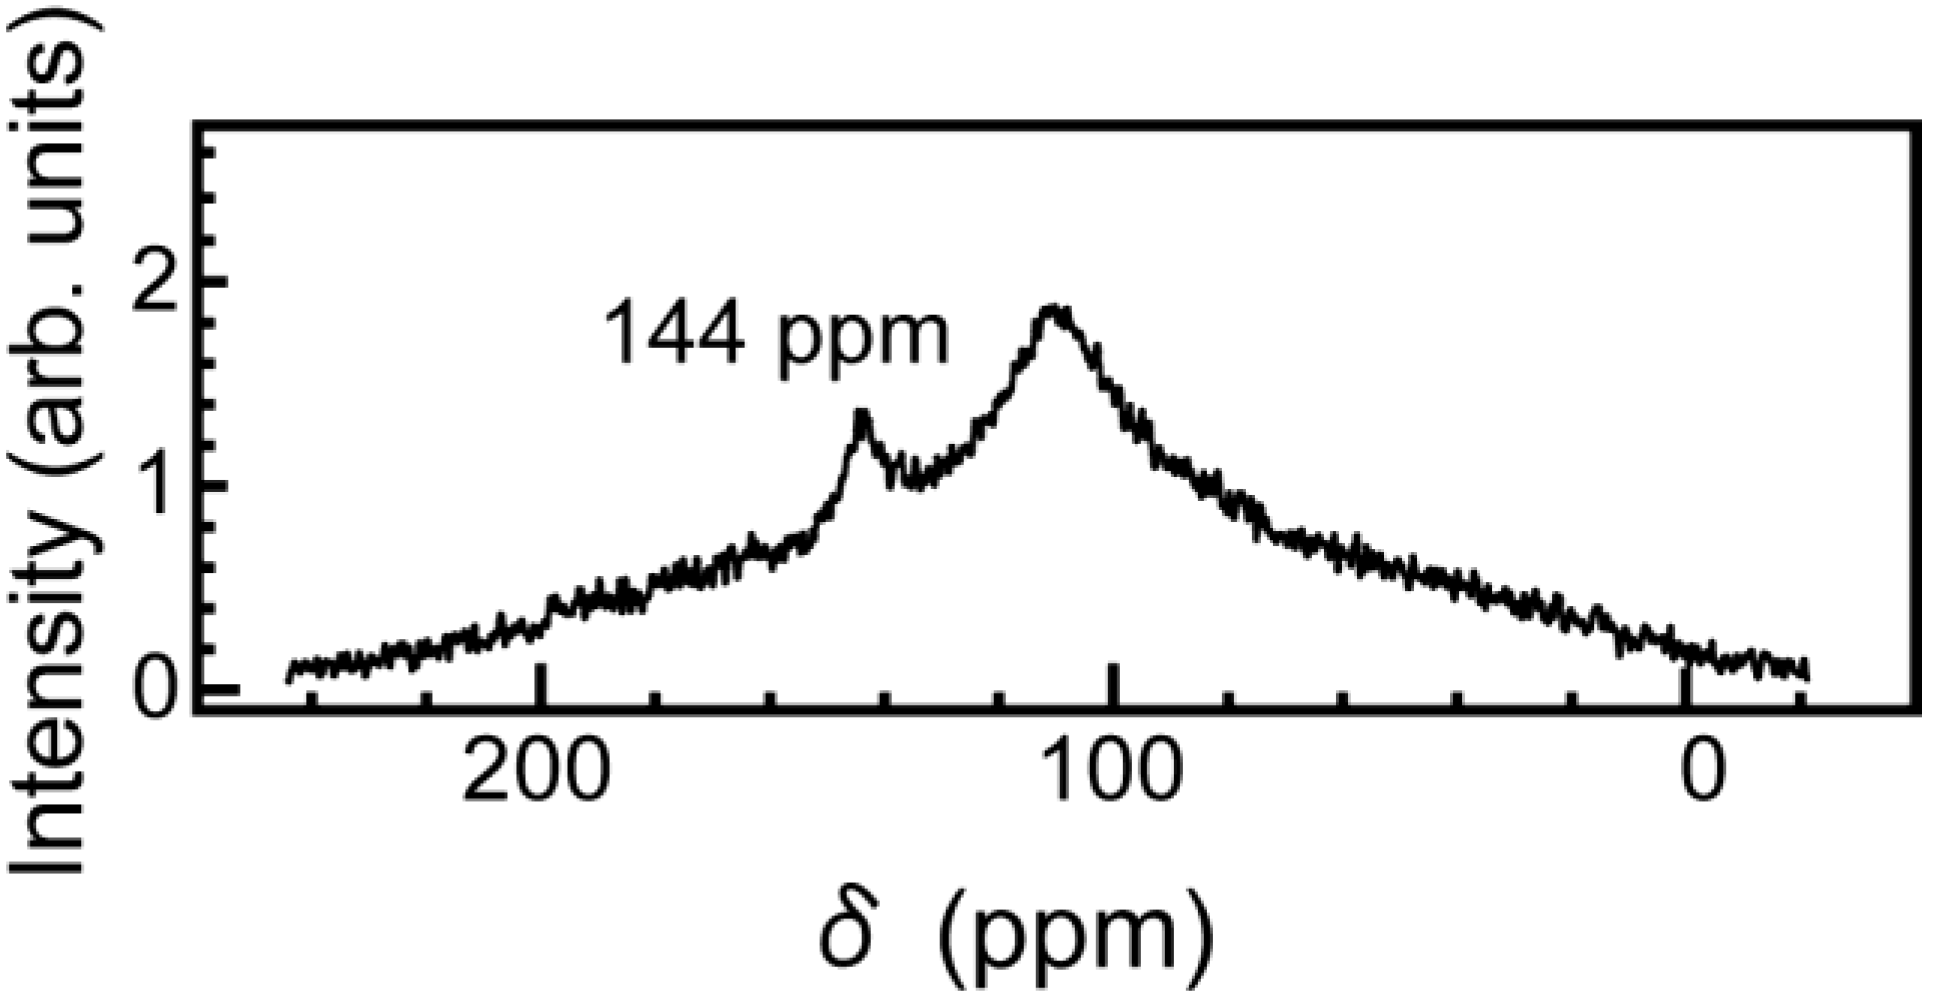
Figure 5 shows the
13C NMR spectra for the specimens of
Figure 2 at room temperature, where the
13C NMR spectrum at room temperature is the same as that at the temperature of −80 °C. Only one sharp line with a peak position of 144 ppm was observed, and its line shape is a Gaussian-like function with an FWHM value of 5 ppm. The positions are in good agreement with the average principle values for C
60 molecules in solid C
60, and the linewidth is about one-twentieth narrower than that of the powder pattern. These observations clearly demonstrate the lack of the polymerization [
5] of C
60 molecules in the present material. Furthermore, the observed Gaussian-like line shape means a motional narrowing and that C
60 molecules rotate quasi-freely with a correlation time on the order of 10 ps. This correction time is similar to that of the same case [
6]. This means that no strong bonding such as chemical bonding between the graphenes and C
60 molecules is made, and C
60 molecules easily rotate for outer force.
Figure 5.
The
13C NMR spectra for the specimens shown in
Figure 2 at room temperature. Only one sharp line with a peak position of 144 ppm [
4] was observed.
Figure 5.
The
13C NMR spectra for the specimens shown in
Figure 2 at room temperature. Only one sharp line with a peak position of 144 ppm [
4] was observed.
Many lubricant agents contain solid particles, such as commercial colloidal dispersions of graphite, tungsten disulfide, molybdenum disulfide (MoS
2), or polytetrafluoroethylene as additive to enhance the lubricating ability of the base oil or grease. Their lubricating properties are generally attributed to a layered structure on the molecular level with weak bonding between layers. Such layers are able to slide relative to each other with minimal applied force, thus giving them their good tribological properties. We added this nanocomposite to the commercially available grease and evaluated the performance of that as the additive of lubricant. The lubricating performance is tested using a four-ball tester with four balls. The machine including the four-ball tribosystem has been used to determine the lubricant properties. The four-ball test is the industrial standard test method for measuring the wear preventive characteristics of a lubricant. Placed in a bath of the test lubricant, three fixed steel balls are put into contact with a fourth ball in rotating contact at set conditions. Lubricant wear protection properties are measured by comparing the average wear scars on the three fixed balls. The smaller the average wear scar, the better the protection. The nanocomposite was added to the base grease and the lubricant wear protection properties of the grease were investigated. Similarly, the lubricating properties of the greases blended with widely used additives such as graphite and MoS
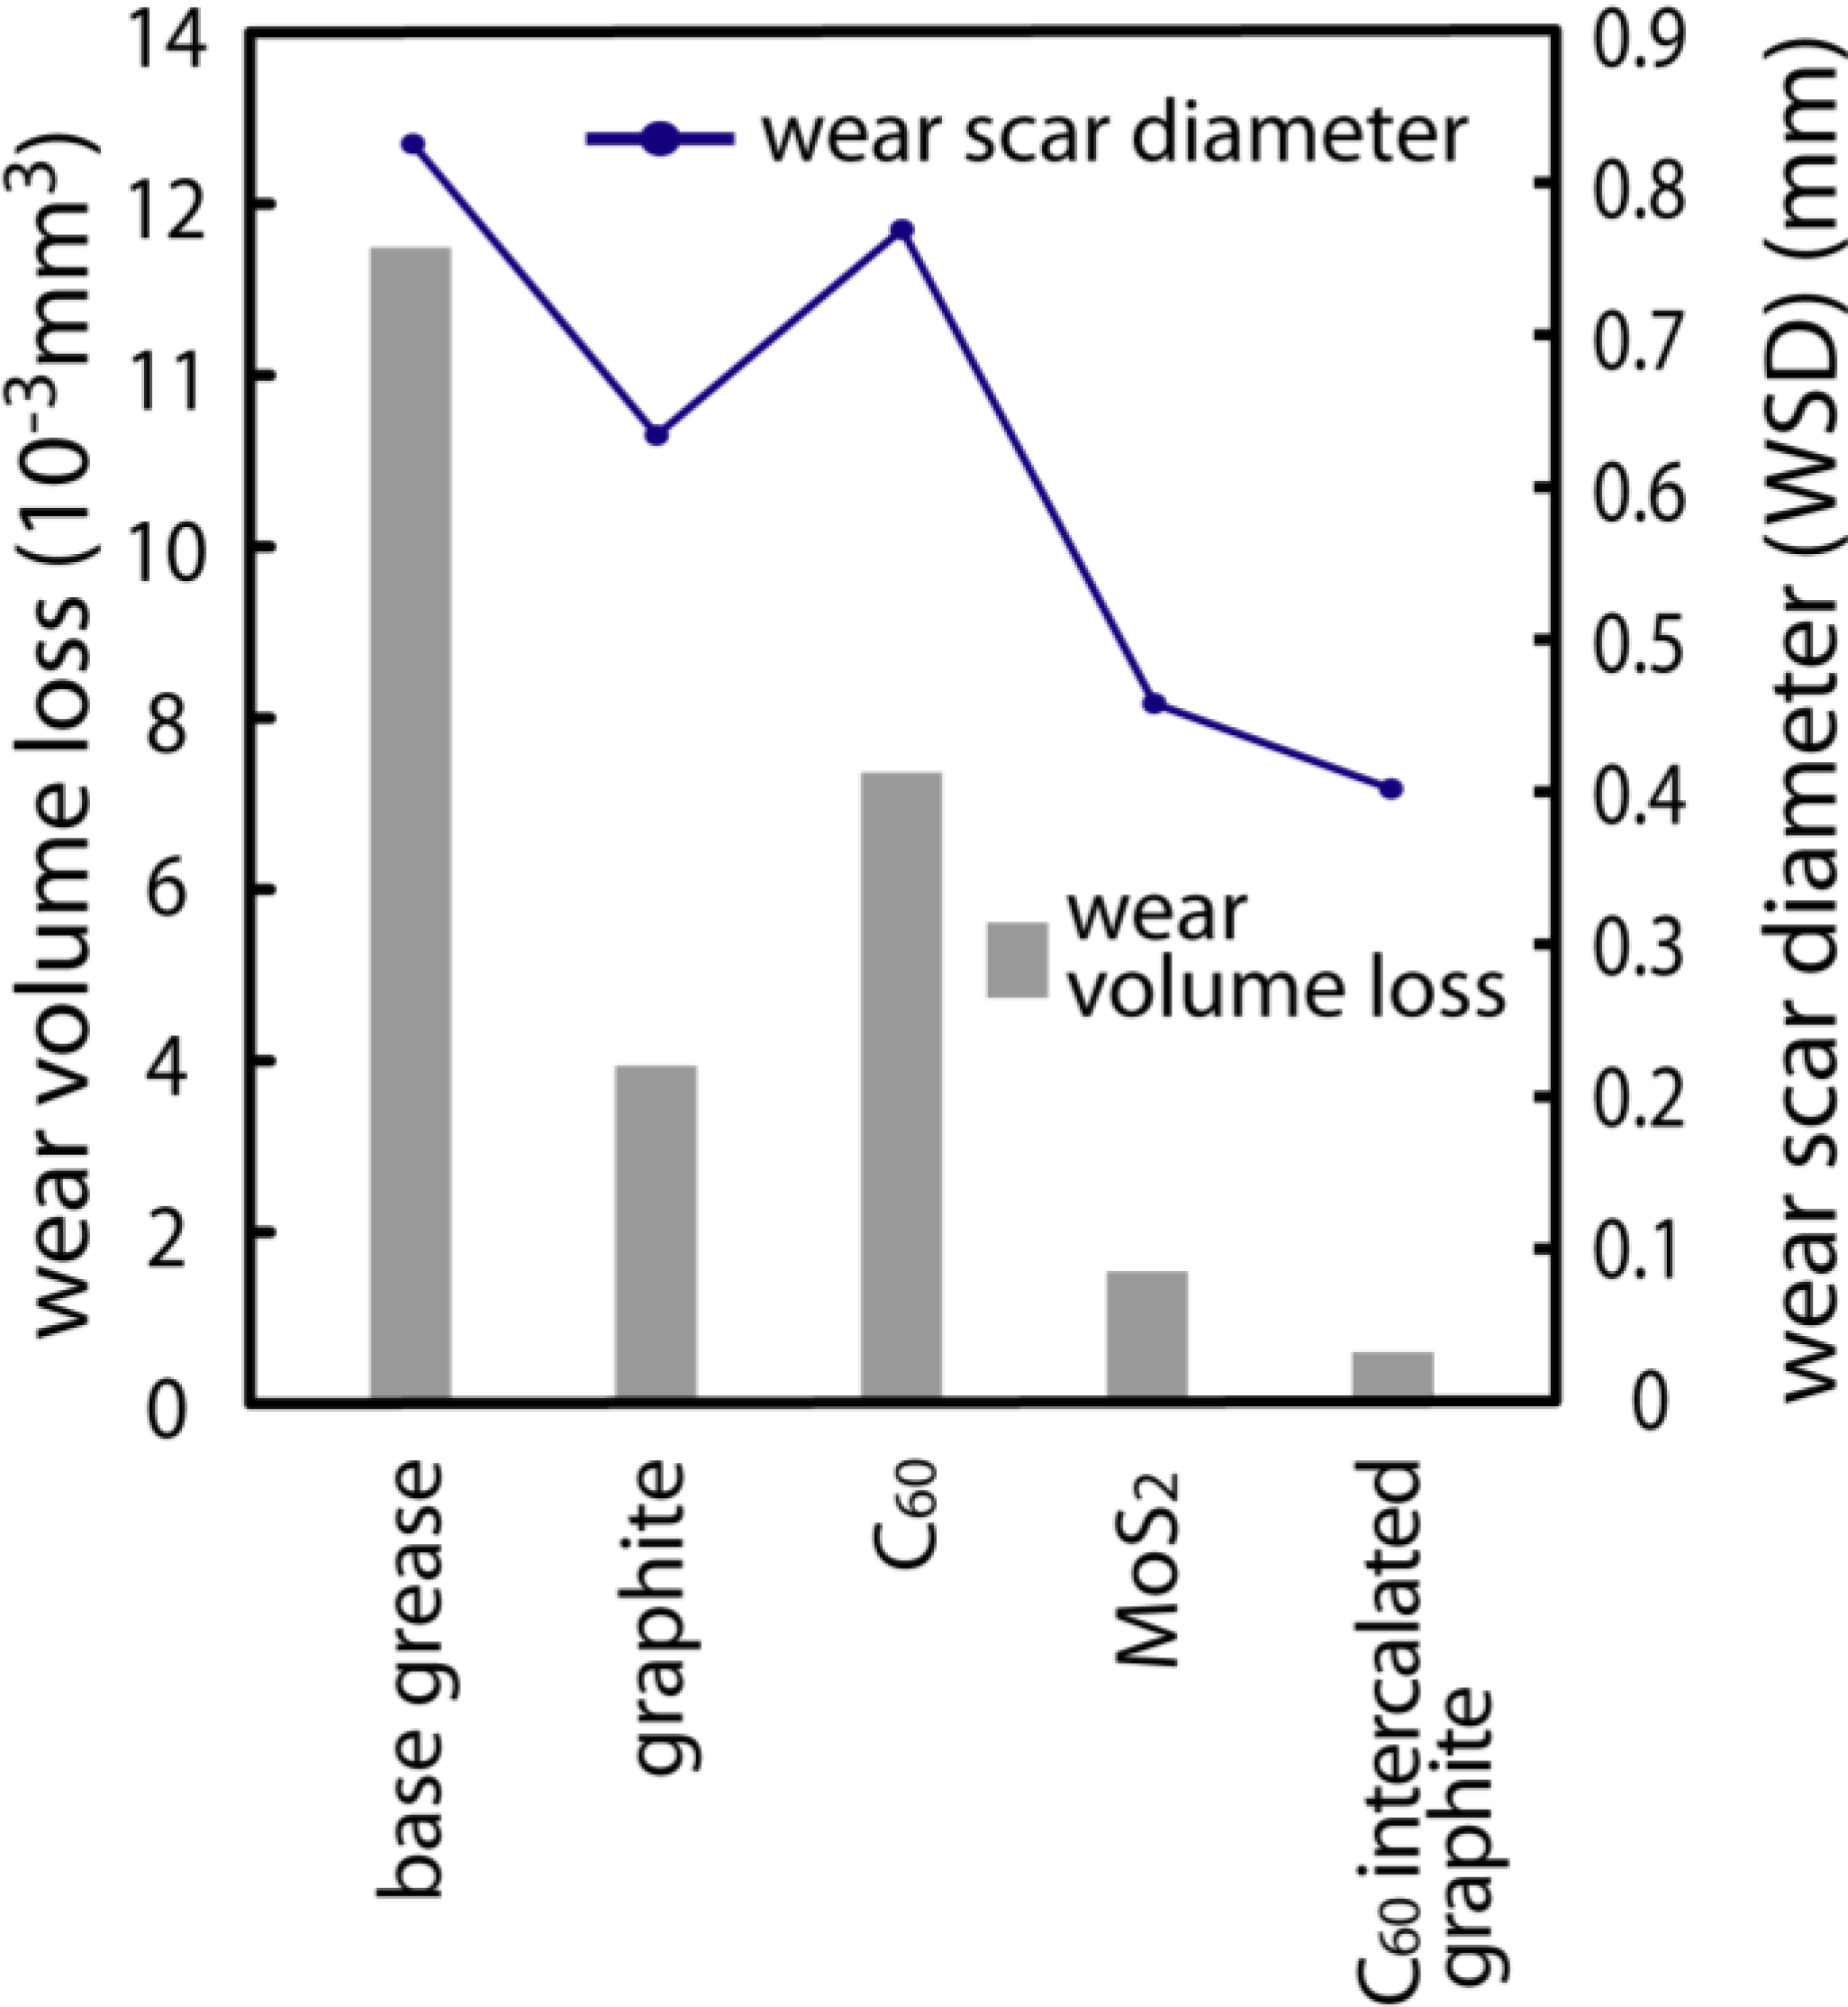
2 were also studied. The lubricating tests were carried out under the lubrication of 2 g grease containing 1.0% additives. Those were evaluated by measuring the wear scar diameter (WSD) and wear volume loss of the test ball. The test was conducted at a rotating speed of 1200 rpm and a constant load of 441 N for 1 h. The results of the wear behaviors for some lubricating additives are shown in
Figure 6. According to
Figure 6, the WSD and wear volume loss of the test ball for the base grease were 0.83 mm and 11.7 × 10
−3 mm
3, respectively. The WSD and wear volume loss of MoS
2 were 0.46 mm and 0.9 × 10
−3 mm
3, respectively. The WSD and wear volume loss of graphite were 0.68 mm and 2.9 × 10
−3 mm
3, respectively. It is found that the base grease with graphite did not represent better lubricating performance than that with MoS
2, but it largely improved in tribological quality relative to the base grease. C
60 itself is decidedly inferior in lubricating performance as compared with the generally used lubricating additives such as MoS
2 and graphite. Here, it should be noted that the WSD and wear volume loss of the nanocomposite materials were 0.41 mm and 0.5 × 10
−3 mm
3, respectively. Thus it is found that the nanocomposite prepared shows a much better lubricating performance than that with other additives. This result suggests that a C
60 monolayer between graphenes strongly influences lubricating performance. Further detailed investigations of the tribological behaviors and the lubrication mechanism of the nanocomposite are now in progress.
Figure 6.
The wear scar diameter (WSD) and wear volume loss of the test ball for the grease with various kinds of additives.
Figure 6.
The wear scar diameter (WSD) and wear volume loss of the test ball for the grease with various kinds of additives.
