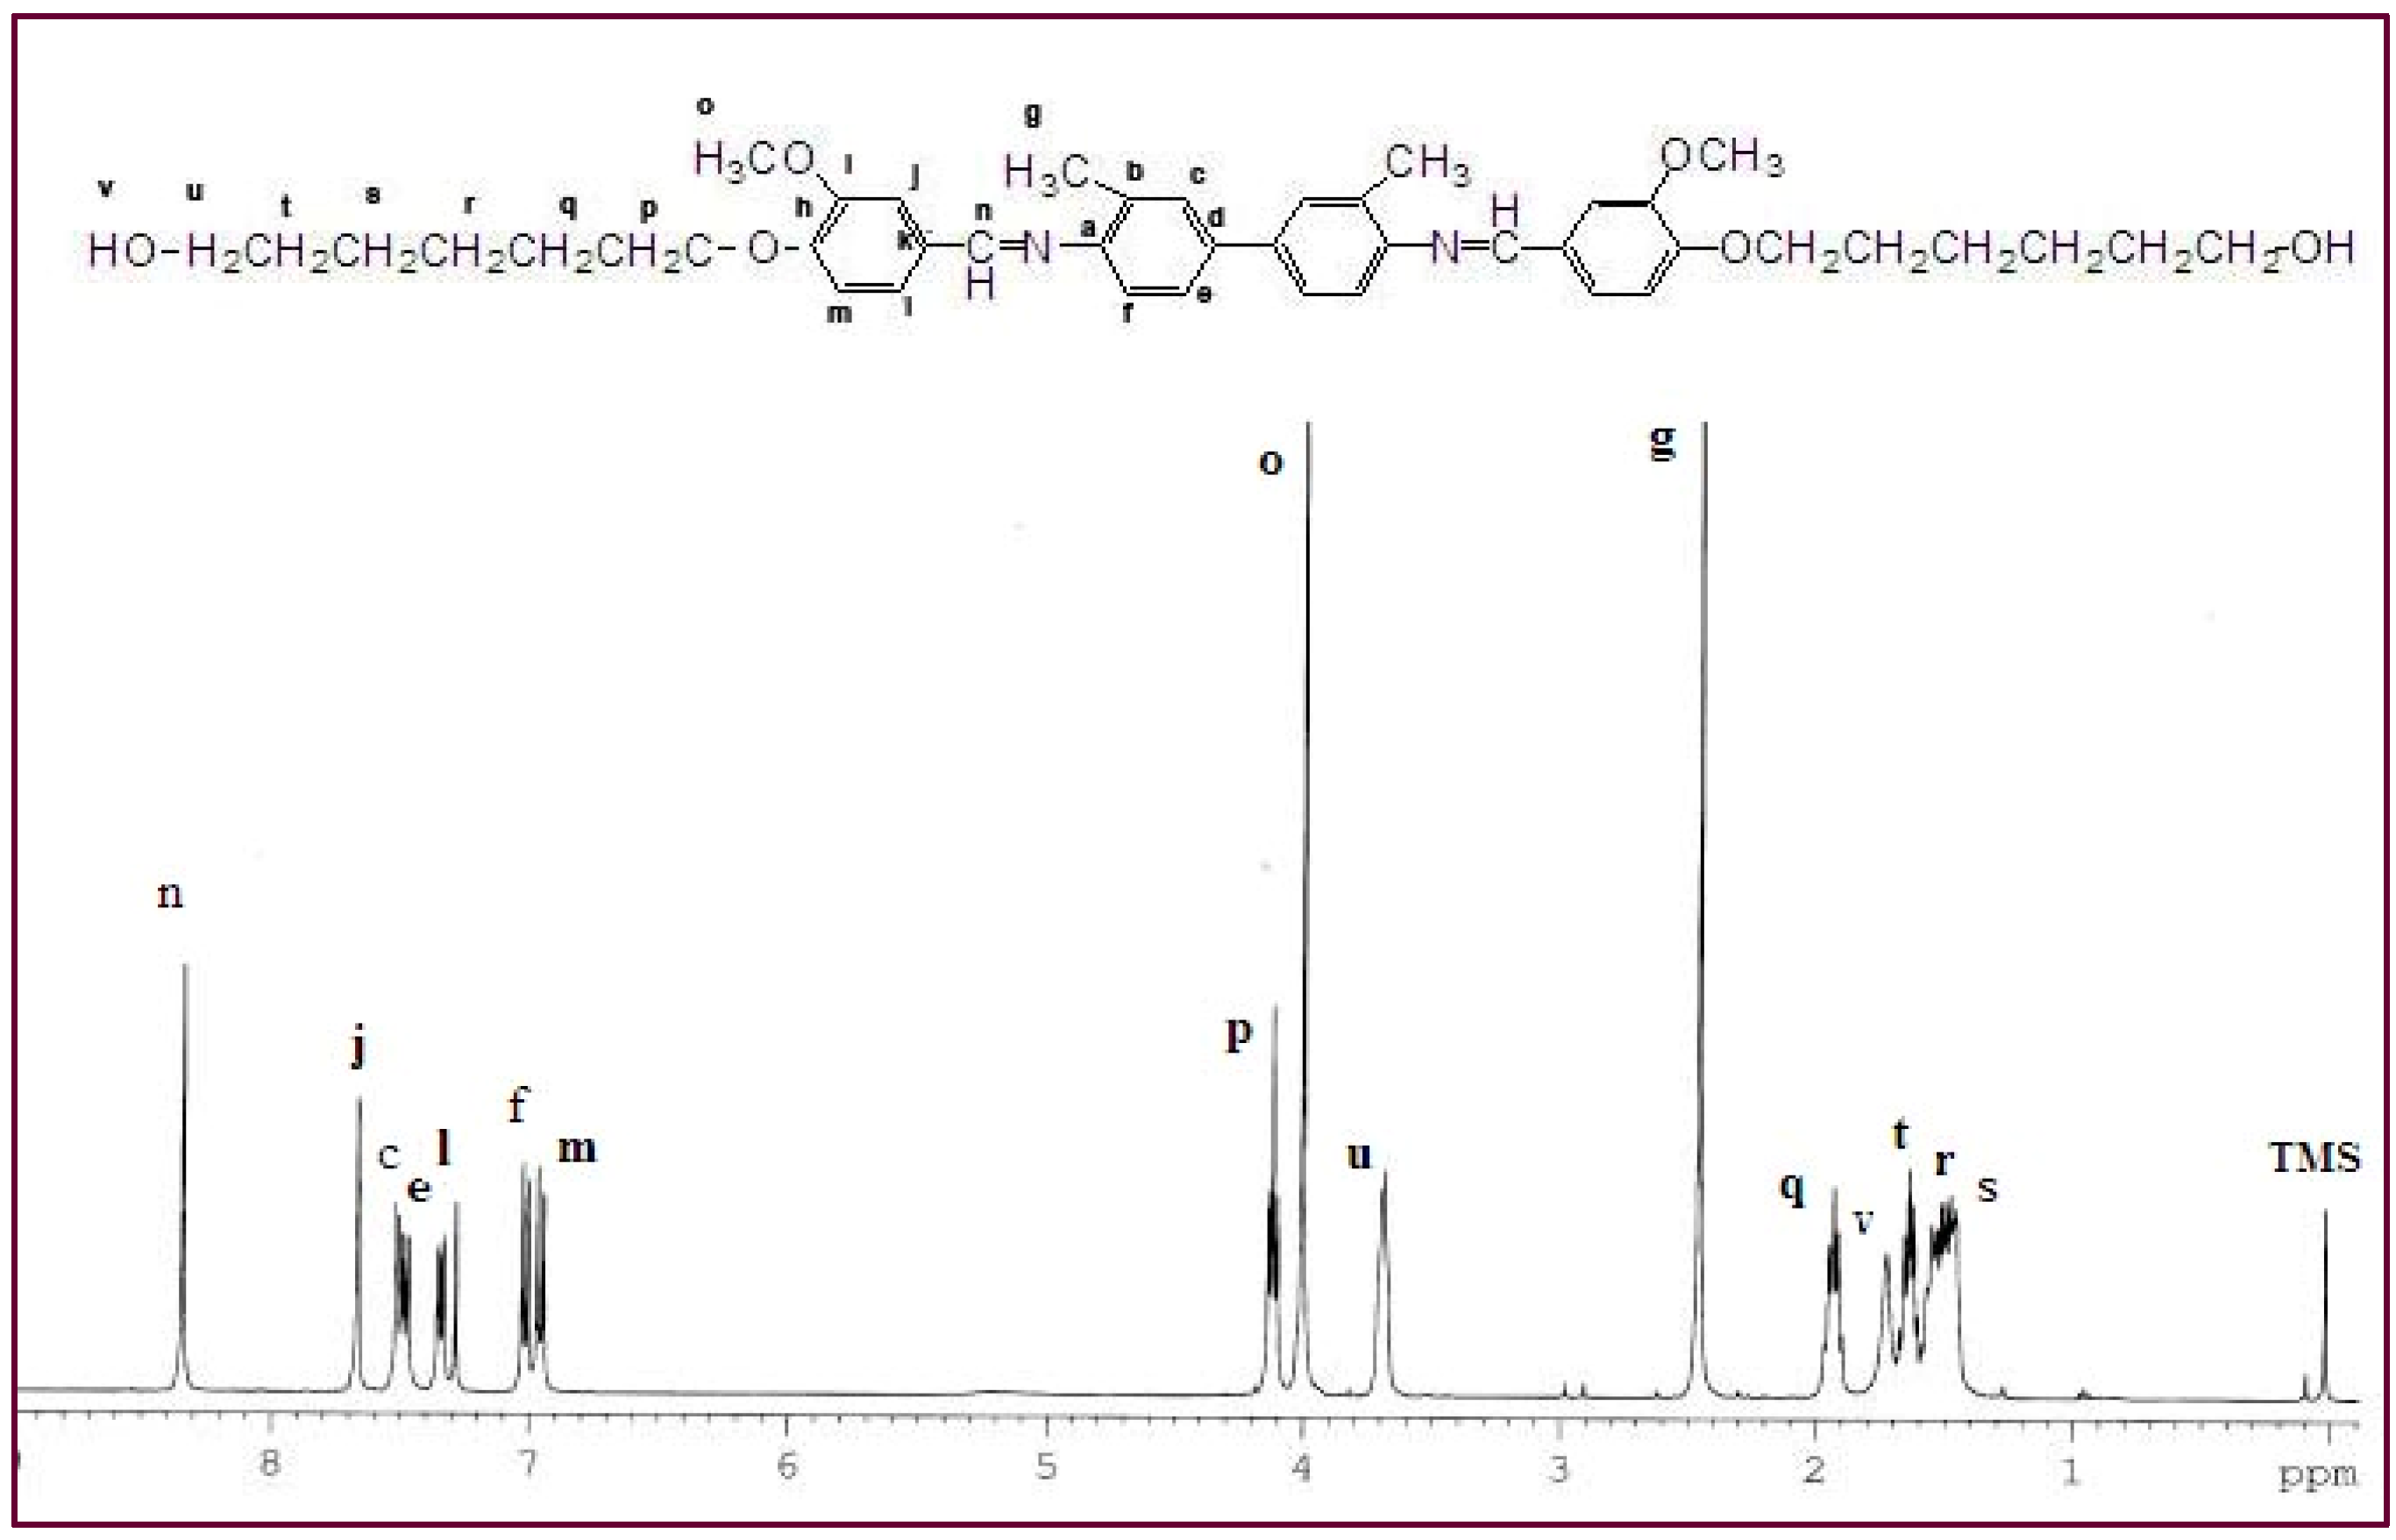
2.1. Microstructure and Purity Characterizations
The structural characteristics of
Ia and
IIa were confirmed by
1H-NMR spectroscopy. The NMR spectrum for
Ia (
Figure 1) confirmed the presence of the azomethine group (-CH=N-) at δ = 8.33 ppm. Two characteristic singlet peaks centered at 4.03 and 2.46 ppm were due to the protons in the methoxy group (-OCH
3) and the methyl group in o-tolidine (Ph-CH
3), respectively. No peak was detected at δ = 4.03 ppm for
IIa, indicating the absence of a methoxy group (-OCH
3). A multiplet in the range of δ = 7.00–7.68 ppm was observed for both
Ia and
IIa and these peaks corresponded to the protons in the aromatic rings. The appearance of a multiplet at δ = 1.46–1.95 in
Ia and
IIa was attributed to the presence of aliphatic chains (-(CH
2)
6-) in these two mesogenic diols.
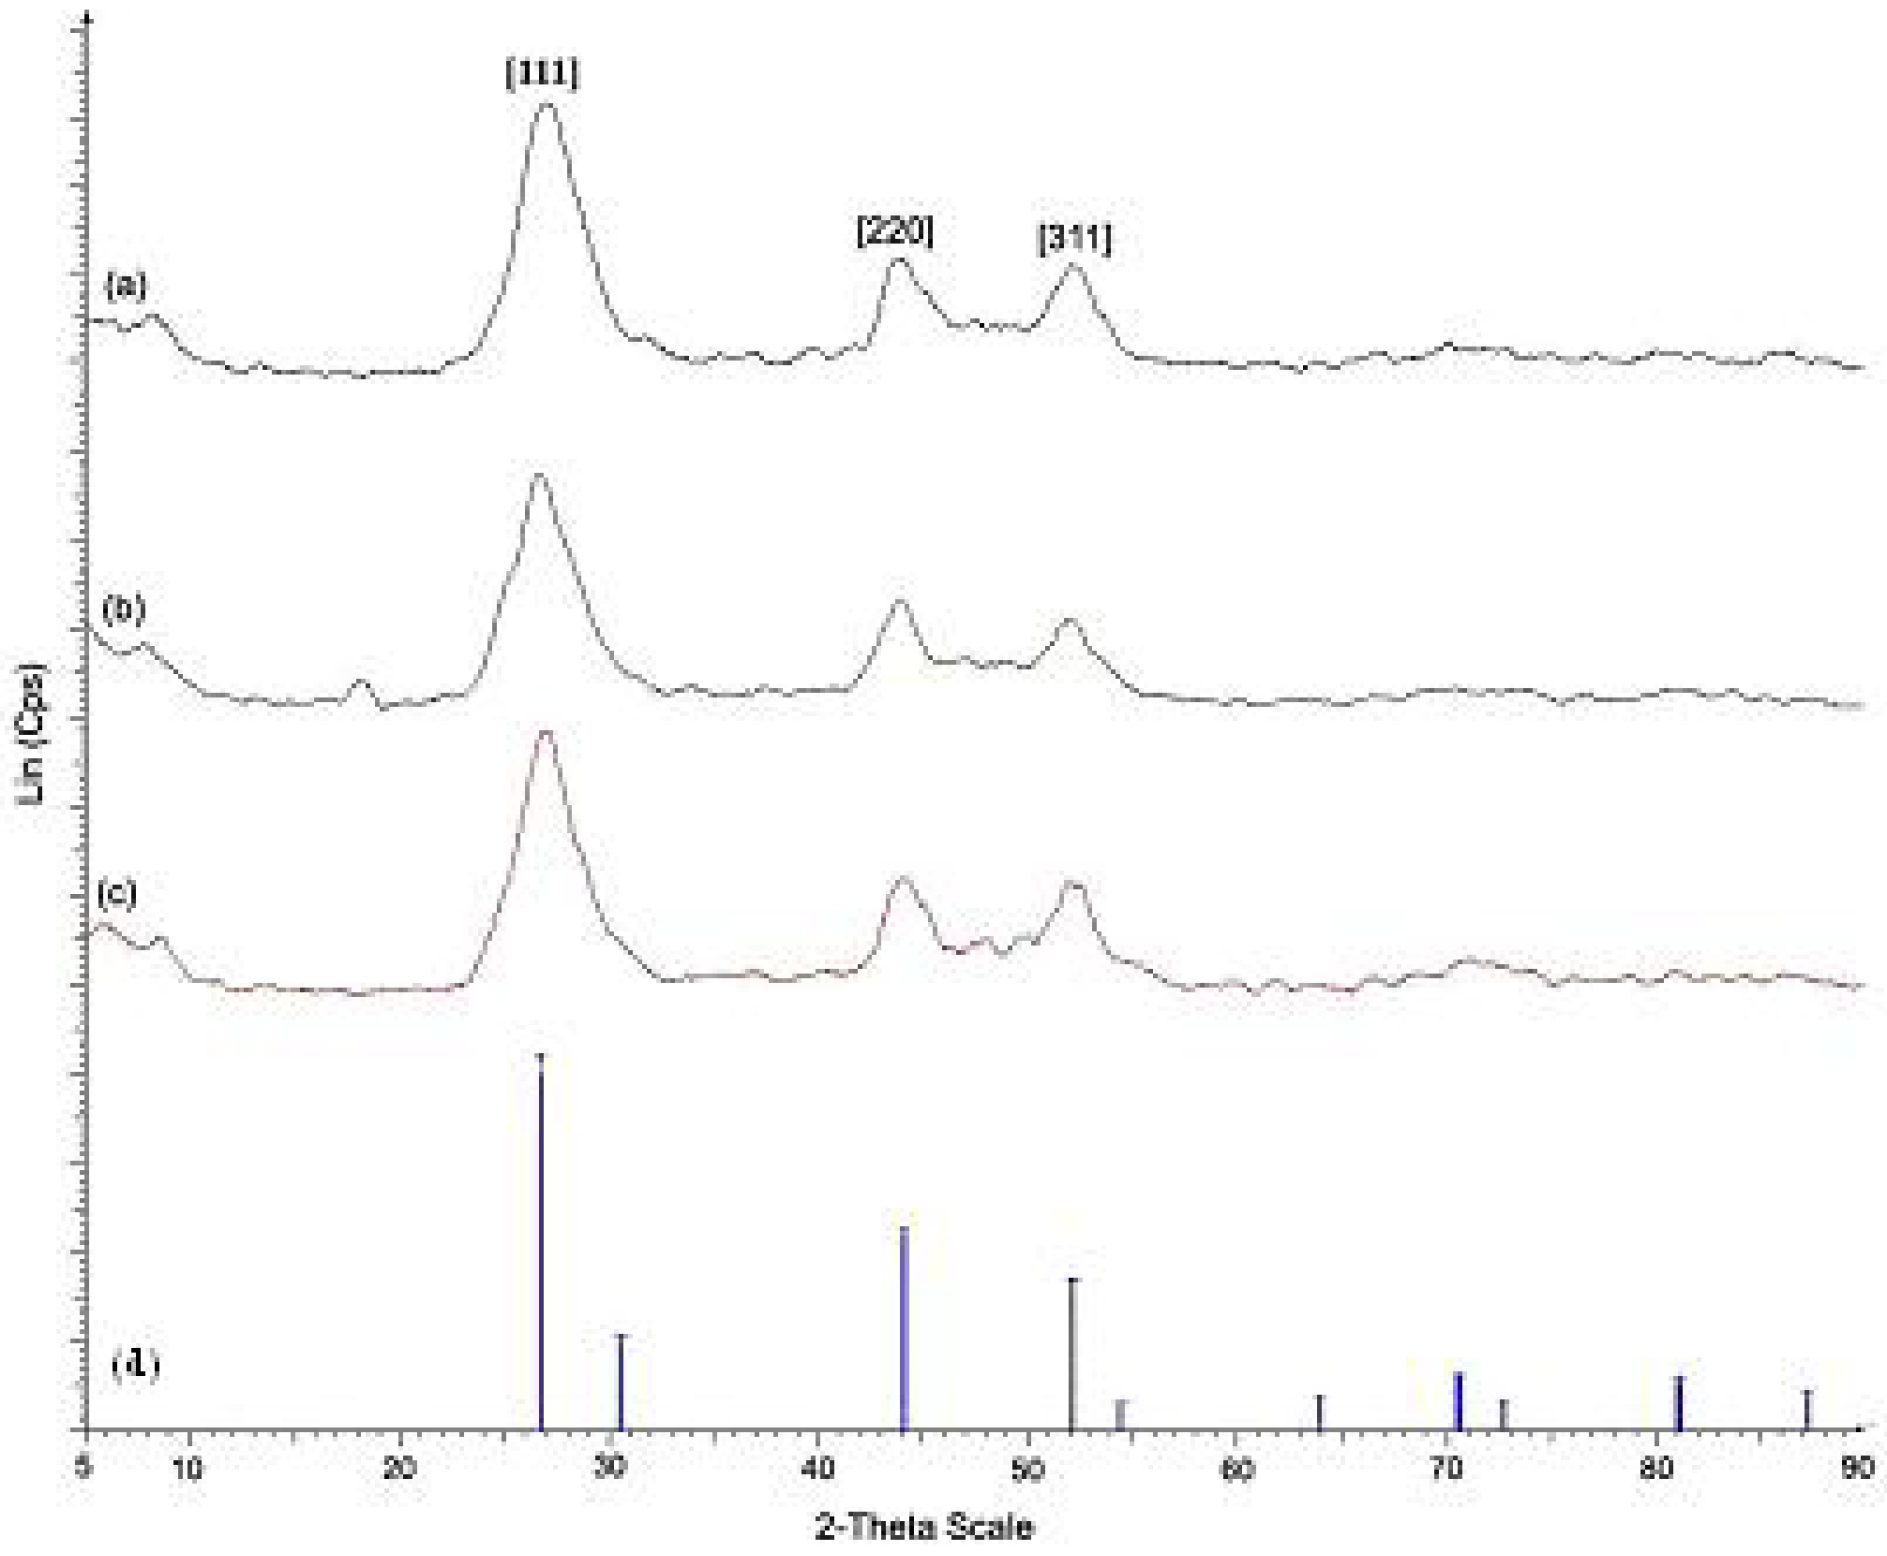
Figure 2 shows the XRD patterns for pure CdS nanoparticles and CdS nanocomposites of
Ia and
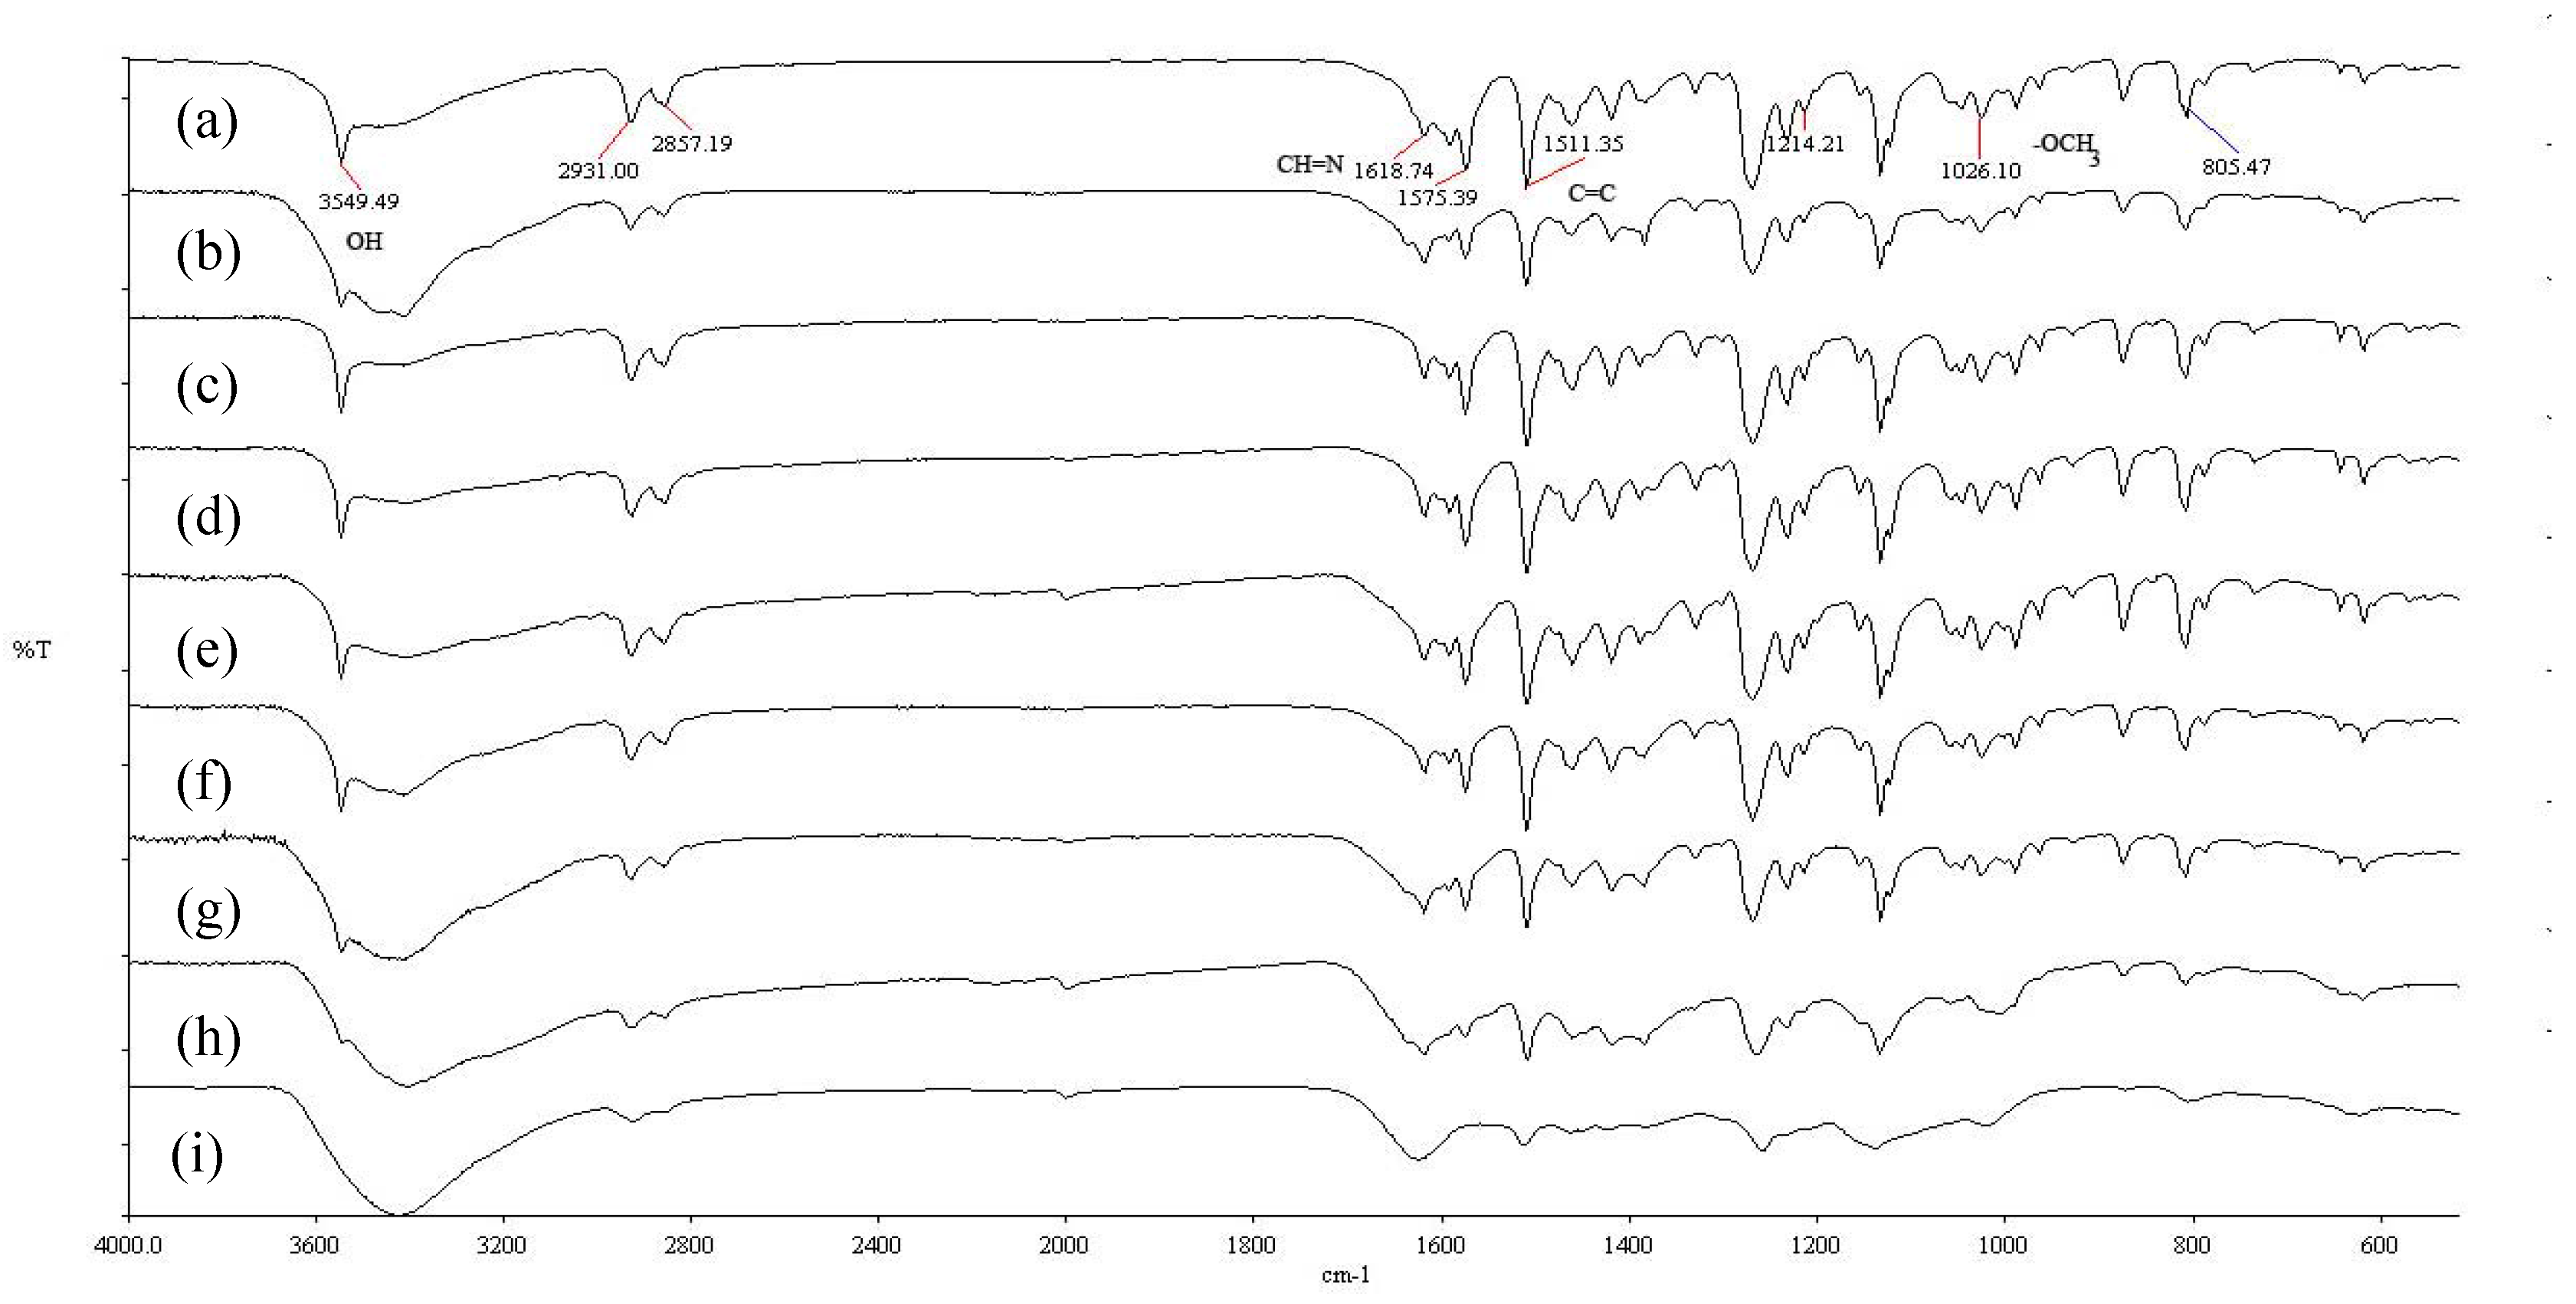
IIa at the mass composition of 1.0:1.0. The XRD patterns obtained for both pure CdS and CdS nanocomposites corresponded to pure cubic CdS when compared with the standard reference (JCPDS 03-065-2887). Three peaks with 2θ values of 26.6, 44.0 and 52.0 appeared in the spectrum of each sample and may be assigned to the [111], [220] and [311] Miller indices. FT-IR measurements were carried out for the CdS nanocomposites that were synthesized with different mass compositions, and these measurements were compared with the data that was obtained for pure
Ia and
IIa. The FT-IR analysis of pure
Ia showed an absorption band at 1618 cm
-1, indicating the presence of the azomethine group (-CH=N-). The peaks at 1576 cm
-1 and 1511 cm
-1 were due to aromatic ring skeletal vibrations and C=C bond stretching [
21], respectively. The peak at 1026 cm
-1 could be assigned to the methoxy group (-OCH
3) present in
Ia. The peak at 808 cm
-1 confirmed the presence of
para-disubstitution on the aromatic rings; this peak was associated with the bending mode of aromatic ring hydrogen atoms [
21]. The peaks at 3423 cm
-1 and 3550 cm
-1 could be assigned to the hydroxyl groups (–OH). The spectra of CdS:
Ia nanocomposites (
Figure 3) showed a change in peak intensity in the 3423–3550 cm
-1 range for mass compositions of 0.2:1.0 (w/w) and above, but the other peaks in the FT-IR spectra remained unchanged. Similar assignments were observed in the FT-IR spectrum for
IIa. However, no absorption band associated with the methoxy group was found in
IIa. The broadening of the peaks could be attributed to interactions of the polar groups (e.g., the -OH groups) in
Ia or
IIa with the surface of a nanoparticle via a physical mechanism such as van der Waals forces, dipole interactions or weak hydrogen bonds [
7].
Figure 1.
1H-NMR spectrum of Ia.
Figure 1.
1H-NMR spectrum of Ia.
Figure 2.
X-ray diffraction patterns of (a) CdS nanoparticles (b) CdS: Ia nanocomposites (1.0:1.0) (c) CdS: IIa nanocomposites (1.0:1.0) (d) cubic CdS (JCPDS 030-65-2887).
Figure 2.
X-ray diffraction patterns of (a) CdS nanoparticles (b) CdS: Ia nanocomposites (1.0:1.0) (c) CdS: IIa nanocomposites (1.0:1.0) (d) cubic CdS (JCPDS 030-65-2887).
Figure 3.
FT-IR spectra for CdS: Ia nanocomposites of (a) pure Ia and (b-i) mass compositions of 0.1:1.0 to 1.0:1.0 (w/w).
Figure 3.
FT-IR spectra for CdS: Ia nanocomposites of (a) pure Ia and (b-i) mass compositions of 0.1:1.0 to 1.0:1.0 (w/w).
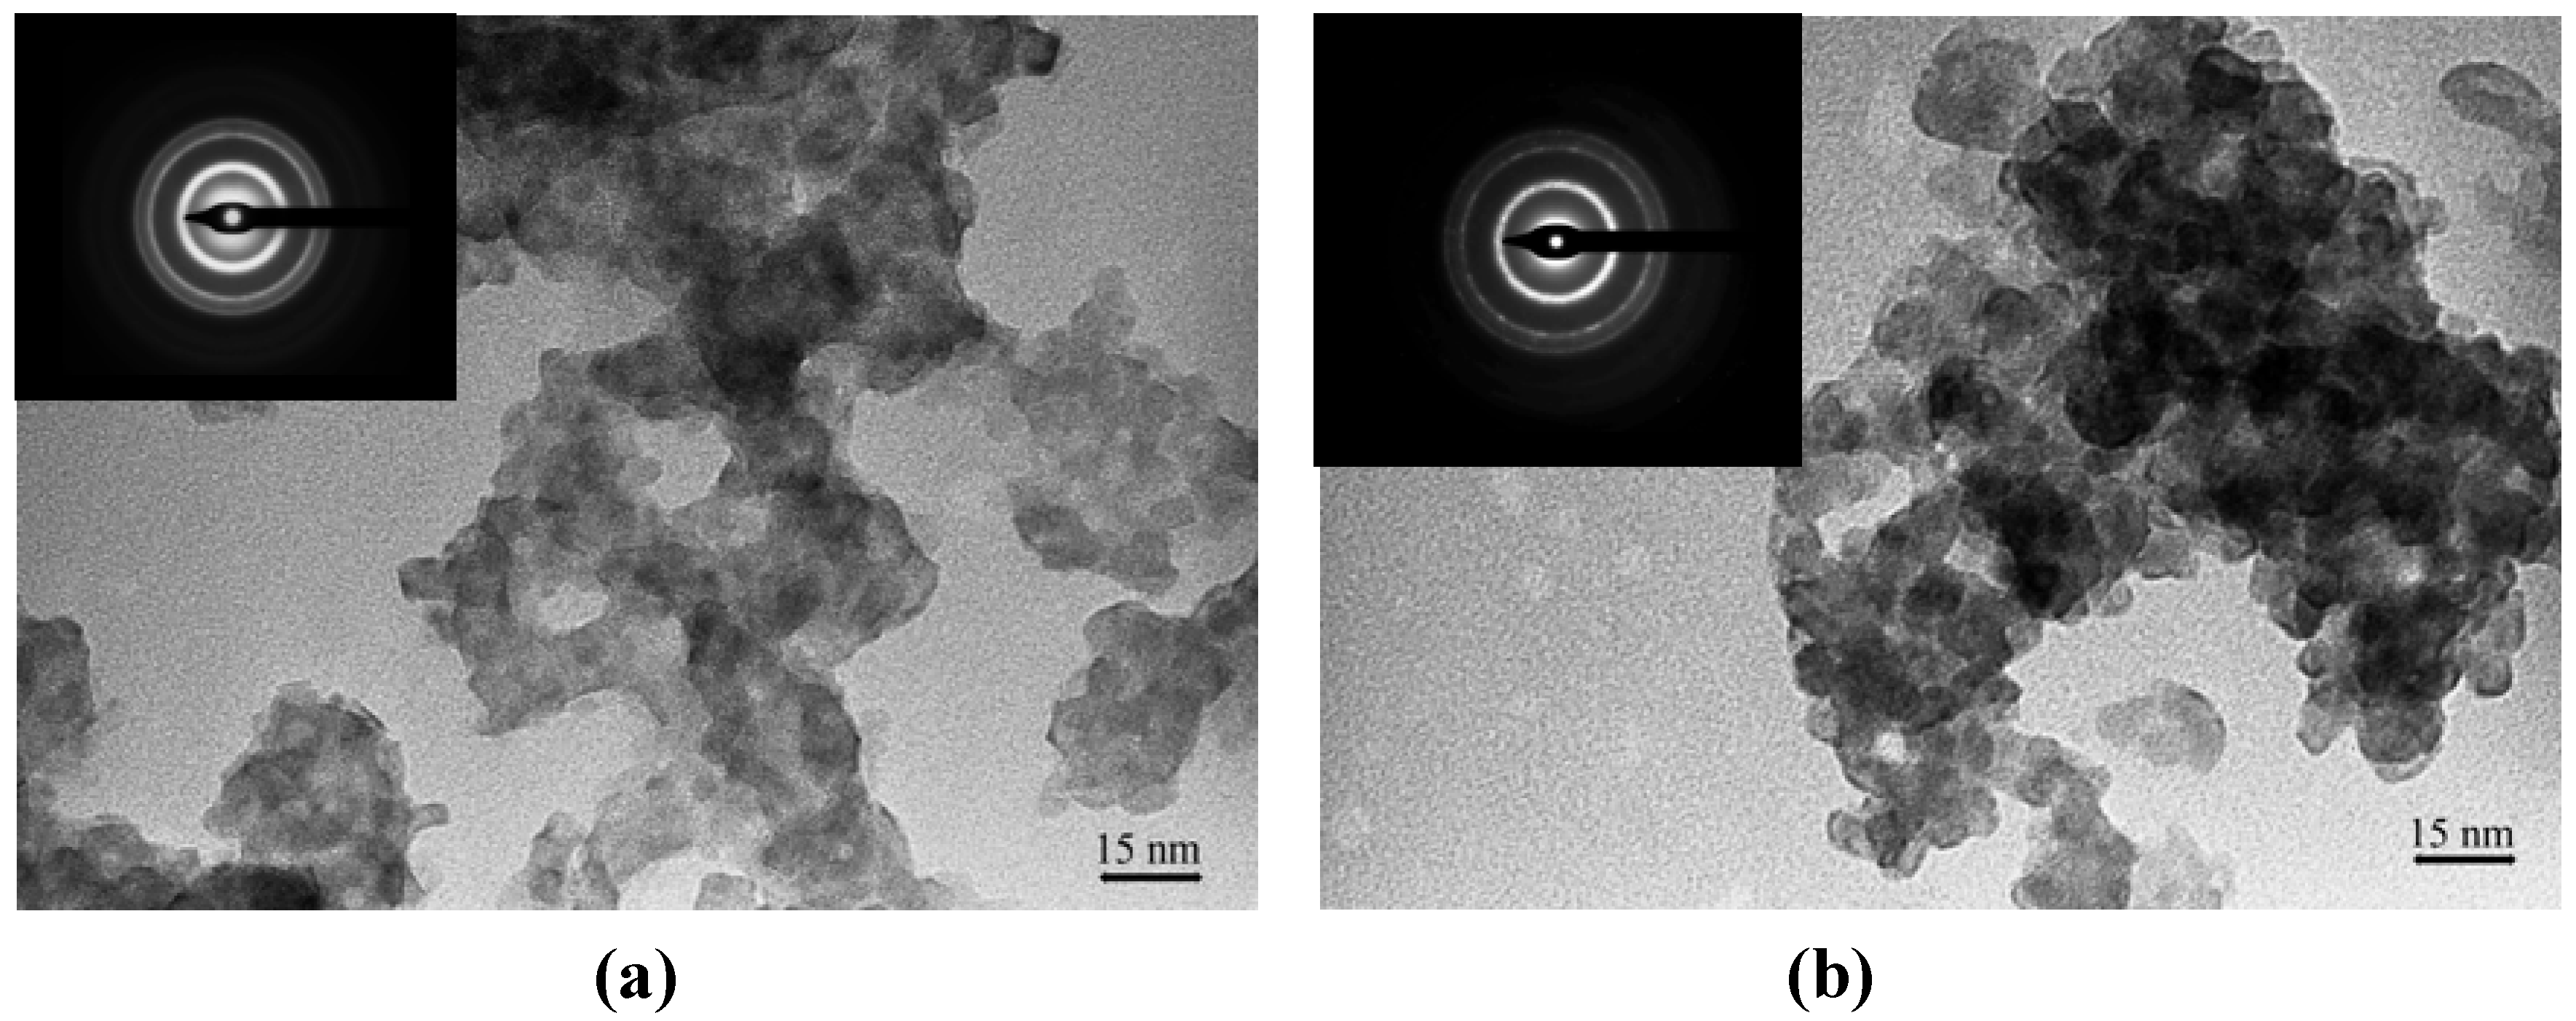
The TEM micrographs (
Figure 4) show that the particles were distinguishable, but not well-resolved due to the presence of the matrix. However, the particles were not aggregated into a big structure, although the particles were in contact with each other. Most of the particles were similar in size and have irregular rounded shapes. The average particle size for both nanocomposites was less than 5.0 nm with a standard deviation of less than 1.0 nm.
Figure 4.
TEM images of (a) Ia and (b) IIa at mass composition of 1.0:1.0 (CdS: matrix, w/w) Insert: SAED images of CdS: matrix nanocomposites (a) Ia (b) IIa at mass composition of 1.0:1.0 (CdS: matrix, w/w).
Figure 4.
TEM images of (a) Ia and (b) IIa at mass composition of 1.0:1.0 (CdS: matrix, w/w) Insert: SAED images of CdS: matrix nanocomposites (a) Ia (b) IIa at mass composition of 1.0:1.0 (CdS: matrix, w/w).
The SAED images for each nanocomposite indicated that the measurements of major
d-spacings corresponded with the
d-spacings obtained from Pearson’s Crystal Data database: 1120352 of CdS hexagonal crystalline phase. The three major
d-spacings obtained for the CdS:
Ia nanocomposite were 0.338 nm, 0.205 nm and 0.174 nm, whereas for the CdS:
IIa nanocomposite, the major
d-spacings were 0.343 nm, 0.210 nm and 0.177 nm. These
d-spacings were measured from the three major rings and were assignable to the [002], [110] and [201] Miller indices. As mentioned earlier, the XRD spectrum suggested that the CdS is in the cubic crystalline phase. The observed inconsistency could be ascribed to the broadened peaks from the spectra as well as to the overlapping peaks between the XRD line of the hexagonal and cubic structures [
22].
Raman scattering analyses were performed on pure CdS and CdS nanocomposites of
Ia and
IIa at 15 ºC. CdS is known to be Raman active [
23] and, thus, could not be observed in the FT-IR spectra. Two characteristics of CdS LO phonon peaks were observed in all three samples (see
Figure 5). The 1-LO and its much weaker overtone, 2-LO, could be observed at 292 cm
-1 and 591 cm
-1, respectively, in both CdS nanocomposite samples when compared with the as-prepared pure CdS. The result was in agreement with the reports by other researchers [
24,
25]. These researchers have observed the surface mode peak of small CdS crystallites (size = 1 μm) at 292 cm
-l as well as its second order peak at 596 cm
-l. We also observed that the Raman intensity is the highest in the CdS nanocomposite of
Ia, followed by the CdS nanocomposite of
IIa and finally by pure CdS. The intensity of the change in the Raman bands could be influenced by the presence of
Ia and
IIa in the samples. When analyzed by PL spectroscopy, pure
Ia and
IIa have their own photoluminescence intensity values that also showed similar trends with the Raman pattern, as depicted in
Figure 5.
Figure 5.
Raman spectra for pure CdS and CdS nanocomposites for Ia and IIa at the mass composition (1.0:1.0, w/w).
Figure 5.
Raman spectra for pure CdS and CdS nanocomposites for Ia and IIa at the mass composition (1.0:1.0, w/w).
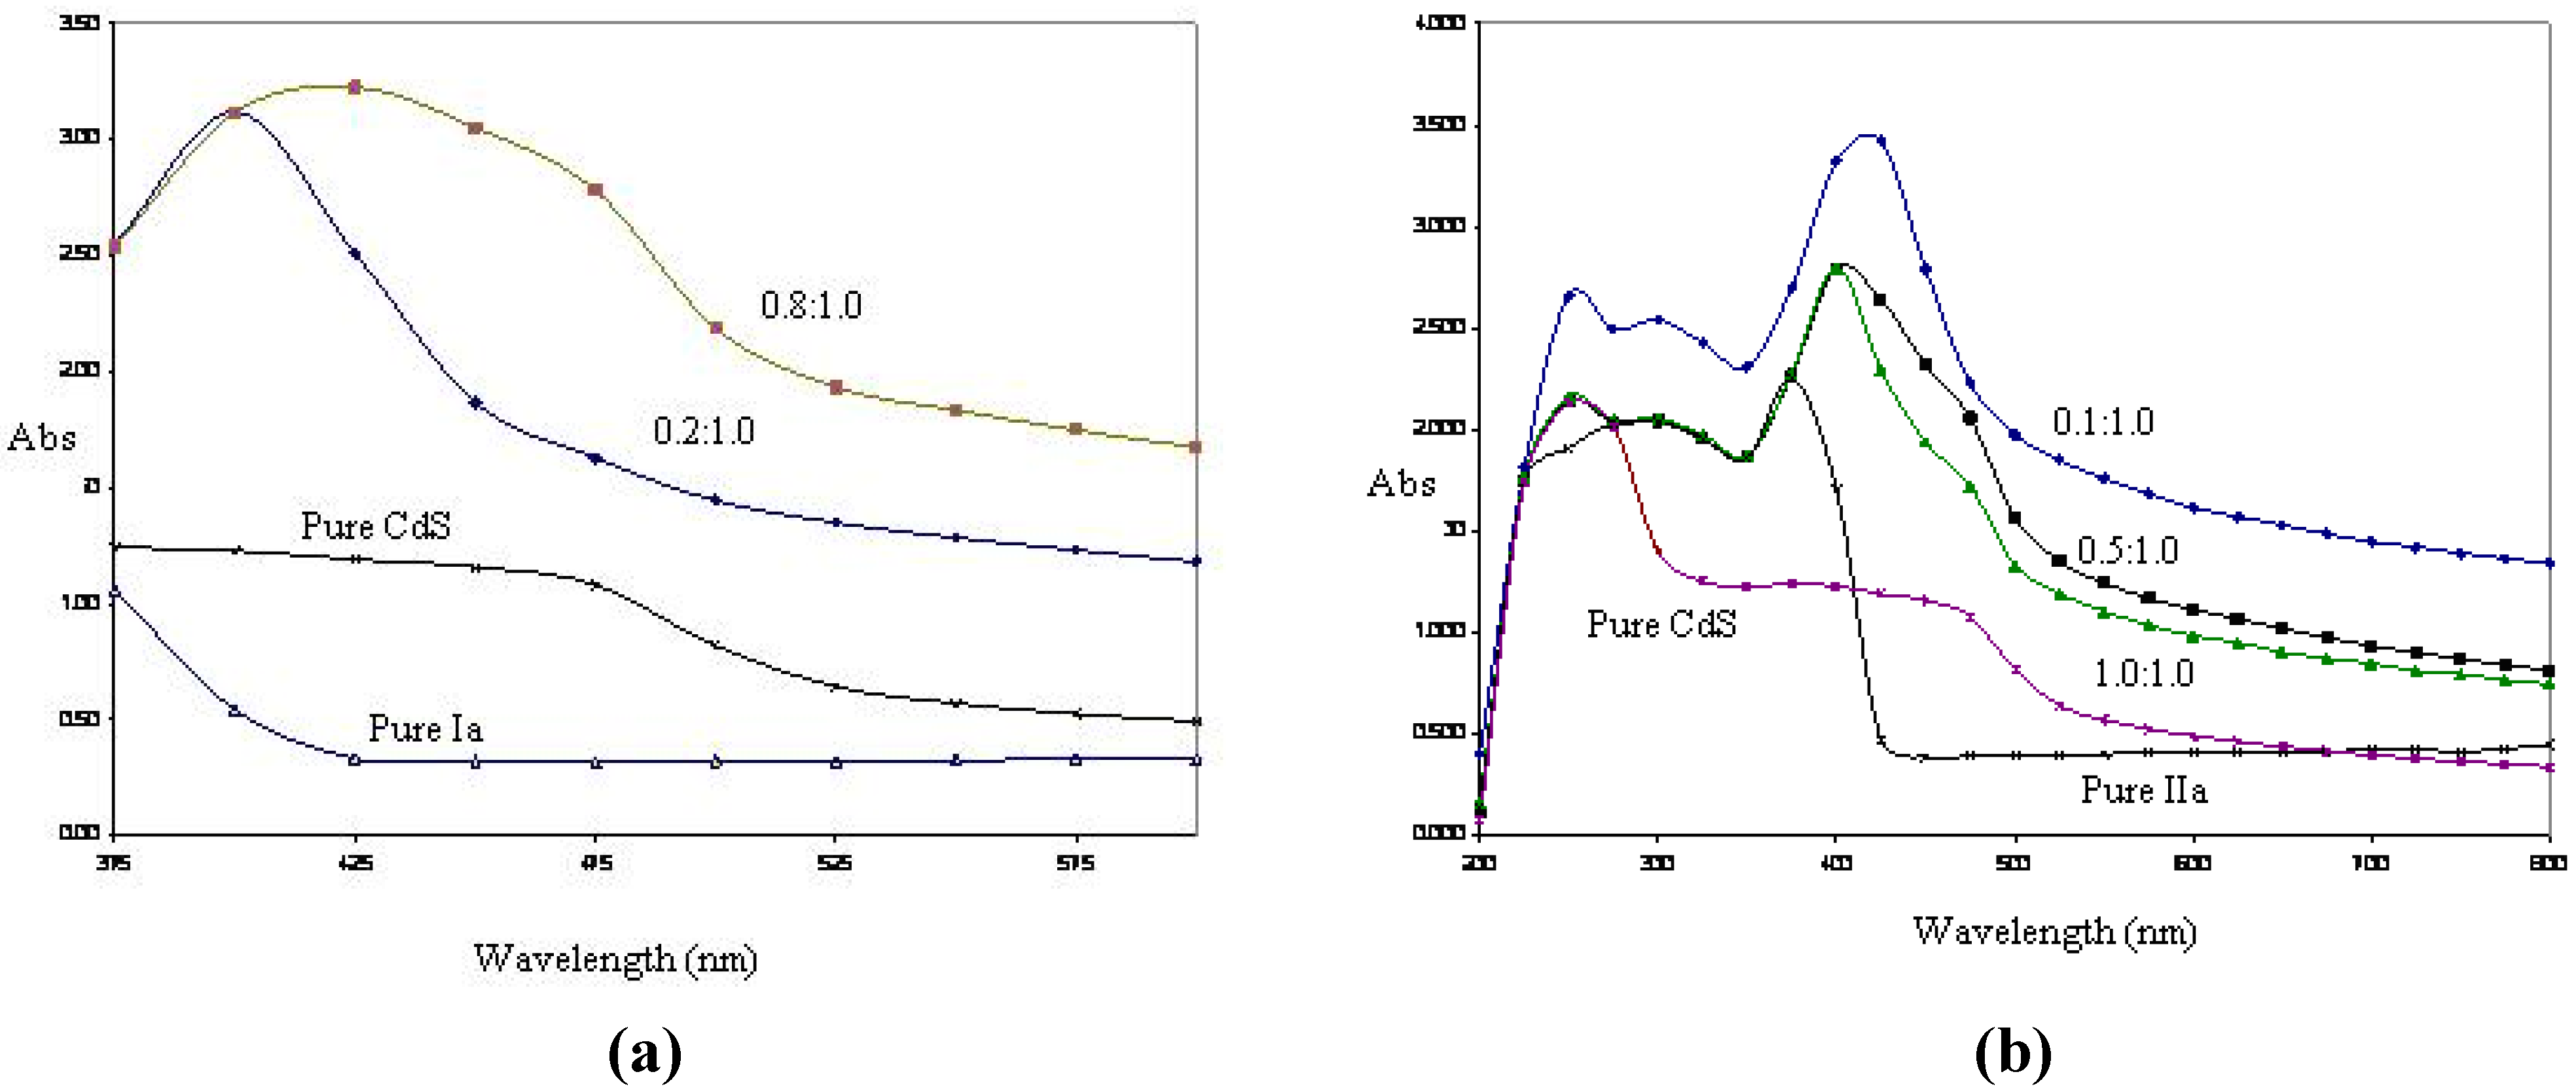
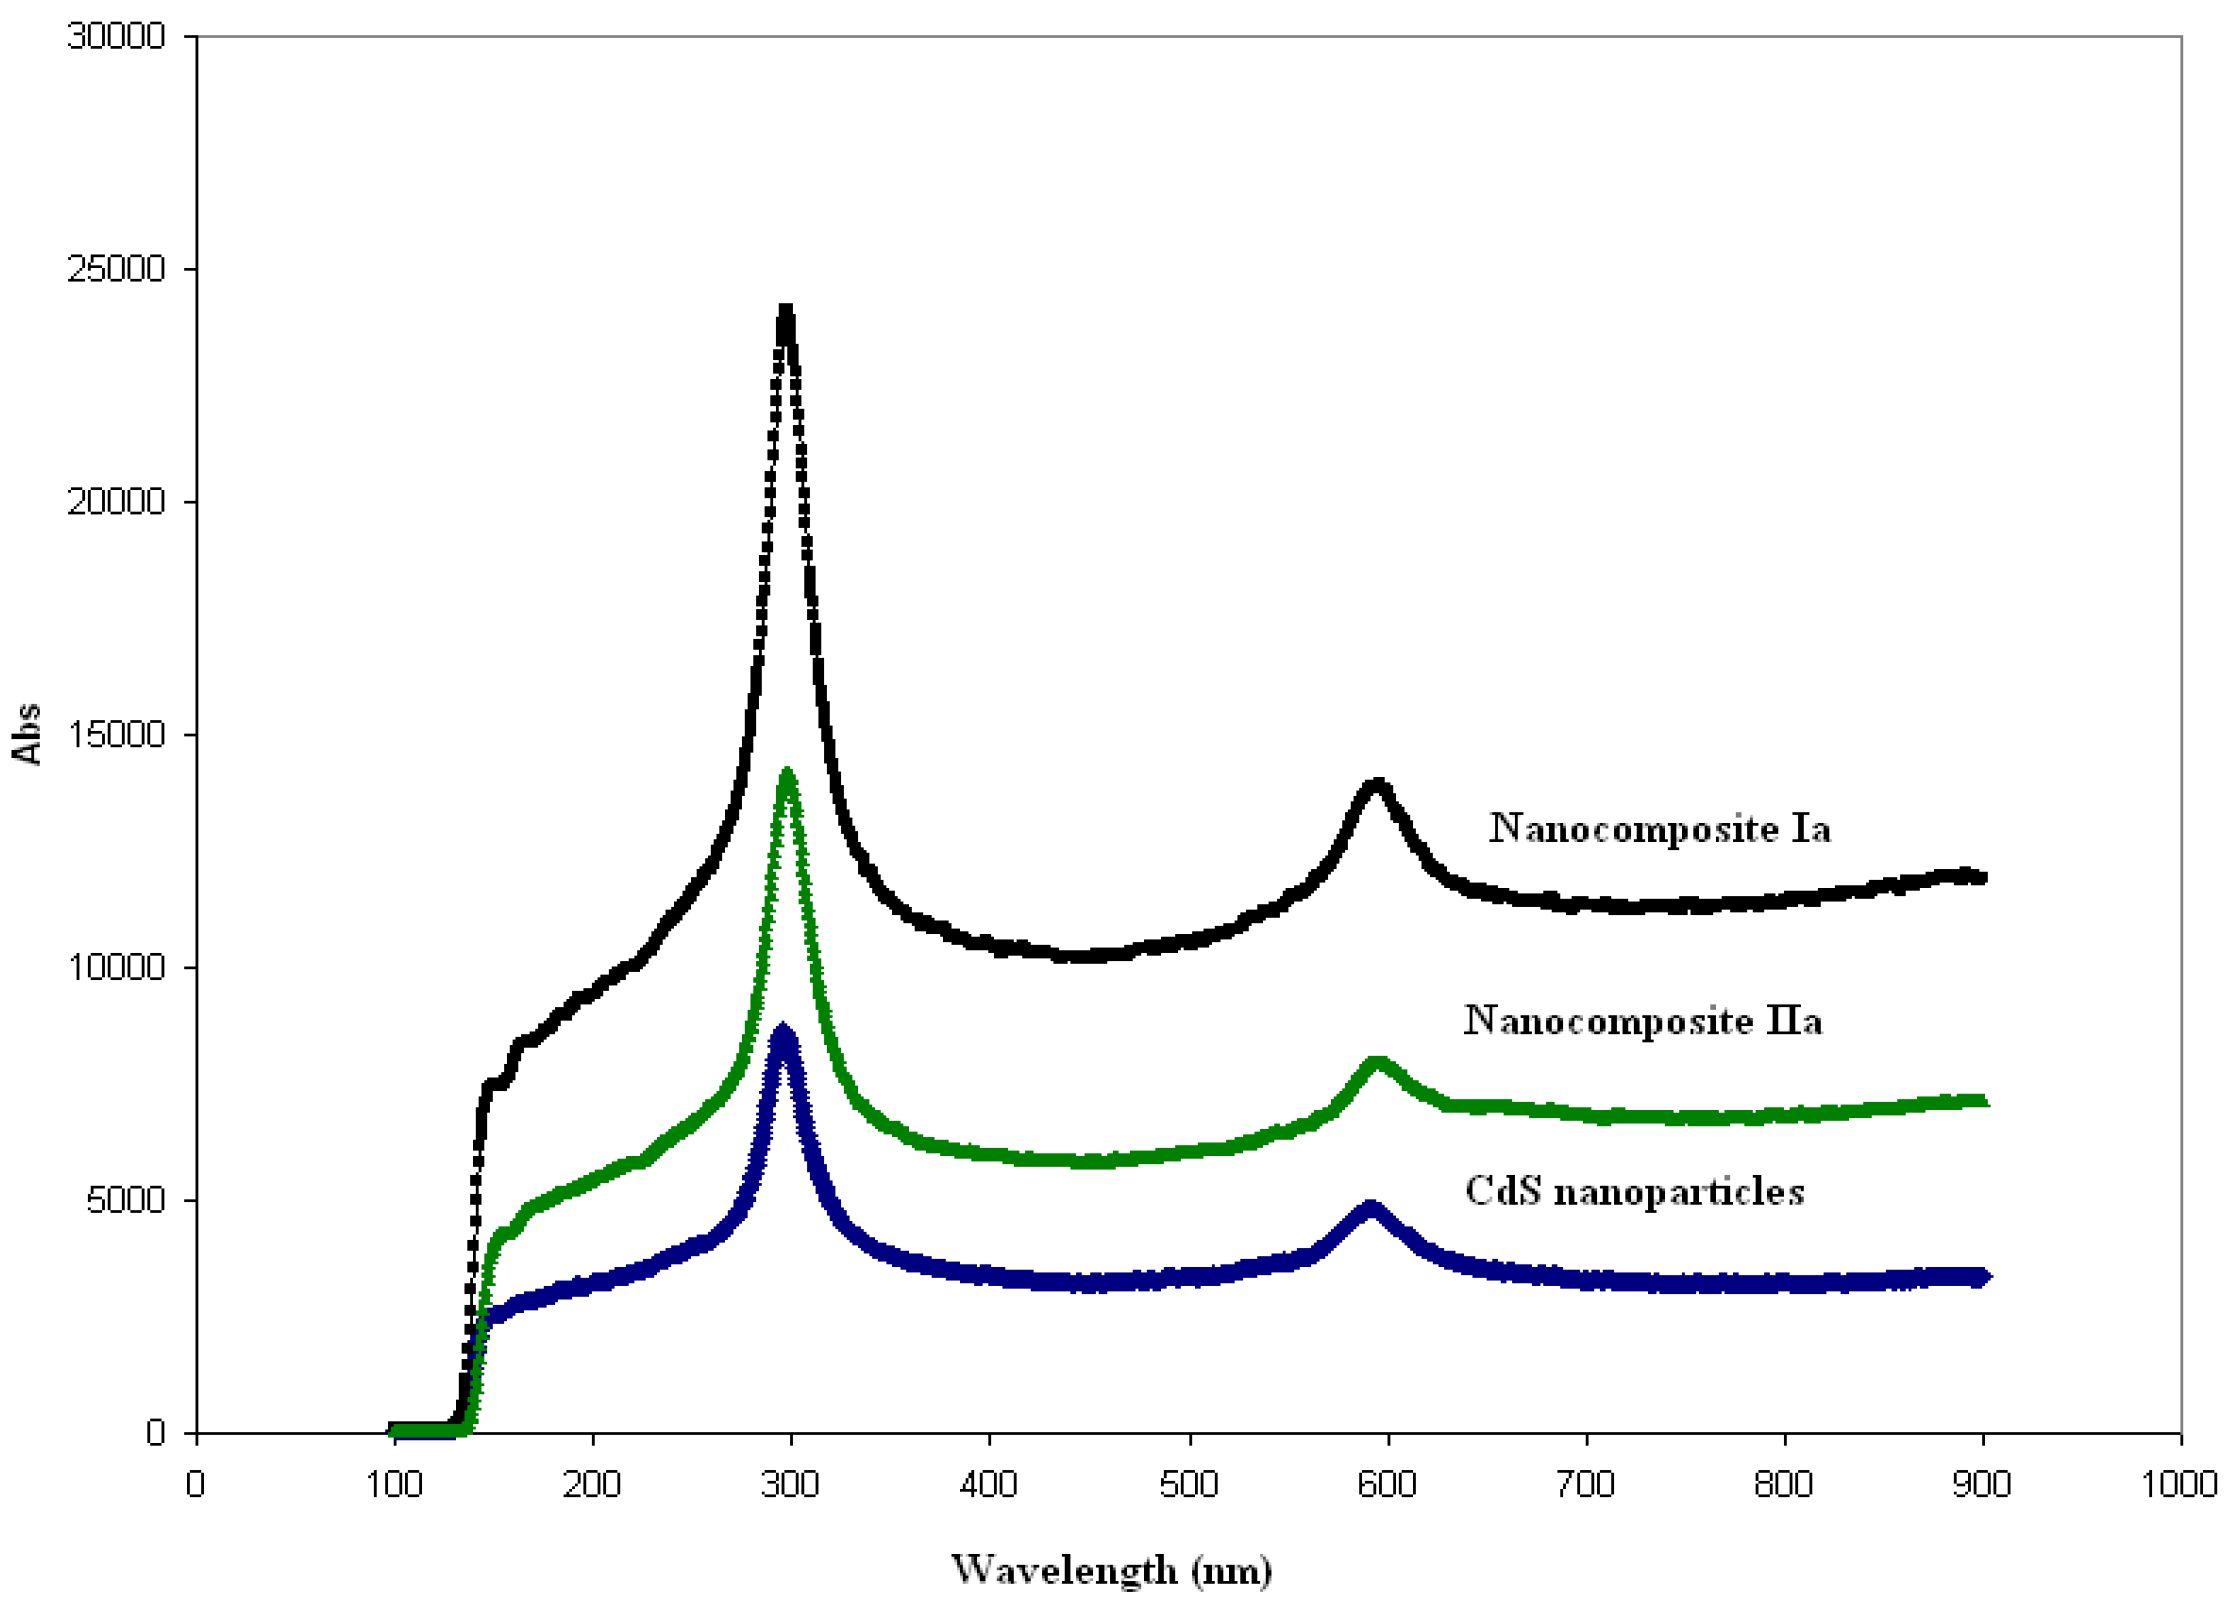
UV/Vis spectroscopic analyses were performed on CdS:nanocomposites of
Ia and
IIa at selected mass composition values (
Figure 6a and
Figure 6b). Shoulder peaks of CdS:nanocomposite of
Ia occurred at 450 nm and 475 nm for the mass compositions of 0.2:1.0 and 0.8:1.0. However, the absorbance band became broader as the mass composition of CdS was increased. A similar result was found with the CdS:nanocomposite of
IIa. The absorption bands gradually broadened as the mass composition of CdS increased, and the UV absorption for
Ia and
IIa shifted to a shorter wavelength (blue shift) with respect to that of the bulk CdS (520 nm). This observation indicated that quantum confined electronic behavior occurred in these nanocomposites.
Figure 6.
(a) UV/Vis spectroscopy analyses for pure CdS, pure Ia and CdS: Ia nanocomposites at 0.2:1.0 and 0.8:1.0 (w/w); (b) UV/Vis spectroscopic analyses for pure CdS, pure IIa and CdS: IIa nanocomposites at 0.1: 1.0, 0.5:1.0 and 1.0:1.0 (w/w).
Figure 6.
(a) UV/Vis spectroscopy analyses for pure CdS, pure Ia and CdS: Ia nanocomposites at 0.2:1.0 and 0.8:1.0 (w/w); (b) UV/Vis spectroscopic analyses for pure CdS, pure IIa and CdS: IIa nanocomposites at 0.1: 1.0, 0.5:1.0 and 1.0:1.0 (w/w).
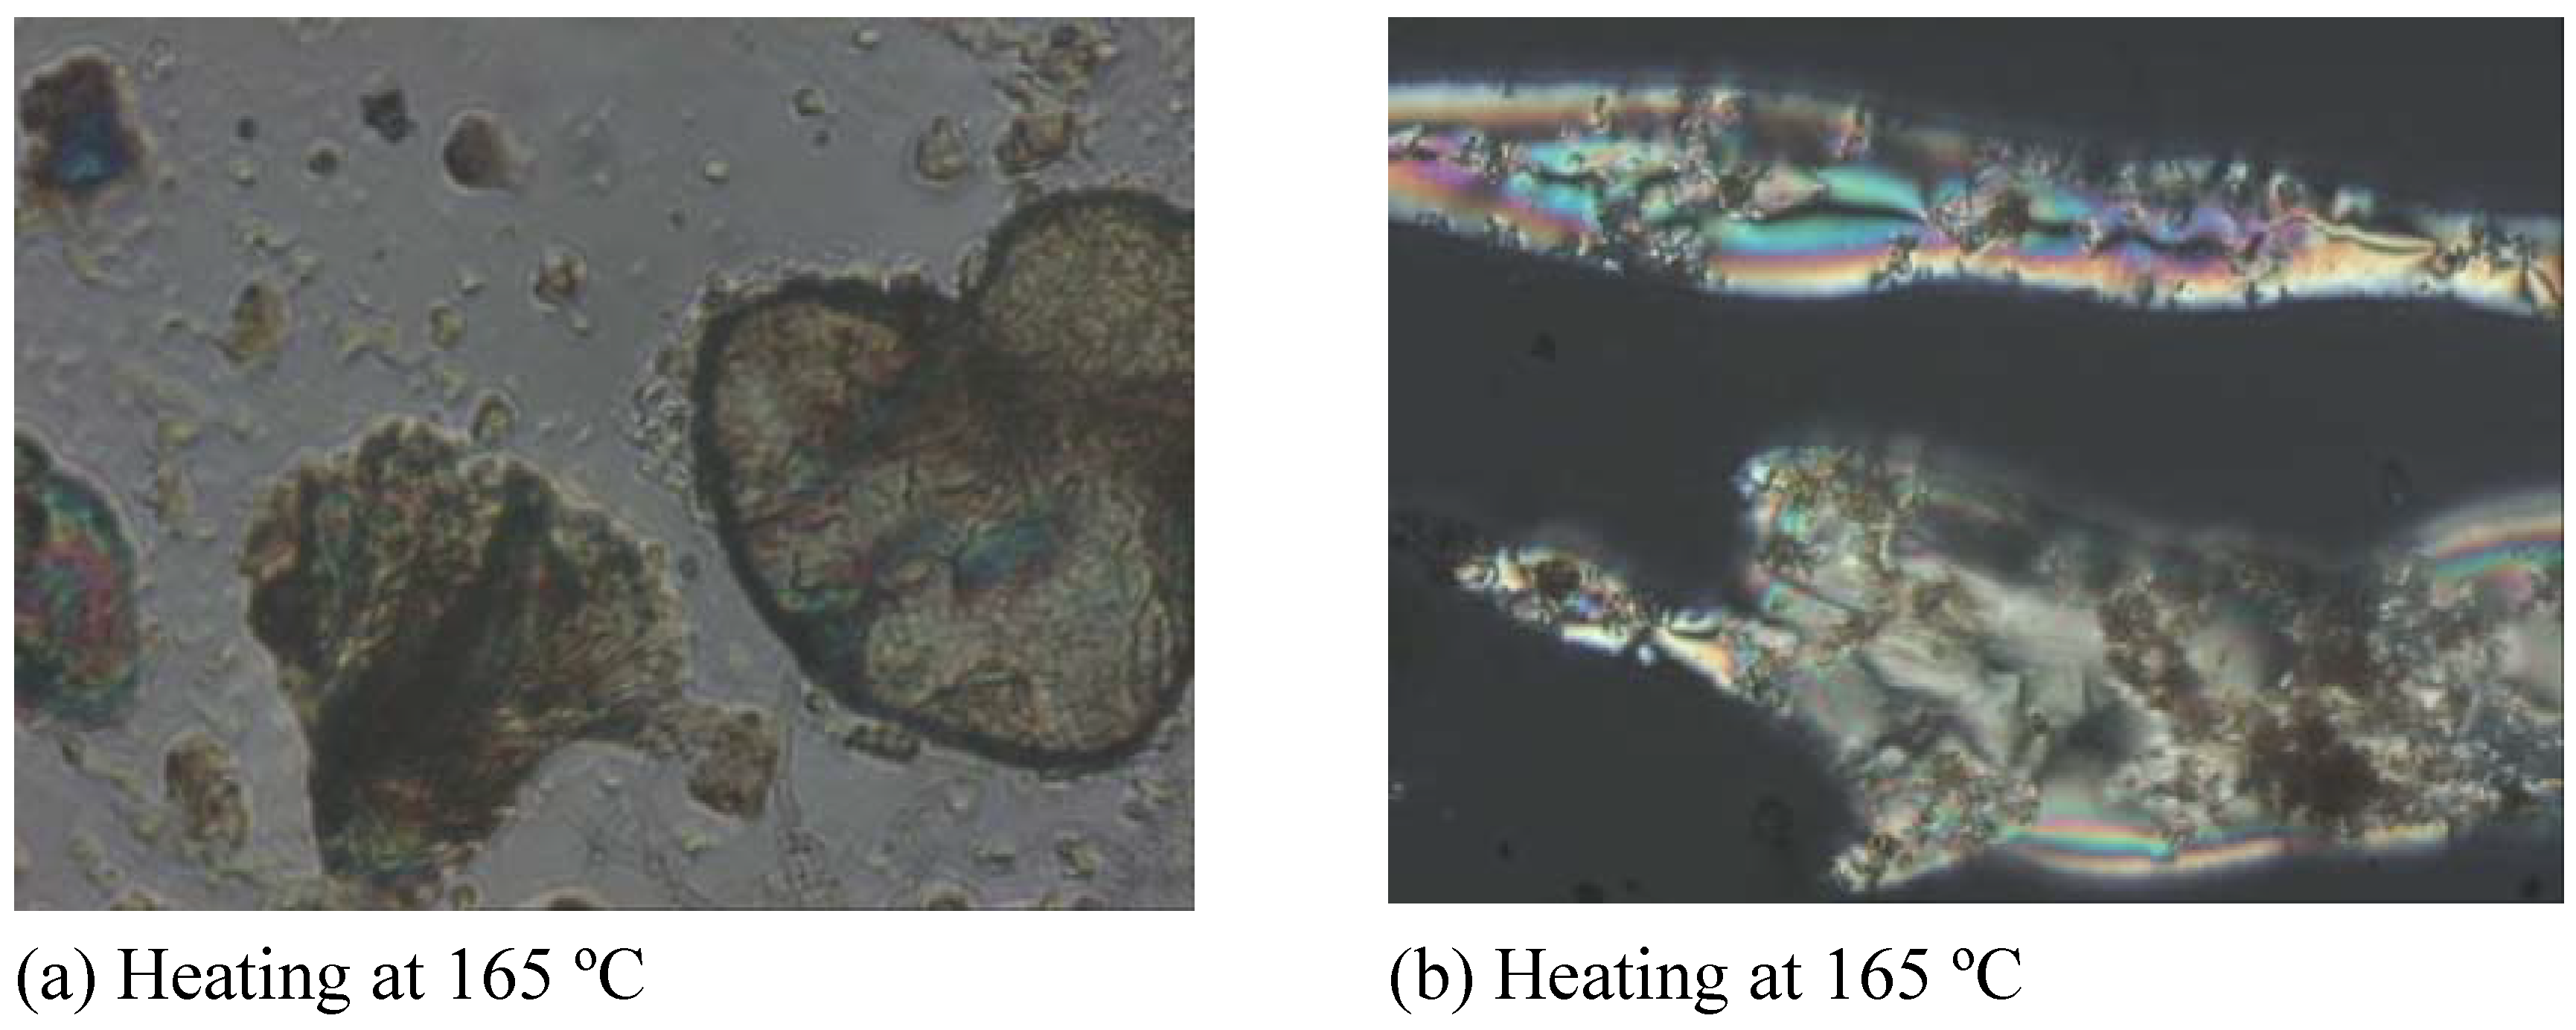
2.2. Thermal and Optical Behavior
The phase transition temperatures of the CdS nanocomposites for
Ia were measured using differential scanning calorimetry (DSC). The melting (T
m) and isotropization (T
i) points were clearly identifiable from the DSC thermograms. The mesophase of the nanocomposites was studied by polarizing optical microscopy. The mesophase was recognized from the basic textures exhibited by the mesogenic diols when viewed between the crossed polarizers in the microscope. The sample showed the Schlieren threaded texture, which confirmed the nematic phase, as shown in
Figure 7.
Figure 7.
Polarizing Optical Microscope (POM) micrographs of (a) CdS: Ia nanocomposites and (b) CdS: IIa nanocomposites at 0.1:1.0 (w/w).
Figure 7.
Polarizing Optical Microscope (POM) micrographs of (a) CdS: Ia nanocomposites and (b) CdS: IIa nanocomposites at 0.1:1.0 (w/w).
The melting and isotropization points for pure Ia were 171.0 ºC and 188.7 ºC, respectively, when analyzed by DSC. Generally, the introduction of CdS nanoparticles into Ia does not decrease either the melting point or the isotropization point significantly. However, a slight decrease of transition temperature (Cr-N) was observed for the 0.4:1.0 and 0.5:1.0 Ia nanocomposites. The liquid crystal property disappeared when the mass composition of CdS:Ia was 0.6:1.0 or higher. No transition temperatures were observed, and only a single melting peak was detected in the DSC spectrum for the sample with a mass composition of 0.6:1.0. When the mass composition was between 0.8:1.0 and 1.0:1.0, no melting point was observed. In the case of the CdS nanocomposite of IIa, the melting and isotropization points for pure IIa are 160.1 ºC and 275.2 ºC, respectively. A different observation was noted when compared to the earlier CdS:Ia nanocomposite system. When 10% CdS nanoparticles (w/w) were introduced into the system, the melting point of this sample was decreased by 7 ºC to 153.1 ºC even though the isotropization temperature (273.5 ºC) did not change significantly. The melting point and the isotropization point could not be detected when the mass composition was increased to 0.2:1.0. This result was common to all samples with mass compositions between 0.3:1.0 and 1.0:1.0.
The presence of a
m-OCH
3 substituent on the aromatic ring reduced the clearing (isotropization) temperature from 275.2 ºC in pure
IIa to 188.7 ºC in pure
Ia. When substituents like a methoxy group are present at the
ortho or
meta positions of the central aromatic system, thermal depression and the instability of the mesophase could be observed [
26,
27]. Yeap and co-workers (2006)[
26] suggested that the nematogenic behavior observed in some of their compounds that had a methoxy group in the
meta position of the aromatic system could have weakened the lateral interactions between molecules, which are important for promoting higher mesophase stabilities. This effect could also be attributed to the overall anisotropic broadening of the molecule and could eventually affect the cooperative packing that is needed in the mesophase [
28]. Based on the DSC analyses,
IIa was shown to be a more stable liquid crystal because the difference between the melting point and the isotropization point was larger compared to that of
Ia. There were slight decreases in the transition temperature of Cr-N and N-I in the
Ia nanocomposite series. However, these decreases were relatively insignificant unless the mass concentrations were increased to 0.4:1.0 or above. When more CdS nanoparticles were added to the matrix of
Ia, the nanoparticles functioned as a new additive material and hence, the transition temperature decreased relative to pure
Ia. In our case, we observed two different scenarios in which the addition of CdS to
Ia still showed the transition temperature at a discrete mass composition (0.5:1.0) and eventually lost its liquid crystalline properties. In contrast, the presence of CdS in
IIa slightly inhibited the liquid crystal properties when compared with the
Ia nanocomposite system. This result could be attributed to the presence of CdS nanoparticles, which effectively inhibit monomer re-crystallization depending on the concentration of CdS nanoparticles and on the type of monomers. The addition of filler (CdS nanoparticles) restricts the segmental motion of the monomers and, thus, reduces the re-crystallization process [
29]. This segmental motion allows rearrangement of the monomer chains into ordered structures, thus forming crystals during the cooling process [
29].
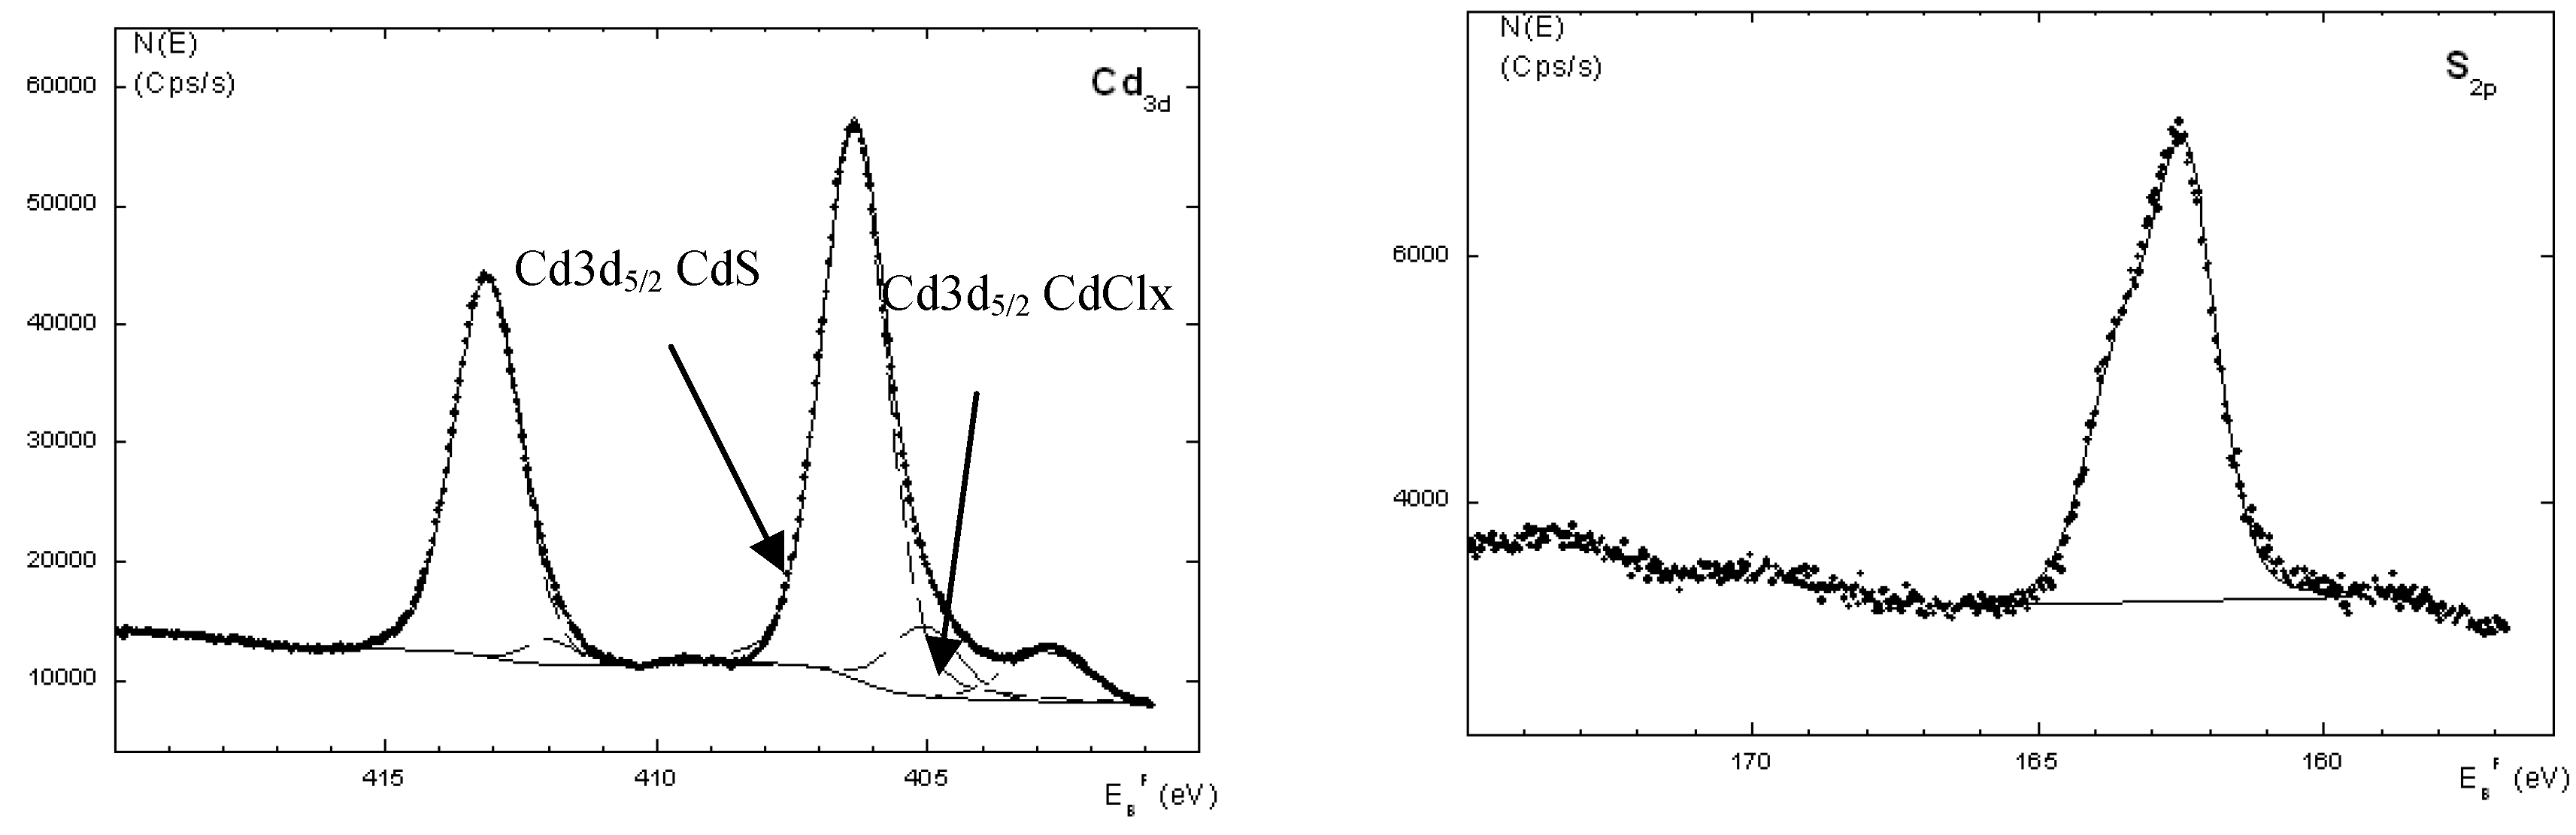
Figure 8 shows the XPS spectra of the CdS :nanocomposite of
Ia at a mass composition of 1.0:1.0. We detected two strong peaks of Cd3d in both samples. The binding energies for Cd3d
5/2 and Cd3d
3/2 were 407.5 eV and 414.4 eV, respectively, with the S2p energy at 163.6 eV. For instance, the doublet peaks that were assignable to Cd3d
5/2 and Cd3d
3/2 were observed at 406.4 eV and 413.3 eV (
Figure 8) in the CdS: nanocomposite of
Ia (1.0:1.0). The binding energy for S2p was 162.9 eV. The XPS results also revealed the presence of C and O, which originated from the matrix of Ia. The C1s core level was observed at a binding energy 285.1 eV and could be assigned to the hydrocarbon CH
2 groups [
30]. The presence of O1s at a binding energy of 533.2 eV could be due to H
2O. However, there was a slight impurity of Si in the sample, which was attributed to etching of silica from the reaction flask during the acidic cleaning process.
There were two Cd3d5/2 peaks, namely Cd3d5/2 CdS and Cd3d5/2 CdClx. The peak for Cd3d5/2 CdClx occurred at around 405 eV, depending on the charge effect during the analysis. When we plotted the area under the curve of the Cd3d5/2 CdClx peak over the area under the curve of the Cd3d5/2 CdS peak for both nanocomposites, we found that the ratio slightly increased as the concentration of CdS in the nanocomposite increased. This observation could indicate that sulfur vacancies occur as the concentration of CdS increases in the samples.
Figure 8.
The XPS spectra of CdS: Ia nanocomposites.
Figure 8.
The XPS spectra of CdS: Ia nanocomposites.
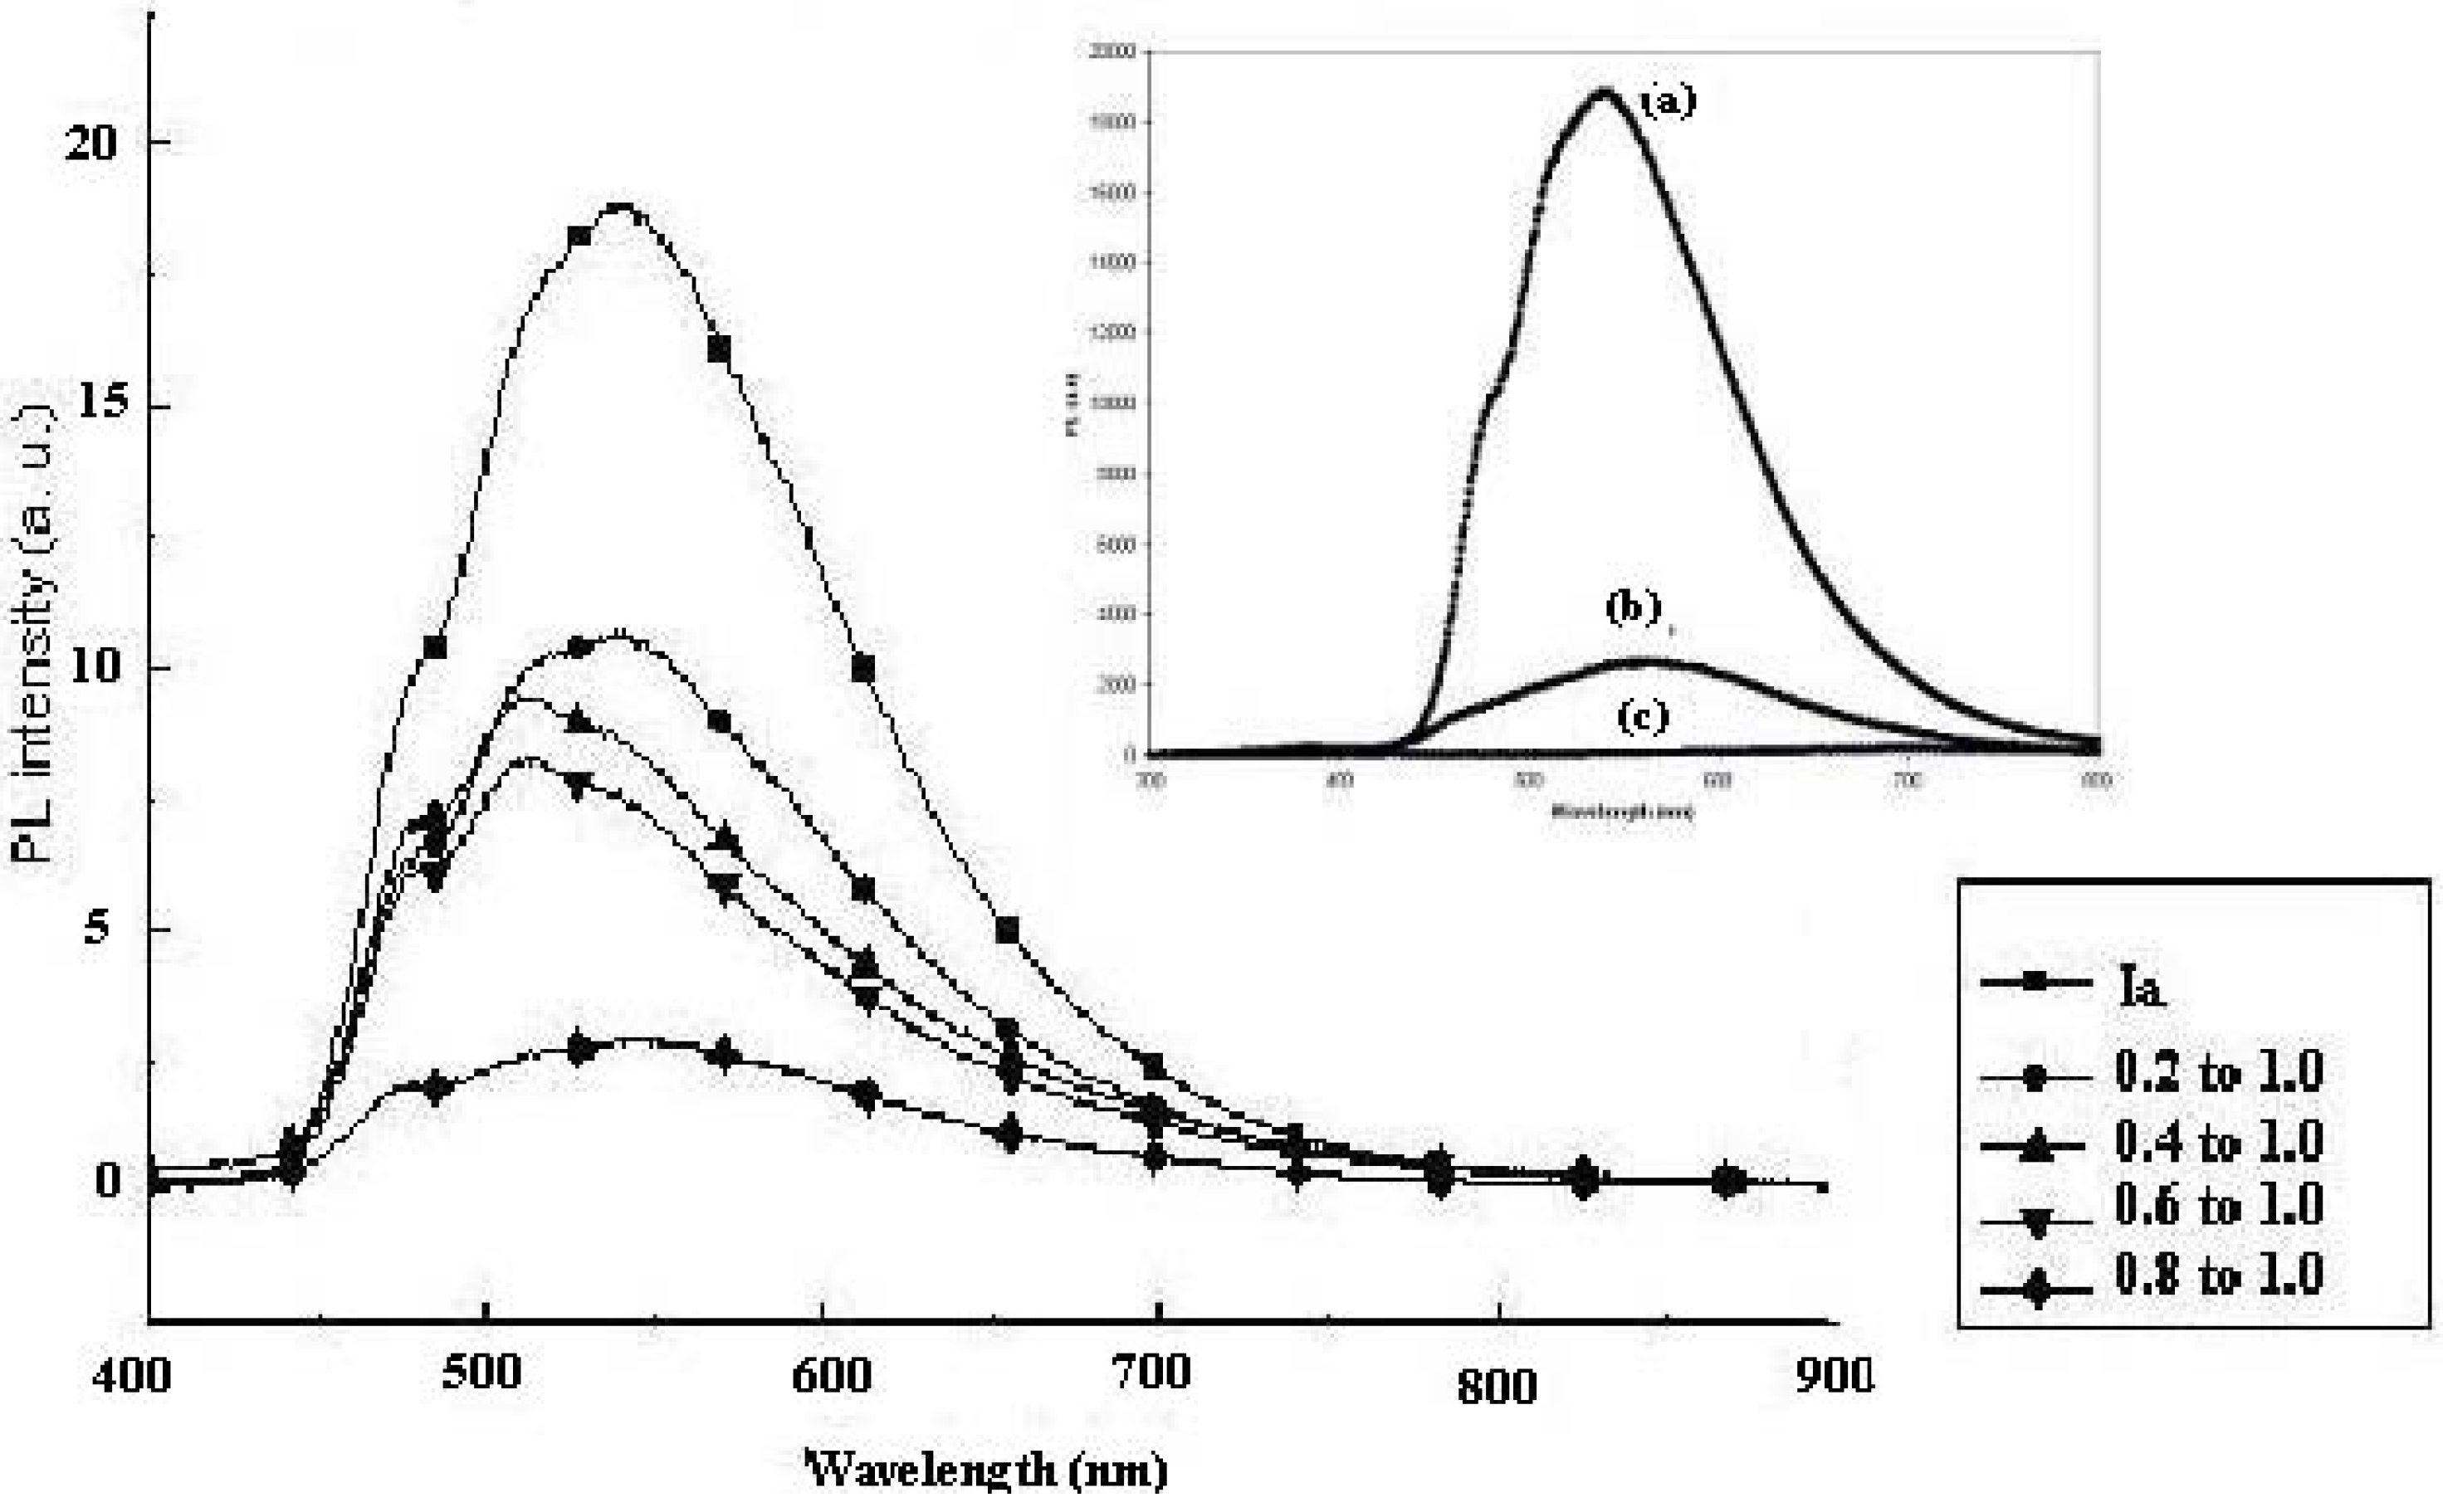
When we analyzed the photoluminescence of pure CdS, pure
Ia and pure
IIa, we observed that pure CdS has the lowest PL intensity of all the samples examined (see Insert in
Figure 9). Pure
Ia has a higher PL intensity than pure
IIa, which could be attributed to their structures. Pure
Ia has a methoxy group (-OCH
3) at the
meta position of the phenyl ring in the middle of our structure. A methoxy substituent is an electron-donating group that could neutralize the positive charge of the aromatic ring [
21]. Chaieb and co-workers [
31] observed that placing such donating groups either on both ends or in the middle of the molecule led to fluorescence emission in their materials. This observation could explain why
Ia has a higher PL emission than
IIa.
Figure 9 shows the room temperature PL spectra of the CdS:
Ia nanocomposite at different mass compositions (0.1:1.0 to 1.0:1.0 w/w of CdS:
Ia). The spectrum of pure
Ia showed an emission peak at 538 nm and a shoulder at 479 nm. In this study, we compared the intensity of the peak relative to the matrix (
Ia or
IIa) instead of to the pure CdS. Little PL emission was exhibited by the pure synthesized CdS nanoparticles using a similar method [
20] when compared to the PL emission by
Ia or
IIa. When CdS was introduced into the nanocomposites (20% by weight), the intensity of the peak decreased to half. The maximum peak and the shoulder peaks, however, remained the same and a new shoulder appeared at 516 nm. When 30% by weight of CdS was added, the intensity of the peak at 516 nm became larger than that of the peaks at 479 nm and 538 nm. The spectra for the nanocomposite with a mass composition of 0.4:1.0 showed a similar pattern as the spectra for the nanocomposite with a mass composition of 0.3:1.0. The peaks for the nanocomposite with a mass composition of 0.6:1.0 remained the same, although the PL intensity decreased slightly. However, the intensities of the peaks decreased drastically to 25% of the intensity of the CdS:
Ia nanocomposite with a mass composition of 0.2:1.0. The introduction of CdS into
Ia resulted in strong quenching of the PL intensity of the matrix. This quenching effect intensified with increasing amounts of CdS in the nanocomposite. Lu and colleagues (2003)[
32] reported a similar result when greater amounts of CdS were introduced (as a coating) into their ZnS micellar particle solutions. In the current study, the luminescence intensity of the matrix clearly decreased with increasing CdS content. This behavior could be explained by the disappearance of the luminescence centers, by the existence of non-radiative defects that were induced by CdS or by absorption of the PL by CdS. As demonstrated in the earlier study, the CdS particles mainly absorbed below 500 nm. In this case, the absorption of PL emission by CdS would result in a shift of the matrix PL to a higher wavelength, which was not observed. Further PL investigations are needed to understand the origin of the PL quenching that is induced by the presence of CdS.
Figure 9.
Photoluminescence study of CdS: Ia nanocomposites at different mass compositions (w/w); Insert: PL emission of (a) pure Ia; (b) pure IIa; (c) pure synthesized CdS.
Figure 9.
Photoluminescence study of CdS: Ia nanocomposites at different mass compositions (w/w); Insert: PL emission of (a) pure Ia; (b) pure IIa; (c) pure synthesized CdS.
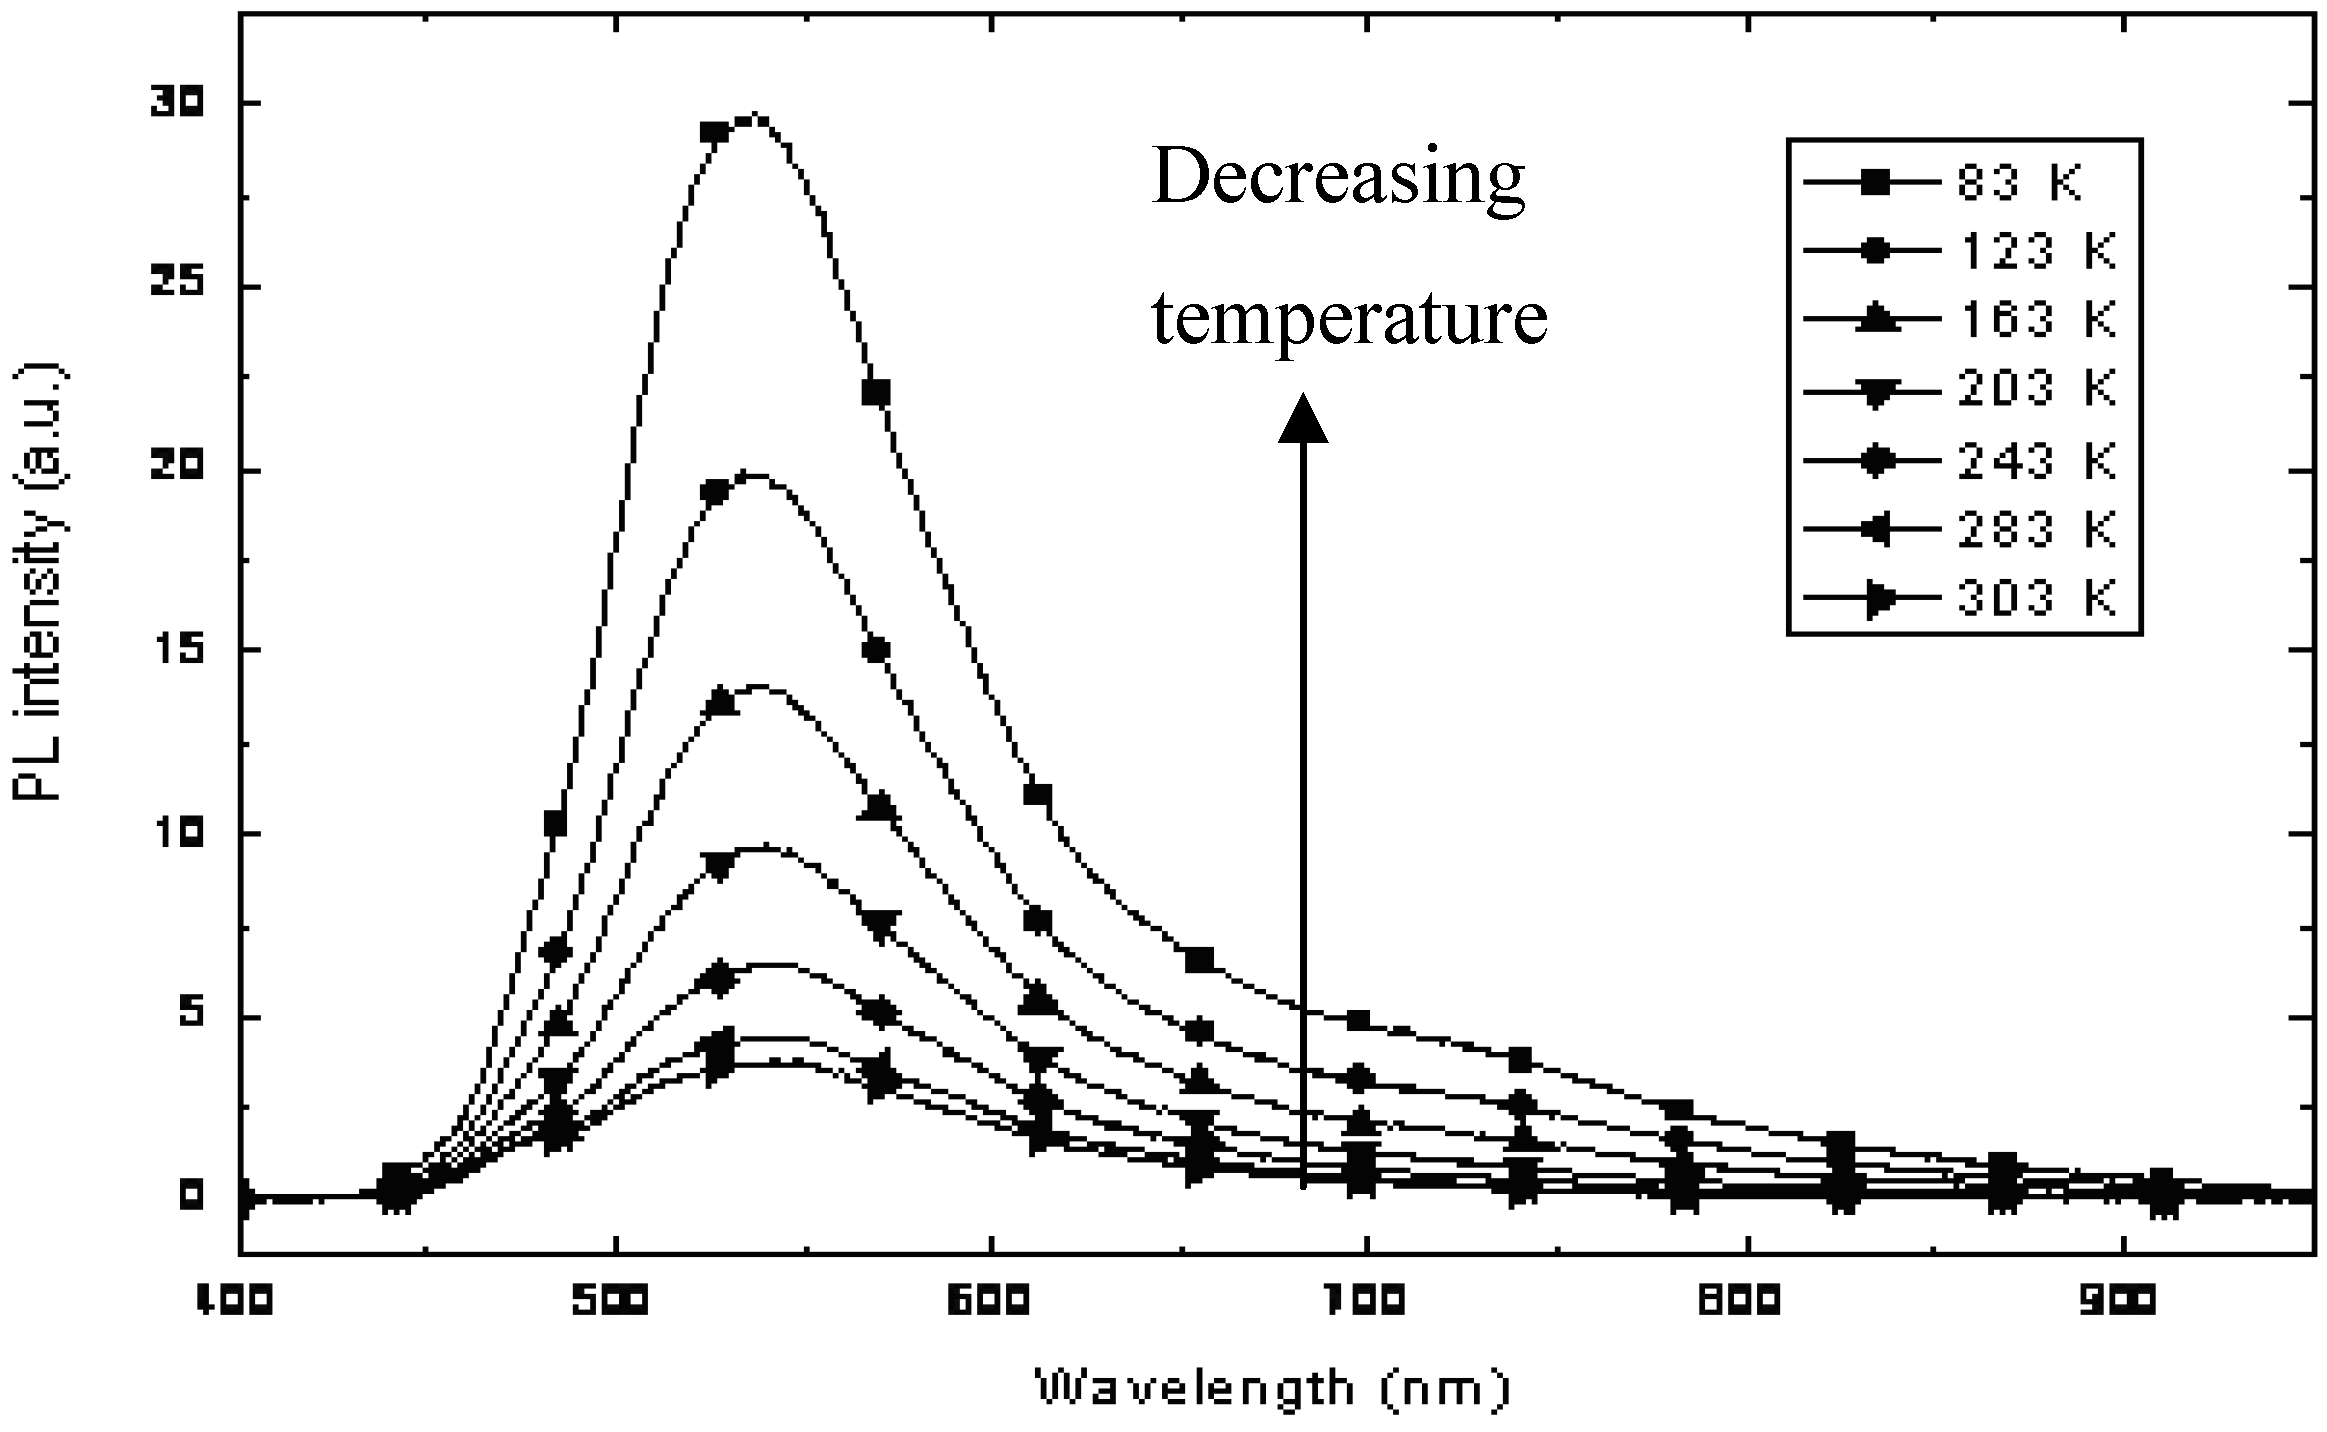
The CdS:
Ia nanocomposite with a mass composition of 0.2:1.0 was selected for further studies that were focused on the temperature dependence of photoluminescence in the range of 773–03 K, as depicted in
Figure 10. As the temperature decreased, the peak intensity at 532 nm, which originated from
Ia, increased gradually. Moreover, a peak around 750 nm increased continuously as the temperature decreased. This peak is attributed to the luminescence of CdS, as confirmed in our earlier PL study. The temperature dependence of the PL of the CdS:
Ia nanocomposites clearly showed that non-radiative channels exist in the nanocomposite. The PL at 750 nm for CdS was attributed to defect states. The results obtained in this study suggest that the defect states (probably due to sulfur vacancies) were passivated by the matrix.
Figure 10.
Temperature dependence of the PL of CdS: Ia nanocomposite at 0.2:1:0 (w/w).
Figure 10.
Temperature dependence of the PL of CdS: Ia nanocomposite at 0.2:1:0 (w/w).
Figure 11 shows the photoluminescence study at room temperature for the CdS:
IIa nanocomposites at various mass compositions. Pure
IIa has a PL peak at 559 nm and a shoulder at 460 nm. When the CdS nanocomposite had a mass composition of 0.1:1.0, the PL intensity of the matrix increased slightly and the peaks also became broader due to a shoulder at a high wavelength. Nonetheless, the PL intensity increased and red shifted to 640 nm when the CdS nanocomposite had a mass composition of 0.3:1.0. Conversely, the PL intensity decreased when more CdS was introduced, although the peak remained in the 6126–22 nm region. For higher CdS contents, the PL intensity the PL intensity decreased with the CdS content.
Figure 11.
Photoluminescence study of CdS:IIa nanocomposites at different mass compositions (w/w).
Figure 11.
Photoluminescence study of CdS:IIa nanocomposites at different mass compositions (w/w).
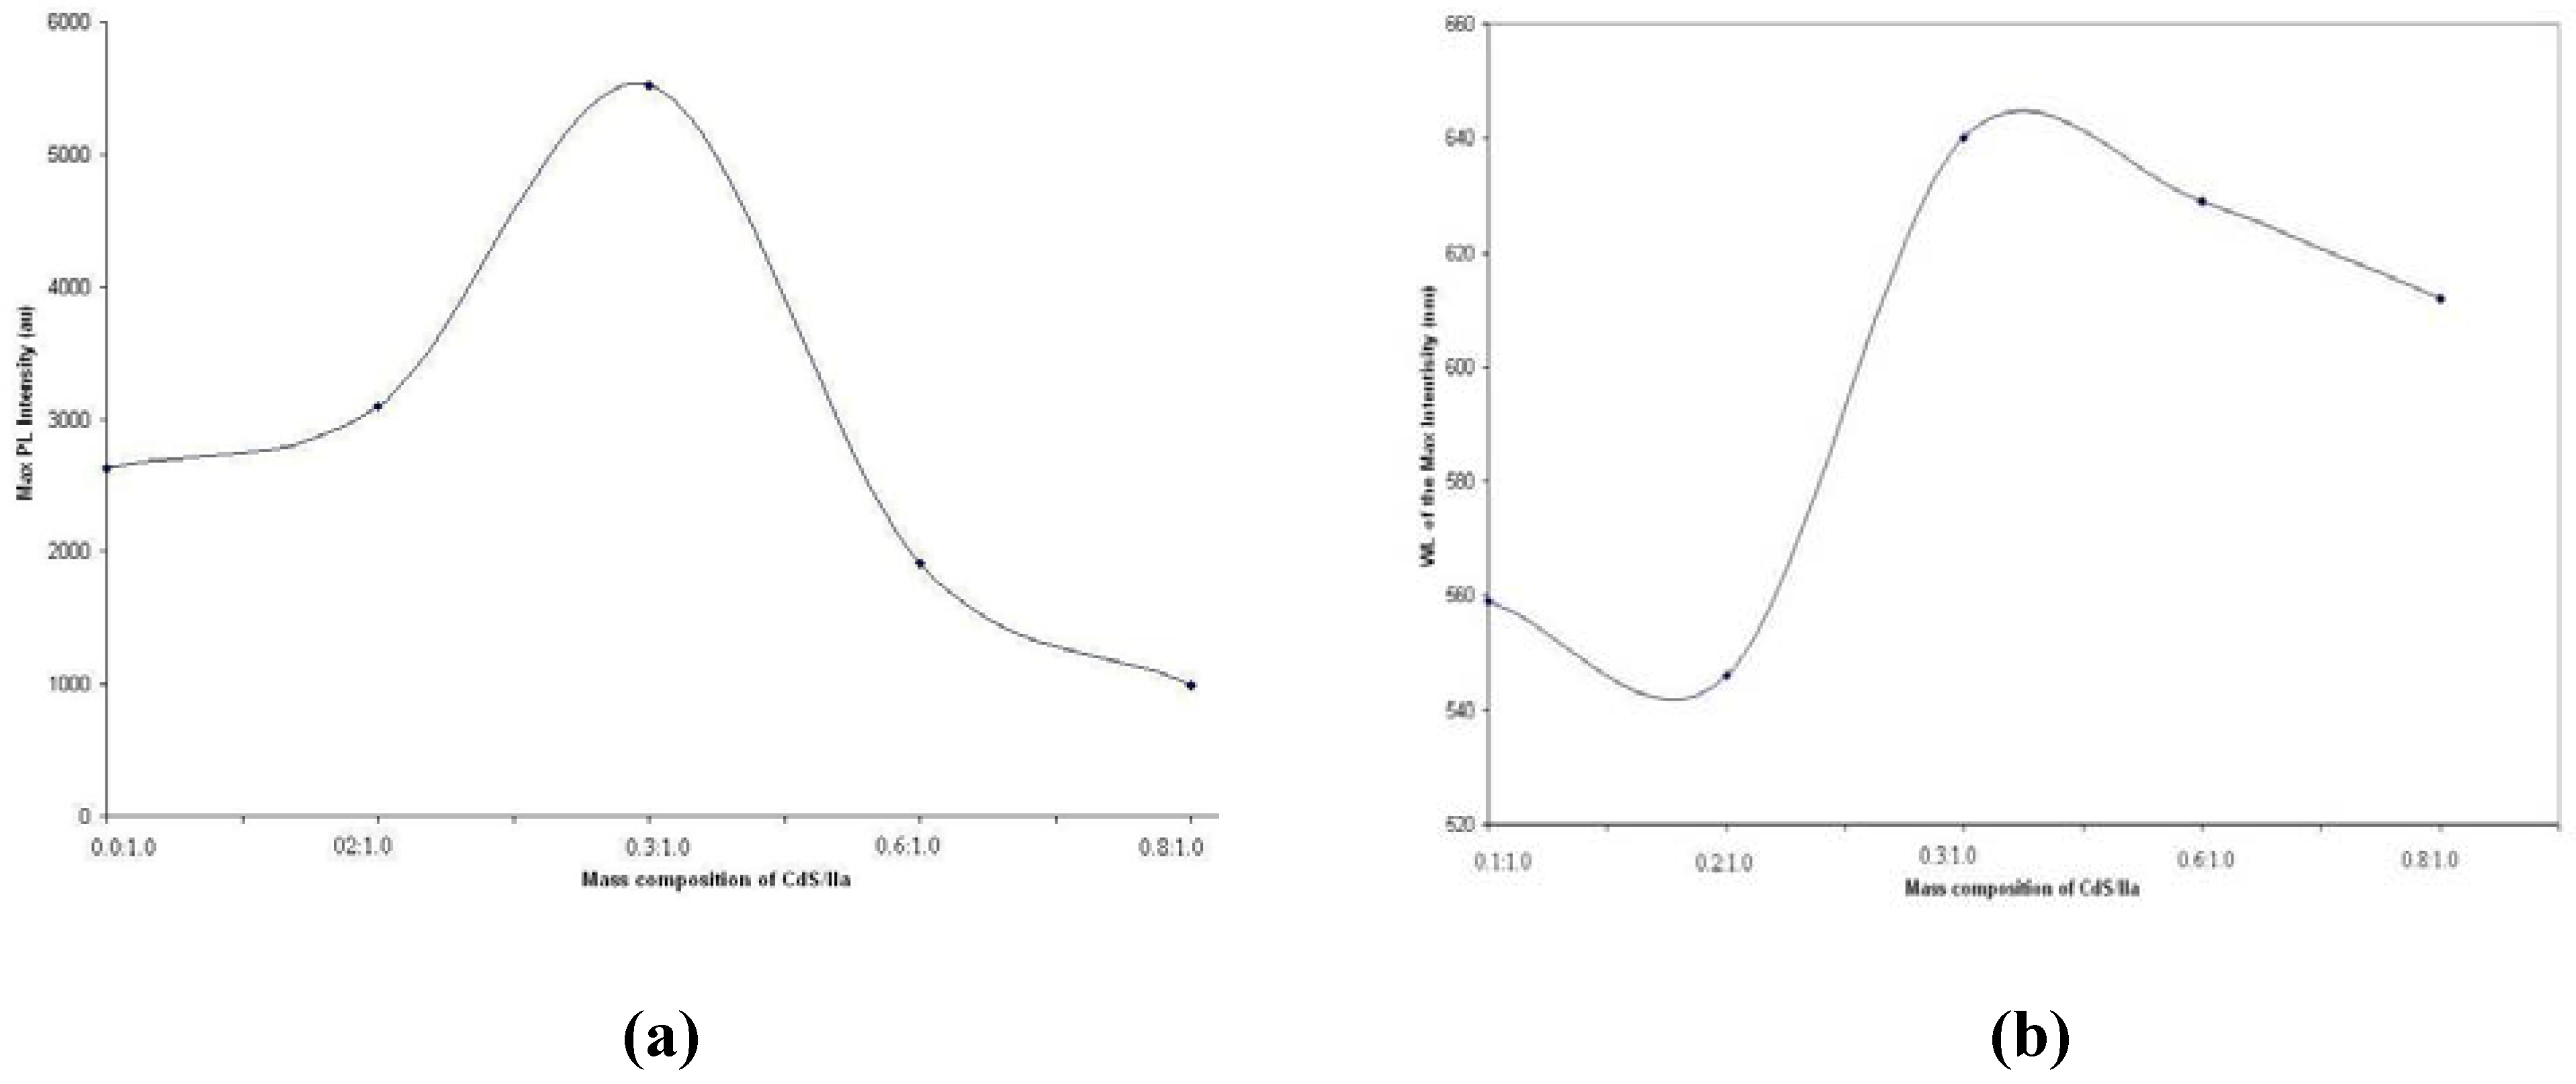
If we plot the maximum PL intensities against various mass compositions for nanocomposite
IIa (see
Figure 12a), the results corresponded well with the findings from Ushakov and co-workers (2006) [
33] in their work on CdS nanoparticles and polyethylene nanocomposites at different mass percentages (from 0% to 40%). These researchers obtained the photoluminescence spectrum at 20 mass % CdS nanoparticles and found that the CdS nanoparticles suppress the matrix radiation and enhanced the radiation intensity of the nanomaterial. The authors claimed that the results were associated with the high quantum efficiency of the photoluminescence, and this feature was due to a higher concentration of CdS nanoparticles with fewer imperfections. Thus, the radiation intensity of the nanomaterial was increased. The plot of the wavelength of the maximum intensity against various mass compositions is illustrated in
Figure 12b.
Figure 12.
(a) The maximum intensities against various mass compositions; (b) The wavelength of the maximum intensity against various mass compositions for nanocomposites IIa.
Figure 12.
(a) The maximum intensities against various mass compositions; (b) The wavelength of the maximum intensity against various mass compositions for nanocomposites IIa.
In this study, two different PL contributions were observed. The PL bands around 550 nm and around 700 nm were attributed to the matrix and to the CdS nanoparticles, respectively. With an increasing quantity of CdS, the PL band shift toward higher wavelengths because of the increasing influence of the CdS nanoparticles. Moreover, the disappearance of the PL of the matrix for the high CdS concentration suggested that an energy transfer process from the matrix to CdS took place. The excitation of the mixture could lead to radiative transitions from the matrix or from CdS, or alternatively, could lead to radiative transfer from the matrix to CdS followed by the PL of CdS. These processes are illustrated in
Figure 13.
The temperature dependence of photoluminescence was then studied on
IIa nanocomposites of 0.4:1.0 and 0.2:1.0 as seen in
Figure 14. The study was carried out in the range of 77 –300 K. The photoluminescence intensity increased gradually as the temperature decreased. In the case of CdS nanocomposite at 0.2:1.0, we could observe that the PL peak of CdS was increased as the temperature was gradually decreased, suggesting that thermally activated non-radiative processes exist in the matrix. Similarly, the PL peak for
Ia at 540 nm was also intensified as the temperature was lowered. However, when more CdS were added (
Figure 14a), the PL peak of CdS became dominant and no PL peak of the
Ia was observed in the spectra. All of the peaks coalesced into a single peak at around 700 nm, and this peak represented the CdS peak in the mixtures. The introduction of CdS into
Ia (ultimately reaching a mass composition of 0.3:1.0) enhanced the photoluminescence of the sample, and eventually the PL intensity dropped as more CdS was added. Nonetheless, the intensity peak for CdS in the CdS naocomposite was monitored to have increased when the temperature is decreased.
Figure 13.
The proposed kinetic scheme in CdS nanocomposites.
Figure 13.
The proposed kinetic scheme in CdS nanocomposites.
Figure 14.
Temperature dependence studies on PL in CdS: IIa nanocomposites at (a) 0.4:1.0 (b) 0.2:1.0 (w/w).
Figure 14.
Temperature dependence studies on PL in CdS: IIa nanocomposites at (a) 0.4:1.0 (b) 0.2:1.0 (w/w).
A comparison of the CdS nanocomposites of Ia and IIa in the temperature dependence studies showed that the introduction of CdS nanoparticles produced different results, depending on the sample. Addition of CdS into Ia quenched the photoluminescence intensity of Ia. However, the introduction of CdS into IIa enhanced the photoluminescence of the sample to a mass composition of 0.3:1.0 and the PL intensity dropped as more CdS was added. The intensity of the peak for CdS in the CdS:IIa nanocomposite was found to increase when the temperature was decreased. The reverse trend was observed when the CdS:Ia nanocomposite was studied over a range of temperatures. In contrast to the CdS:IIa sample, the Ia peak (rather than the CdS peak) responded when the temperature was decreased, except when the temperature was 77 K.
