3.1. Polyether Glycol-Based PUEs
Nomenclature denotes the types of polymer glycol and curing agent used like PTMG B.
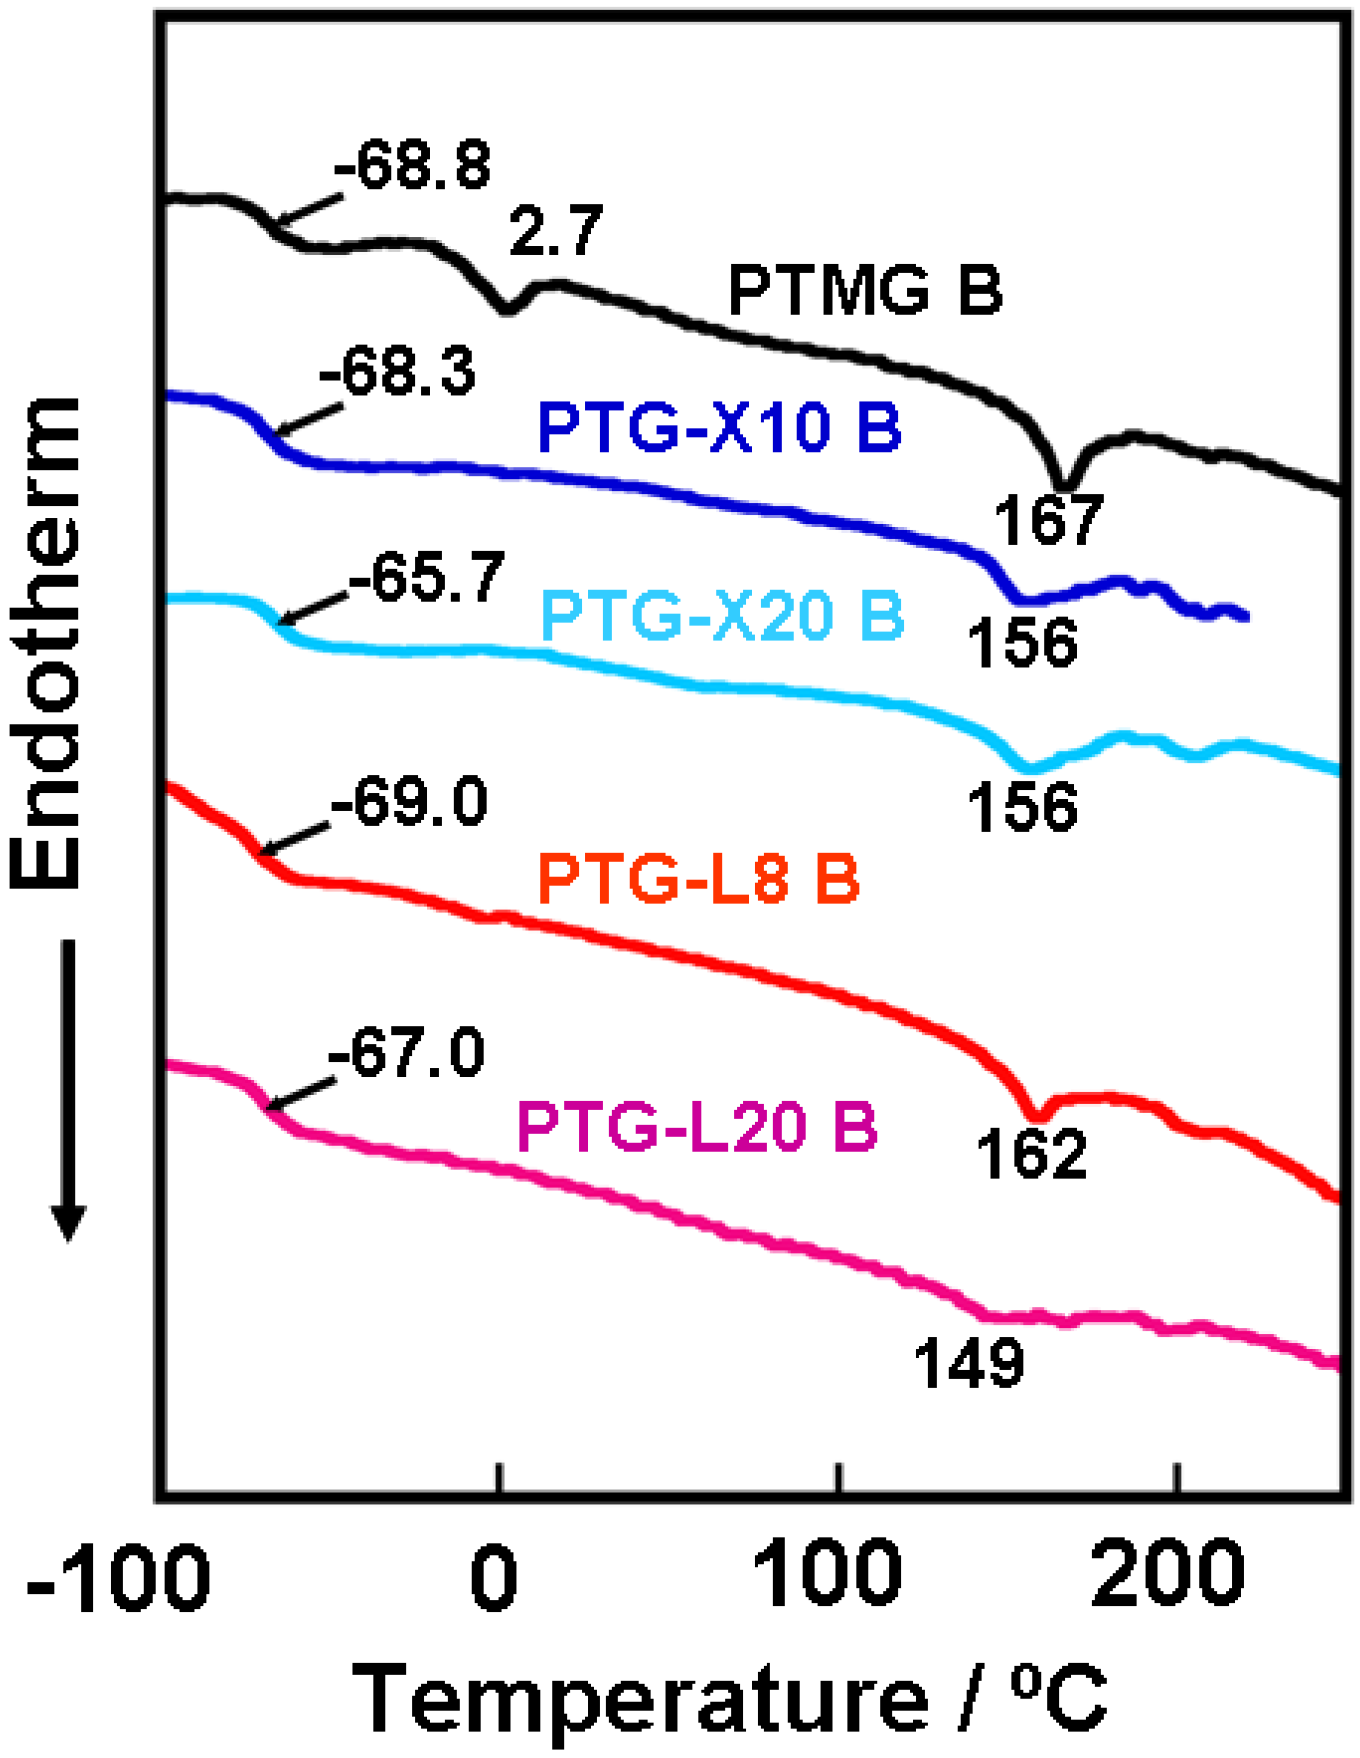
Figure 1 shows the DSC curves for the PTMG, PTG-X and PTG-L based PUEs. Glass transition temperature (
Tg) of soft segment and melting point of hard segment crystals were observed around −65 and 150 °C for all PUEs, respectively. For PTMG B, one can see the obvious endothermic peak of the melting of soft segment at 2.7 °C. However, no clear peaks were observed for the other PUEs. These results clearly suggest that incorporation of the methyl and dimethyl groups into the polymer glycols are quite effective on the crystallizability of soft segment in the PUEs even under no elongation.
Figure 1.
DSC curves for the PTMG, PTG-X and PTG-L based PUEs.
Figure 1.
DSC curves for the PTMG, PTG-X and PTG-L based PUEs.
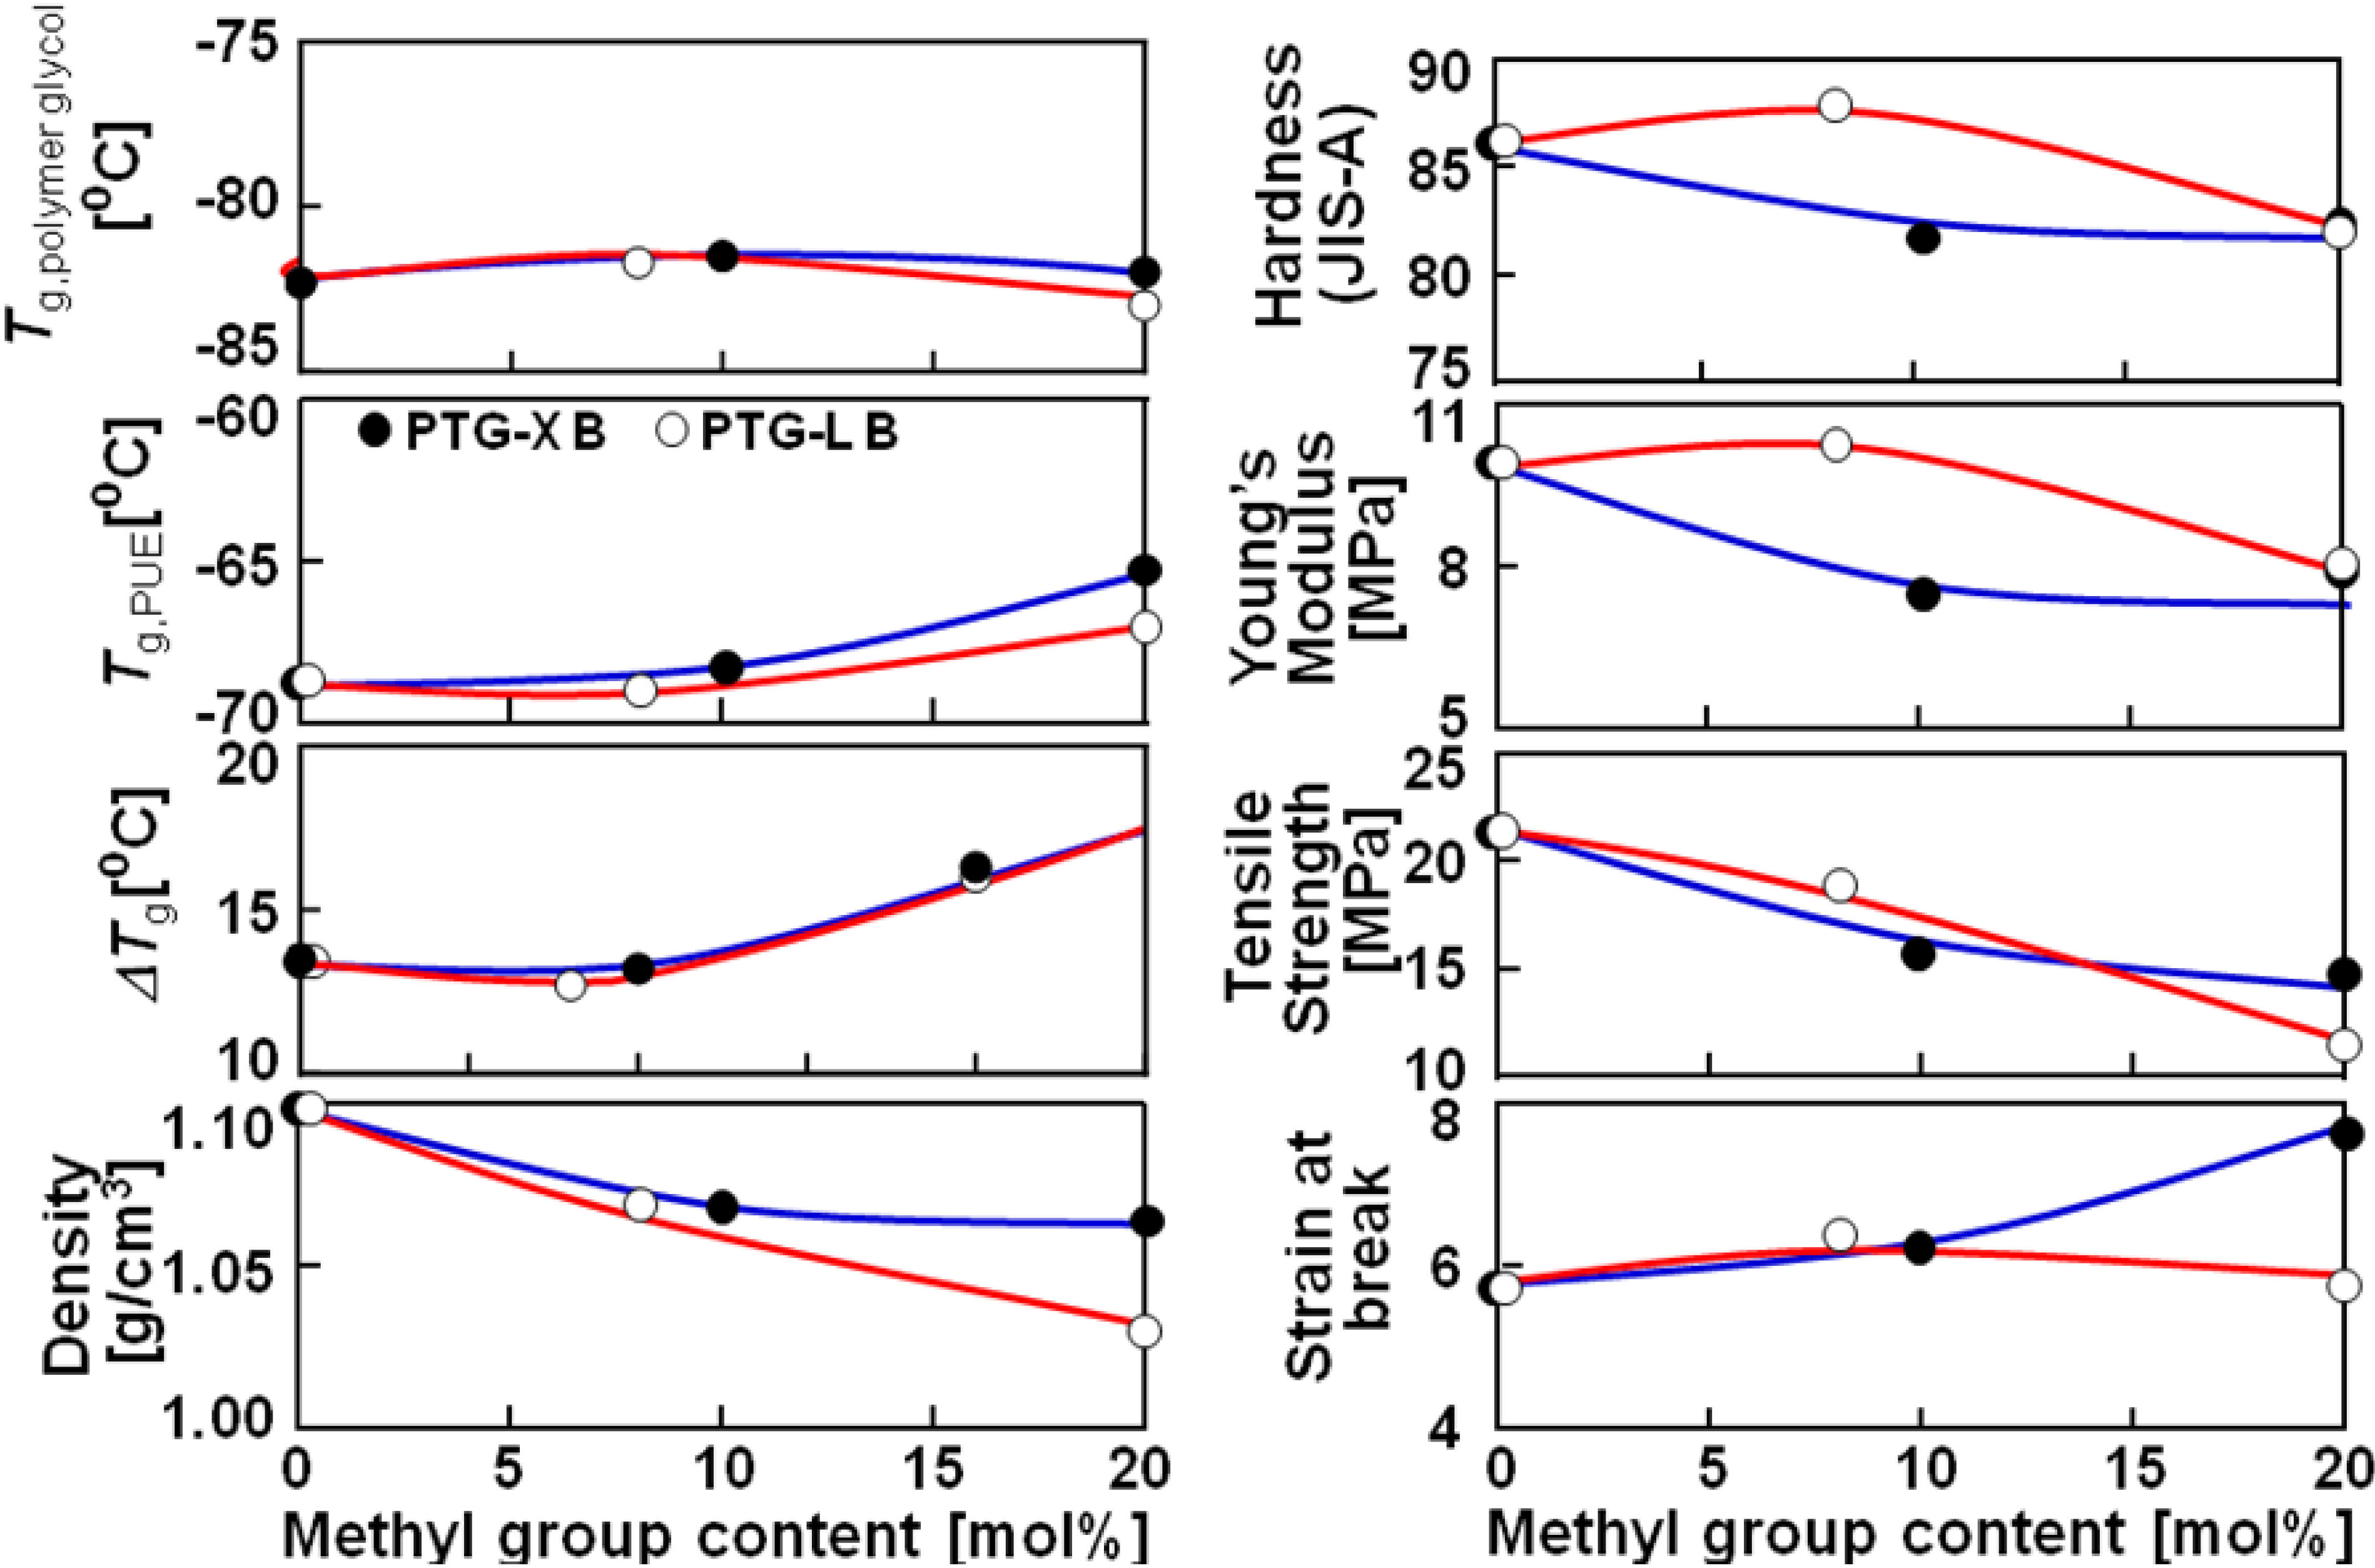
Figure 2 shows the methyl group content dependence of
Tg, density, hardness and mechanical properties of the PTMG, PTG-X and PTG-L based PUEs. Δ
Tg was defined as a subtraction of
Tg of the soft segment in the PUEs and that of original polymer glycols (
Tg,
polymer glycol). Δ
Tg increased with increasing methyl group content. It is well known that the increasing
Tg of the soft segment in PUE systems means an increasing miscibility of the two components on account of the molecular interaction between the soft and hard segments. Furthermore, the melting temperature of the hard segment decreased with increasing methyl group content. Therefore, it is likely to consider that the phase separation of the PUEs became weaker with increasing methyl group content. The discussion on mechanical properties will be given in a later section.
Figure 2.
Methyl group content dependence of Tg, density, hardness and mechanical properties of polymer glycol and PTMG, PTG-X and PTG-L-based PUE.
Figure 2.
Methyl group content dependence of Tg, density, hardness and mechanical properties of polymer glycol and PTMG, PTG-X and PTG-L-based PUE.
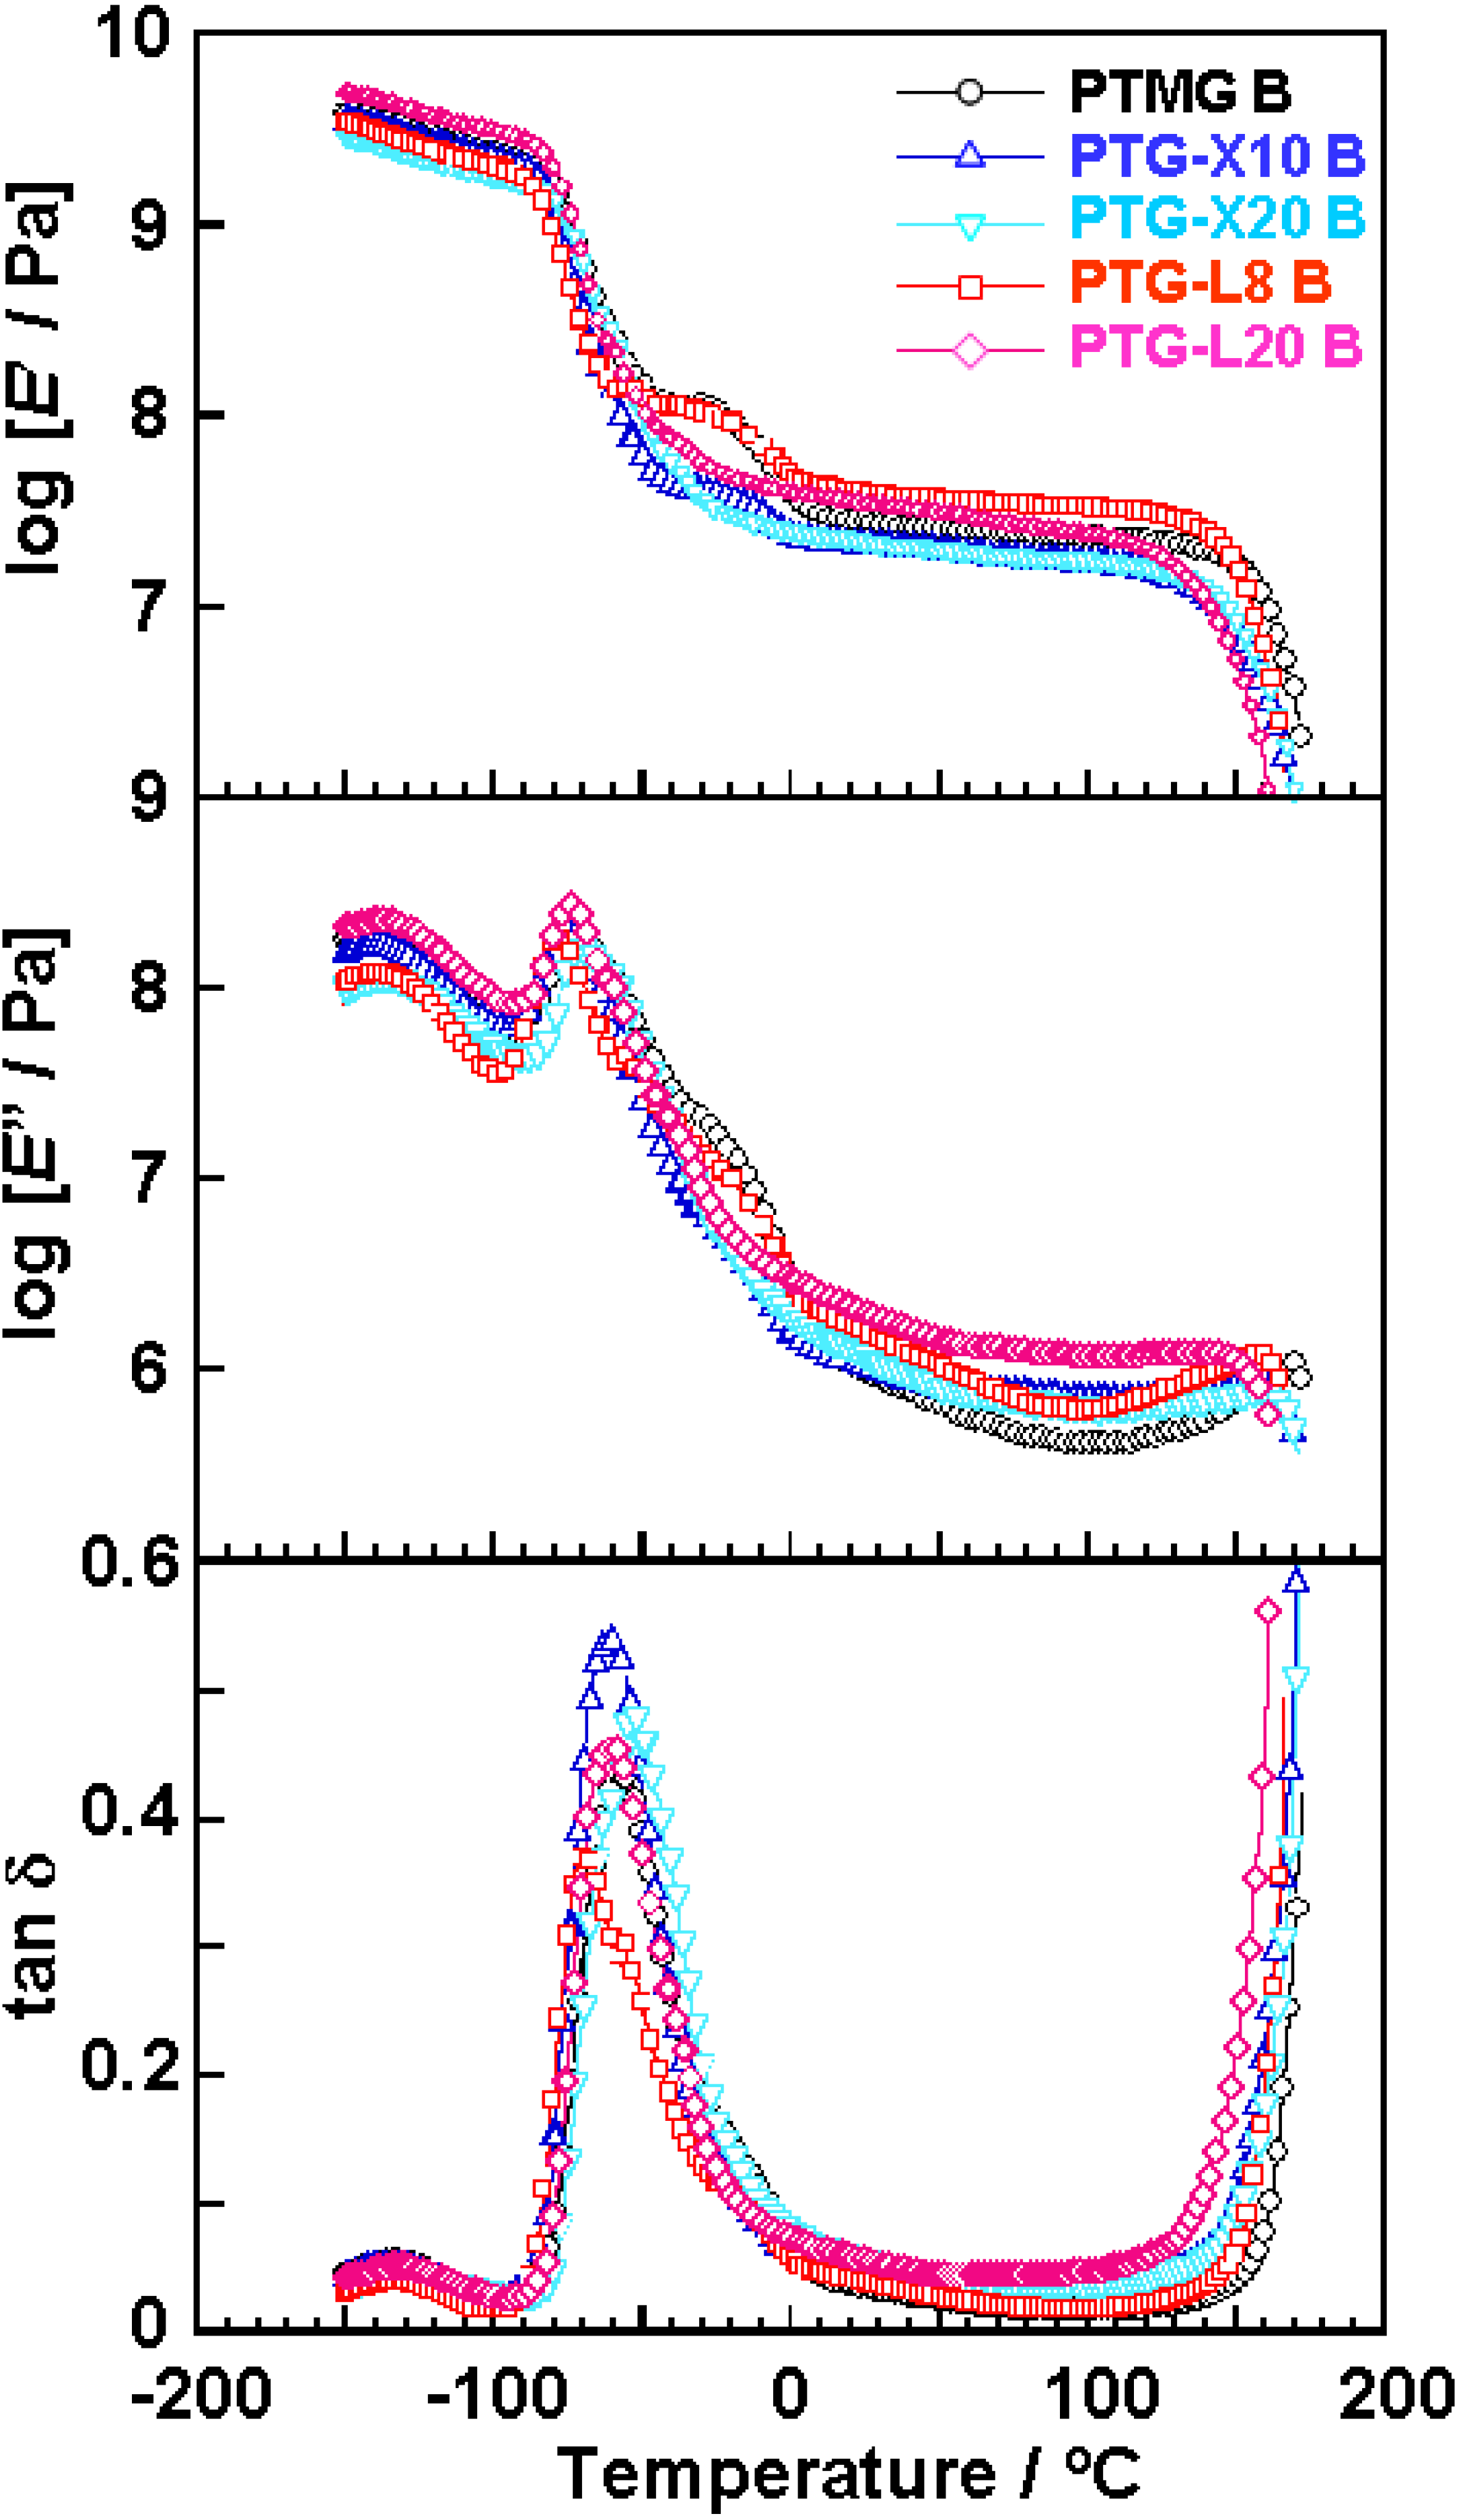
Figure 3 shows the temperature dependence of dynamic viscoelastic properties of the polyether glycol-based PUEs. The
E’ decreased at around −80 °C because of α-relaxation of the soft segment. For PTMG B, PTG-X10 B and PTG-L8 B, a shoulder was clearly observed at around −20 °C. This is due to recrystallization of the soft segment during the heating process. Shoulders for PTG-X10 B and PTG-L8 B were smaller than for PTMG B. These results clearly indicate that incorporation of side methyl groups suppresses the recrystallization of the soft segment. On the other hand, since no shoulder was observed for PTG-X20 B and PTG-L20 B in this temperature region, the soft segment could not recrystallize during the heating process due to enough amounts of side methyl groups. All the PUEs exhibited a rubbery plateau region in the range from 0 to 150 °C. The terminal temperature of PTMG B was the highest of the five PUEs. This is because the hard segment chains in PTMG B formed well-ordered crystalline domains as clarified by DSC.
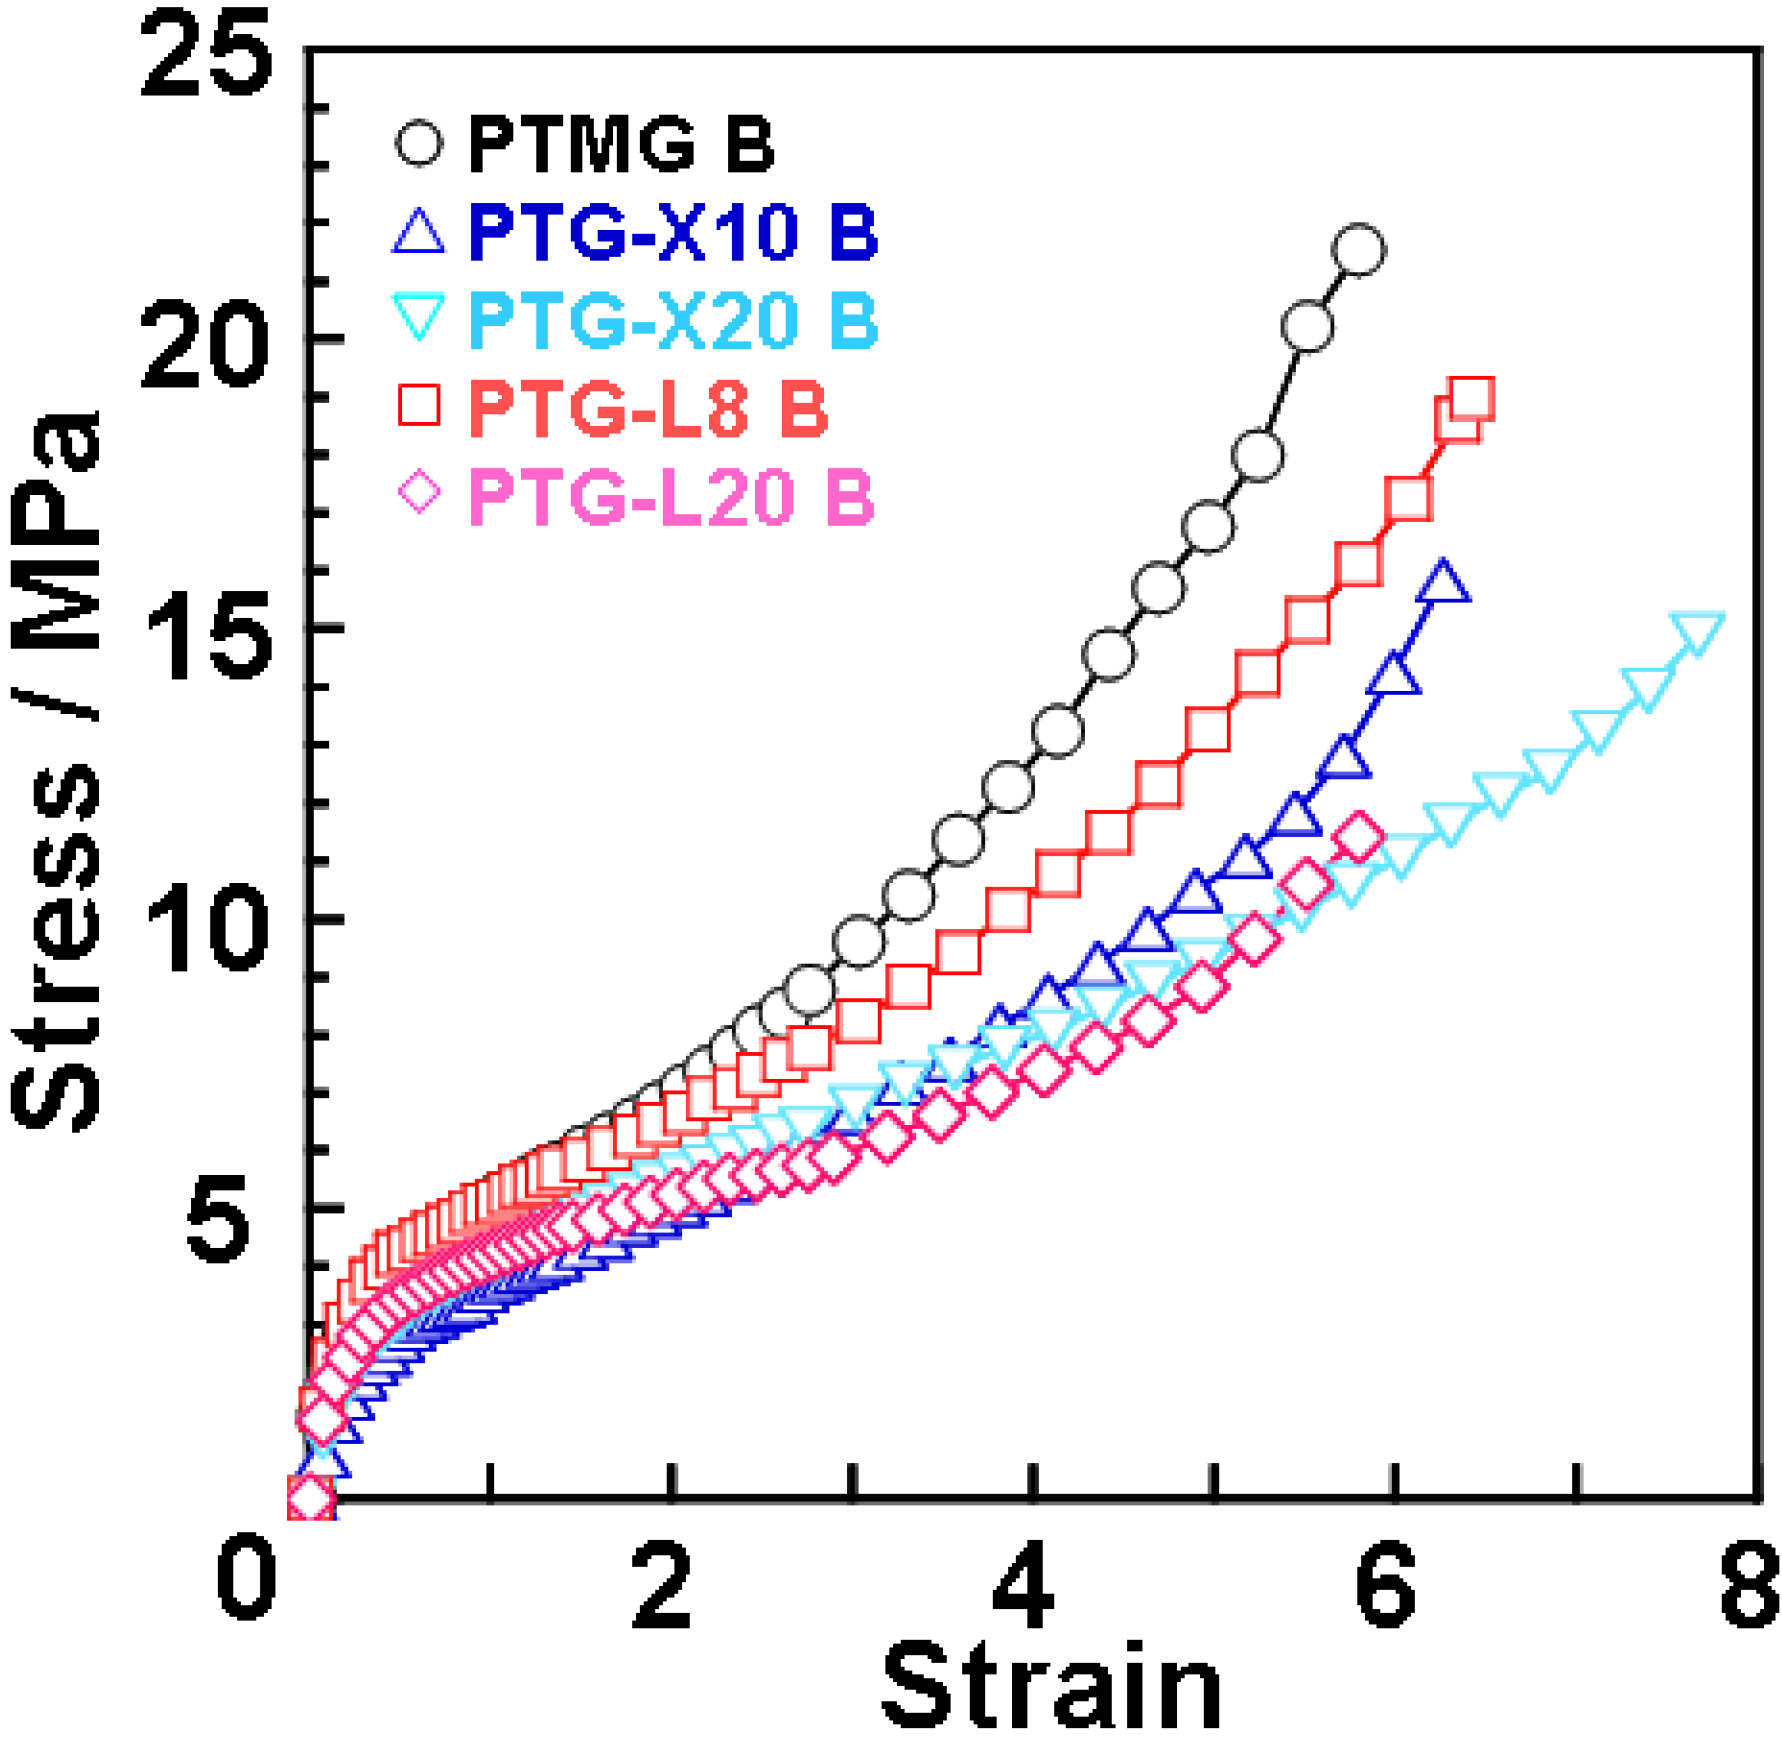
Figure 4 shows stress-strain curves for the polyether glycol-based PUEs at 20 °C. The methyl group content dependence of Young’s modulus, tensile strength and strain at break are given in
Figure 2. Young’s modulus decreased with increasing side methyl group content. This is because the incorporation of the side methyl group content causes restriction of crystallization of the soft segment chain and a decrease in physically crosslinking points due to a decrease in the degree of microphase separation. On the contrary, tensile strength and elongation at break decreased and increased, respectively. These changes can be attributed to the steric hindrance of dimethyl and methyl groups of the soft segment chains in the expanded state. That is, for PTMG B, PTG-X10 B and PTGL8 B, the soft segment chains can be crystallized well with increasing strain. In contrast, for PTG-X20 B and PTG-L20 B, dimethyl and methyl groups effectively disrupt crystallization of the soft segment and a phase mixing trend causes molecular slipping between the hard segments. Discussion about elongation-induced crystallization will be stated with the result of WAXD measurement. Stress-strain test revealed that introduction of methyl groups to polymer glycol is quite effective not only for the initial property (Young’s modulus) but also the elongated state (tensile strength and strain at break).
Figure 3.
Temperature dependence of storage modulus (E’), loss modulus (E”) and loss tangent (tan δ) of PTMG, PTG-X and PTG-L-based PUEs measured at 10 Hz.
Figure 3.
Temperature dependence of storage modulus (E’), loss modulus (E”) and loss tangent (tan δ) of PTMG, PTG-X and PTG-L-based PUEs measured at 10 Hz.
Dependence of methyl group content of the PTG-X series is slightly larger than that for the PTG-L ones. Dimethyl groups of the PTG-X preferentially exist near the end hydroxyl groups and are more bulky compared with methyl groups, resulting in a larger effect on molecular aggregation state of the hard segment. For this reason, the PTG-X series exhibited larger dependence on methyl group content in the case of no elongation.
Figure 4.
Stress-strain curves for PTMG, PTG-X, PTG-L-based PUEs measured at 20 °C.
Figure 4.
Stress-strain curves for PTMG, PTG-X, PTG-L-based PUEs measured at 20 °C.
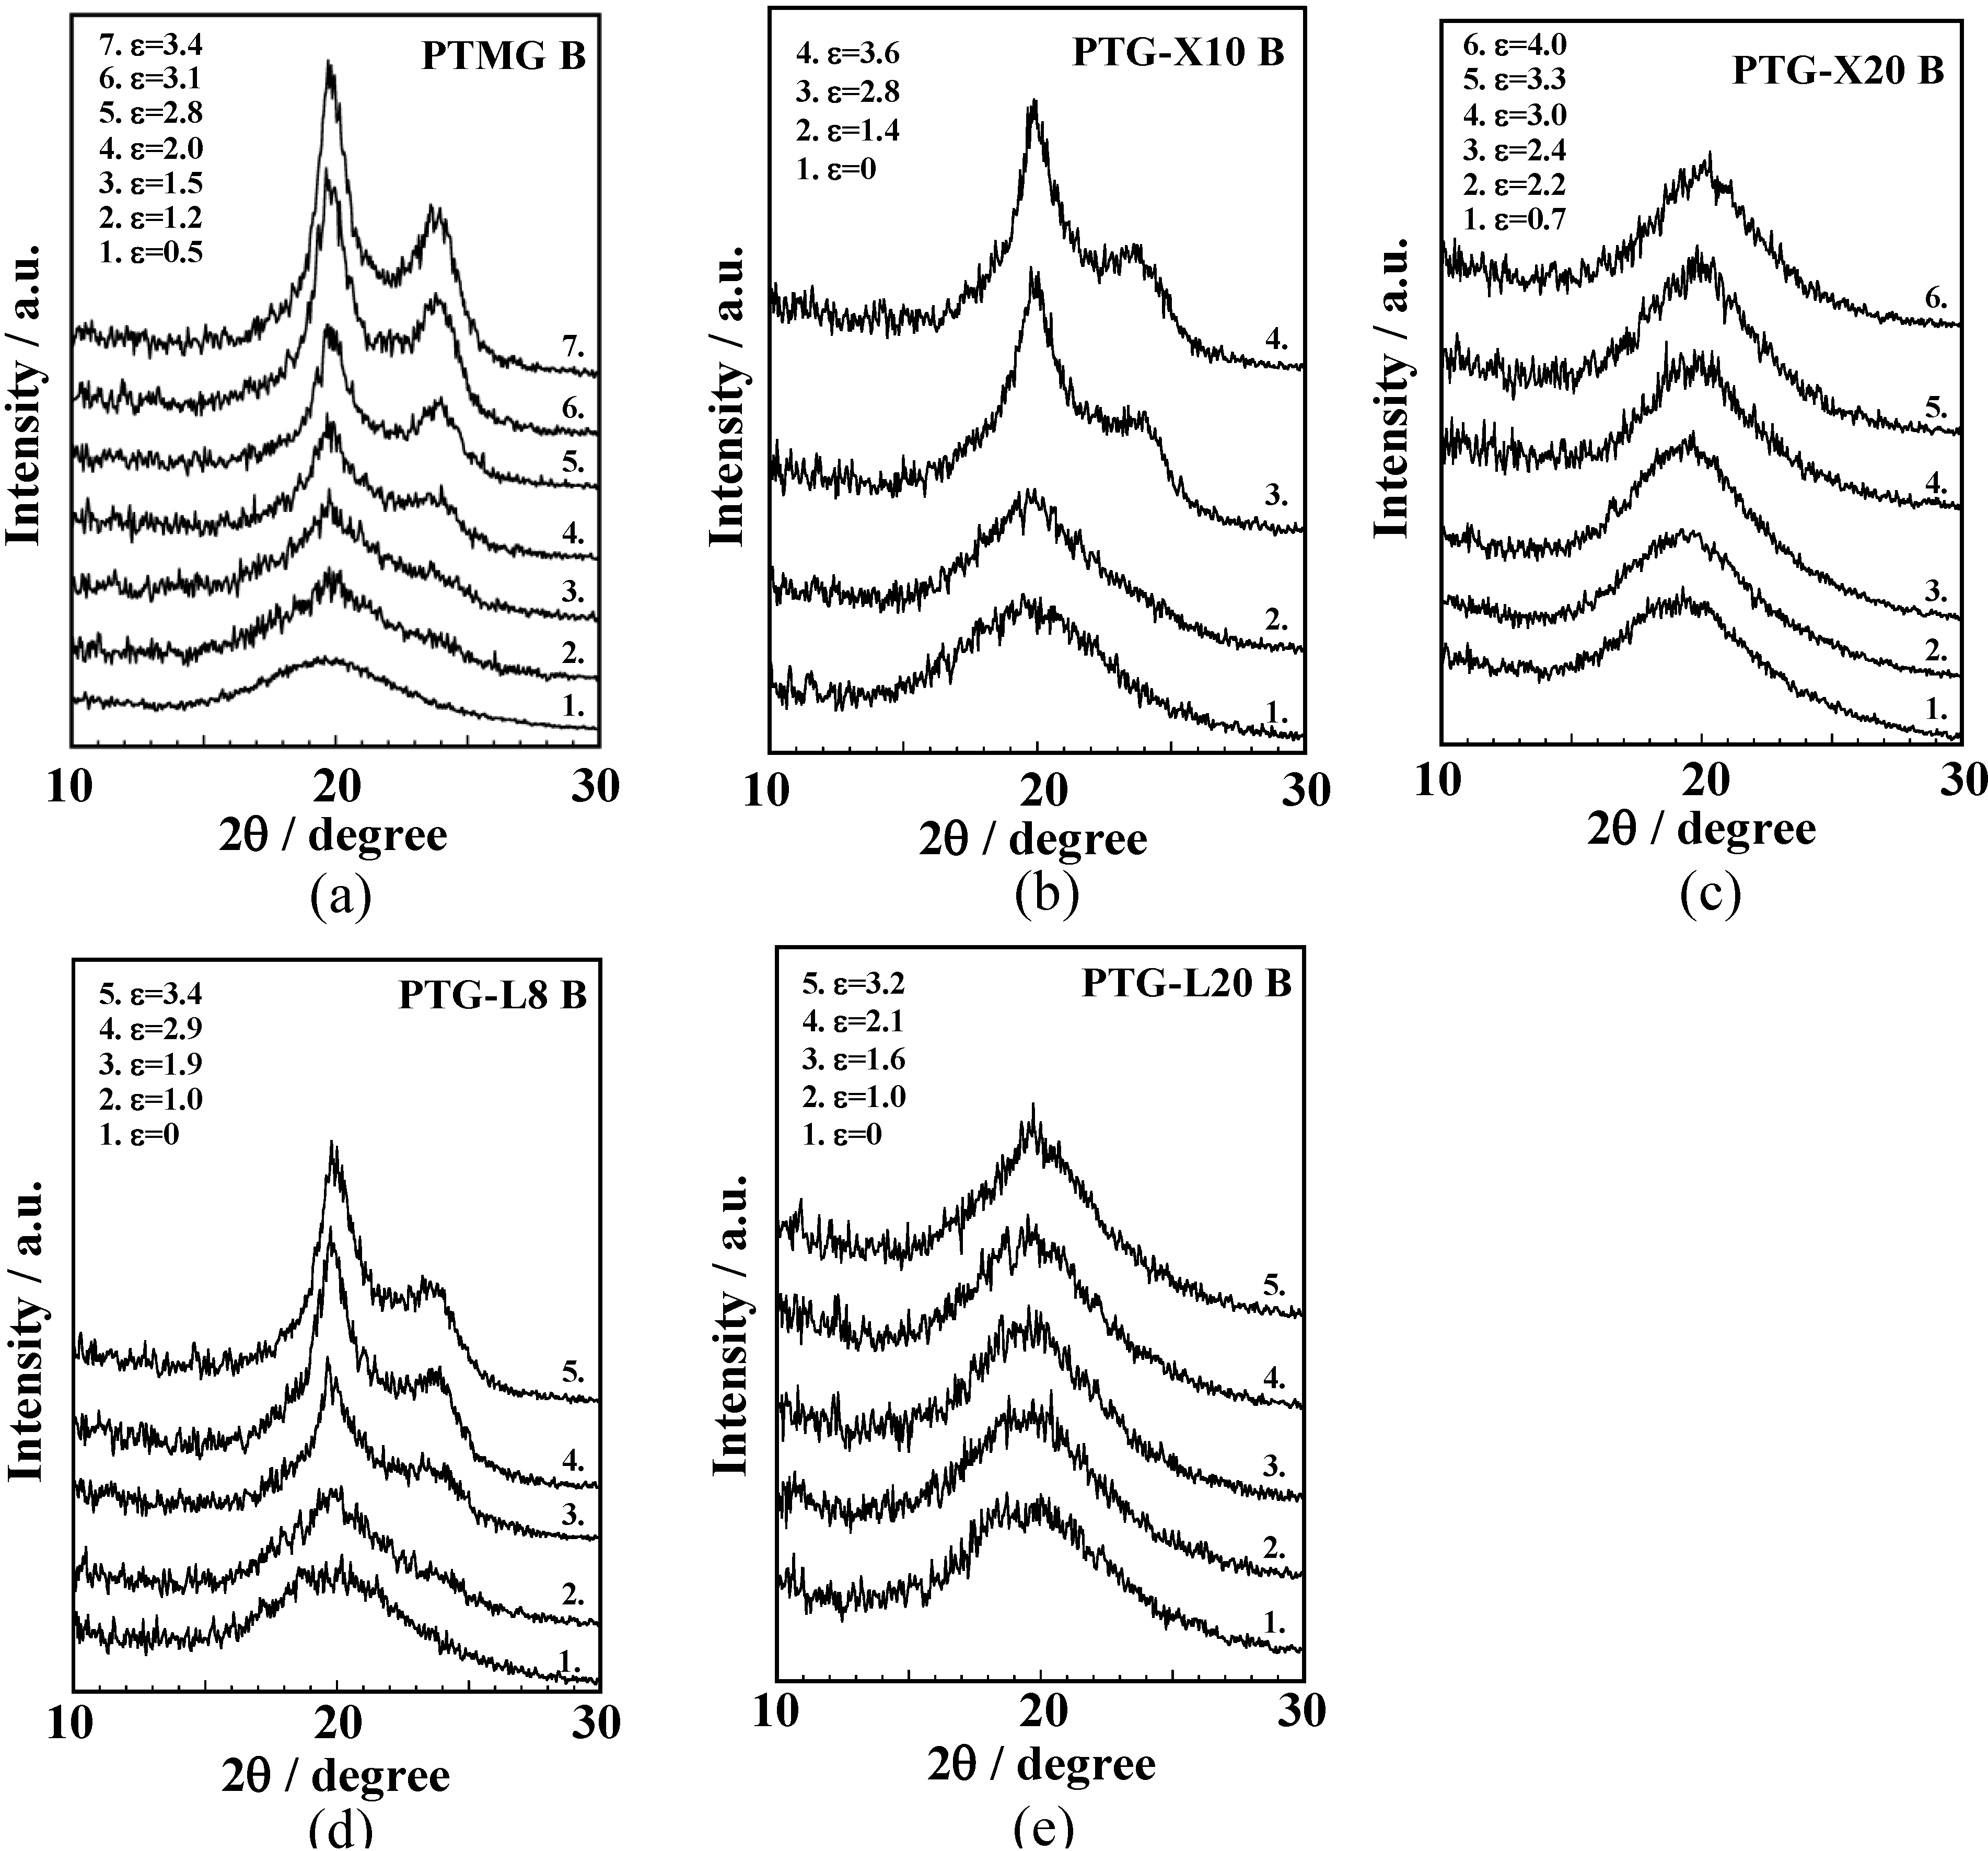
WAXD measurement was carried out at various strains to investigate the change in molecular aggregation structure of the PUEs during the elongation process.
Figure 5 (a)–(e) shows the WAXD profiles for the polyether glycol-based PUEs at various strains. Amorphous halo was observed at 2θ = 20° for all the PUEs at the initial state. With increasing strain, crystalline peaks were observed at 2θ = 20° and 24° for PTMG B, PTG-X10 B and PTG-L8 B. The minimum strain, at which diffraction peaks were observed, was
ca. 1.0. For PTMG B, PTG-X10 B and PTG-L8 B, two crystalline peaks were clearly observed in the higher strain region. Intensities of these crystalline peaks increased with increasing strain. It was reported that the crystal system of PTMG is monoclinic and its lattice constants are a = 0.559 nm, b = 0.890 nm, c = 1.207 nm, β = 134.2° [
24]. Thus, PTMG shows (020) and (100) at 2θ = 19.8° and 24.2° around 20°. Therefore, it seems likely to consider that these two peaks observed for the PTMG B, PTG-L8 B and PTG-X10 B PUEs can be assigned to the crystal formed with the soft segment chain. Hence, it is conceivable that the elongation-induced crystallization occurred during the elongation process for PTMG B, PTG-X10 B and PTG-L8 B. In contrast, no crystalline peaks were observed for PTG-X20 B and PTG-L20 B even at a higher strain, although a peak position of the amorphous halo shifted to larger 2θ region. This indicates that the soft segment chain oriented toward the elongation direction and the molecular distance of the soft segment chain in the PTG-X20 B and PTG-L20 B PUEs became smaller, but they did not crystallize due to the strong steric hindrance of side methyl groups.
Figure 5.
WAXD profiles of (a) PTMG B, (b) PTG-X10 B, (c) PTG-X20 B, (d) PTG-L8 B and (e) PTG-L20 B at various strains.
Figure 5.
WAXD profiles of (a) PTMG B, (b) PTG-X10 B, (c) PTG-X20 B, (d) PTG-L8 B and (e) PTG-L20 B at various strains.
3.2. PC-Glycol-Based PUEs
We shall discuss the results on the PC-glycol-based PUEs. The nomenclature consists of four digits. The first two numbers indicate the number of methylene units (C4 and C6). The third number relates the molar ratio of the C4 unit. That is, 4,602, 4,652, 4,672 and 4,692 refer to 0, 50, 70, and 90 mol % C4 unit, respectively. The last number indicates the thousand digit of the molecular weight of poly(carbonate) glycols. To evaluate microphase separation in detail, two PUEs with different formulation ratio (K = [NCO]/[OH]) were employed.
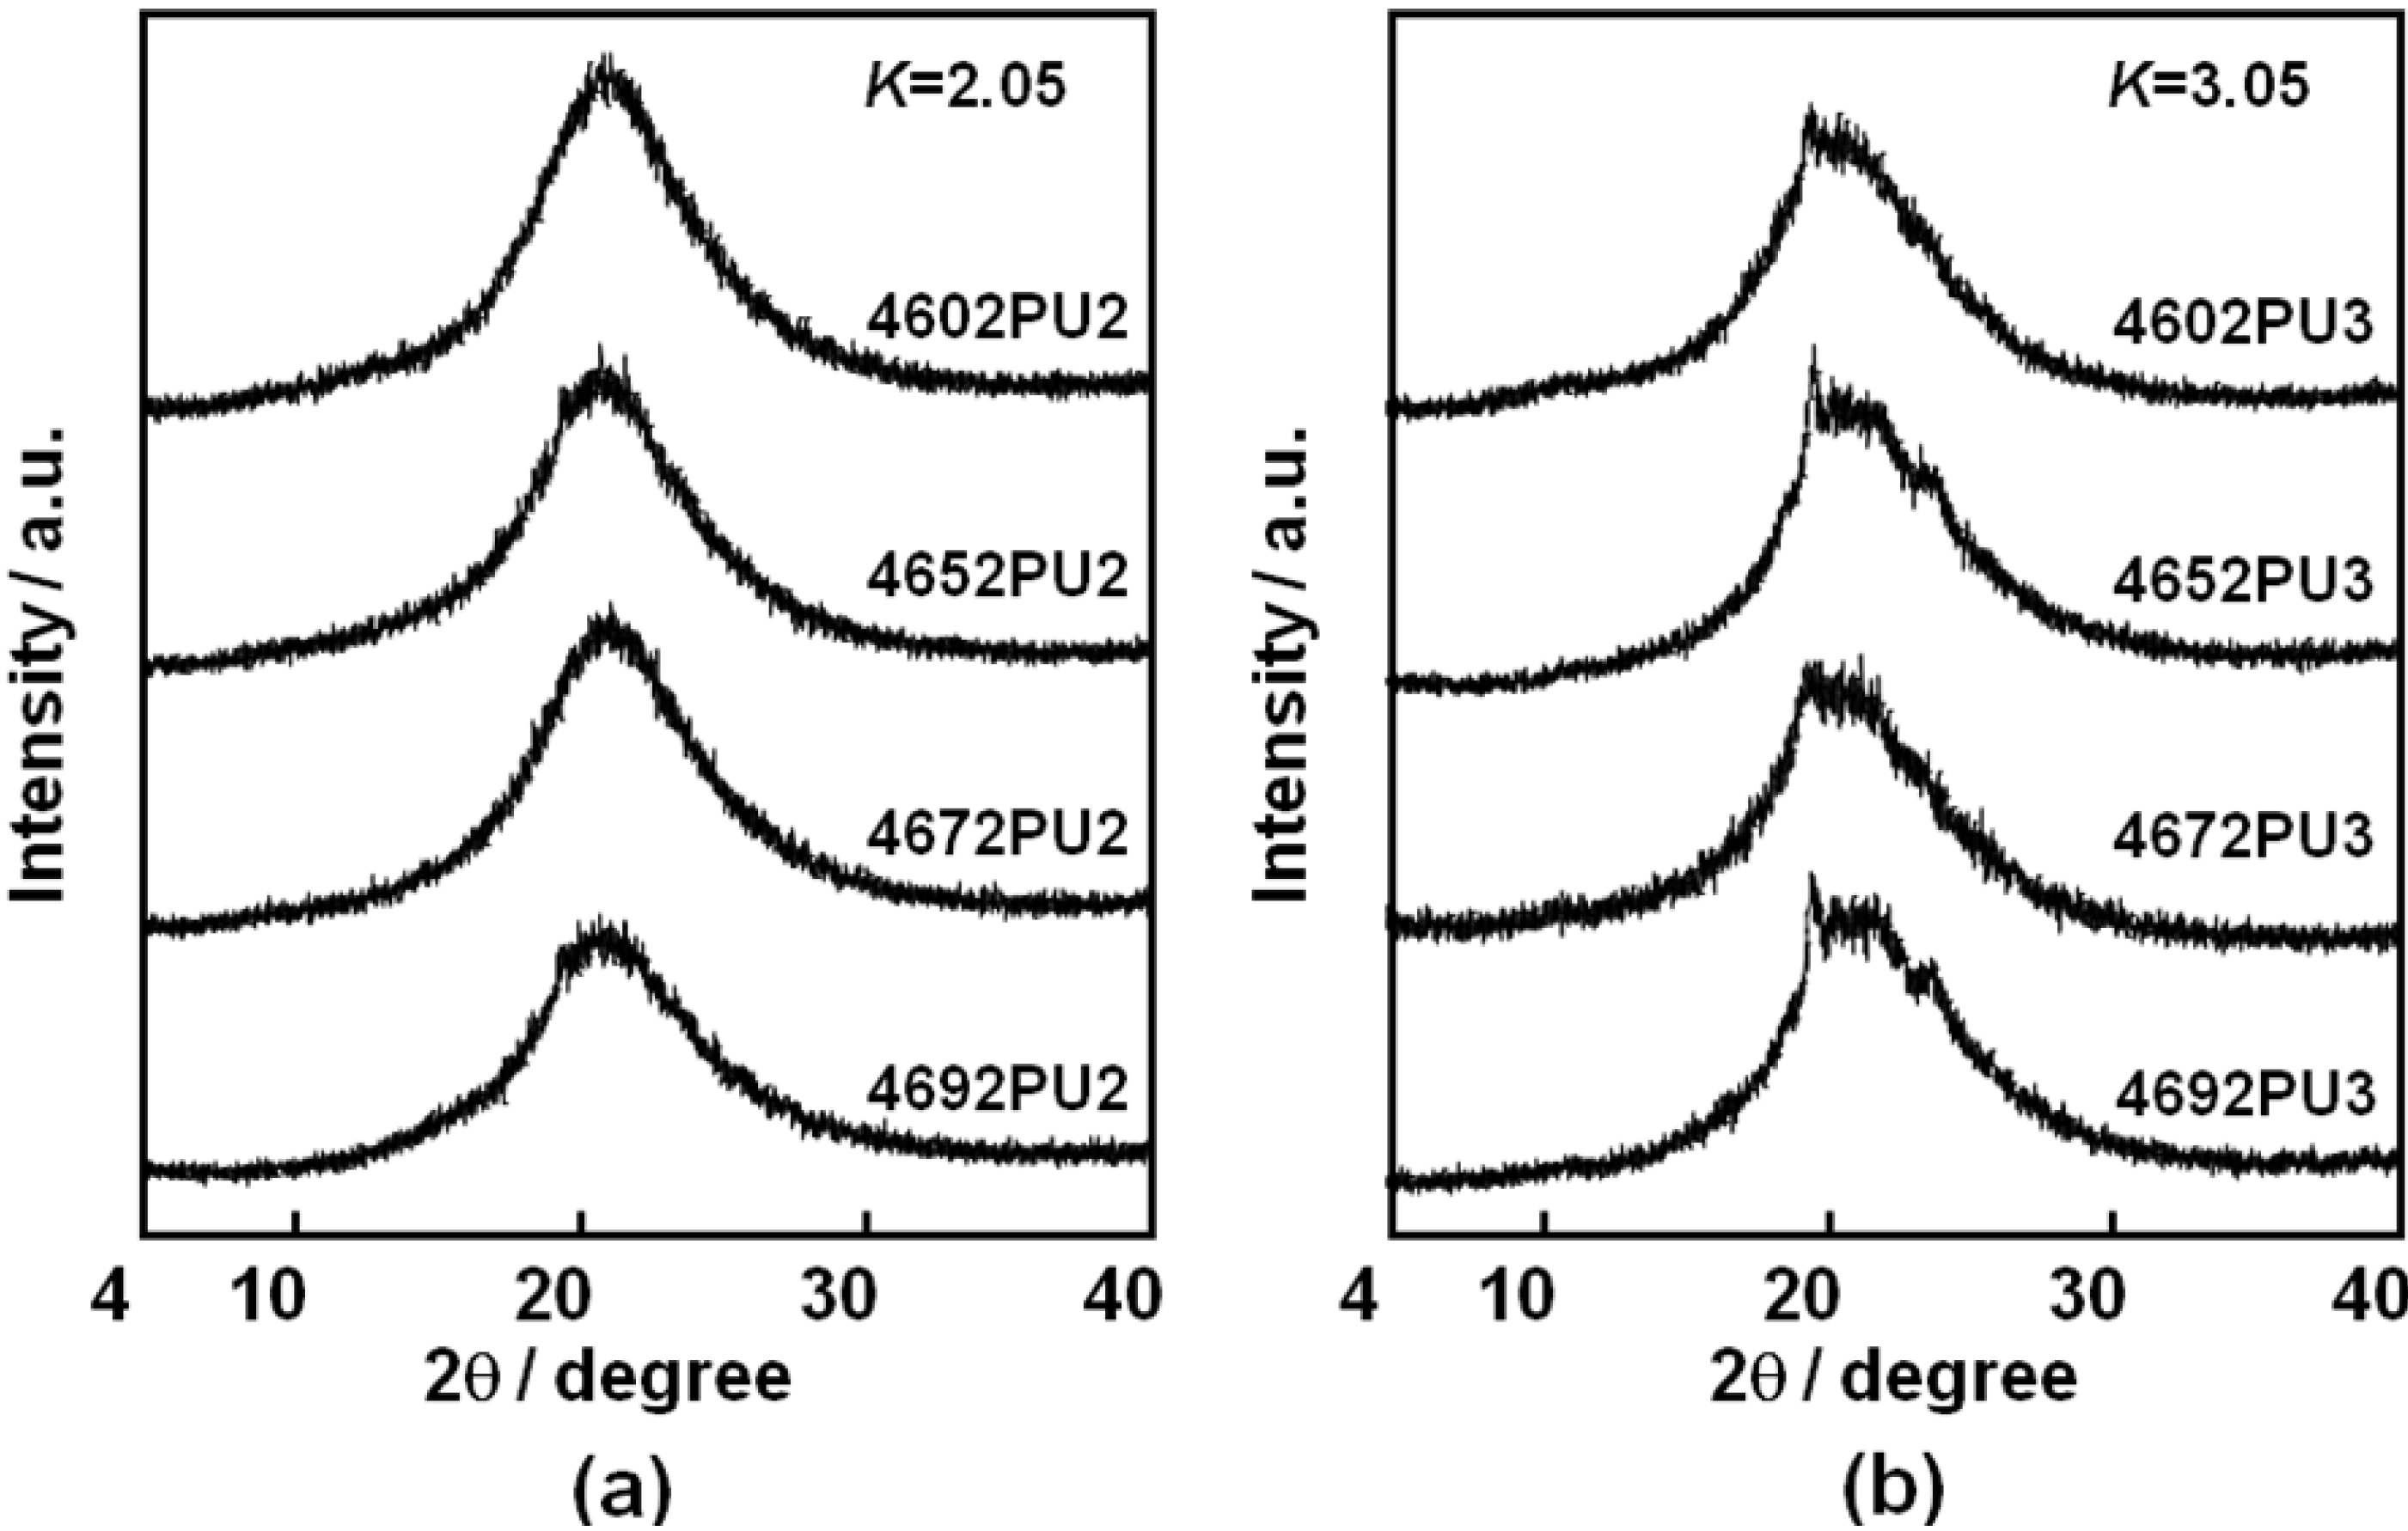
The crystalline state of the PUEs was investigated using WAXD measurement.
Figure 6 shows the WAXD profiles of the PC-glycol-based PUEs with (a)
K = 2.05 and (b)
K = 3.05. For the PUEs with
K = 2.05, an amorphous halo was observed. In contrast, WAXD profiles of the PUEs with
K = 3.05 exhibited crystalline peaks as well as an amorphous halo. WAXD pattern of the hard segment model (-(MDI-BD)
n-) shows diffraction peaks around 10° and 20° [
25,
26,
27]. Since hard segment content increased with an increase in
K, it seems that these crystalline peaks in
Figure 6(b) are from crystallized hard segment domains. No clear dependence of the C
4 composition ratio on crystallized hard segment domains was observed for the PUEs.
Figure 6.
WAXD patterns for PC-glycol-based PUEs. (a) K = 2.05 and (b) K = 3.05.
Figure 6.
WAXD patterns for PC-glycol-based PUEs. (a) K = 2.05 and (b) K = 3.05.
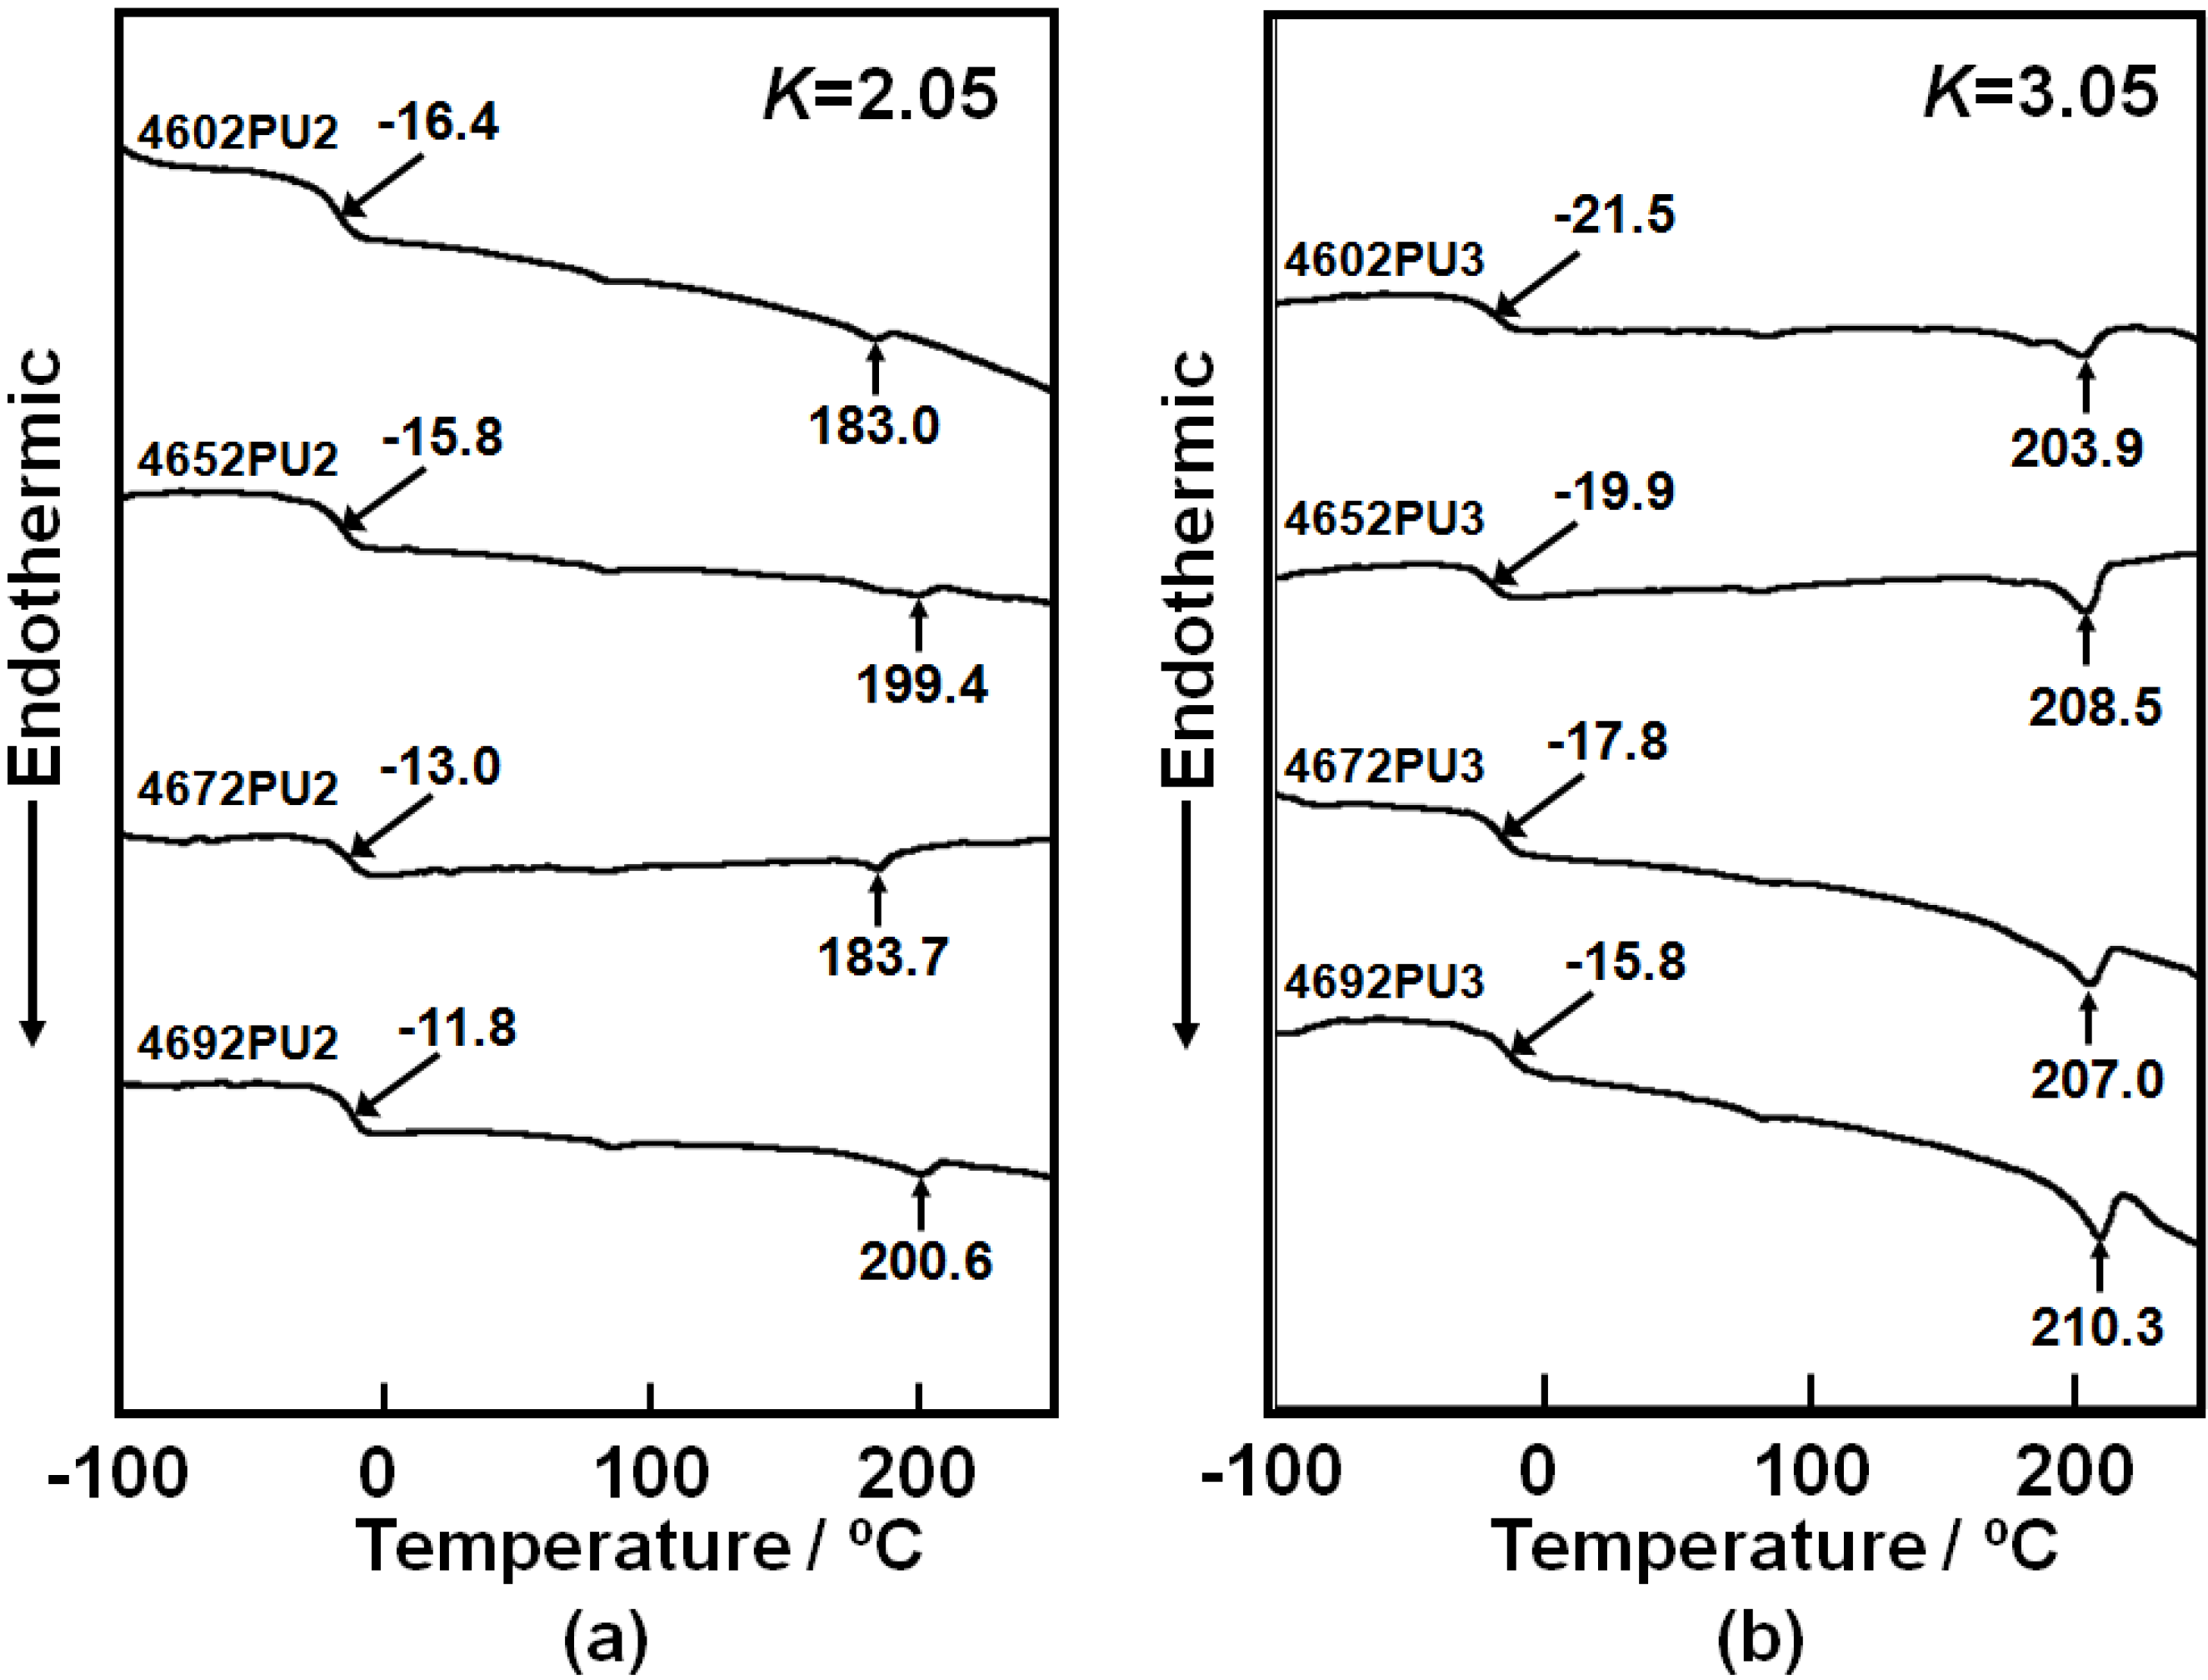
To evaluate the thermal property of the PC-glycol-based PUEs, DSC measurements were carried out.
Figure 7 shows the DSC thermograms of the PC-glycol based PUEs with (a)
K = 2.05 and (b) 3.05. The
Tgs of the soft segment were observed from −22 to −10 °C for all PUEs and
Tgs of the PUEs with
K = 3.05 showed lower temperature compared to those with
K = 2.05. Also,
Tg increased with increasing C
4 composition ratio for both PUEs. Melting points of the soft segment were not observed for all PUEs, however, those of the hard segment domains were at around 200 °C. Tiny endothermic peaks were observed at around 80 °C. This might be attributed to the melting of short-range hard segment domains or microphase separation transition. It is indispensable for the discussion of the microphase-separated structure to obtain Δ
Tg, which is the subtraction between
Tg of the soft segment in the PUEs and
Tg of original polymer glycol. Δ
Tg of the PUEs with
K = 3.05 exhibited smaller magnitude than for
K = 2.05. Also, Δ
Tg decreased with an increasing C
4 composition ratio. The melting point of the hard segment domains of the PUEs with
K = 3.05 was higher than for
K = 2.05 and increased with increasing C
4 composition ratio. Furthermore, the heat of fusion of the melting of the hard segment domains in
Figure 7(a) are quite small. Therefore, it seems reasonable to conclude that the microphase separation of the PC-glycol-based PUEs became stronger with increases in
K and C
4 composition ratio. This behavior may arise from the lower chain mobility of PC-glycol with high C
4 composition ratio.
Figure 7.
DSC thermograms for PC-glycol-based PUEs. (a) K = 2.05 and (b) K = 3.05.
Figure 7.
DSC thermograms for PC-glycol-based PUEs. (a) K = 2.05 and (b) K = 3.05.
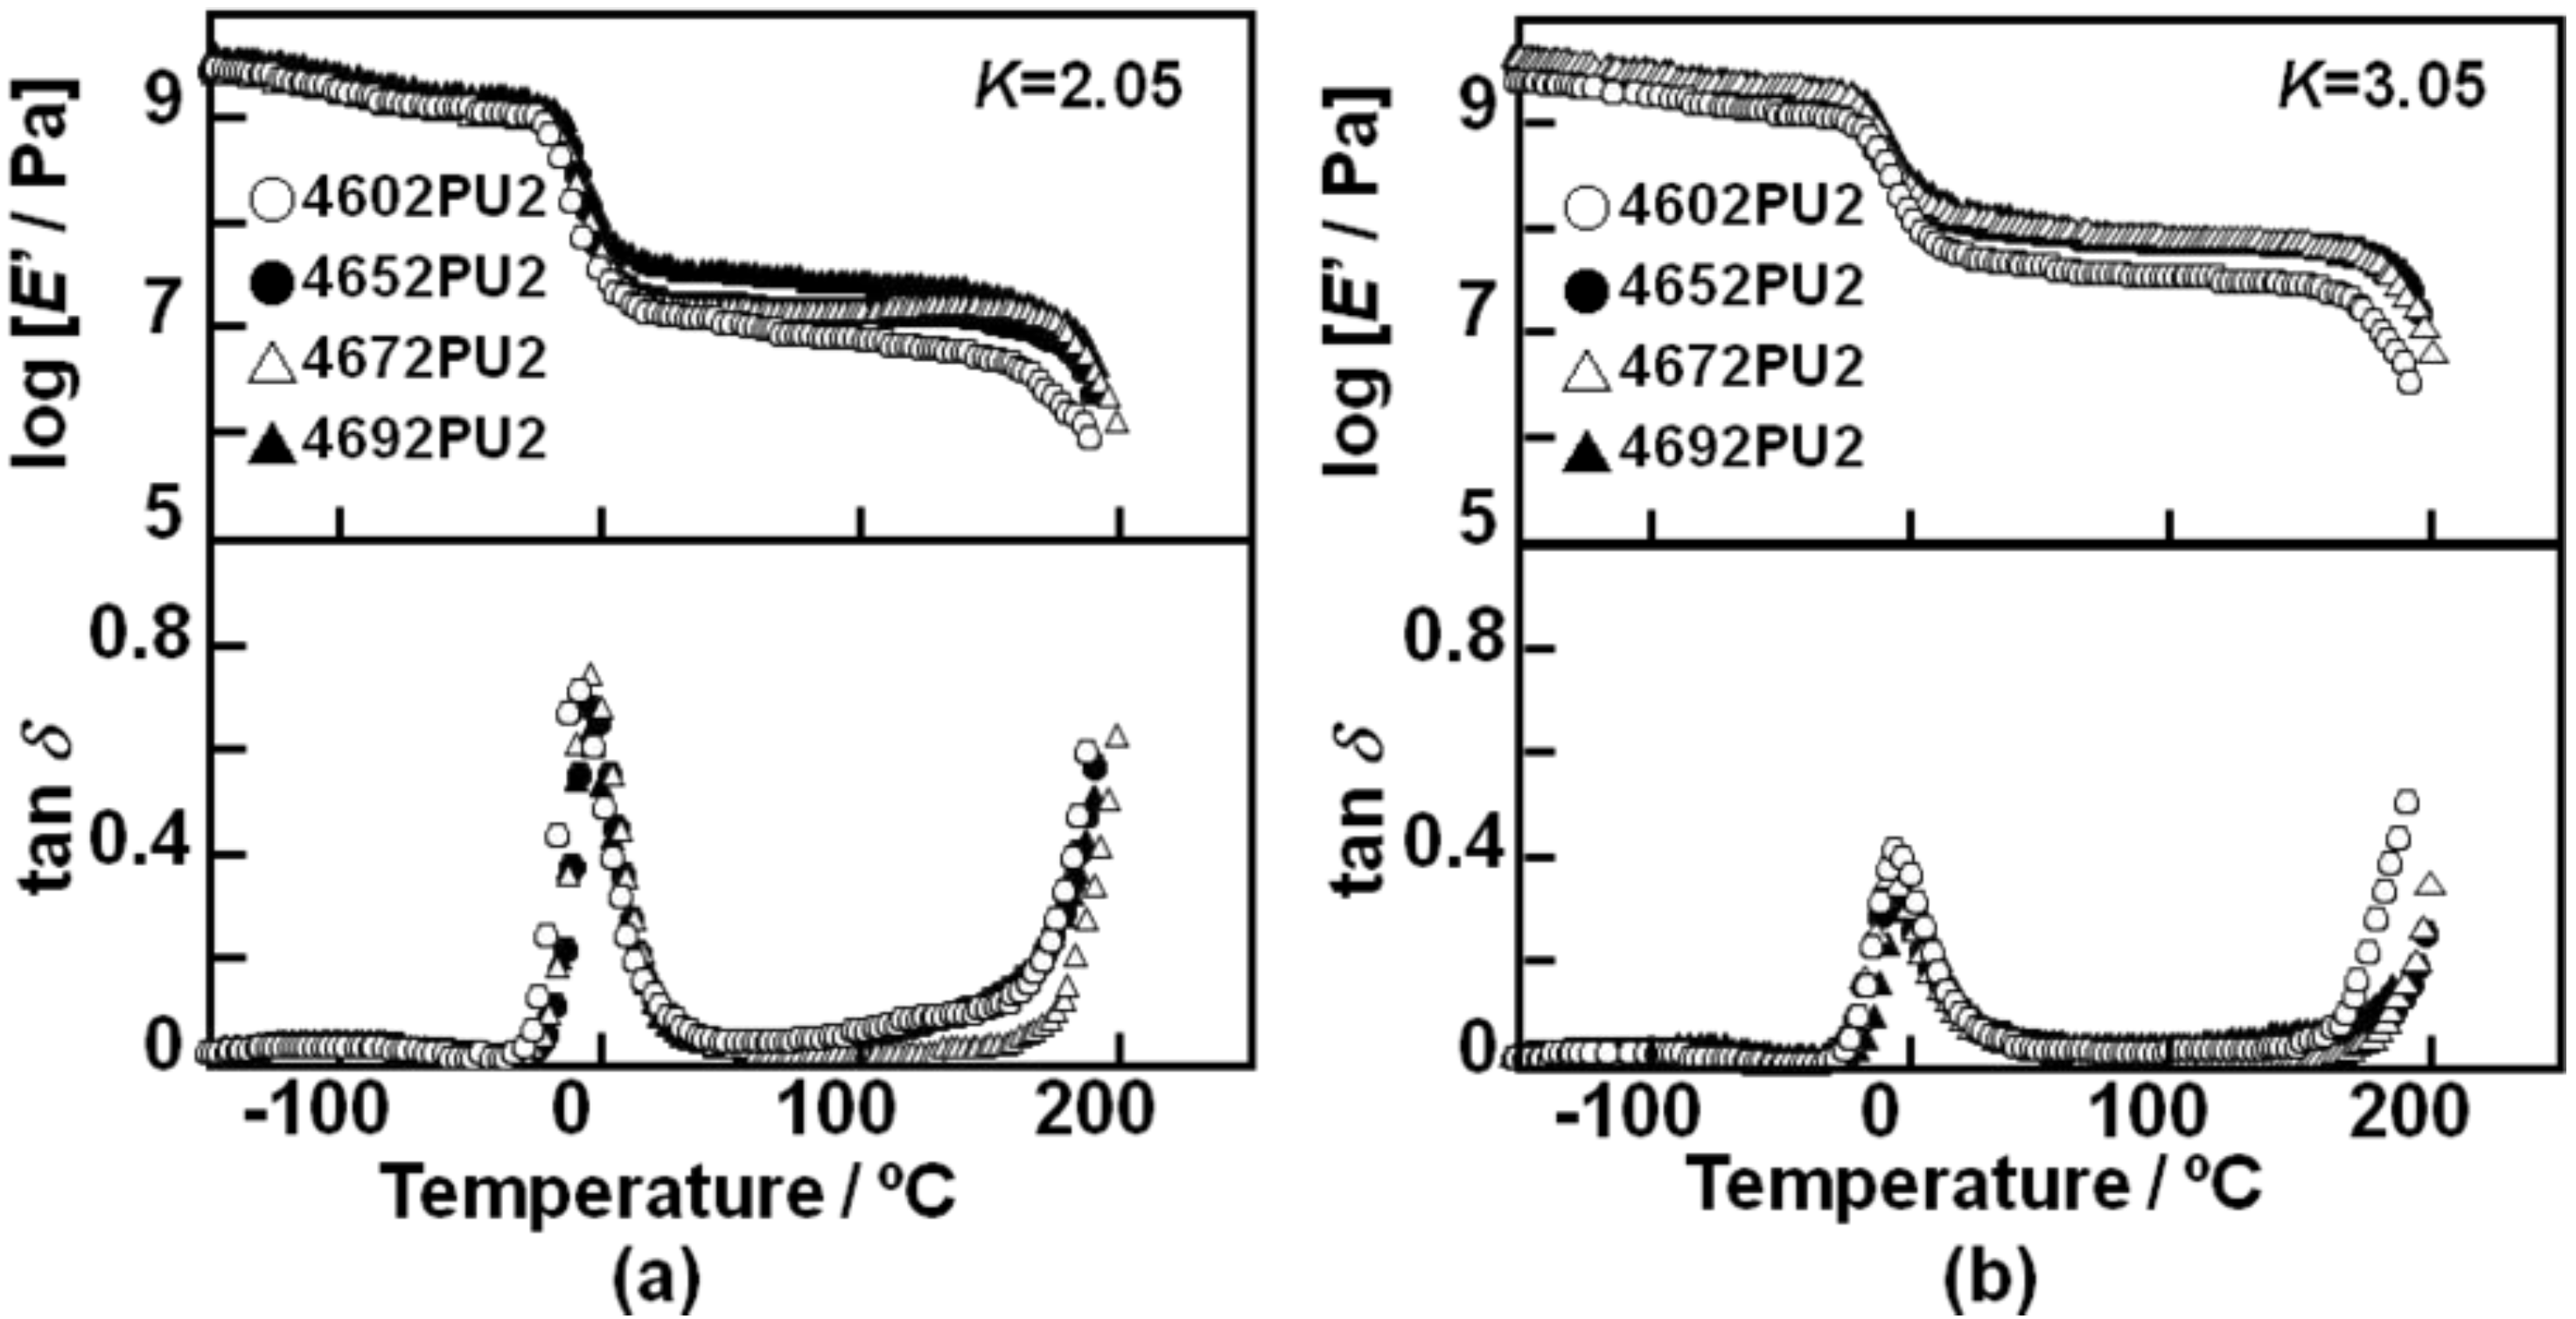
Figure 8 shows the temperature dependence of storage modulus,
E’, and loss tangent, tan
δ, for the PC-glycol-based PUEs with (a)
K = 2.05 and (b)
K = 3.05.
E’ and tan
δ showed typical curves as observed for general thermoplastic polyurethane elastomers. The values of
E’ in the rubbery plateau region of the PUEs with
K = 3.05 were larger than for
K = 2.05, as expected. The order of
E’ of the rubbery plateau region was 4602 PU < 4652 PU ≃ 4672 PU < 4692 PU for both PUEs with
K = 2.05 and 3.05. These results correspond well to Young’s modulus and hardness. Peak intensity of tan
δ of the PUEs with
K = 2.05 was much larger than for
K = 3.05. Also, the onset temperature of the tan
δ peak was observed at around −20 °C, which corresponds well to the
Tg obtained by DSC. Starting temperatures of terminal flow of the 4672 and 4692 PUEs for both
K = 2.05 and 3.05 were slightly higher than the others. It can be said that introduction of the C
4 unit improves the heat resistance on account of the increased content of carbonate groups.
Figure 8.
Temperature dependence of storage modulus, E’, and loss tangent, tan δ, for PC-glycol-based PUEs. (a) K = 2.05 and (b) K = 3.05.
Figure 8.
Temperature dependence of storage modulus, E’, and loss tangent, tan δ, for PC-glycol-based PUEs. (a) K = 2.05 and (b) K = 3.05.
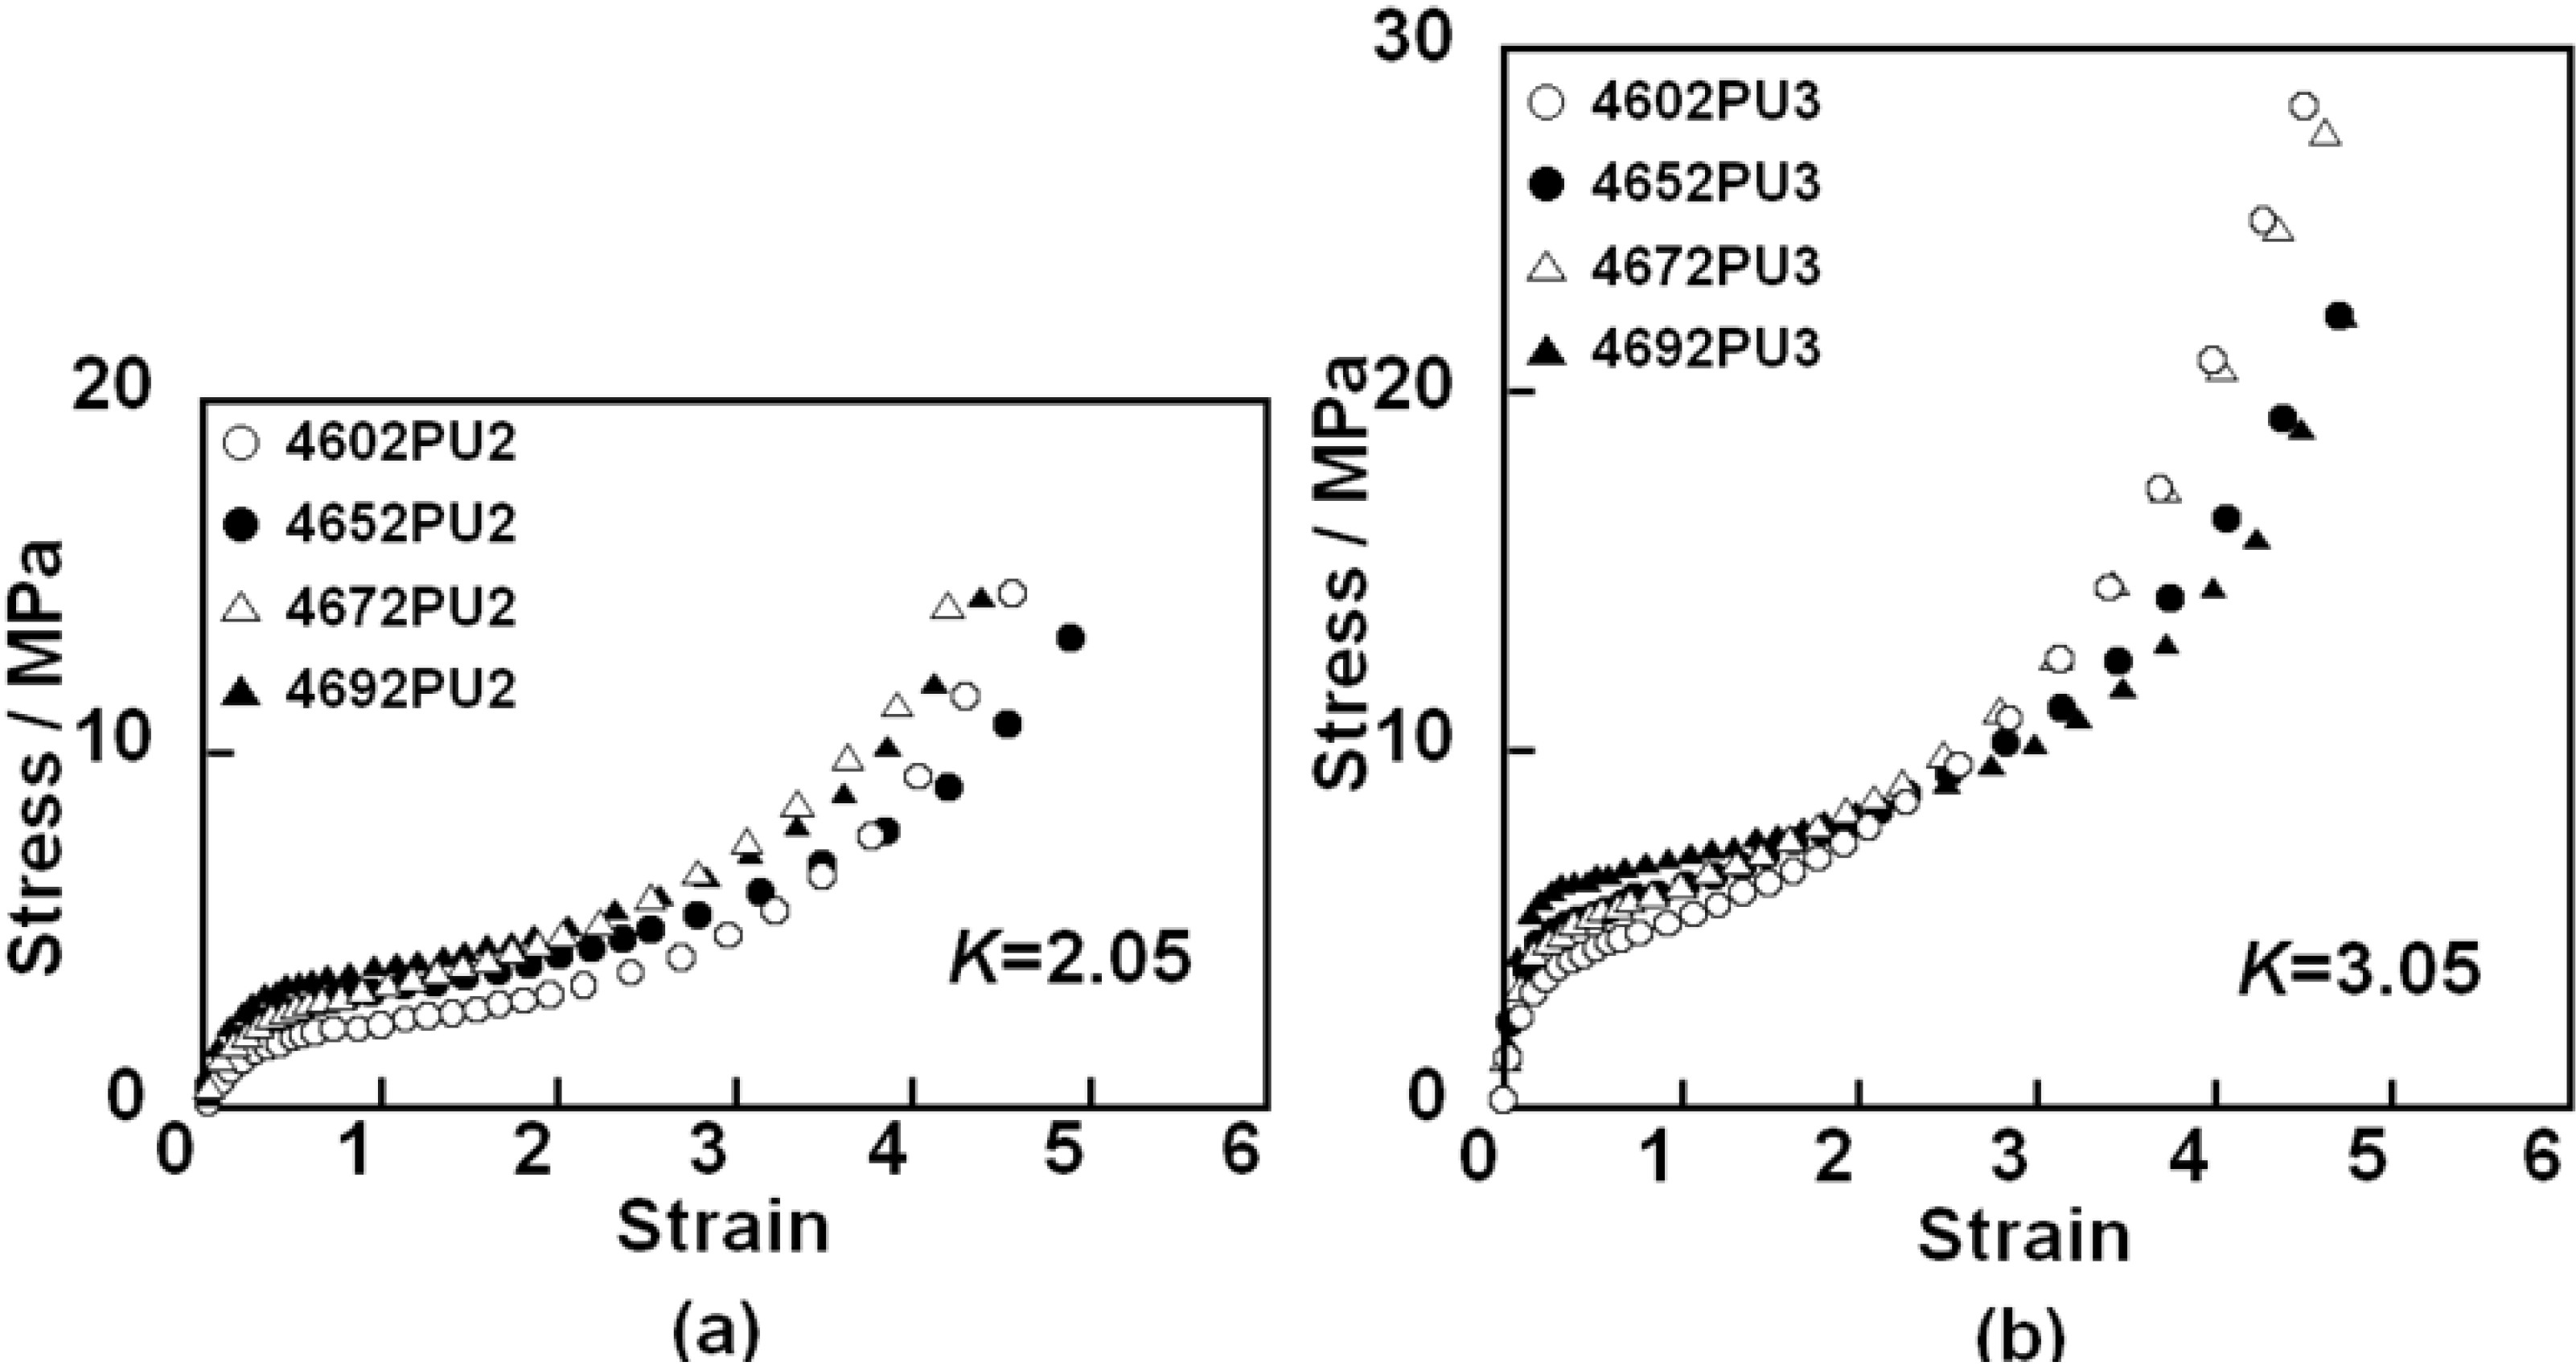
Mechanical properties of the PC-glycol-based PUEs were evaluated using tensile testing.
Figure 9 shows the stress-strain (
ε) curves for the PC-glycol-based PUEs with (a)
K = 2.05 and (b)
K = 3.05. Young’s modulus of these PUEs increased with increases in
K and C
4 composition ratio. This is due to increases in hard segment content, the degree of microphase separation and stiffness of polymer glycol with increases in
K and C
4 composition ratio. Tensile strength and strain at break showed similar magnitude for the PUEs with each
K. Steep increases in stress, which is related to the elongation-induced crystallization of the soft segment component, were observed above
ε = 3 for all PUEs. The slope in this region seems to be correlated to the degree of orientation and/or crystallization of the soft segment chain in the PUEs. 4602 PUs and 4692 PUs exhibited a larger slope compared with 4652 PUs and 4672 PUs for both
K = 2.05 and 3.05. In other words, the slope of these PUEs decreased, and then increased with increasing C
4 composition ratio. Elongation-induced crystallization is closely related to the regularity of packing of the glycol soft segment; that is, the symmetry of chemical structure is quite important. The structural irregularities of 4652 and 4672 are much bigger than those of 4602 and 4692. This would be the reason that the slope showed a minimum at around 50% of C
4 composition ratio.
Figure 9.
Stress-strain curves for PC-glycol-based PUEs. (a) K = 2.05 and (b) K = 3.05.
Figure 9.
Stress-strain curves for PC-glycol-based PUEs. (a) K = 2.05 and (b) K = 3.05.
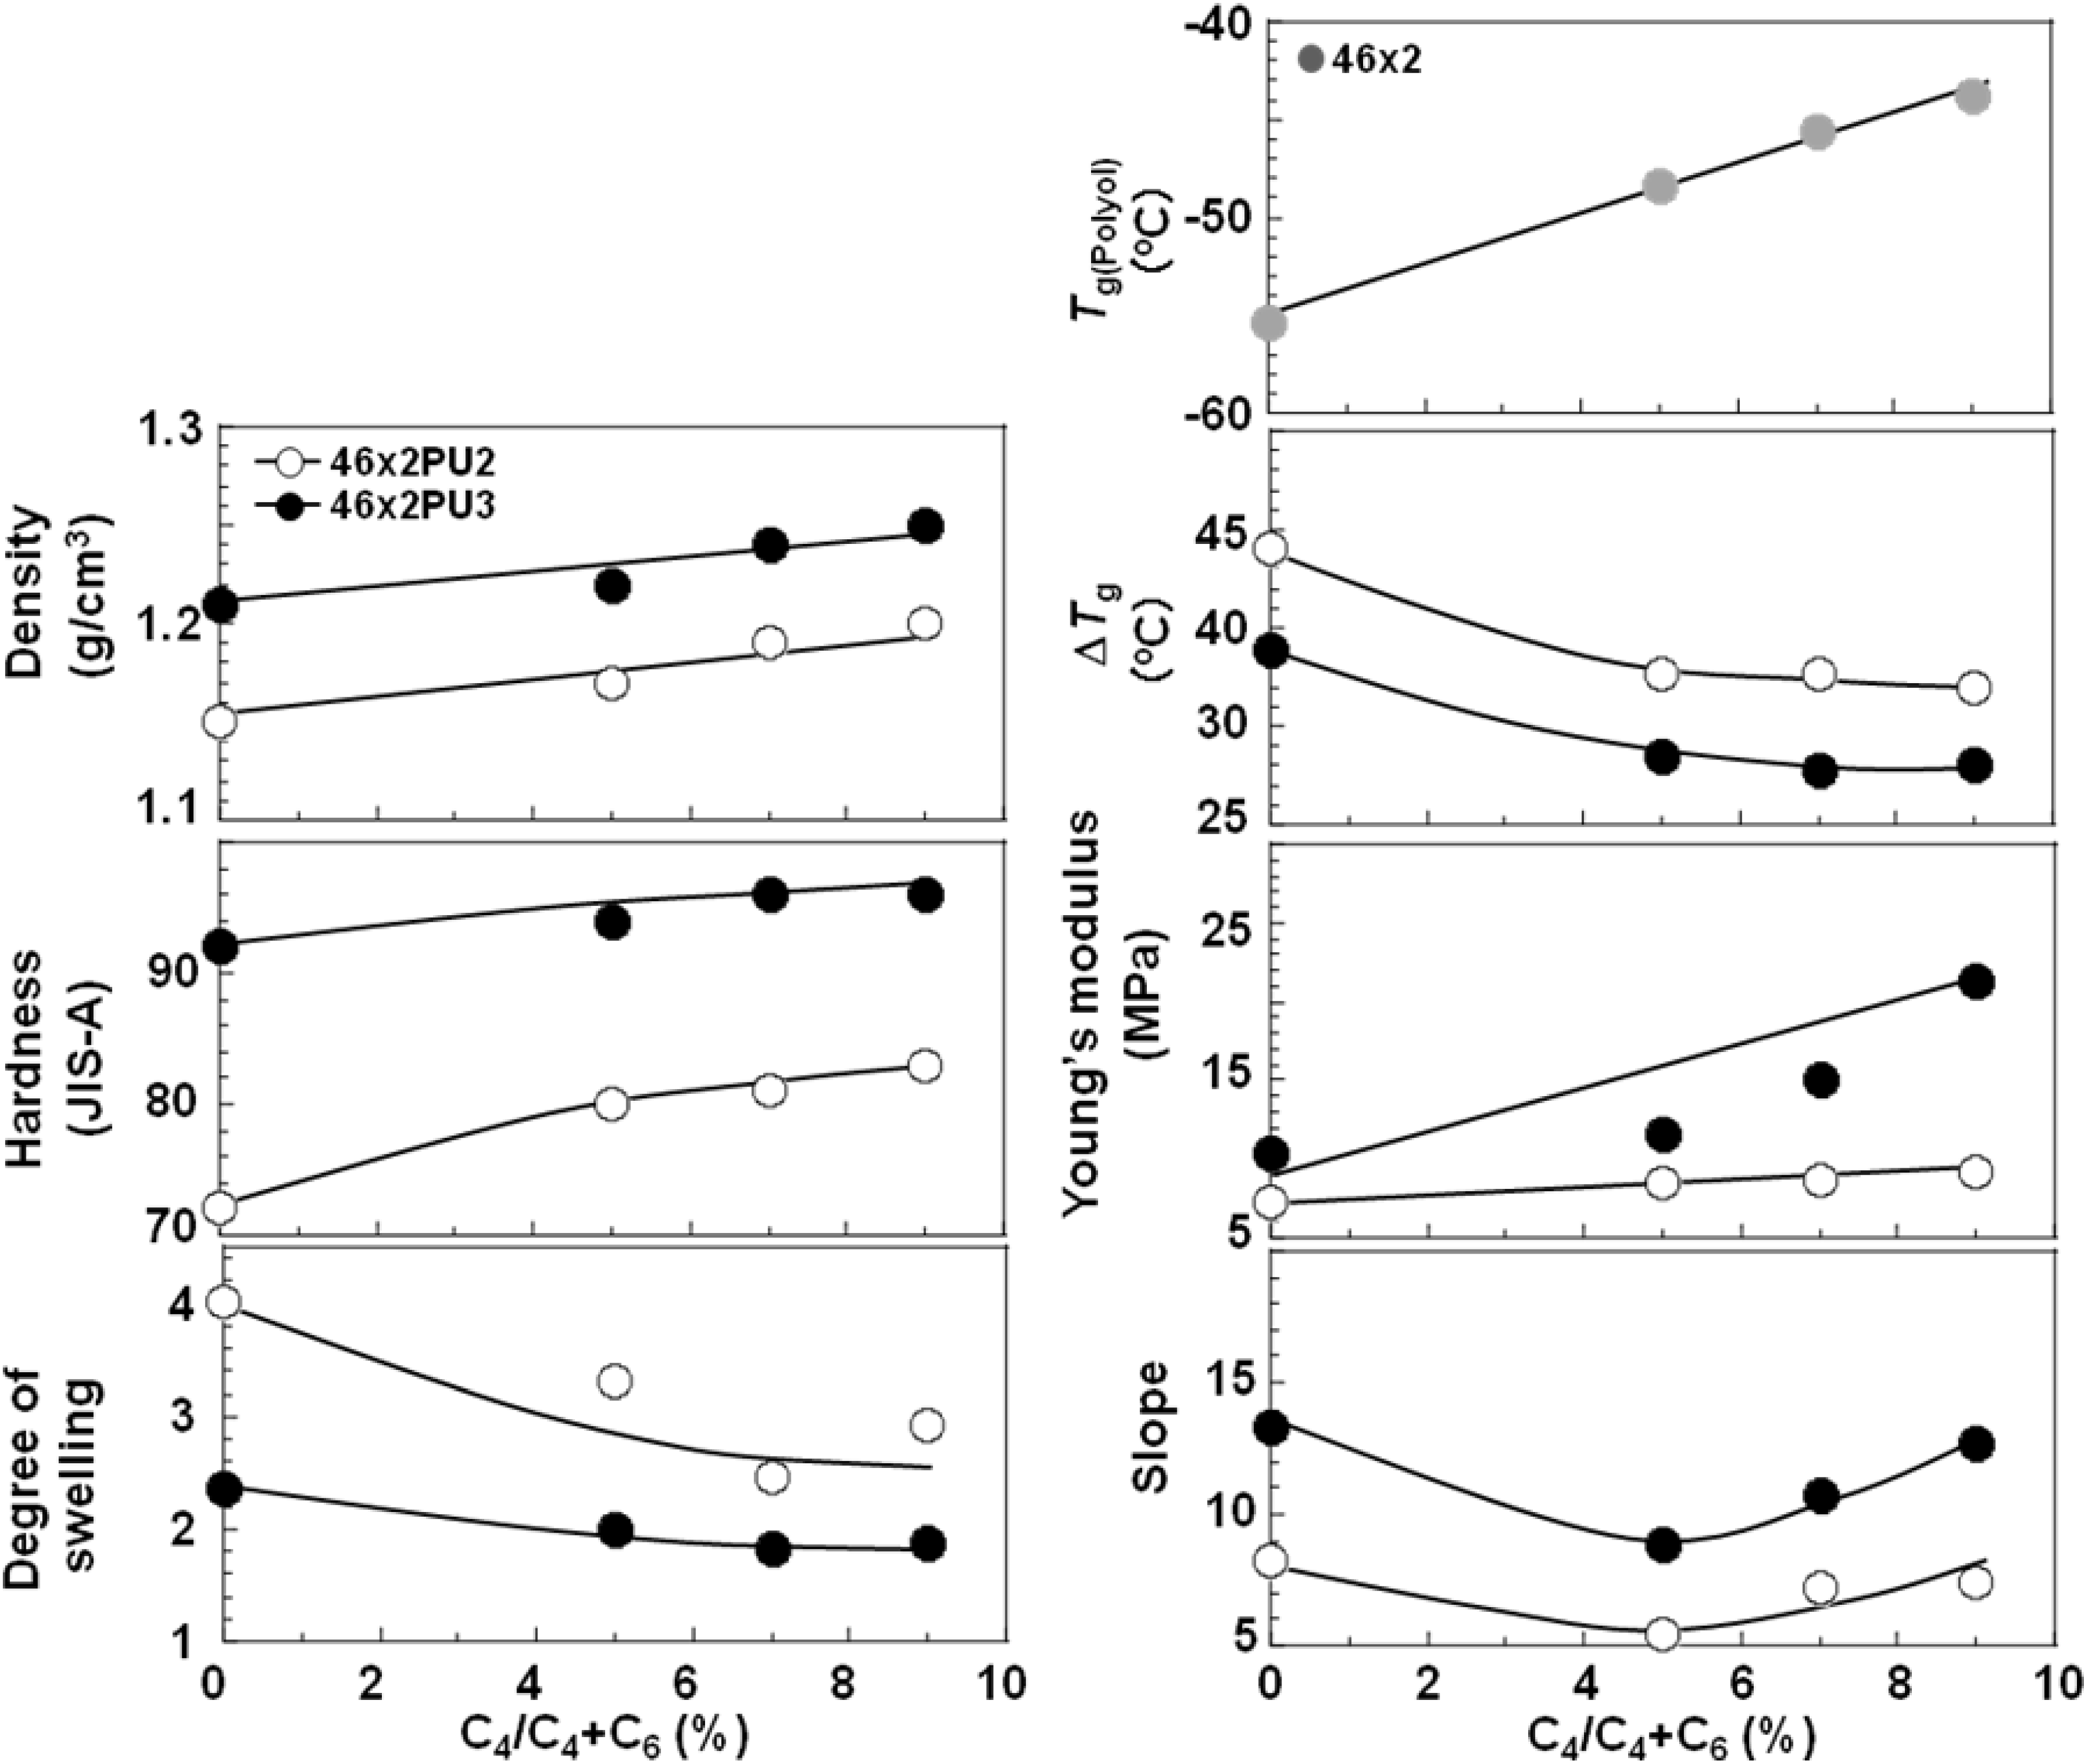
To discuss the C
4 composition ratio dependence of polycabonate based PUEs, all results are summarized in
Figure 10.
Figure 10 shows the C
4 composition ratio dependence of the density, hardness, degree of swelling,
Tg, Δ
Tg, Young’s modulus and slope around high strain region in the stress-strain curve for all the PC-glycol-based PUEs. Density, hardness and Young’s modulus increased, in contrast, degree of swelling and Δ
Tg decreased with increasing C
4 composition ratio. On the contrary, the values except Δ
Tg increased with increasing
K. As stated above, the microphase separation of the PC-glycol-based PUEs became stronger with increases in
K and C
4 composition ratio. The trends of hardness and Young’s modulus correspond well to this change in the degree of microphase separation.
Casetta
et al. reported the effect of side methyl groups of the PC-glycols on the mechanical properties of the PUEs [
20]. The
Tgs of the randomly copolymerized PC-glycols in this study were lower than for the PC-glycols with methyl side groups. On the contrary, the change in the mechanical properties, for instance, Young’s modulus, tensile strength and strain at break exhibited similar values. Therefore, it seems reasonable to conclude that the introduction of different methylene chains between carbonate groups by random copolymerization is a quite effective method to improve the mechanical properties of the PUEs, similarly to introduction of side methyl groups.
Figure 10.
C4 composition ratio dependence of various properties for random PC-glycol-based PUEs.
Figure 10.
C4 composition ratio dependence of various properties for random PC-glycol-based PUEs.
