
Influence of Service Conditions and Mix Design on the Physical–Mechanical Properties of Roller-Compacted Concrete for Pavement

Abstract
:1. Introduction
2. Materials and Methods
2.1. Materials
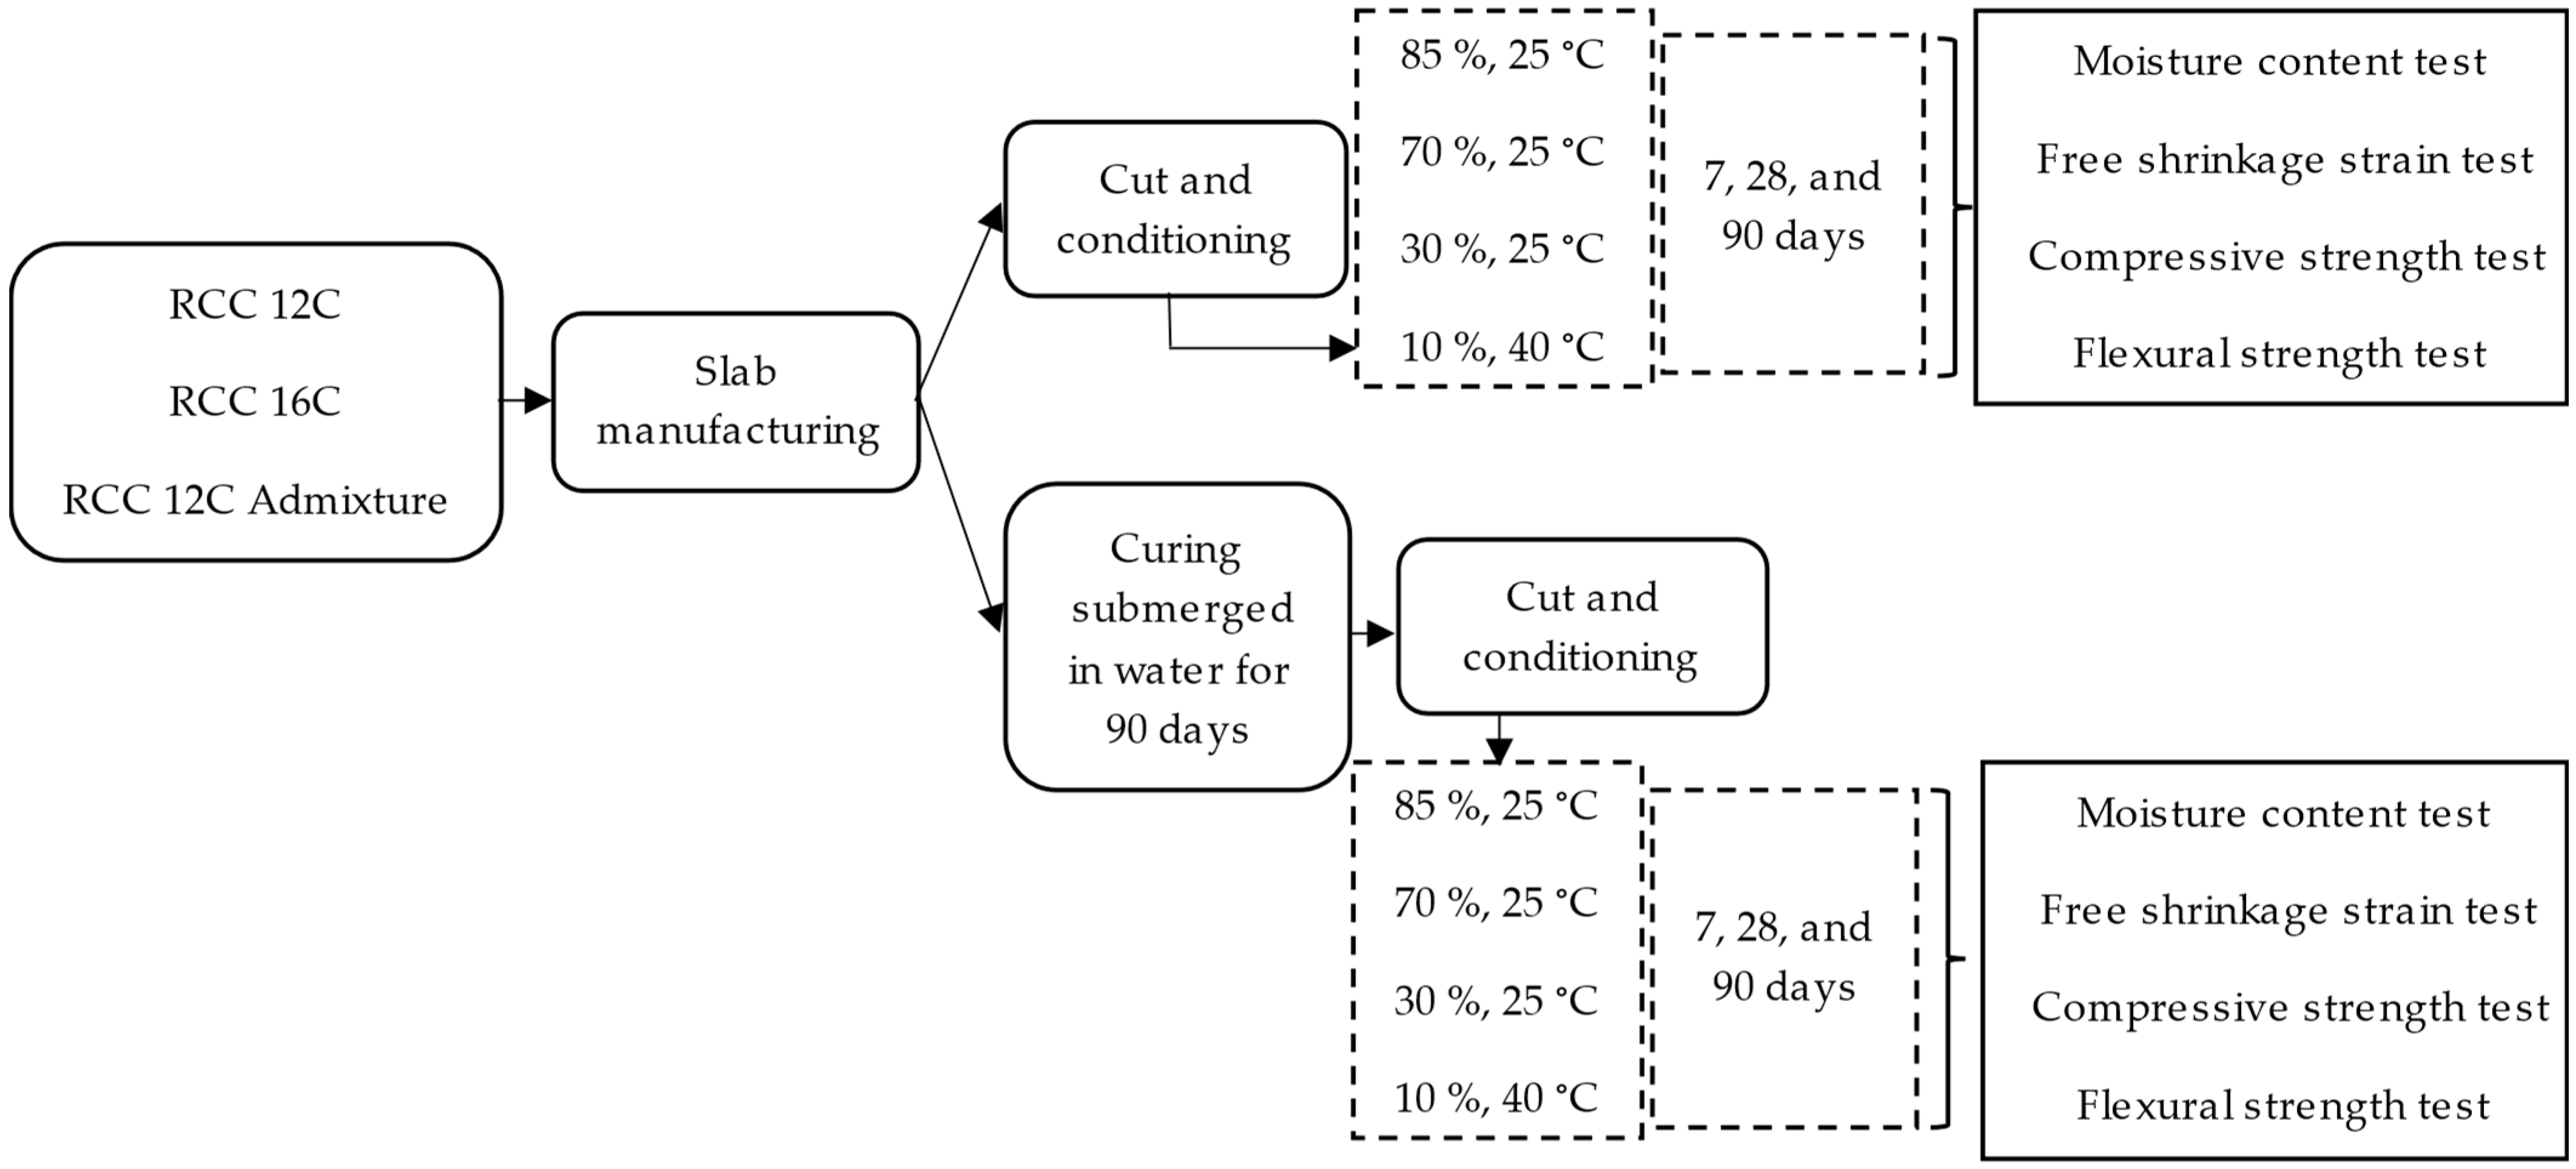
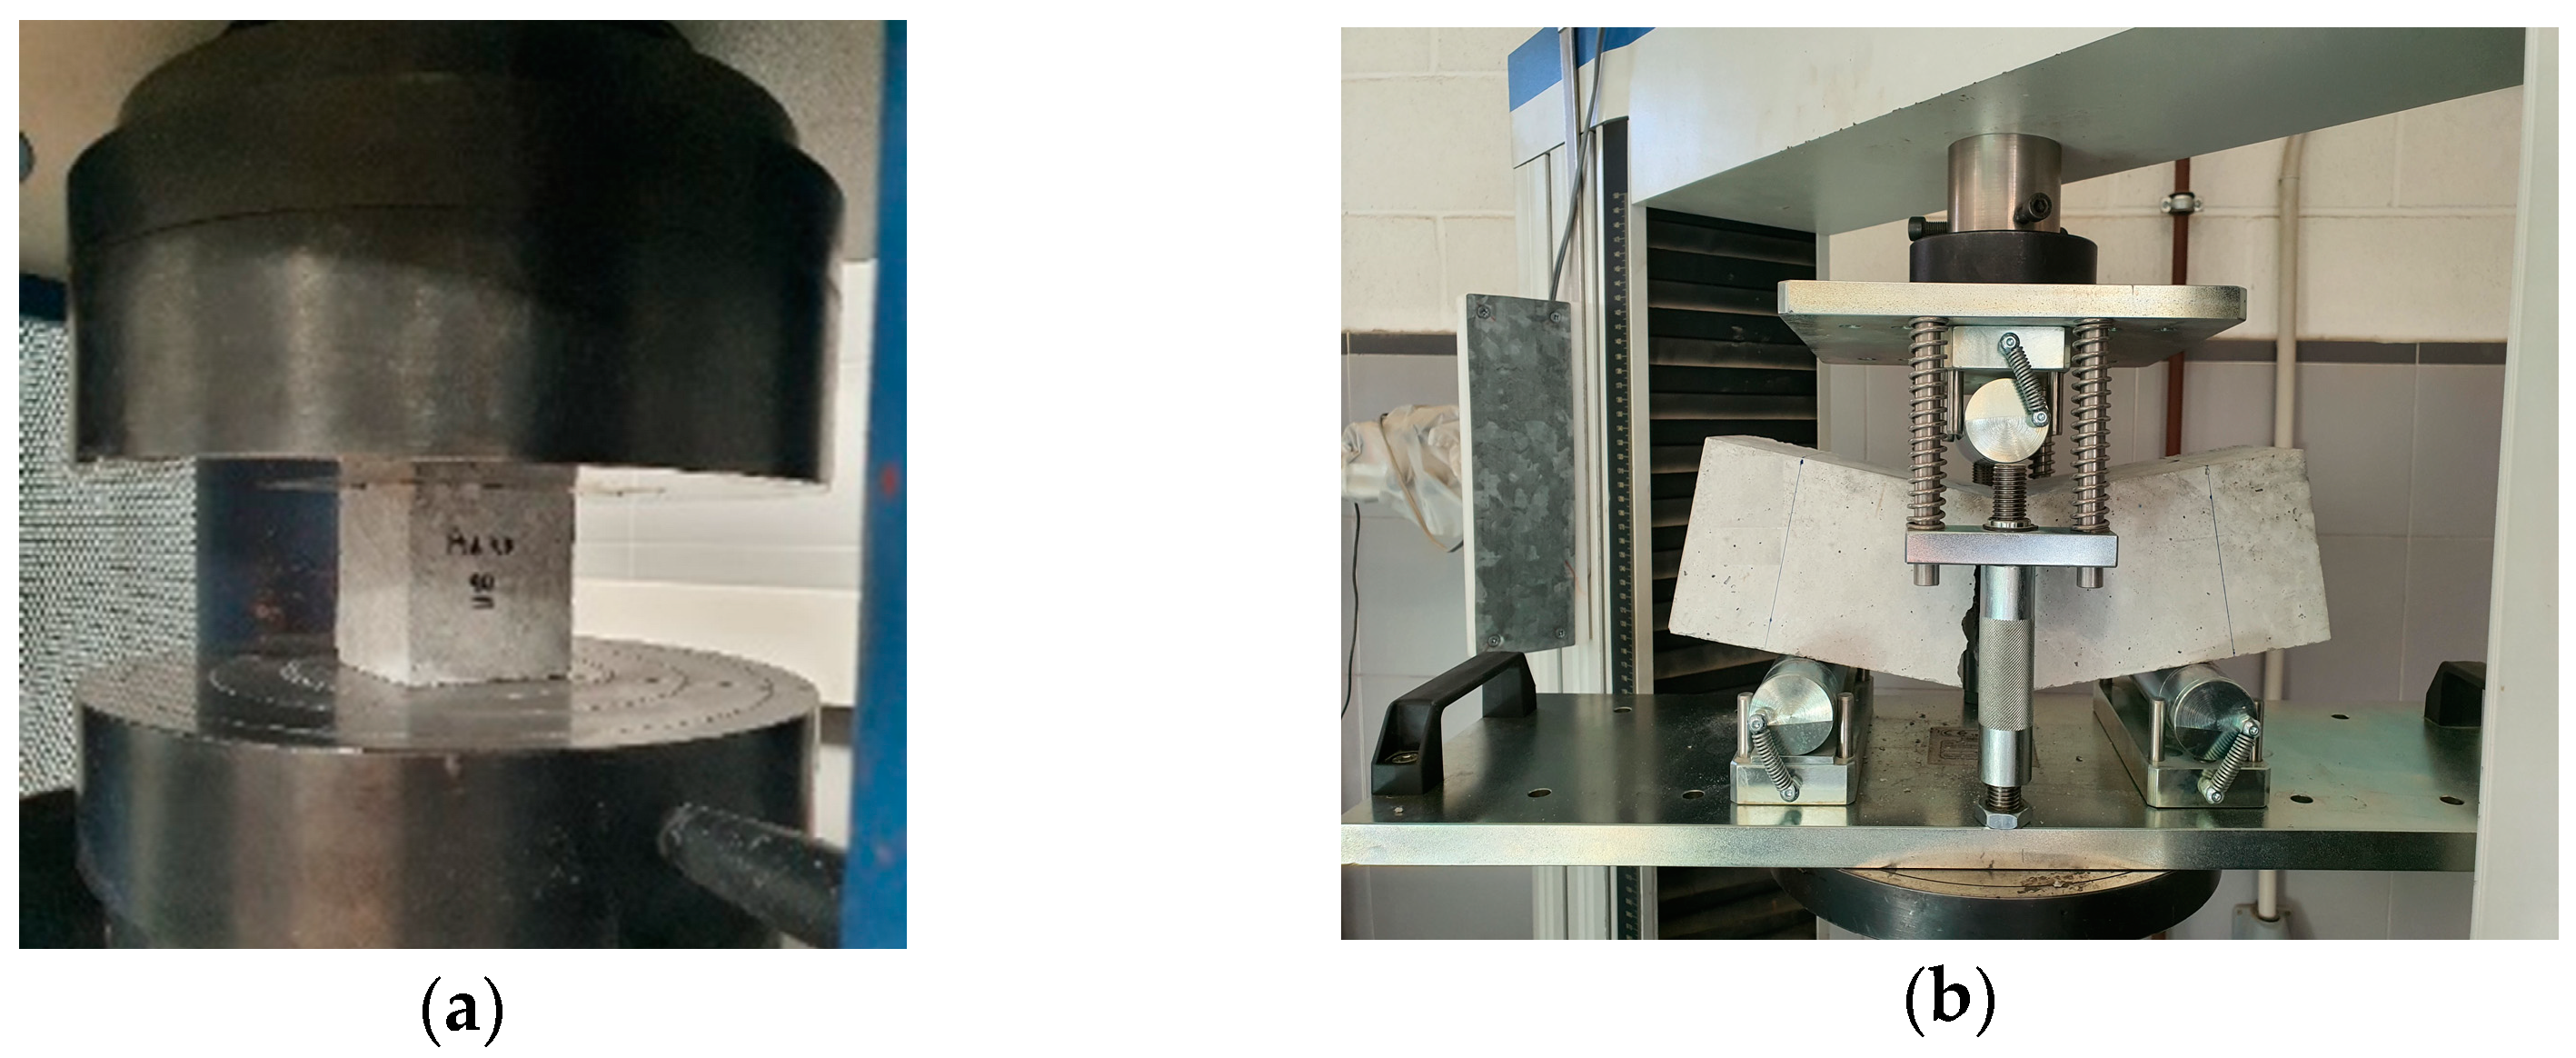
2.2. Testing Plan
3. Results and Discussion
3.1. Effect of Ambient Conditions
3.2. Impact of the Mix Design on the Performance under Different Ambient Conditions
3.3. Impact of Concrete Curing
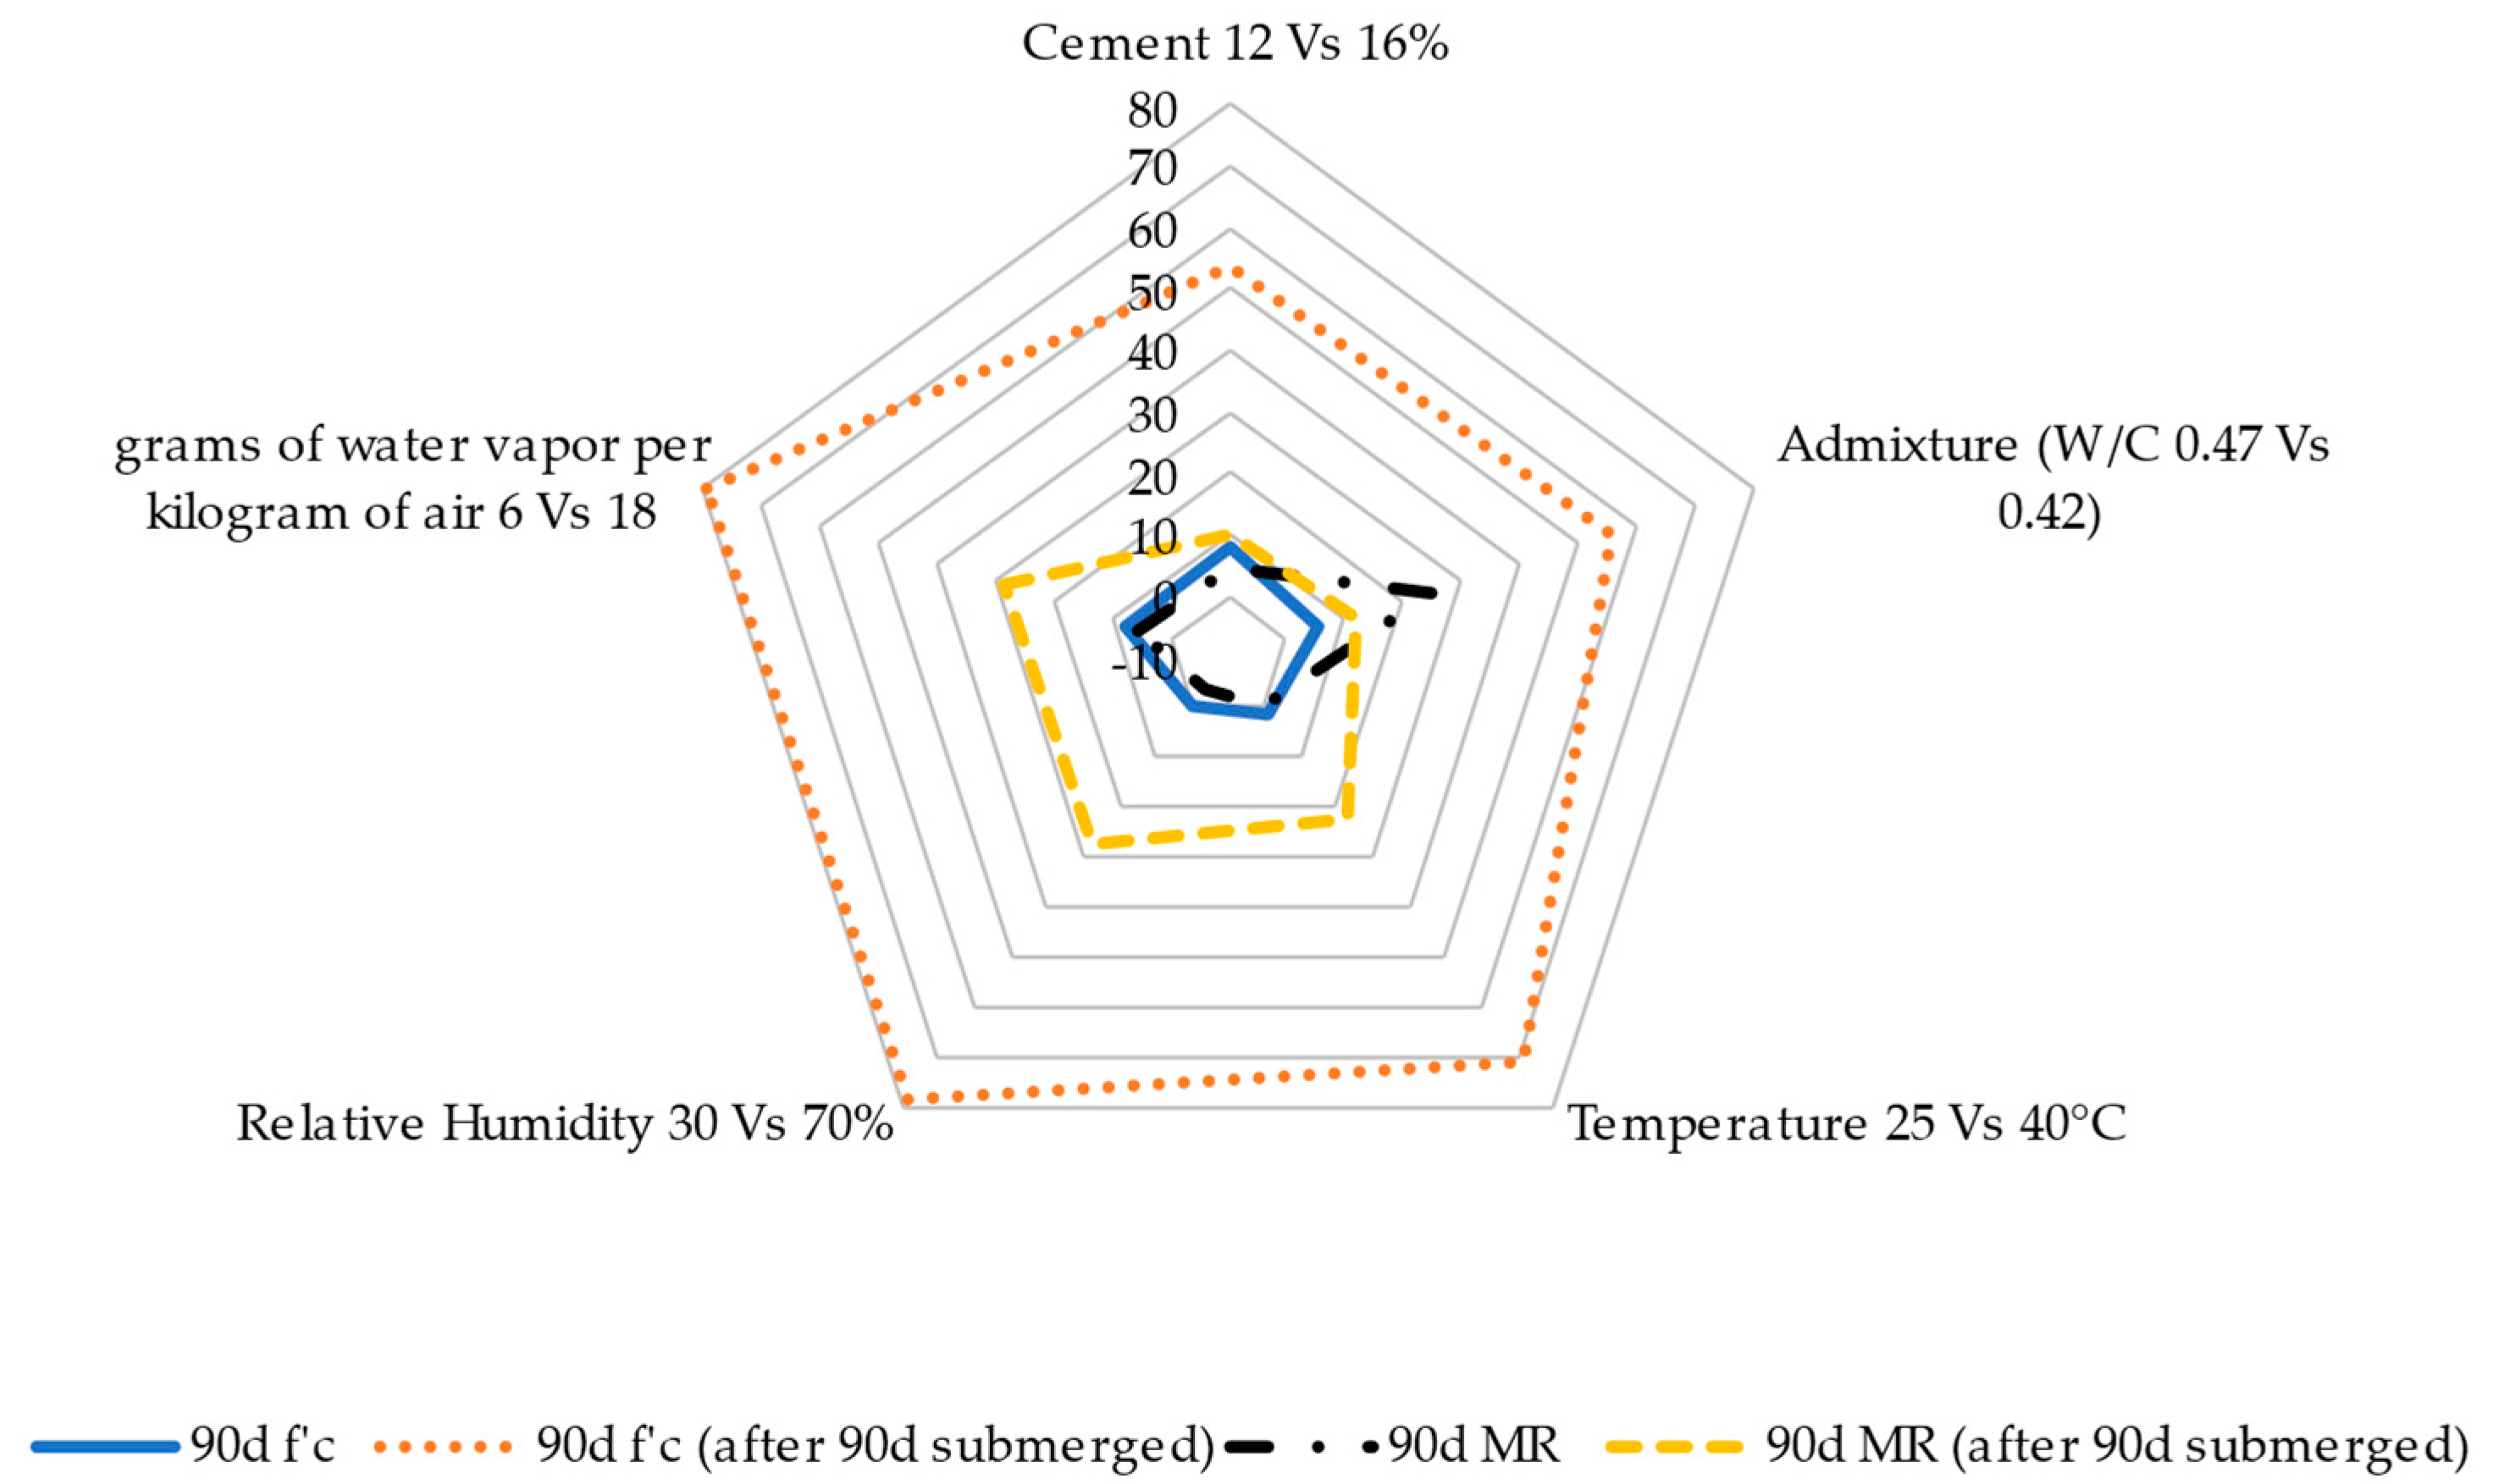
3.4. Parametric Analyses of Service Conditions and Mix Design
4. Conclusions
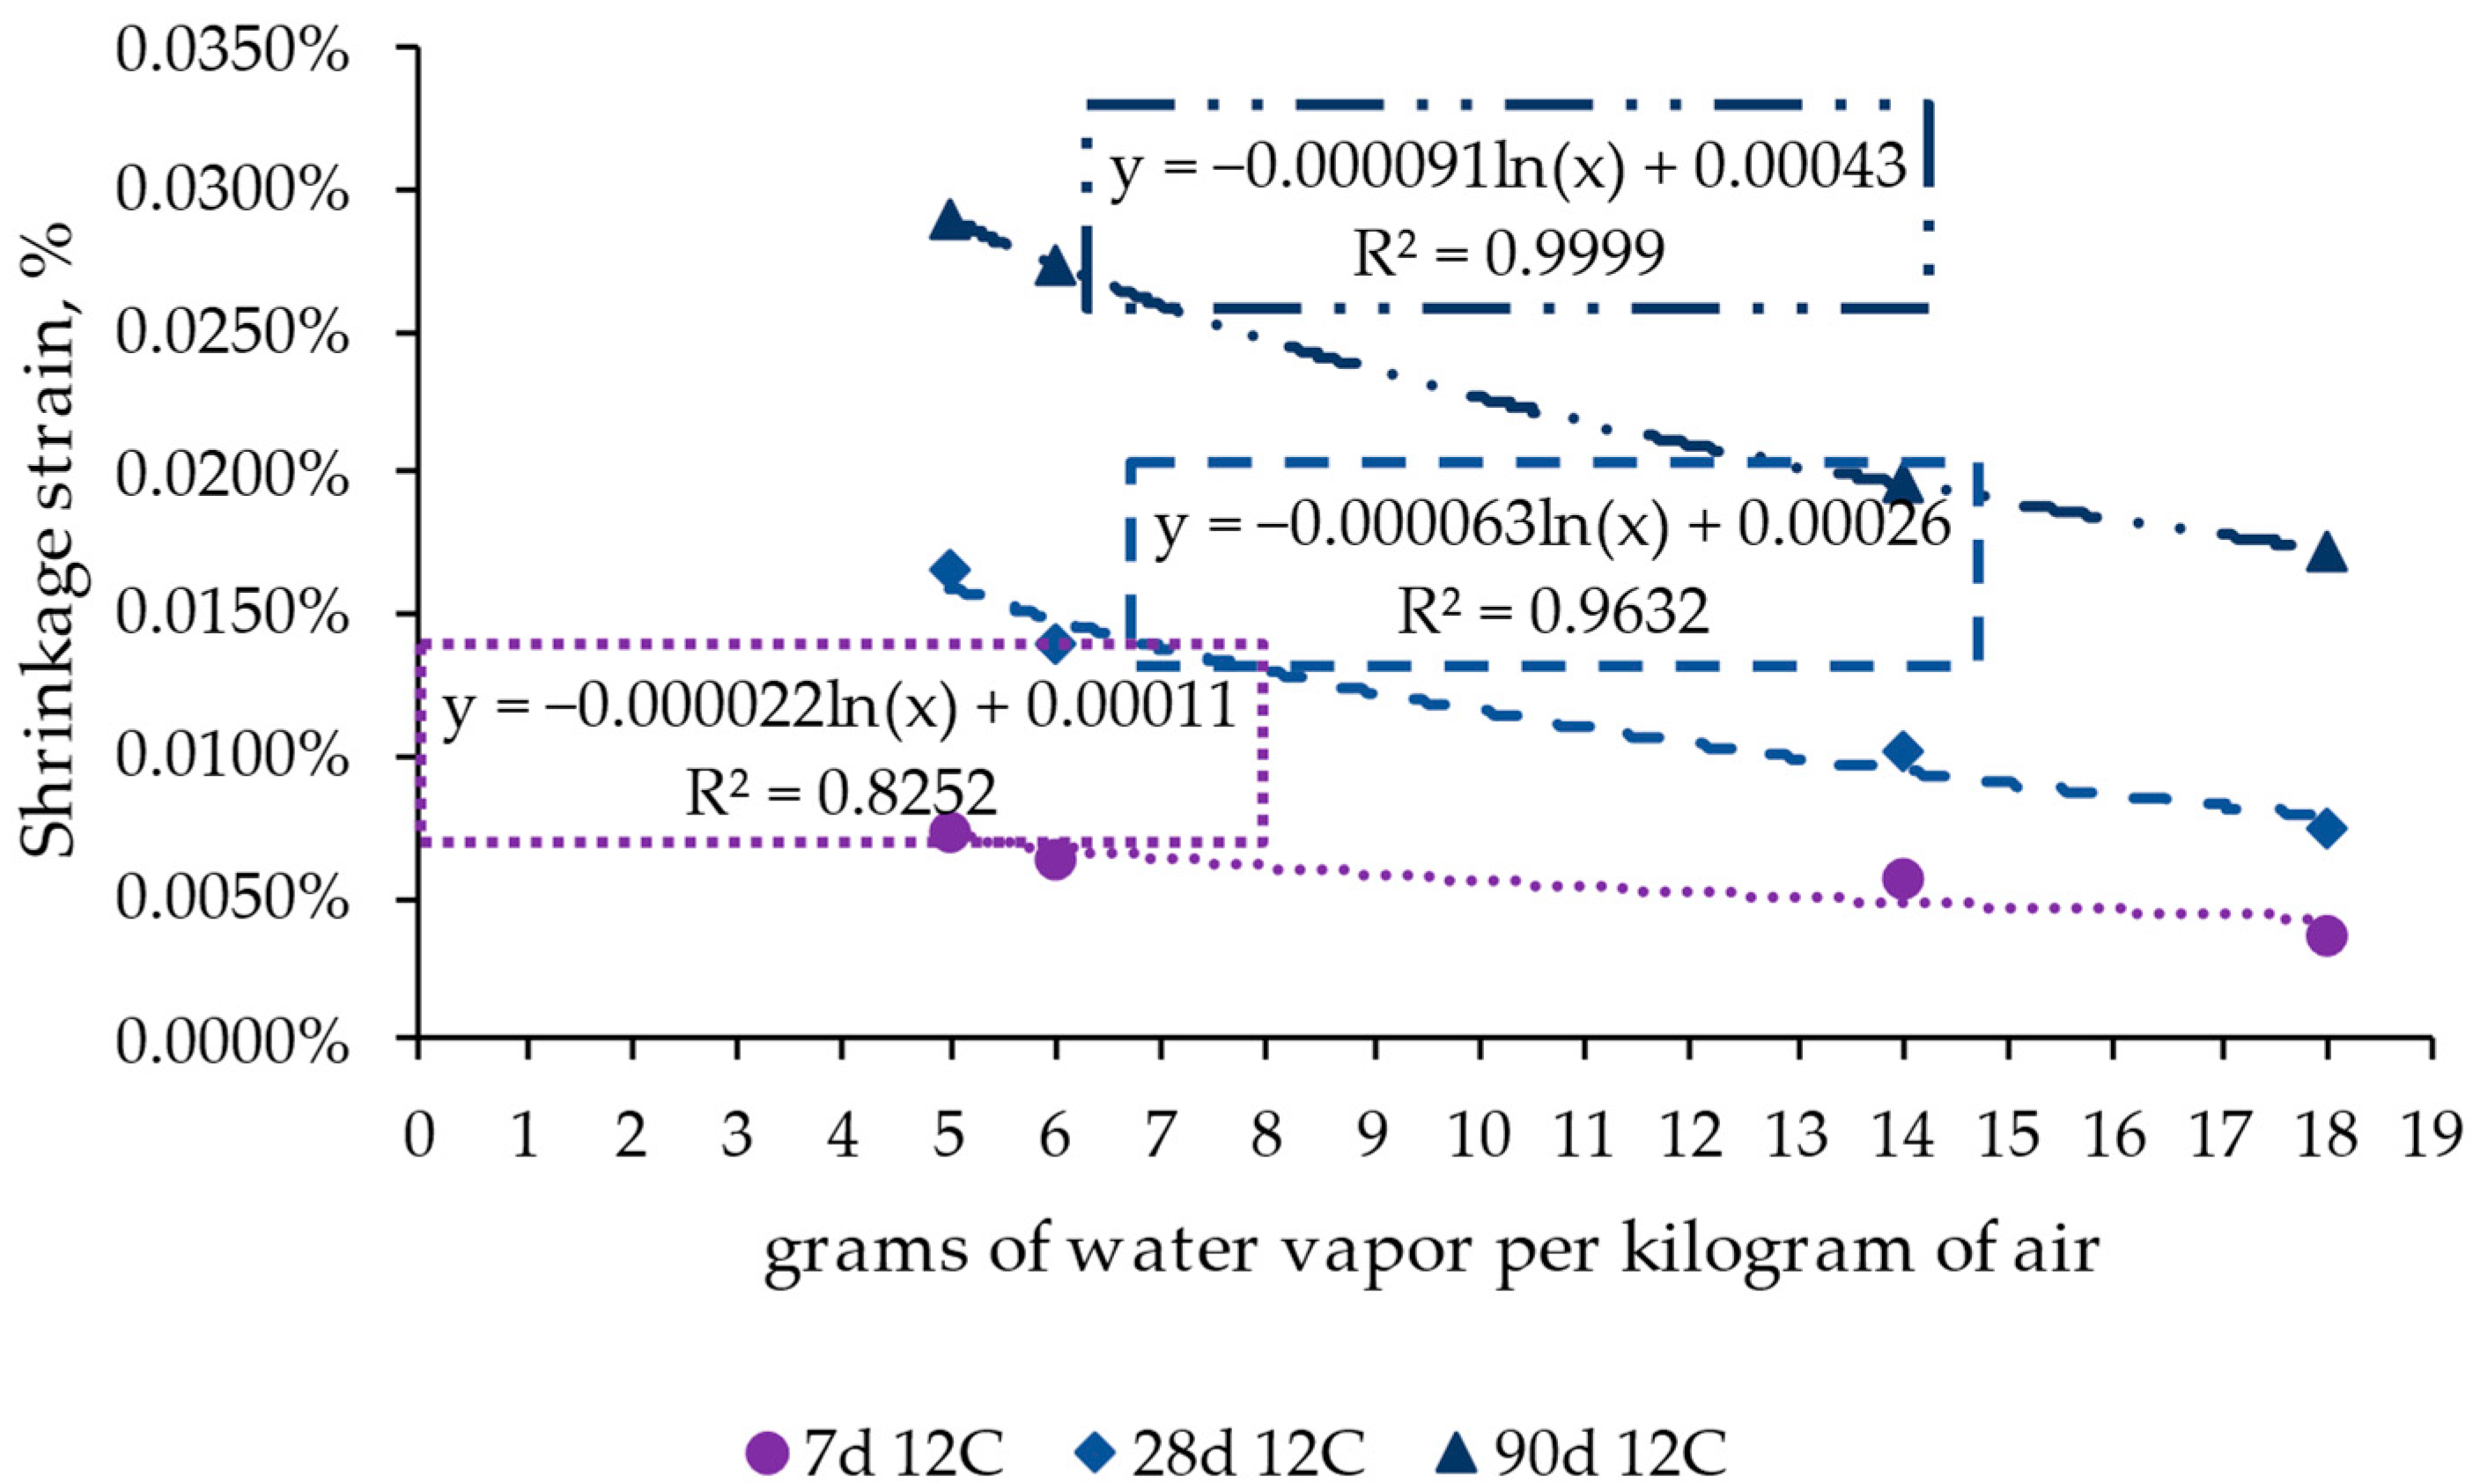
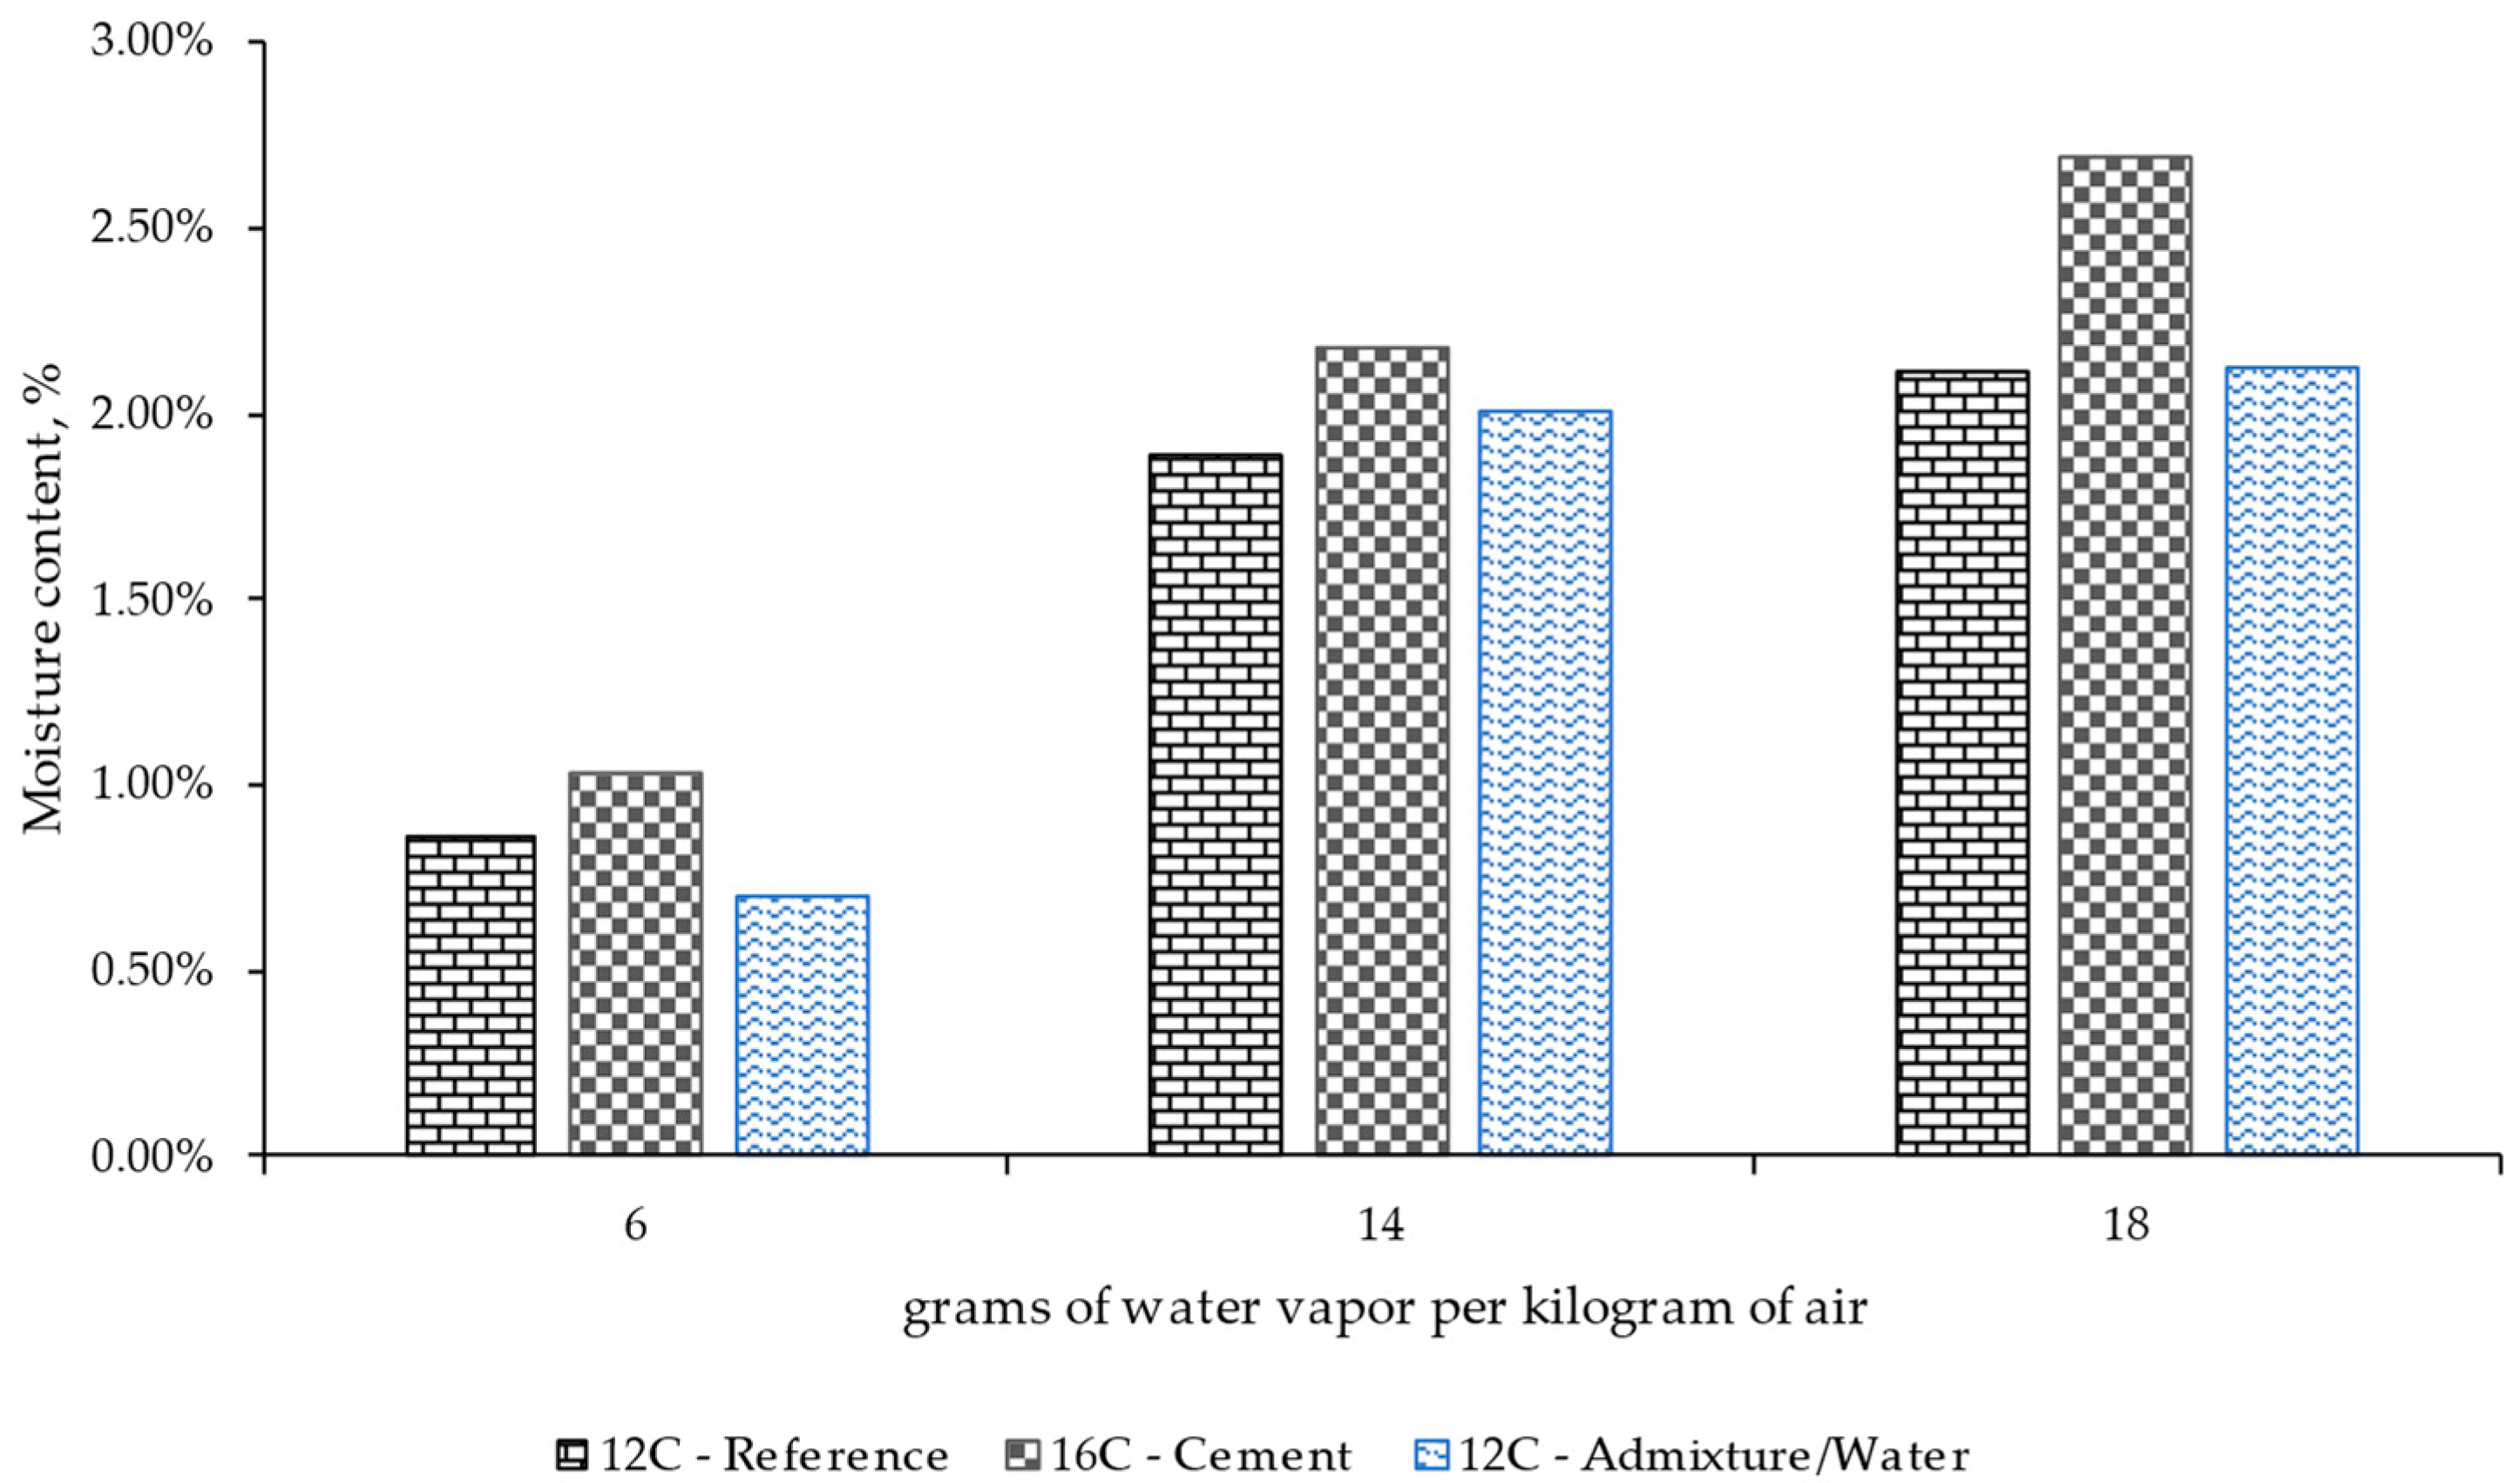
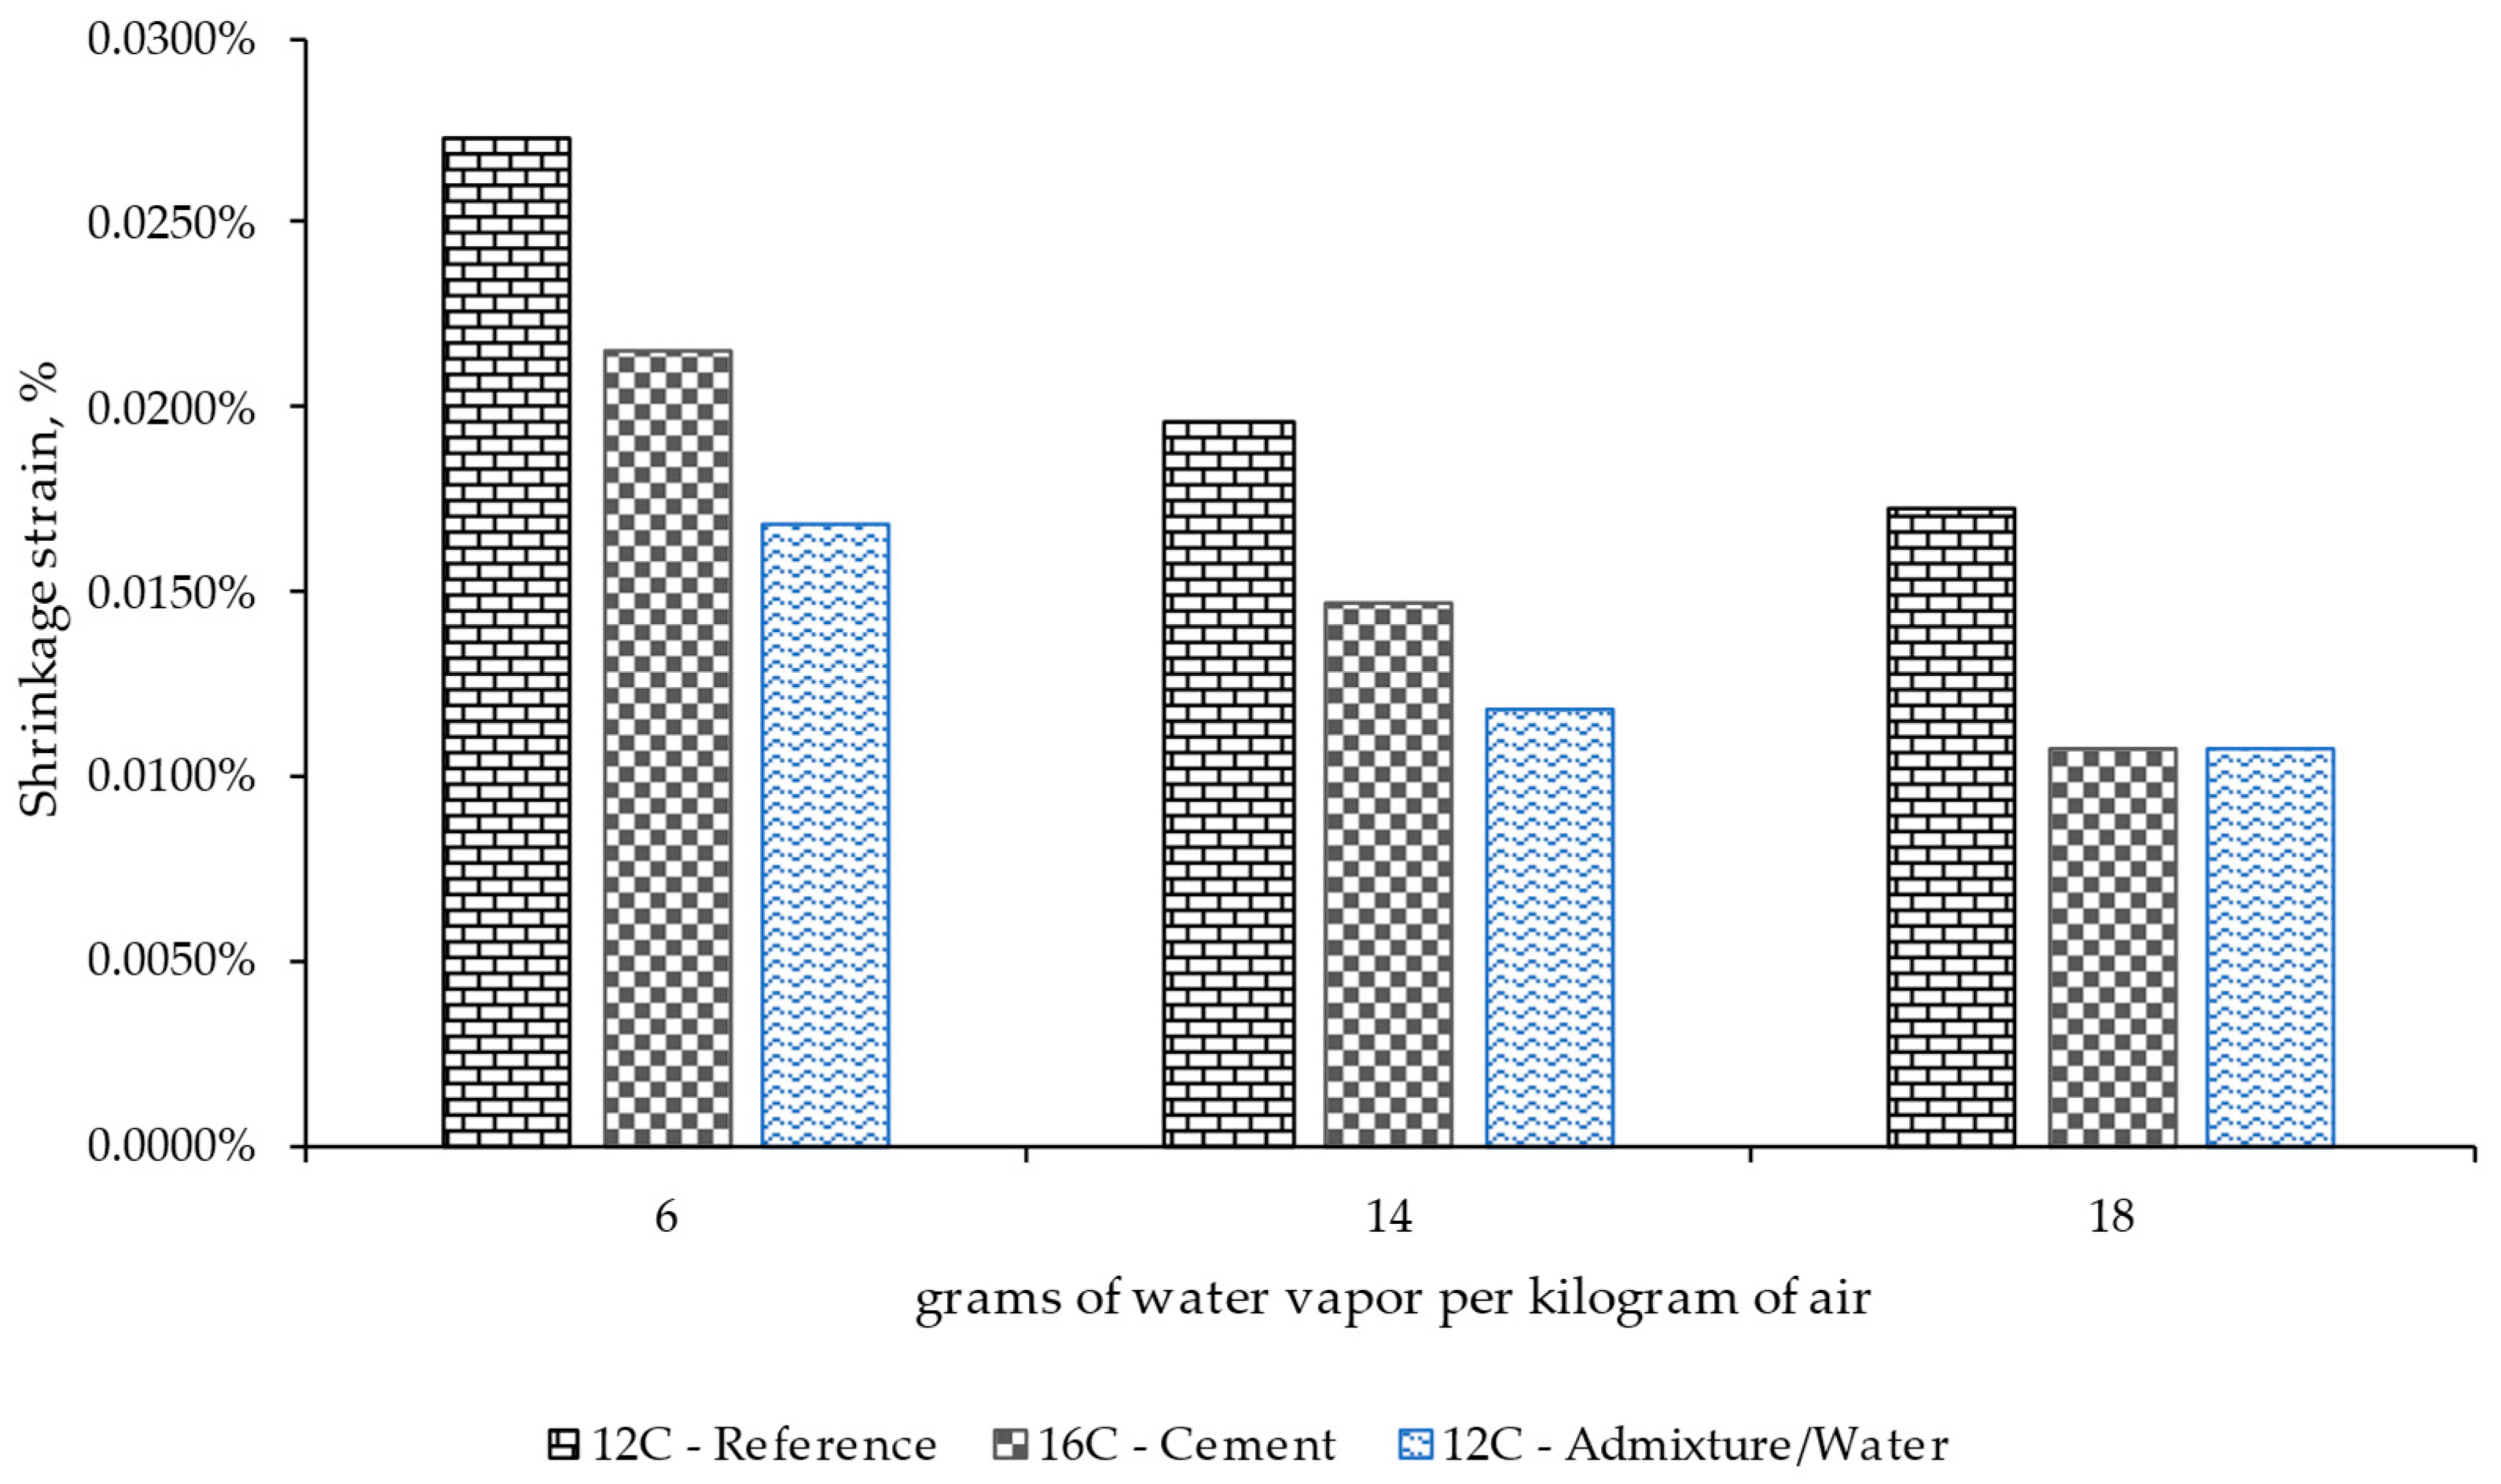
- A wet atmosphere with humidity values higher than 70% gave the specimen a higher capacity to retain moisture over the studied period, resulting in shrinkage values around half of those recorded under dry conditions, with relative humidity lower than 30%.
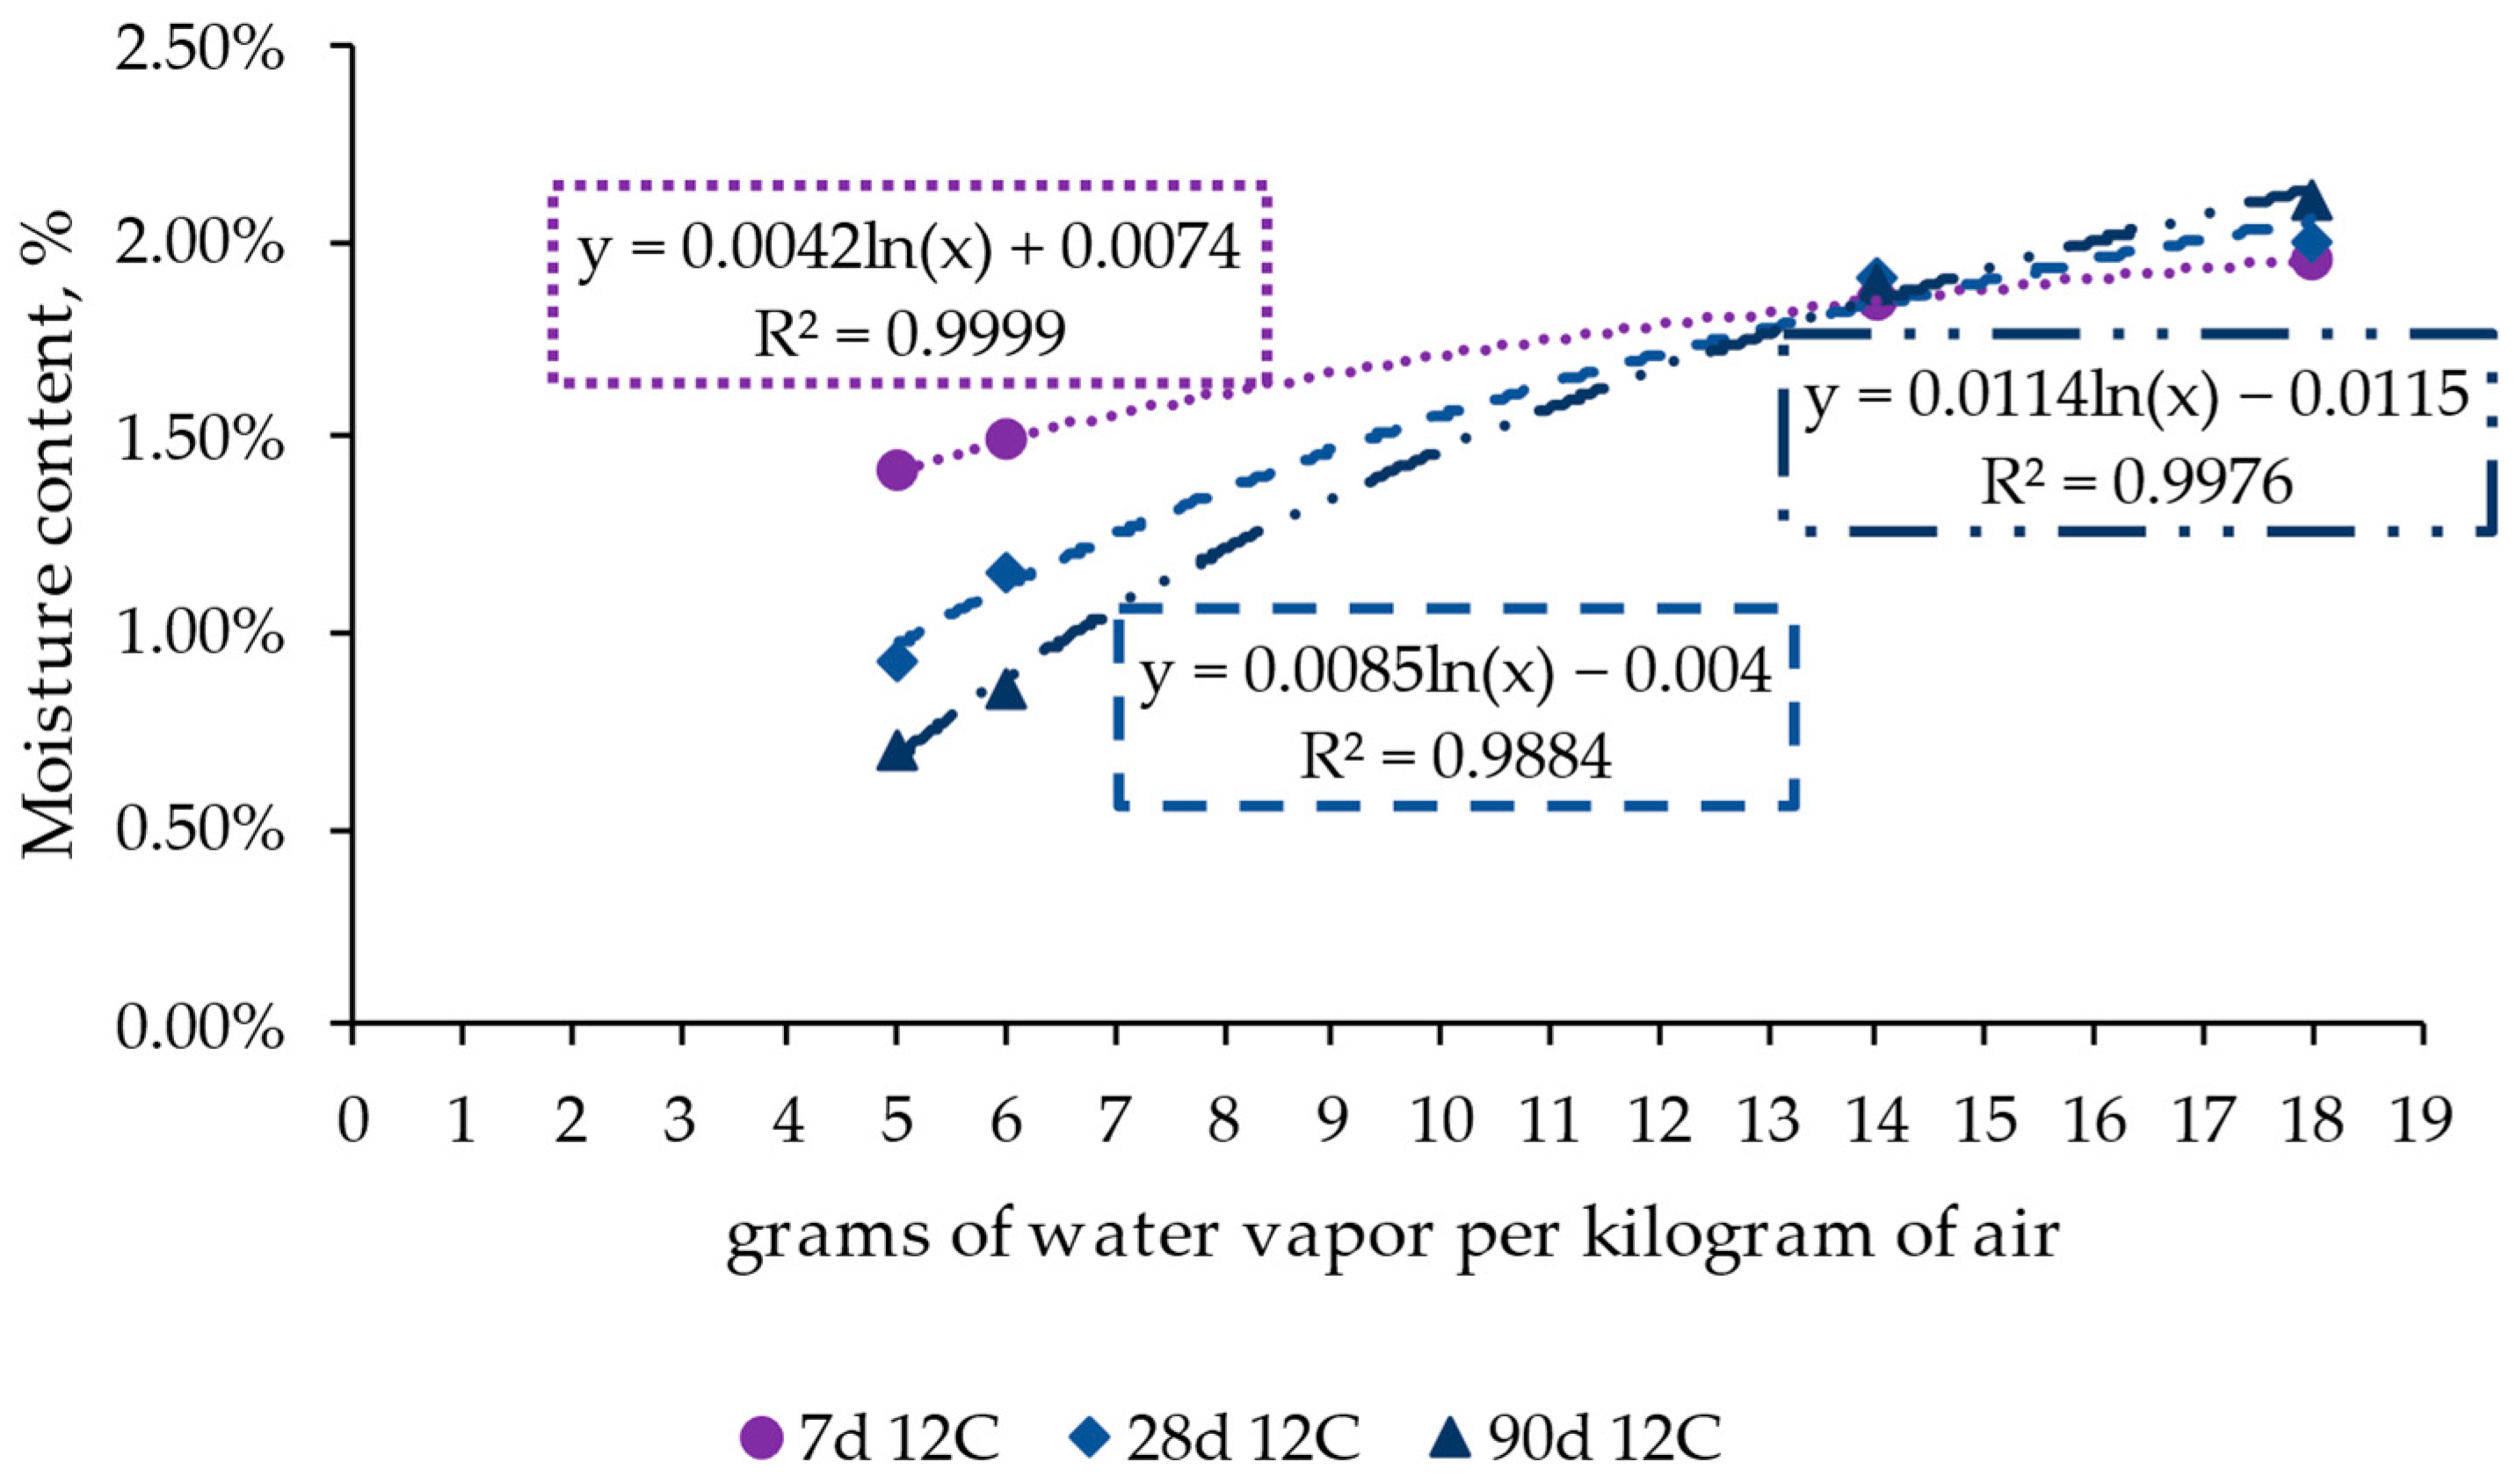
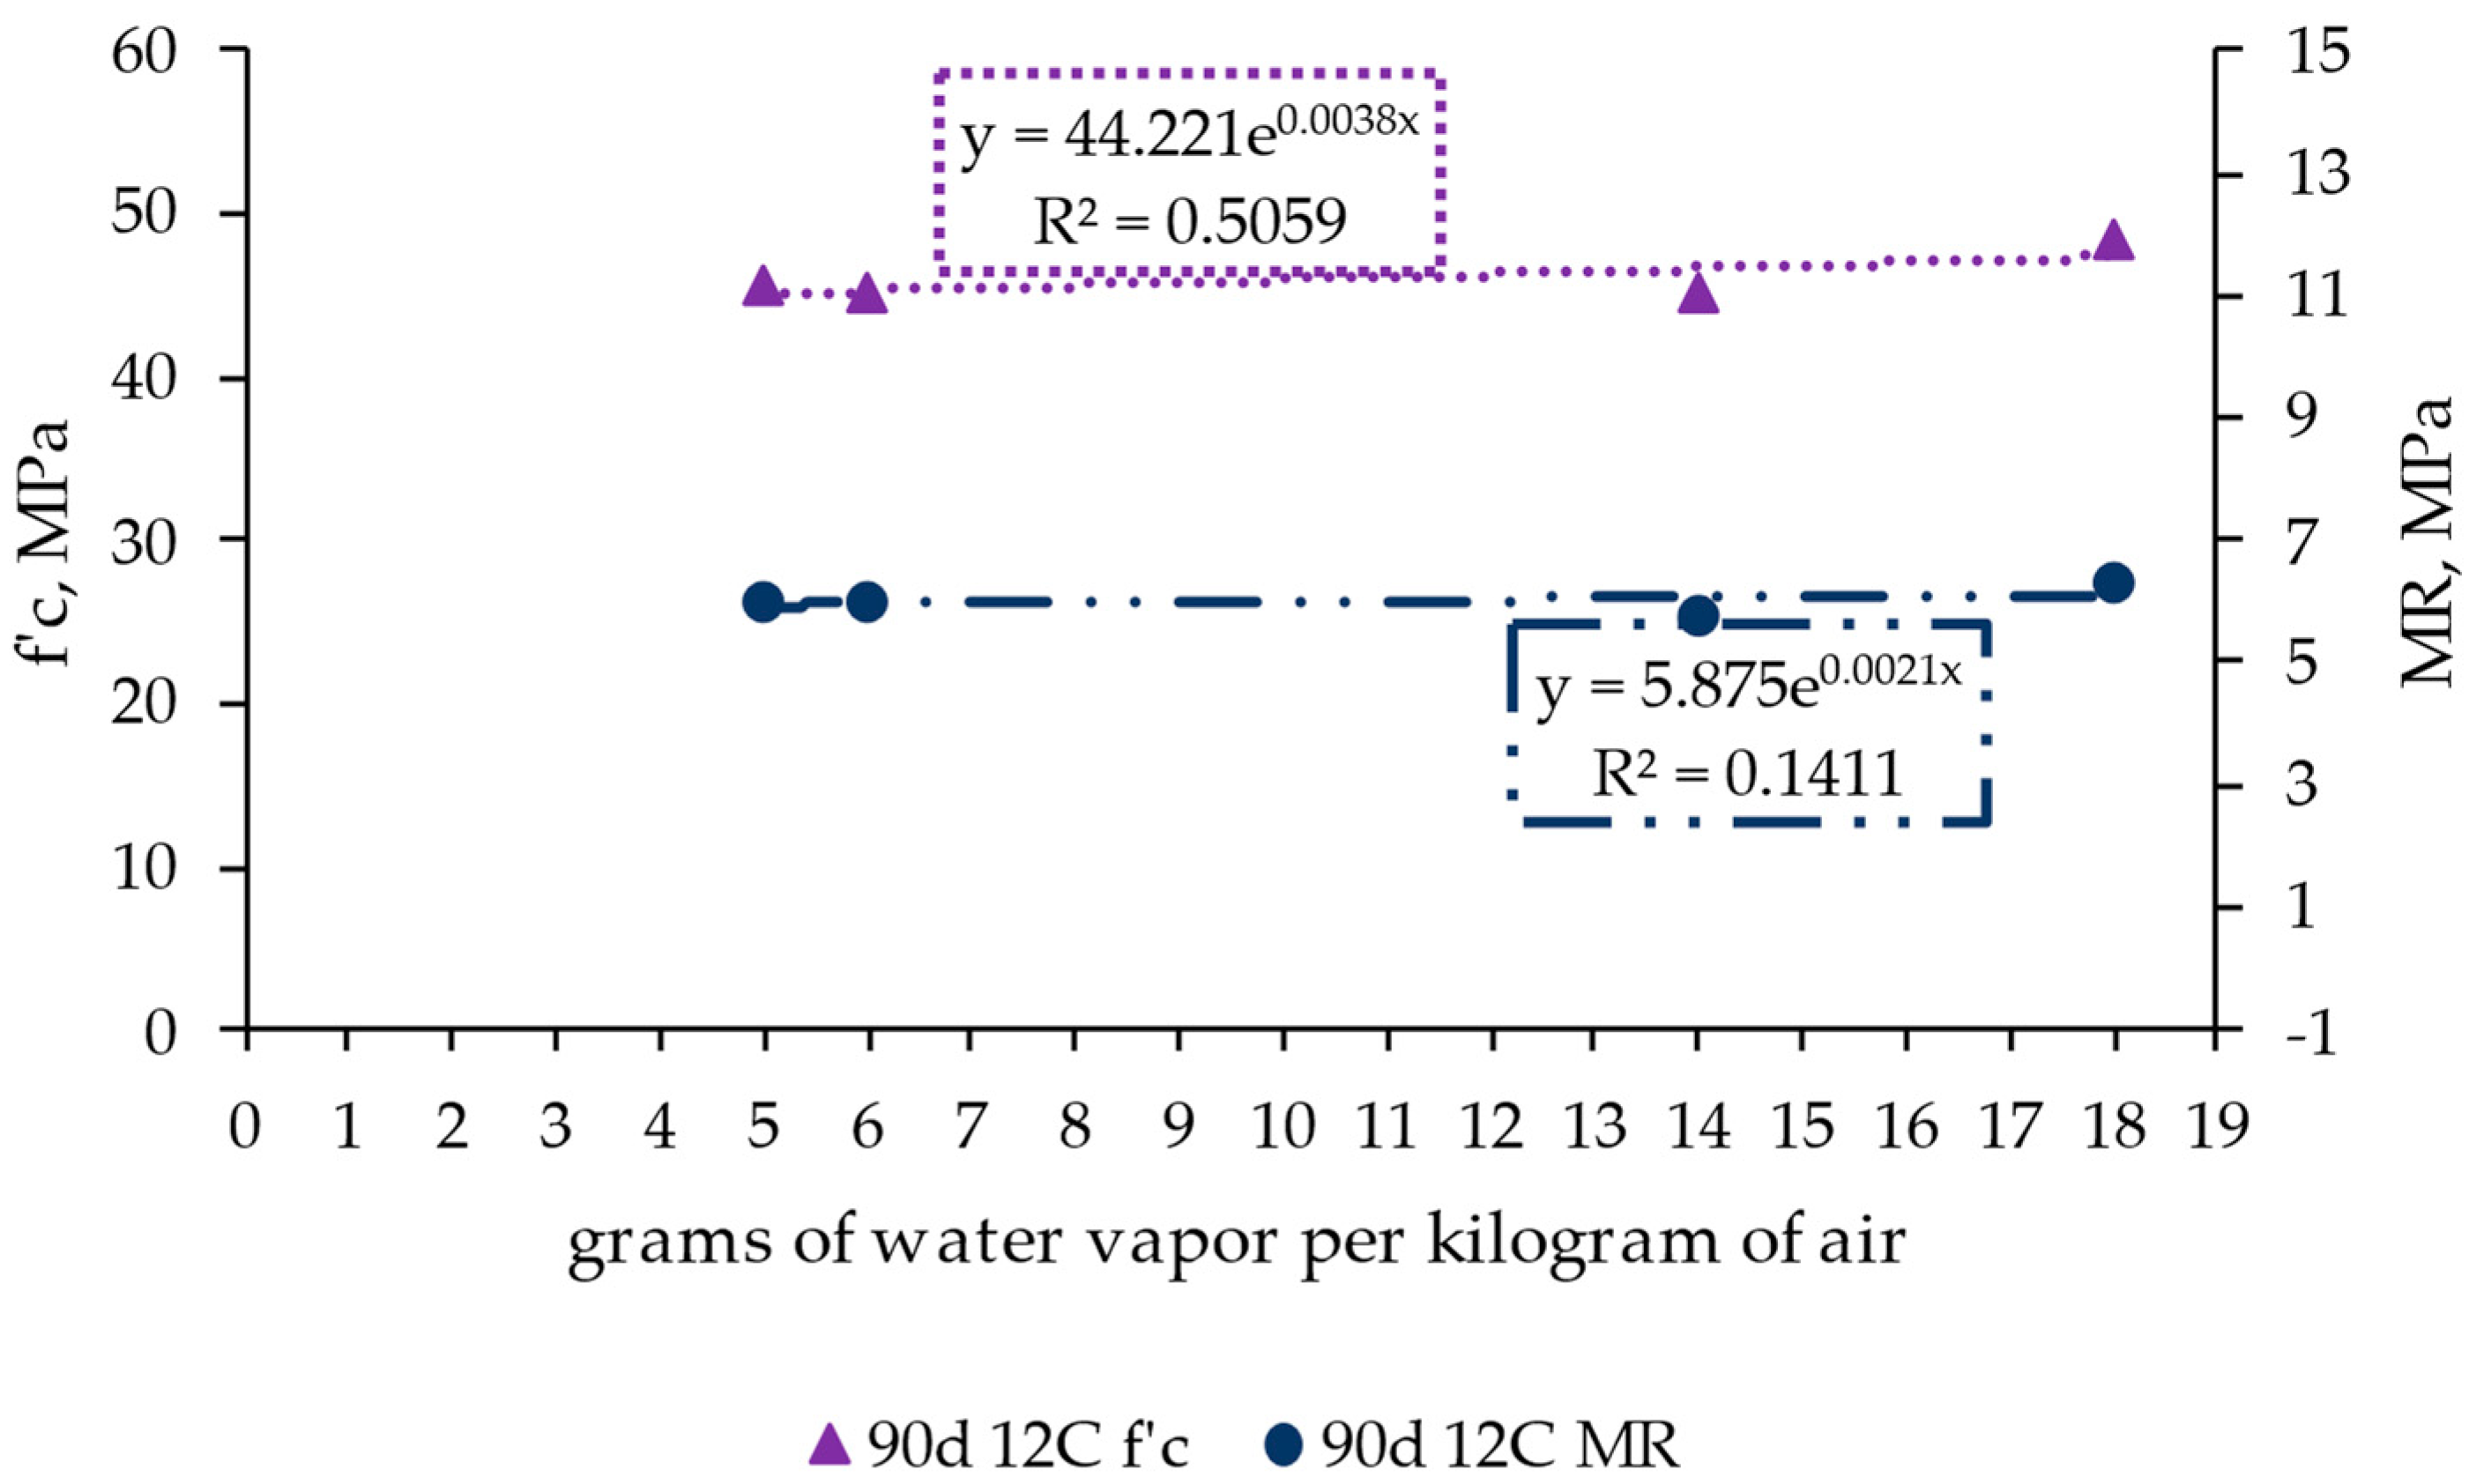
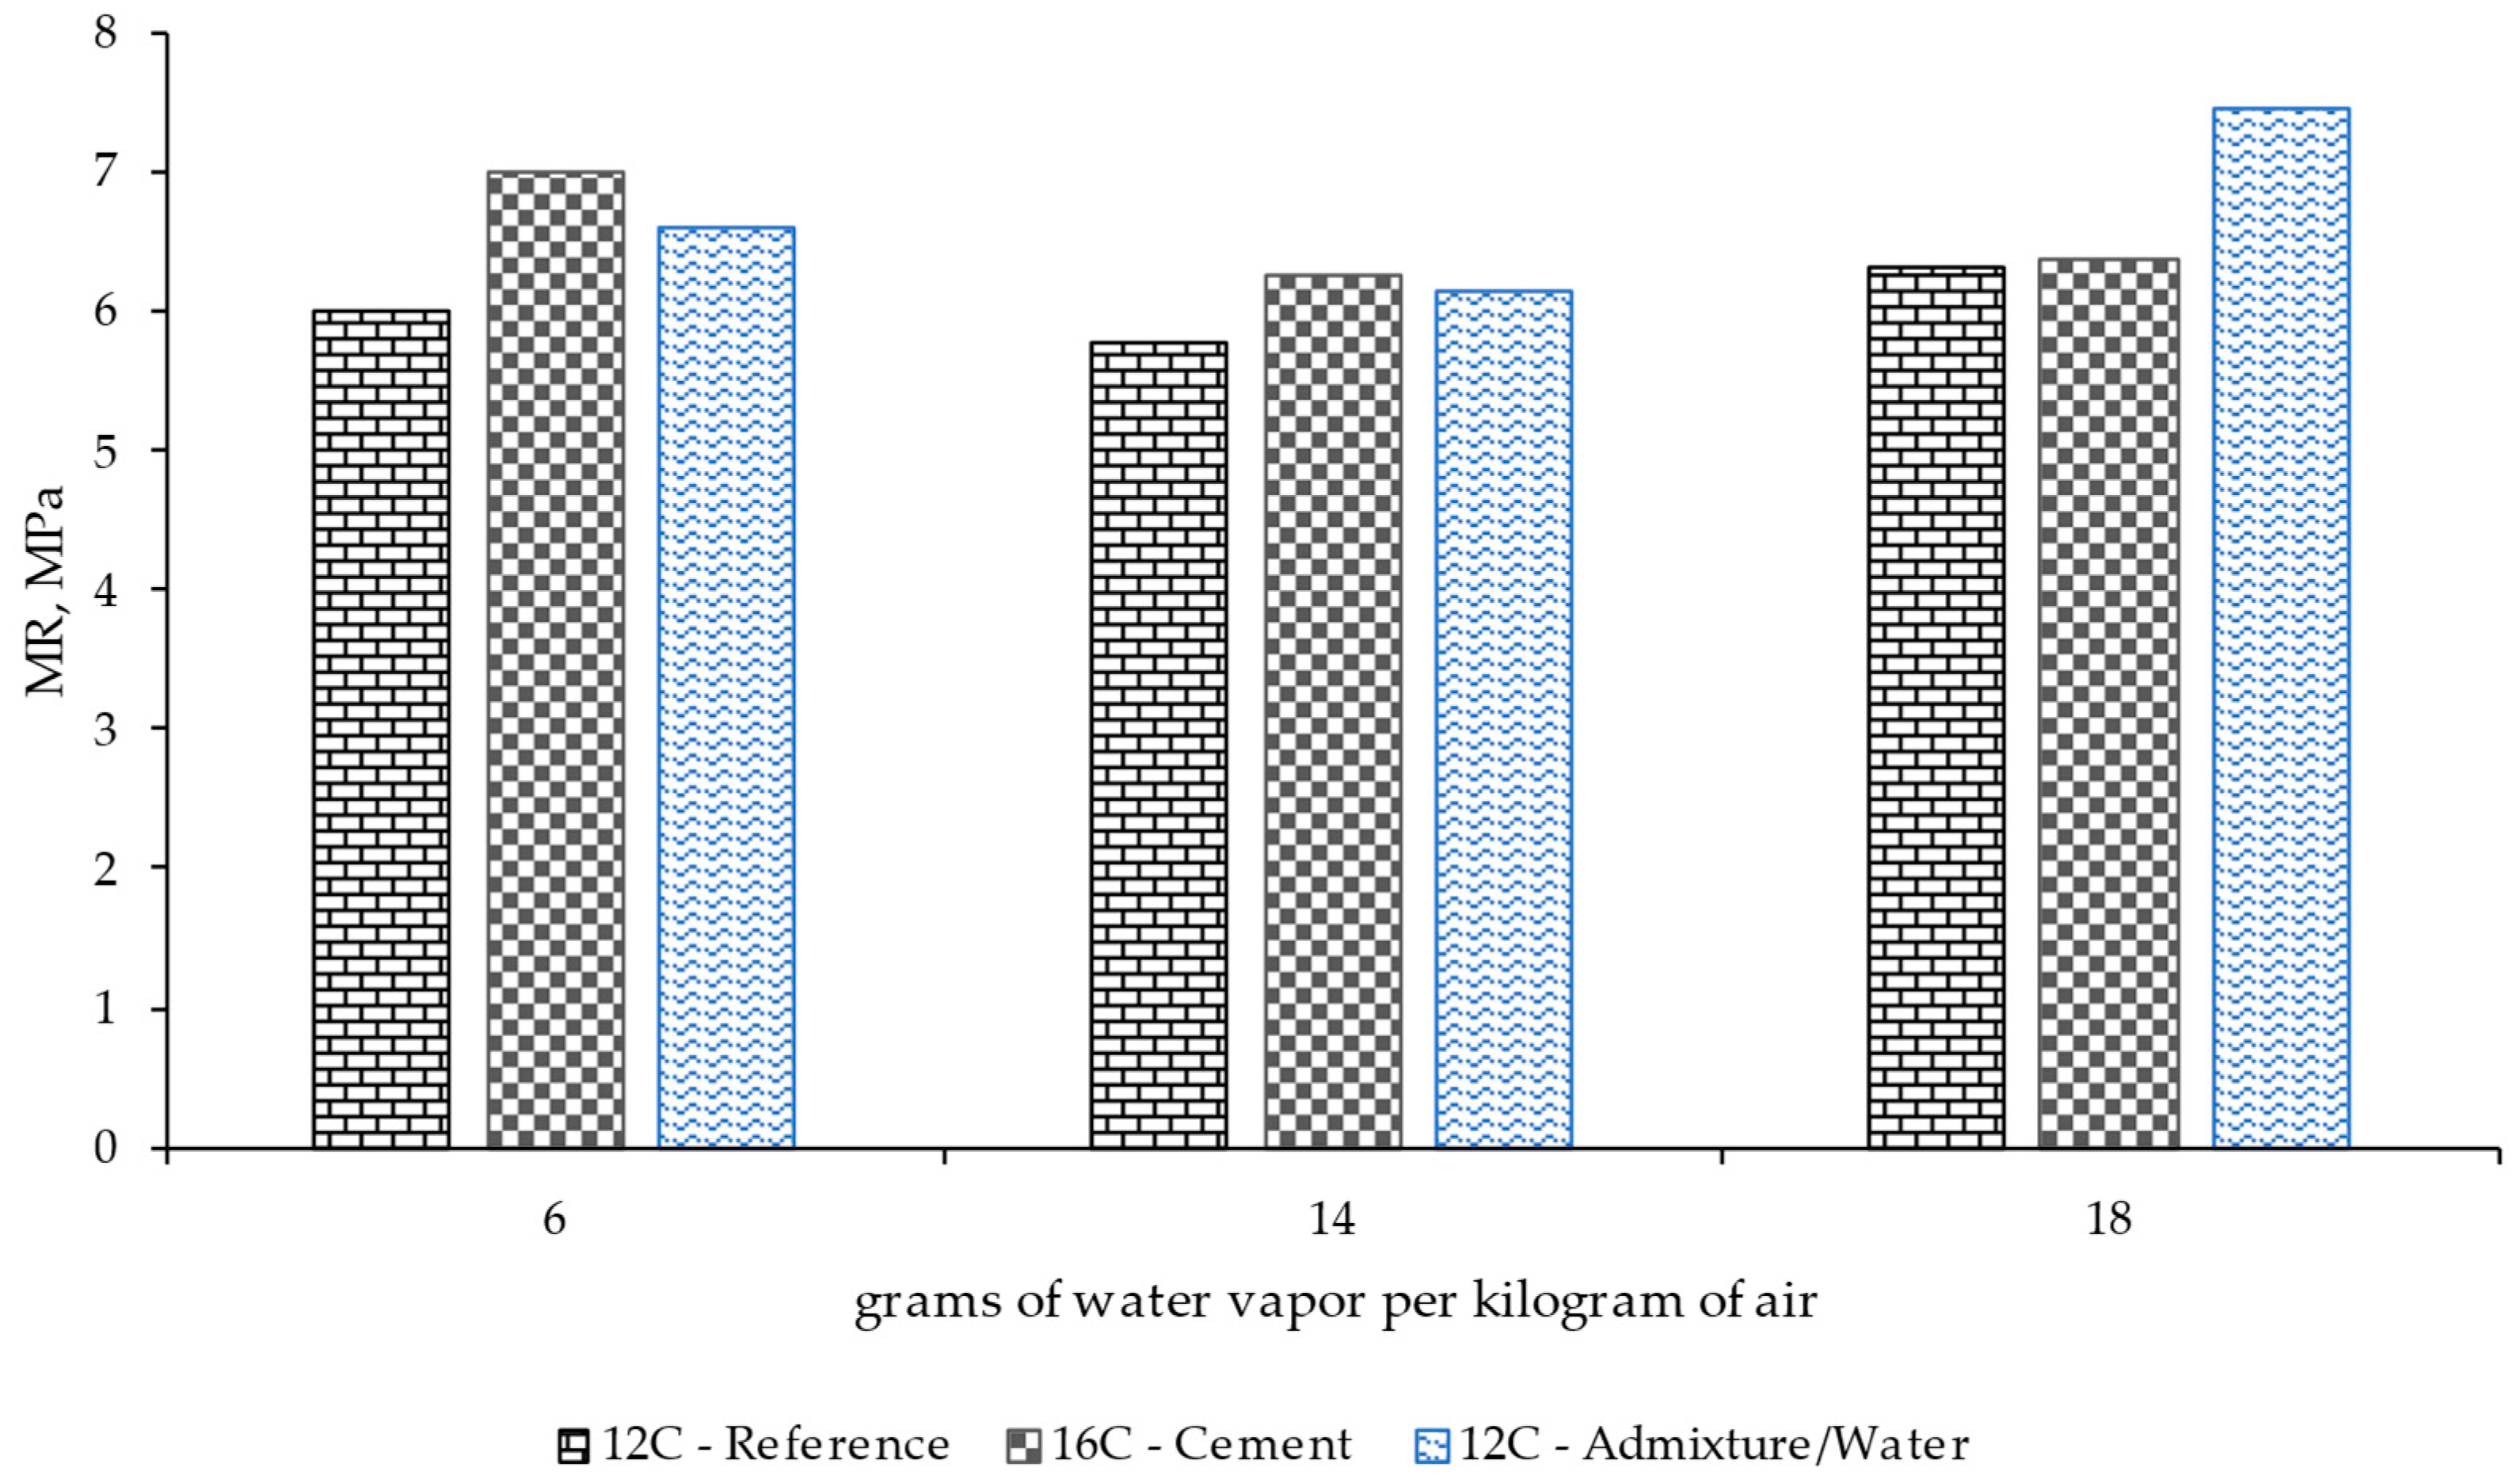
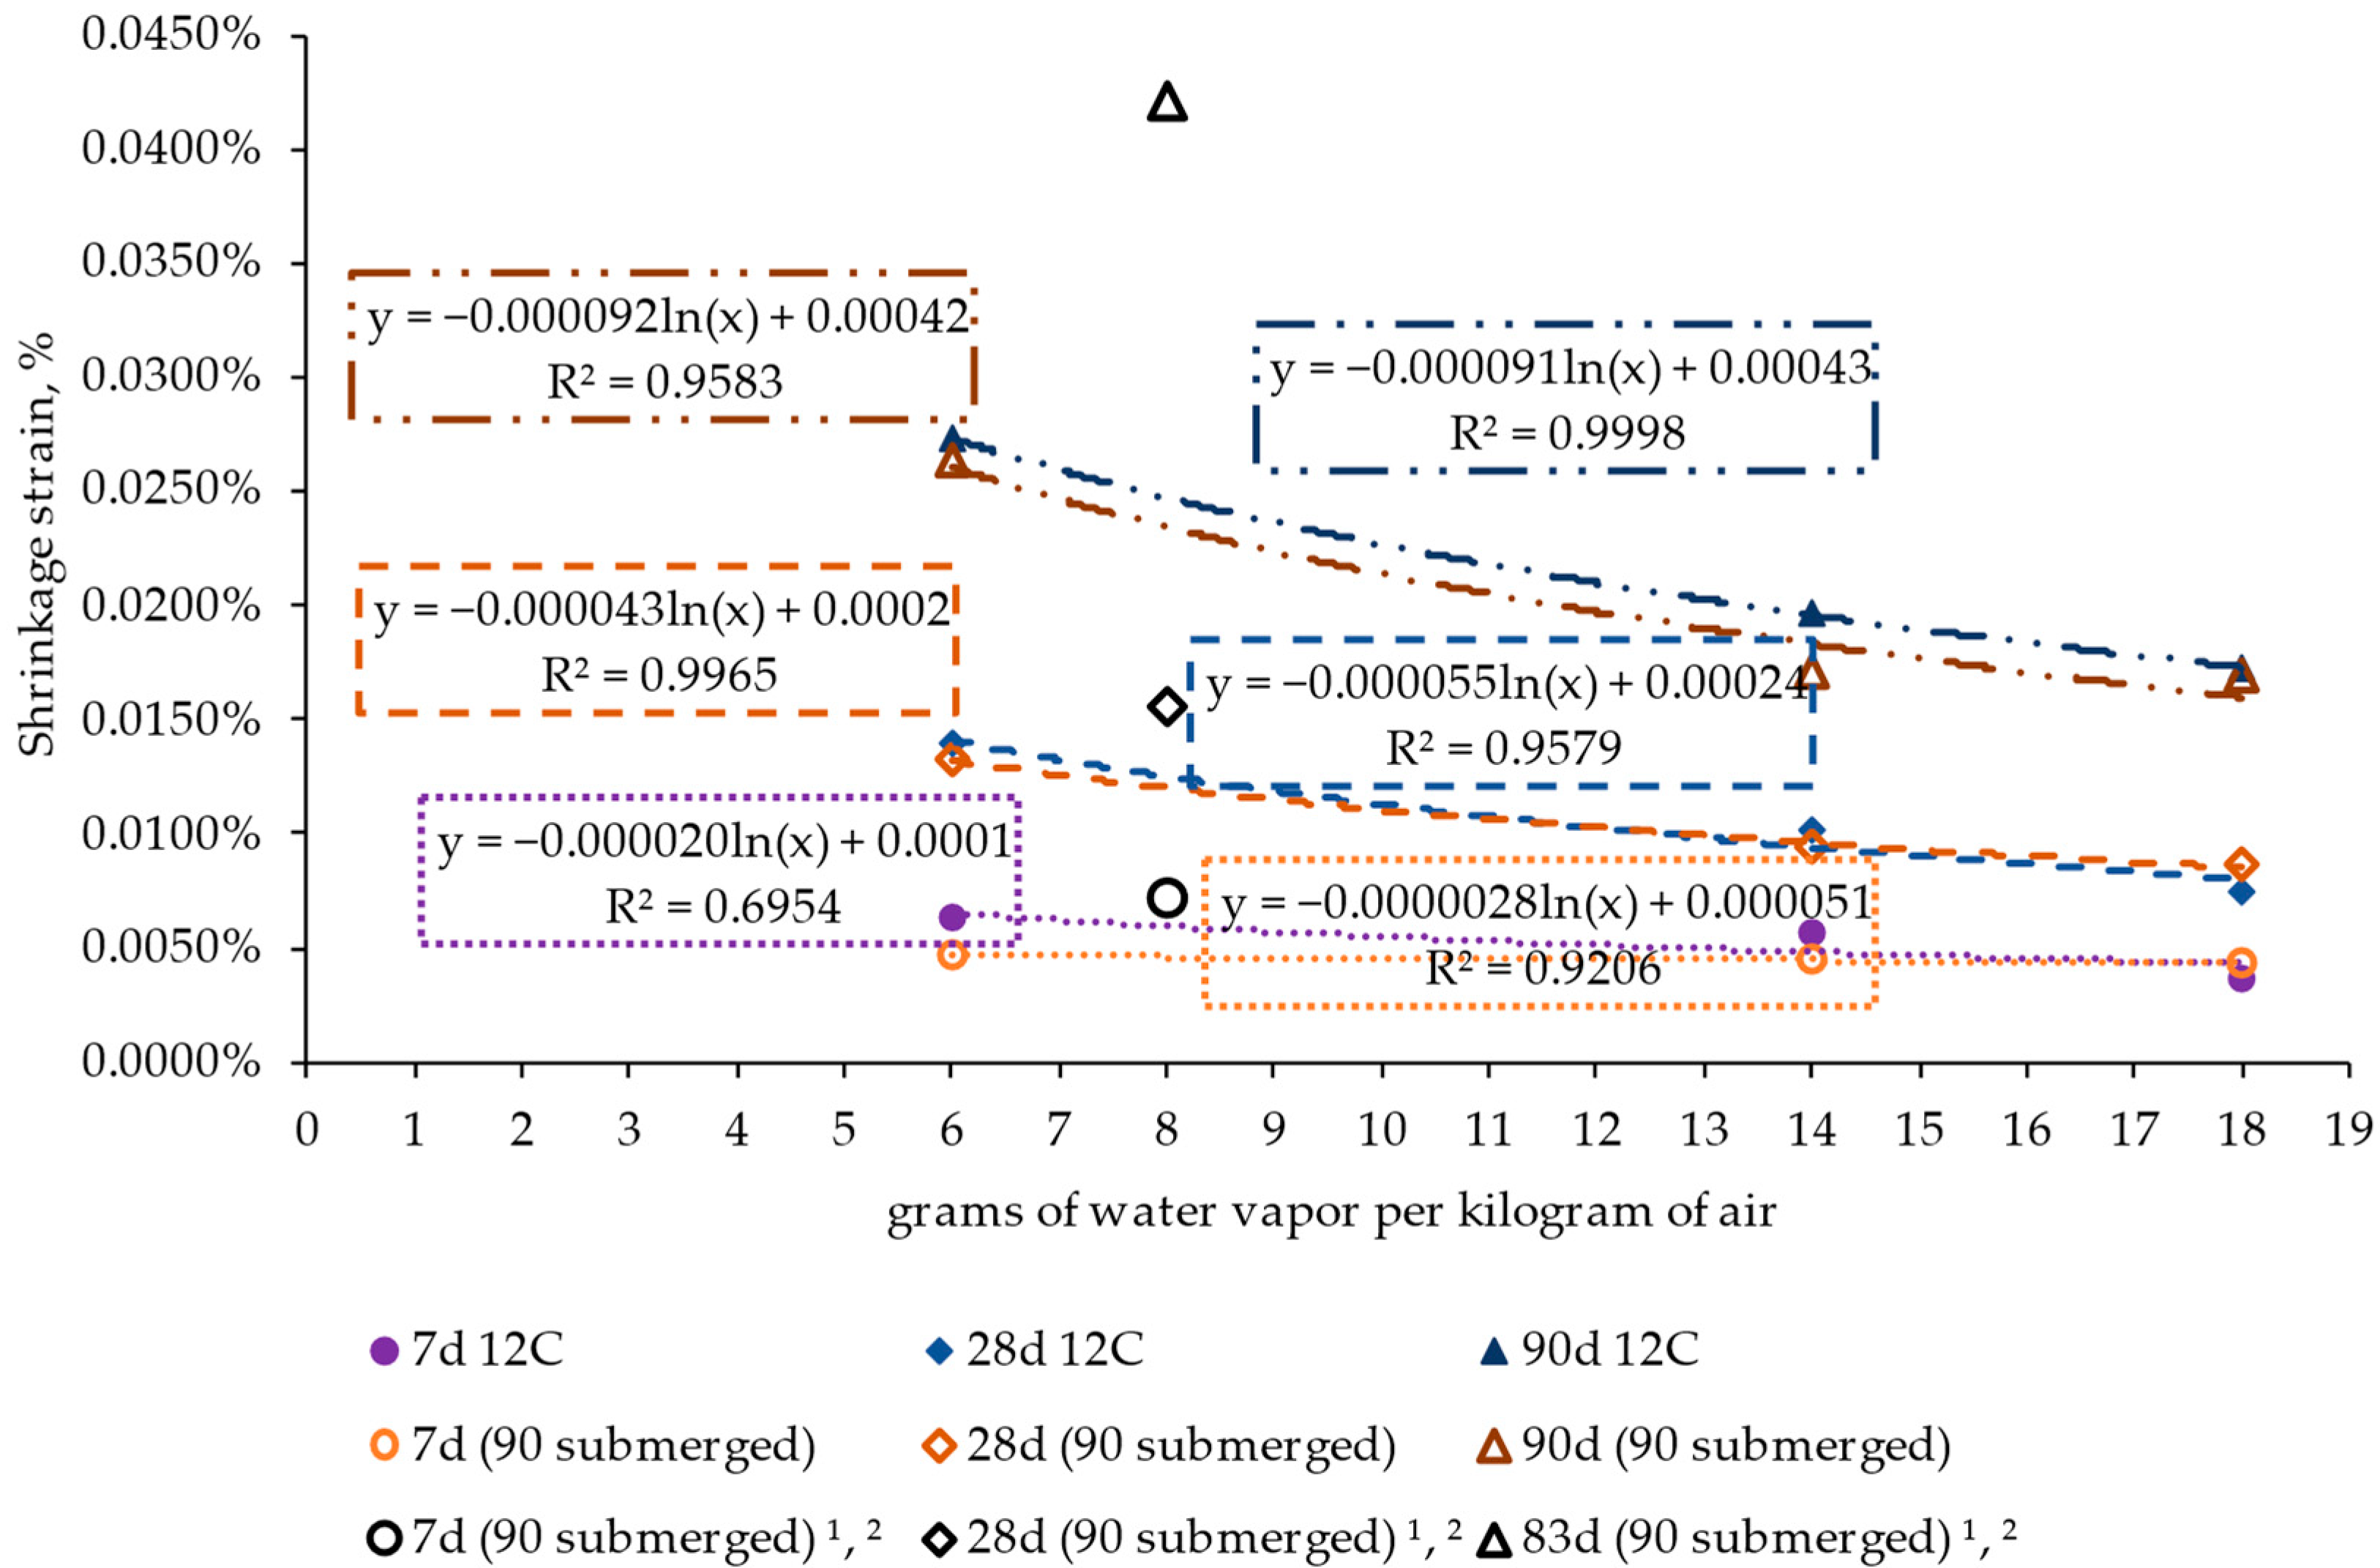
- The shrinkage strain showed a logarithmic relationship with the variation in grams of water vapor per kilogram of air, allowing for the prediction of RCC behavior under a wide combination of humidity–temperature values represented through such parameters. Conversely, this factor had little influence on other RCC properties, such as compression strength and resistance to flexion failure, where the ambient conditions had a limited impact on material strength.
- The design of RCC with a higher dosage of cement led to a higher capacity to retain moisture content in specimens, leading to a reduction in the shrinkage trend. Nonetheless, this reduction in material strain was more remarkable when manufacturing the RCC using a superplasticizer, which allowed for a reduction in water dosage. In all mix designs, little influence on structural strength was observed despite the variations in material design.
- The curing process had a higher impact on specimens under dry conditions, leading to a higher capacity to retain water and improve the performance of the material. Curing specimens under wet conditions had a limited effect but allowed for preserving the moisture retained by the material.
- The influence of the curing process was more accentuated in the structural properties, allowing for an increase in the properties of the material while contributing slightly to a reduction in the shrinkage strain in RCC in the long term.
- The most relevant factors for the shrinkage property were the use of RCC under wet conditions, improving the design of the RCC using higher cement dosage, and above all, using a superplasticizer, which allowed reducing the water content during manufacturing and thus reducing the shrinkage trend.
- The possibility of expanding this research to analyze how the physical–mechanical properties of the RCC mix influence the service conditions is recommended, considering the incorporation of other admixtures in everyday applications. In addition, the inclusion of sustainable materials is contemplated, such as alternative aggregates obtained from recycled concrete, recycled asphalt aggregates, electric arc furnaces, metallurgical slags, and recycled tire materials, such as rubber granules and polypropylene fibers.
- Registering a direct relationship between shrinkage and moisture marks a crucial starting point for applying the results in finite element models. This process involves developing laboratory computational models focused on moisture behavior and drying shrinkage over time. Created from the geometric configuration of the specimens, the boundary conditions and the stress or bending results before and after the failure occurs are required. These factors are vital to developing an advanced pavement model, which integrates constitutive modeling of damaged plasticity in concrete, accompanied by laboratory modeling results, the incorporation of conventional parameters, such as layer stiffness and thickness, interlayer bond, and vehicular loading model, to achieve a more accurate and functional representation of pavement stresses. This last inclusion is crucial for comparison with transfer functions or material behavior models used in the design.
Author Contributions
Funding
Institutional Review Board Statement
Informed Consent Statement
Data Availability Statement
Conflicts of Interest
Abbreviations
| CEM II/A-M | Portland Composite Cement |
| f’c | Compressive Strength |
| GGBF | Ground Granulated Blast Furnace |
| Mdd | Maximum Dry Density |
| MR | Modulus of Rupture |
| OMC | Optimum Moisture Content |
| RCC | Roller-Compacted Concrete |
| RCCP | Roller-Compacted Concrete for Pavements |
| RH | Relative Humidity |
| SSD | Saturated Surface-Dry |
| T | Temperature |
| W/C | Water–Cement Ratio |
References
- Moreno-Navarro, F.; Sierra-Carrillo de Albornoz, F.J.; Sol-Sánchez, M.; Rubio-Gámez, M.C. MASAI: Sustainable, automated and intelligent asphalt materials. The way to the next generation of asphalt pavements. Road Mater. Pavement Des. 2023, 24, 486–505. [Google Scholar] [CrossRef]
- Fengier, J.; Pozarycki, A.; Garbowski, T. Stiff-plate bearing test simulation based on FWD results. Procedia Eng. 2013, 57, 270–277. [Google Scholar] [CrossRef]
- Garbowski, T.; Pożarycki, A. Multi-level backcalculation algorithm for robust determination of pavement layers parameters. Inverse Probl. Sci. Eng. 2017, 25, 674–693. [Google Scholar] [CrossRef]
- ACI COMMITTEE 325. State-of-the-art report on roller-compacted concrete pavements, manual of concrete practice. Mater. J. 1994, 91, 509–510. [Google Scholar] [CrossRef]
- Ofori-Awuah, K. State-of-the-art of roller compacted concrete pavement. In Materials for the New Millennium; ASCE: Reston, VA, USA, 1996; pp. 1439–1448. [Google Scholar]
- Brotman, I.; Crist, M.; Gaul, J. Roller compacted concrete pavement: Properties, design, and construction. In Soil and Material Inputs for Mechanistic-Empirical Pavement Design. Geotechnical Special Publication; Tutumluer, E., Tashman, L., Ceylan, H., Eds.; GeoDenver: Denver, CO, USA, 2007. [Google Scholar] [CrossRef]
- Wu, Z.; Mahdi, M.; Rupnow, T. Performance of Thin RCC Pavements under Accelerated Loading. In The Roles of Accelerated Pavement Testing in Pavement Sustainability; Springe: Berlin/Heidelberg, Germany, 2016. [Google Scholar] [CrossRef]
- Williams, S. Construction of roller-compacted concrete pavement in the Fayetteville shale play area, Arkansas. Transp. Res. Rec. 2014, 2408, 47–54. [Google Scholar] [CrossRef]
- Mickevič, R.; Vaitkus, A. Application of roller-compacted concrete in freight terminals. Moksl. Liet. Ateitis 2020, 12, mla.2020.13067. [Google Scholar] [CrossRef]
- Smallridge, M.; Elbaz, M. RCC pavement success at mobile container terminal. In Ports 2010: Building on the Past, Respecting the Future, Proceedings of the 12th Triannual International Conference, Jacksonville, FL, USA, 25–28 August 2010; American Society of Civil Engineers: Reston, VA, USA, 2010. [Google Scholar] [CrossRef]
- Vaitkus, A.; Mickevič, R.; Šernas, O. Roller Compacted Concrete—Best Practice Of Lithuania. IOP Conf. Ser. Mater. Sci. Eng. 2021, 1202, 012010. [Google Scholar] [CrossRef]
- Hossain, M.S.; Ozyildirim, H.C. Roller compacted concrete pavement in Virginia. In Airfield and Highway Pavements 2015: Innovative and Cost-Effective Pavements for a Sustainable Future, Proceedings of the 2015 International Airfield and Highway Pavements Conference, Miami, FL, USA, 7–10 June 2015; American Society of Civil Engineers: Reston, VA, USA, 2015. [Google Scholar] [CrossRef]
- Novak, J.; Kohoutkova, A.; Chylik, R.; Trtik, T. Study on pervious recycled aggregate fiber-reinforced concrete for airfield pavement. IOP Conf. Ser. Mater. Sci. Eng. 2020, 770, 012040. [Google Scholar] [CrossRef]
- Guha, A.H.; Assaf, G.J. Effects of different fillers on pavement deformation of hot mix asphalt in hot climates. Constr. Build. Mater. 2020, 261, 119898. [Google Scholar] [CrossRef]
- Zhao, S.; Liu, J.; Li, P.; Burritt, T. Asphalt binder adaption for climatic conditions in cold regions: Alaska experience. J. Mater. Civ. Eng. 2017, 29, 04016184. [Google Scholar] [CrossRef]
- Moreno-Navarro, F.; Sol-Sánchez, M.; Rubio-Gámez, M.C. The effect of polymer modified binders on the long-term performance of bituminous mixtures: The influence of temperature. Mater. Des. 2015, 78, 5–11. [Google Scholar] [CrossRef]
- Moreno-Navarro, F.; Sierra, F.J.; Sol-Sánchez, M.; Rubio-Gámez, M.C.; Castillo, M.; Estévez, E. High-performance sustainable asphalt mixtures for high-volume traffic roads in severe climates. Sustainability 2020, 12, 8765. [Google Scholar] [CrossRef]
- Moreno, F.; Sol, M.; Martín, J.; Pérez, M.; Rubio, M.C. The effect of crumb rubber modifier on the resistance of asphalt mixes to plastic deformation. Mater. Des. 2013, 47, 274–280. [Google Scholar] [CrossRef]
- Vahedifard, F.; Nili, M.; Meehan, C.L. Assessing the effects of supplementary cementitious materials on the performance of low-cement roller compacted concrete pavement. Constr. Build. Mater. 2010, 24, 2528–2535. [Google Scholar] [CrossRef]
- Modarres, A.; Hesami, S.; Soltaninejad, M.; Madani, H. Application of coal waste in sustainable roller compacted concrete pavement-environmental and technical assessment. Int. J. Pavement Eng. 2018, 19, 748–761. [Google Scholar] [CrossRef]
- Adresi, M.; Lacidogna, G. Investigating the micro/macro-texture performance of roller-compacted concrete pavement under simulated traffic abrasion. Appl. Sci. 2021, 11, 5704. [Google Scholar] [CrossRef]
- Adamu, M.; Mohammed, B.S.; Shafiq, N.; Shahir Liew, M. Skid Resistance of nano silica modified roller compacted rubbercrete for pavement applications: Experimental methods and response surface methodology. Cogent Eng. 2018, 5, 1452664. [Google Scholar] [CrossRef]
- Sok, T.; Kim, Y.K.; Park, J.Y.; Lee, S.W. Evaluation of early-age strains and stresses in roller-compacted concrete pavement. J. Traffic Transp. Eng. Engl. Ed. 2021, 9, 93–105. [Google Scholar] [CrossRef]
- Saluja, S.; Kaur, K.; Goyal, S.; Bhattacharjee, B. Long-Term Drying Shrinkage of GGBFS-Incorporated RCC under Various Temperature Exposures. J. Mater. Civ. Eng. 2021, 33, 04021122. [Google Scholar] [CrossRef]
- Won, J.P.; Kim, J.M.; Lee, S.W.; Lee, J.W.; Lee, S.J.; Choi, T.J.; Park, S.K. Long-term performance of high early-strength roller-compacted concrete for pavement. In Advances in Concrete Structural Durability: Proceedings of the 2nd International Conference on Durability of Concrete Structures ICDCS2010, Sapporo, Japan, 24–26 November 2010; Hokkaido University Press: Sapporo, Japan, 2010. [Google Scholar]
- Ghafoori, N.; Cai, Y.Z. Laboratory-made roller compacted concretes containing dry bottom ash: Part II—Long-term durability. ACI Mater. J. 1998, 95, 244–251. [Google Scholar]
- Abbasi, M.; Shafigh, P.; Baharum, M.R. The effect of coarse to fine aggregate ratio on drying shrinkage of roller compacted concrete pavement in different curing conditions. Mater. Constr. 2021, 71, e246. [Google Scholar] [CrossRef]
- Delatte, N. Simplified design of roller-compacted concrete composite pavement. In Pavement design and accelerated testing. Transp. Res. Rec. 2004, 1896, 57–65. [Google Scholar] [CrossRef]
- Rao, S.K.; Sravana, P.; Rao, T.C. Analysis on strength and fly ash effect of roller compacted concrete pavement using M-sand. i-Manag. J. Struct. Eng. 2015, 4, 1–8. Available online: https://www.proquest.com/scholarly-journals/analysis-on-strength-fly-ash-effect-roller/docview/1721936836/se-2?accountid=14542 (accessed on 31 January 2021). [CrossRef]
- Keleş, Ö.F.; Akpinar, M.V. Strength properties of roller compacted concrete pavement (RCCP) under different curing methods. Constr. Build. Mater. 2022, 324, 126530. [Google Scholar] [CrossRef]
- Hejazi, S.M.; Abtahi, S.M.; Safaie, F. Investigation of thermal stress distribution in fiber-reinforced roller compacted concrete pavements. J. Ind. Text. 2016, 45, 896–914. [Google Scholar] [CrossRef]
- Jafarifar, N.; Pilakoutas, K.; Bennett, T. The effect of shrinkage cracks on the load bearing capacity of steel-fibre-reinforced roller-compacted-concrete pavements. Mater. Struct. 2016, 49, 2329–2347. [Google Scholar] [CrossRef]
- Gholami, N.; Modarres, A. Shrinkage behaviour of superplasticised RCCP and its relationship with internal temperature. Int. J. Pavement Eng. 2019, 20, 12–23. [Google Scholar] [CrossRef]
- Ueno, A.; Ishida, M.; Ohno, K.; Uji, K. Properties of extremely dry concrete made with eco-cement and recycled coarse aggregate. In Sustainable Construction Materials and Technologies; Coventry University: Coventry, UK, 2013. [Google Scholar]
- Jafarifar, N.; Pilakoutas, K.; Bennett, T. Moisture transport and drying shrinkage properties of steel-fibre-reinforced-concrete. Constr. Build. Mater. 2014, 73, 41–50. [Google Scholar] [CrossRef]
- Lotphi, A.M.; Modarres, A. Effect of surface free energy on water absorption of roller-compacted concrete pavement containing calcium stearate powder. Road Mater. Pavement Des. 2022, 24, 982–1004. [Google Scholar] [CrossRef]
- Jafarifar, N. Shrinkage Behaviour of Steel-Fibre-Reinforced-Concrete Pavements, UK. 2012. Available online: https://core.ac.uk/download/pdf/29030273.pdf (accessed on 26 January 2021).
- Pittman, D.W.; Ragan, S.A. Drying shrinkage of roller-compacted concrete for pavement applications. ACI Mater. J. 1998, 95, 19–26. [Google Scholar]
- Palmer, W.D., Jr. Paving with roller compacted concrete. Concr. Constr. 2005, 50, 45–48, 50. Available online: https://www.proquest.com/trade-journals/paving-with-roller-compacted-concrete/docview/198081544/se-2?accountid=14542 (accessed on 20 January 2021).
- Tartarini, F.; Schiavon, S.; Cheung, T.; Hoyt, T. CBE Thermal Comfort Tool: Online tool for thermal comfort calculations and visualizations. SoftwareX 2020, 12, 100563. [Google Scholar] [CrossRef]
- Hashemi, M.; Shafigh, P.; Bin Karim, M.R.; Atis, C.D. The effect of coarse to fine aggregate ratio on the fresh and hardened properties of roller-compacted concrete pavement. Constr. Build. Mater. 2018, 169, 553–566. [Google Scholar] [CrossRef]
- BOE. Real Decreto 256/2016, de 10 de Junio, Por el Que se Aprueba la Instrucción para la Recepción de Cementos (RC-16); Ministerio de la Presidencia: Madrid, Spain, 2016; Available online: https://www.boe.es/buscar/act.php?id=BOE-A-2016-6167 (accessed on 11 November 2022).
- ASTM C128-15; Standard Test Method for Relative Density (Specific Gravity) and Absorption of Fine Aggregate. ASTM: West Conshohocken, PA, USA, 2015. [CrossRef]
- ASTM C127-15; Standard Test Method for Relative Density (Specific Gravity) and Absorption of Coarse Aggregate. ASTM International: West Conshohocken, PA, USA, 2015. [CrossRef]
- Portland Cement Association. Guide Specification for Construction of Roller-Compacted Concrete Pavements; PCA: Skokie, IL, USA, 2004; Available online: https://www.chaneyenterprises.com/files/productdocs/Guidetorcc.PDF (accessed on 10 September 2021).
- Chhorn, C.; Lee, S.W. Influencing compressive strength of roller-compacted concrete. Proc. Inst. Civ. Eng.-Constr. Mater. 2018, 171, 3–10. [Google Scholar] [CrossRef]
- ASTM C33/C33M-18; Standard Specification for Concrete Aggregates. ASTM International: West Conshohocken, PA, USA, 2018. [CrossRef]
- Shafigh, P.; Hashemi, M.; Nam, B.H.; Koting, S. Optimum moisture content in roller-compacted concrete pavement. Int. J. Pavement Eng. 2020, 21, 1769–1779. [Google Scholar] [CrossRef]
- ASTM D1557-12; Standard Test Methods for Laboratory Compaction Characteristics of Soil Using Modified Effort (56,000 ft-lbf/ft3 (2700 kN-m/m3). ASTM International: West Conshohocken, PA, USA, 2012. [CrossRef]
- García-Travé, G.; Martinez-Echevarria, M.J.; Gámez, M.C.R.; Navarro, F.M. Bituminous mix response to plastic deformations: Comparison of the Spanish NLT-173 and UNE-EN 12697-22 wheel-tracking tests. DYNA 2012, 79, 51–57. [Google Scholar]
- García Travé, G.M. Análisis Comparativo del Comportamiento Mecánico de Mezclas Bituminosas: Normativa NLT-Normativa UNE-EN. Ph.D. Thesis, Universidad de Granada, Granada, Spain, 2013. [Google Scholar]
- Asad, M.; Baluch, M.H.; Al-Gadhib, A.H. Drying shrinkage stresses in concrete patch repair systems. Mag. Concr. Res. 1997, 49, 283–293. [Google Scholar] [CrossRef]
- ASTM C157/C157M-17; Standard Test Method for Length Change of Hardened Hydraulic-Cement Mortar and Concrete. ASTM International: West Conshohocken, PA, USA, 2017. [CrossRef]
- ASTM C39/C39M-21; Standard Test Method for Compressive Strength of Cylindrical Concrete Specimens. ASTM International: West Conshohocken, PA, USA, 2021. [CrossRef]
- BS EN 12390-3:2019; TC: Tracked Changes. Testing Hardened Concrete. Compressive Strength of Test Specimens. British Standards Institution: London, UK, 2019. Available online: https://shop.bsigroup.com/ProductDetail/?pid=000000000030407444 (accessed on 10 January 2021).
- ASTM C293/C293M-16; Standard Test Method for Flexural Strength of Concrete (Using Simple Beam with Center-Point Loading). ASTM International: West Conshohocken, PA, USA, 2016. [CrossRef]


| Material | Weight (kg/m3) | Volume (m3/m3) | Volume (L/m3) |
|---|---|---|---|
| Cement | 288.958 | 0.092 | 91.733 |
| Oven-dry weight of aggregates | 2119.025 | - | - |
| SSD weight of aggregates | 2129 | 0.767 | 767.216 |
| Absorbed water | 10 | - | - |
| Water at OMC | 136.051 | - | - |
| Free water at OMC | 126 | 0.126 | 126.051 |
| 1.5% air | - | 0.015 | 15 |
| Total | 2544.034 | 1 | 1000 |
| Material | Weight (kg/m3) | Volume (m3/m3) | Volume (L/m3) |
|---|---|---|---|
| Cement | 386.786 | 0.123 | 122.789 |
| Oven-dry weight of aggregates | 2030.627 | - | - |
| SSD weight of aggregates | 2040 | 0.735 | 735.210 |
| Absorbed water | 10 | - | - |
| Water at OMC | 136.584 | - | - |
| Free water at OMC | 127 | 0.127 | 127.001 |
| 1.5% air | - | 0.015 | 15 |
| Total | 2553.996 | 1 | 1000 |
| Material | Weight (kg/m3) | Volume (m3/m3) | Volume (L/m3) |
|---|---|---|---|
| Cement | 293.247 | 0.093 | 93.094 |
| Oven-dry weight of aggregates | 2150.5 | - | - |
| SSD weight of aggregates | 2161 | 0.779 | 778.604 |
| Absorbed water | 10 | - | - |
| Water at OMC | 122 | - | - |
| Free water at OMC | 112 | 0.112 | 112.038 |
| Admixture | 1.466 | 0.001264 | 1.264 |
| 1.5% air | - | 0.015 | 15 |
| Total | 2567.377 | 1 | 1000 |
Disclaimer/Publisher’s Note: The statements, opinions and data contained in all publications are solely those of the individual author(s) and contributor(s) and not of MDPI and/or the editor(s). MDPI and/or the editor(s) disclaim responsibility for any injury to people or property resulting from any ideas, methods, instructions or products referred to in the content. |
© 2023 by the authors. Licensee MDPI, Basel, Switzerland. This article is an open access article distributed under the terms and conditions of the Creative Commons Attribution (CC BY) license (https://creativecommons.org/licenses/by/4.0/).
Share and Cite
Pulecio-Díaz, J.; Sol-Sánchez, M.; Moreno-Navarro, F. Influence of Service Conditions and Mix Design on the Physical–Mechanical Properties of Roller-Compacted Concrete for Pavement. Materials 2024, 17, 552. https://doi.org/10.3390/ma17030552
Pulecio-Díaz J, Sol-Sánchez M, Moreno-Navarro F. Influence of Service Conditions and Mix Design on the Physical–Mechanical Properties of Roller-Compacted Concrete for Pavement. Materials. 2024; 17(3):552. https://doi.org/10.3390/ma17030552
Chicago/Turabian StylePulecio-Díaz, Julián, Miguel Sol-Sánchez, and Fernando Moreno-Navarro. 2024. "Influence of Service Conditions and Mix Design on the Physical–Mechanical Properties of Roller-Compacted Concrete for Pavement" Materials 17, no. 3: 552. https://doi.org/10.3390/ma17030552