
Revealing the Effect of α’ Decomposition on Microstructure Evolution and Mechanical Properties in Ti80 Alloy
by
Chunhong Xiao
1,
Bin Hu
1,
Jinyang Ge
1,
Bin Kong
2,
Deng Luo
3,
Xiaoyong Zhang
1,* and
Kechao Zhou
1 1
State Key Laboratory of Powder Metallurgy, Materials Science and Engineering, Powder Metallurgy Research Institute, Central South University, Changsha 410083, China
2
Hunan Xiangtou Goldsky Titanium Metal Co., Ltd., No. 116, Linyu Road, Yuelu Zone, Changsha 410221, China
3
Xiangtan Iron & Steel Group Co., Ltd., Yue Tang District, Xiangtan 411104, China
*
Author to whom correspondence should be addressed.
Materials 2024, 17(10), 2238; https://doi.org/10.3390/ma17102238
Submission received: 4 April 2024
/
Revised: 26 April 2024
/
Accepted: 2 May 2024
/
Published: 9 May 2024
(This article belongs to the Special Issue Review and Feature Papers in "Metals and Alloys" Section)
Abstract
:Three types of solution treatment and aging were designed to reveal the α’ decomposition and its effect on the mechanical properties of near-α Ti-80 alloy, as follows: solution at 970 °C then quenching (ST), ST + aging at 600 °C for 5 h (STA-1), and ST + aging 600 °C for 24 h (STA-2). The results show that the microstructures of the ST samples were mainly composed of equiaxed αp and acicular α’, with a large number of dislocations confirmed by the KAM results. After subsequent aging for 5 h, α’ decomposed into acicular fine αs and nano-β (intergranular β, intragranular β) in the STA-1 specimen, which obstructed dislocation motion during deformation, resulting in the STA-1 specimen exhibiting the most excellent yield strength (1012 MPa) and maintaining sufficient elongation (8.1%) compared with the ST (898 MPa) and STA-2 (871 MPa) samples. By further extending the aging time to 24 h, the size of acicular αs and nano-β gradually increased while the density of dislocations decreased, which resulted in a decrease in strength and an increase in plasticity. Based on this, a microstructures–properties correlation model was proposed. This study provides a new method for strength–plasticity matching of near-α titanium alloys through α’ decomposition to acicular αs+nano-β.
1. Introduction
A near-α titanium alloy, Ti-6Al-3Nb-2Zr-1Mo (Ti80), is attractive for marine applications due to its high specific strength, excellent impact toughness, and good seawater corrosion resistance [1,2]. However, with the development of marine engineering, higher requirements are proposed for the mechanical properties of the alloy, including better strength and plasticity. In addition to thermomechanical processing, heat treatment is a common way to obtain the desired properties by adjusting the microstructure of titanium alloys through controlling the phase transition [3,4]. Generally, extremely fine αs has a greater capacity to obstruct dislocation motion, thereby increasing the strength of the alloy, and equiaxed primary αp can improve the plasticity of the alloy [5,6].
Solution treatment and aging is a common heat treatment to strengthen titanium alloys [7,8]. For titanium alloys with relatively low content of β- stable elements, after solution treatment in the β-phase region and quenching, the β phase undergoes β → α′ displacive martensitic transformation, resulting in disorderly distributed formation of a fully acicular α′ microstructure [9,10]. The displacive transformation is associated with the generation of a large number of dislocations [11], which results in poor plasticity [12,13]. Even after subsequent aging, it is challenging to achieve a substantial increase in plasticity. Su et al. [14] confirmed this view in the Ti-6Al-4V alloy, where solution-treated samples showed a poor elongation of ~3%, and the elongation increased slightly to ~6% with the subsequent aging process. Similar results were reported in Ti-30Zr-5Al-2.5Sn alloys [15] and in TA19 [10].
To overcome the lack of plasticity caused by fully acicular α′ microstructure after solution treatment in the β phase region and aging, solution treatment within the α+β phase region and aging have been investigated [16,17]. Solution treatment within the α+β phase region can retain a certain amount of equiaxial primary αp. As a plastic phase, equiaxed αp is capable of withstanding more plastic deformation during deformation, reducing stress concentrations and thus avoiding the generation of voids [18]. For instance, Matsumoto et al. [19] found that the alloy possessing both the primary equiaxial αp phase and the acicular α′ phase exhibited better cold-rolling reduction (43.3%) than the full acicular α′-phase (24.6%) on a Ti-6Al-4V alloy. Zhu et al. [20] conducted solution and aging treatment in the α+β region on as-rolled Ti-6Al-4V, obtaining the equiaxial αp phase and the βt. The tensile strength of the alloy had increased from 1051 MPa in the initial state to 1254 MPa, and retained the elongation with 10.4%. Chen et al. [21] investigated the influence on the tensile properties of Ti-6121 alloys after solution treatment in the α+β phase region and aging. The strength increased from 1096 MPa in the rolled state to 1387 MPa, and the elongation reached 11%. Similar results were also reported by Mandal et al. [22] in a α+β titanium alloy and Shi et al. [23] in a near-α titanium alloy. For α, near-α, and α+β titanium alloys with relatively low contents of β-stable elements, as mentioned above, solution treatment in the α+β phase region and aging have been widely used to modulate the microstructures and optimize their properties, and have achieved good outcomes. However, as for the solution treatment and aging of near-α titanium alloys, the evolution of the martensitic α′ phase and its effect on mechanical properties require further investigation, and strengthening mechanisms and models need to be further developed.
In this work, the microstructure characteristics and mechanical properties of Ti80 alloy subjected to solution treatment within the α+β phase region and subsequent aging were comparatively investigated. Through optical microscope (OM), scanning electron microscope (SEM), electron backscattered diffraction (EBSD), and transmission electron microscope (TEM) characterization, the microstructural evolution, including the decomposition mechanisms of the α′ phase, the change in dislocation density, and their effects on mechanical properties, were revealed. Furthermore, a microstructures–properties correlation model was constructed. These findings may provide a new concept for strength–plasticity matching of near-α titanium alloys by α’ decomposing to acicular αs+nano-β.
2. Experimental Procedures
In this study, an as-rolled Ti80 alloy plate was provided by Hunan Xiangtou Goldsky Titanium Mental Co., Ltd. (Changsha, China), and its chemical composition is shown in Table 1. The α/β transformation temperature (Tβ) of this billet, measured using the metallographic method, was 1000 °C. Figure 1 illustrates the initial microstructure of the Ti80 plate, which was composed of lamellar α and βt phases. The lamellar α phase was parallel to the rolling direction (RD).
The specimens with sizes of 80 mm × 22 mm × 6 mm were machined from the billet for heat treatment experiments. The schematic diagram of the heat treatment process is presented in Figure 2a–c. The three heat treatment methods are as follows: (I) solution at 970 °C for 2 h, followed by quenching (ST sample); (II) solution at 970 °C for 2 h, followed by quenching, aging at 600 °C for 5 h, and air cooling (STA-1 sample); and (III) solution at 970 °C for 2 h, followed by quenching, aging at 600 °C for 24 h, and air cooling (STA-2 sample). In this study, the alloy block was sealed within a vacuum quartz tube for the purpose of heat treatment in order to prevent the influence of oxygen contamination.
In terms of mechanical performance testing samples, a dog bone tensile specimen with a gauge size of 78 mm × 10 mm × 1.5 mm was excised from the heat-treated specimens, as shown in Figure 2d. The effect of wire cutting was eliminated after mechanical grinding of the tensile samples. Tensile tests were carried out using an Instron 3369 mechanical testing machine (Instron, Norwood, MA, USA), with a stretching speed of 2 mm/min. The displacement of the specimen was recorded using a YYJ-4/10-L extensometer (Suzhou Shenghui Precision Instrument Technology Co., Ltd., Suzhou, China). A tensile experiment with strains up to 3% was carried out using an IBTC-500 in situ mechanical test system (CARE Measurement and control, Tianjin, China), and the tensile speed was 0.002 mm/s. Upon reaching a strain of 3%, the tensile test was terminated. The strain of the ST, STA-1, and STA-2 samples was 3%, just passing the yield point.
Some small blocks were cut for the microstructure characterization; subsequently, this pieces were subjected to mechanical grinding with 240 #, 400 #, and 600 # metallographic sandpaper, followed by electrochemical polishing in Kroll’s solution (60% methanol, 35% butanol, and 5% perchloric acid) for 20 s. Scanning electron microscopy (SEM) was performed under a Tescan Mira4 electron microscope, (TESCAN, Brno, Czech Republic), and electron backscatter diffraction (EBSD) observation was conducted using a Regulus 8230 ultra-high-resolution large-beam cold field emission scanning electron microscope (Hitachi Limited, Tokyo, Japan). Thin films for transmission electron microscopy (TEM) were prepared by means of electrolytic polishing (Denmar Struers A/S, Copenhagen, Denmark) of Kroll’s solution at −23 °C using a double jet electrolytic apparatus, and TEM observations were conducted under F200X field emission transmission electron microscopy (TESCAN, Brno, Czech Republic). The size and the content of the α phase were statistically analyzed using Image J 1.54d software. The size and content of the α phase were quantified using Image J software.
3. Results
3.1. Mechanical Properties and Fracture Morphology
Figure 3 illustrates the engineering stress–strain curves and corresponding tensile properties of the Ti80 alloy subjected to three heat treatments. After solution at 970 °C for 2 h, followed by quenching, the yield tensile strength (YTS), ultimate tensile strength (UTS), and elongation of the ST specimen reached 898 MPa, 1083 MPa, and 7.7%, respectively. After aging at 600 °C for 5 h, the STA-1 specimen obtained improved strength and ductility, with the YTS, UTS, and elongation increasing to 1012 MPa, 1126 MPa, and 8.1%; the YTS was 10–20% higher than that already reported for Ti80 alloys (785 MPa~885 Ma) [3,4]. After extending the aging time to 24 h, the YTS of STA-2 decreased to 871 MPa, while the elongation increased to 10.2%. Figure 4 illustrates the fracture morphology of the Ti80 alloy tensile specimens subjected to three heat treatment conditions, respectively. Compared to those of ST and STA-1 samples, the dimples of the STA-2 specimen were significantly larger and deeper, which is consistent with the good plasticity of the STA-2 sample.
3.2. Microstructures Characteristics
The microstructures of Ti80 alloy subjected to three heat treatments are shown in Figure 5. The low-magnification SEM image indicates that all specimens were dominated by the equiaxed αp phase and βt phase, and the distribution of equiaxed αp was uniform (Figure 5a–c). The microstructure characteristics of equiaxed αp are listed in Table 2. The results show that the volume fraction and the average width of equiaxed αp phase had no significant differences among the three samples, which indicates that aging treatment at 600 °C had a minimal effect on the equiaxed αp morphology. However, the acicular phase can be observed in the magnified SEM results (Figure 5(a1–c1)). Further TEM characterization was conducted to identify the acicular phase in βt. As can be seen in Figure 5(a2), the needle-like precipitated phase in βt of the ST specimen was very fine, with an average thickness of ~260 nm. After subsequent aging, the acicular phase in βt grew considerably larger, as shown in Figure 5(b2,c2). With the increase in the aging time from 5 h to 24 h, the thickness of the acicular phase from ~430 nm (STA-1) increased to ~690 nm (STA-2). The acicular phase can be identified from the selected area electron diffraction (SAED) as the HCP structure in all samples. During rapid cooling from a high temperature, β transformed into α’ martensite through displacive transformation in near-α titanium alloys. This caused the elemental composition of the α’ phase to be identical to that of the parent β phase [9,24,25]. During the subsequent aging process, α’ decomposed into αs+β. This is a diffusive phase transformation. Therefore, there are elemental differences between α’ and αs. Specifically, α-stable elements are enriched in αs, while β-stable elements are enriched in α’ [26]. Based on the aforementioned studies, it is speculated that the acicular phase in the βt phase of heat-treated samples can be either αs or α’. Consequently, HAADF-STEM was used to identify them.
Figure 6 presents high-angle annular dark-field scanning transmission electron microscopy (HAADF-STEM) images and the corresponding elemental energy-dispersive X-ray spectroscopy (EDS) results of the Ti80 alloy following three heat treatments. Al is an α-stable element which is enriched in the α phase. Nb and Mo are β-stable elements which are enriched in the β phase and the α’ phase. Zr is a neutral element [26]. However, it has been demonstrated by various studies that Zr is an effective alloying element in stabilizing the β phase at room temperature. The addition of Zr resulted in a reduction in martensitic transformation temperatures, which indicates that Zr can be employed as a β-stable element [27,28]. As for the ST specimen, the contents of Mo, Nb, and Zr in βt were significantly higher than those in equiaxed αp, but there was no enrichment in the βt phase, as can be seen from Figure 6a. Therefore, there was no element enrichment between the acicular phase and the matrix in βt, suggesting that the lamellar phase in βt of the ST specimen was α’ phase. After subsequent aging treatment, the enrichment degrees of Mo, Nb, and Zr in βt were significantly different (Figure 6b,c), which suggests that the lamellar α in βt of STA-1 and STA-2 samples was αs. Meanwhile, Mo, Nb, and Zr were discontinuously enriched at the lamellar α grain boundaries, which formed an intergranular β phase (Figure 6b,c).
Meanwhile, for the STA-1 sample, an interesting phenomenon was observed at HAADF-STEM, that is, the presence of a nano-precipitated phase within the lamellar α, as shown in Figure 7a. In order to further determine the composition and microstructure of the nano-precipitated phase, HAADF-STEM mapping and high-resolution TEM (HRTEM) were used, and the results are shown in Figure 7(a1–a5) and Figure 7(b,b1), respectively. The results of HAADF-STEM mapping indicate that the elements of Nb and Mo were enriched on the nano-precipitated phase. The results of fast Fourier transform (FFT) of Figure 7(b1) indicate that the matrix phase had an HCP structure, and the nano-precipitated phase had a BCC structure. Furthermore, the nano-precipitated phase maintained BOR with the matrix, i.e., (0001)α∥(011)β, <110>α∥<111>β [29]. This shows that the matrix phase is the α phase and the nano-precipitated phase is the intragranular β phase. It can be indicated that the nano-β is derived from the decomposition of α’; thus, the alloy undergoes an α’ → α+β decomposition reaction during aging at 600 °C [30,31].
As shown in the TEM images in Figure 5(a3–c3), dislocations could be observed in the three heat-treated specimens. To further investigate the differences in dislocation density in these samples, EBSD characterization was carried out. Figure 8 shows the EBSD results of the Ti80 alloy subjected to three heat treatments, including image quality mappings (IQ), inverse pole figure mappings (IPF), and Kernel average misorientation mappings (KAM). The KAM value qualitatively indicates the density of dislocation [32,33]. It can be seen from Figure 8(a2) that high KAM values were present in the ST sample, and the KAM values of equiaxed αp were lower than those of βt. This indicates that a considerable number of dislocations were generated at βt in order to accommodate the strain of β→α’. After subsequent aging treatment, the KAM values of the STA-1 and STA-2 samples decreased significantly, indicating that the dislocation density decreased dramatically (Figure 8(b2,c2)).
4. Discussion
4.1. Effect of α’ Decomposition on Microstructure Evolution
Figure 9 schematically shows the microstructure evolution of the Ti80 alloy during solution treatment in the α+β phase region and aging. Due to the rapid cooling during solution treatment in the α+β phase region, the Ti80 alloy deviated from the equilibrium state. Meanwhile, a significant number of dislocations were generated within the alloy in order to accommodate the strain produced by the martensitic phase transition during cooling. Thus, the Gibbs free energy of the alloy increased. At this stage, the microstructure of the Ti80 alloy consisted of equiaxed αp and βt (acicular α’+residual β). Large amounts of Nb and Mo atoms were enriched in the acicular α’ phase. Subsequent aging led to a decrease in the Gibbs free energy, resulting in a decrease in dislocations and the decomposition of the α’ phase into αs and nano-β (intergranular β, intragranular β). The thermodynamic origin of the decomposition of the α’ phase in Ti80 is the decrease in Gibbs free energy [34]. Furthermore, the decomposition of α’ can also be attributed to aging at a high temperature and concentration gradients of elements such as Nb, Mo, and Zr atoms. The aging process caused interdiffusion of β-stable and α-stable elements, resulting in the formation of the lamellar αs phase and the nano-β phase. This process led to the enrichment of Mo and Nb atoms in the nano-β. In conclusion, this decomposition process is an element-controlled diffusion process which also involves a reduction in dislocation density [35]. Meanwhile, with prolonged aging time, the sizes of the of αs and nano-β phases gradually increase, and the dislocation density decreases. It is of interest to note that, due to the fixed solution treatment temperature, the morphology of equiaxed αp does not undergo significant changes during solution treatment and aging.
4.2. Effect of Microstructure Evolution on Mechanical Properties
The strengthening mechanisms of titanium alloys can be broadly categorized into: solution strengthening, second-phase strengthening, α-phase lattice strengthening, fine-grain strengthening, texture strengthening, etc. [36,37]. As mentioned above, in this study, the factors that led to changes in the mechanical properties of the alloy mainly include the initial dislocation density, the size effect of αs, and nano-β.
For the ST specimen, it can be seen from the KAM mapping in Figure 8(a3) that, due to the lattice distortion caused by the martensitic phase transformation, a high density of dislocations was generated in the βt; hence, the ST sample exhibited good strength, with 1083 MPa. However, by comparing Figure 8(a3,b3), it was found that the KAM value of the STA-1 specimen was lower than that of ST, but the strength of the STA-1 specimen (1126 MPa) was higher than that of the ST sample (1083 MPa). Thus, the decrease in dislocation density was not a factor in the increase in the strength of the STA-1 sample. Hence, in order to further reveal the differences in the failure mechanisms of the samples, after the tensile test, the specimens were subjected to TEM characterization, and the results are shown in Figure 10.
As can be seen from Figure 10(a,a1), after the tensile test, significant dislocation plugging and entanglement could be observed at the α’ interface in the ST specimen, while the dislocation density was low inside the α’. For the STA-1 sample, after the tensile test, a large number of dislocations was observed not only at the αs interface, but also entangled around the nano-β phase inside the αs, as shown in Figure 10(b,b1). In summary, the reason for the increase in the strength of the STA-1 sample was that, during the aging process, the α’ martensite decomposed to the αs and nano-β phases; meanwhile, the αs and nano-β phase could effectively hinder the dislocation motion during the deformation of the alloy [38].
Compared to ST and STA-1 specimens, the strength of the STA-2 specimen decreased significantly. For the STA-2 specimen, it can be seen from the KAM mapping in Figure 8(c3) that, with the aging time extended to 24 h, the dislocation density in the alloy was significantly lower than that of ST and STA-1, which is one of the reasons for the decline in the strength of the STA-2 specimen. In addition, as can be seen from Figure 10(c,c1), a number of entangled dislocations was observed around the nano-β phase, and this result is similar to that of the STA-1 sample. However, for the STA-1 and STA-2 specimens, there was an obvious difference in the width of the lamellar αs and nano-β phase. With the aging time extended from 5 h to 24 h, the αs lamella thickness increased from ~430 nm in the STA-1 specimen to ~688 nm in the STA-2 specimen. Therefore, the increase in αs and nano-β phase thickness was another factor that decreased the strength of the STA-2 sample.
In accordance with the aforementioned principle, the yield stress of the Ti80 alloy can be expressed as follows [39]:
where σ0 stands for the natural lattice friction; σp denotes the strength of the equiaxed αp; σs represents the strength of the lamellar αs/α’; σβ is the strength of the precipitated phase β; and ψσp, ψσ, and ψβ denote the volume fractions of the αp, σs, and precipitated phase β phases, respectively.
σ = σ0 + ψσpσp + ψσsσs + ψβσβ
In accordance with the classical Hall–Petch relationship, σp is related to the average size of αp grains [40]:
Herein, σ0 and , are the frictional stress and Hall–Petch coefficient of the αp, phase, respectively, and is the average diameter of the αp phase. During the solution treatment and aging, the morphology and size of the equiaxed αp phase do not change significantly. Thus, in this study, the change in mechanical properties was not dependent on the αp phase.
The semi-empirical Hall–Petch relation indicates that the relation of σs can be expressed as follows [41]:
where σ0 and k are the friction stress of αs/α’ and the Hall–Petch coefficient, respectively, and wαs/α’ is the width of the αs/α’ phase. The αs/α’ phase has been demonstrated to enhance the strength of titanium alloys, with the observed increase in strength correlating with a reduction in the width of the αs/α’ phase [42,43]. Prolonging the aging time, the width of the αs phase increases, and the effect of the layer thickness on the alloy’s mechanical properties is more significant.
σs = σ0 + k(wαs/α’/2)−1/2
The σβ can be expressed by the following formula:
where σ0 and kβ are the frictional stress and Hall–Petch coefficient of the precipitated β phase, respectively. dβ represents the average diameter of the nano-β phase. The equation demonstrates that as the aging time is extended to 24 h, the volume fraction of the precipitated phase increases, yet the strength of the alloy decreases due to the nano-β size effect.
σβ = σ0 + kβdβ−1/2
Considering that there is a difference in αp and βt plastic deformation capacity in titanium alloys, in order to further reveal the roles assumed by βt, which contains αs and α’, in the plastic deformation process of the three samples, hardness tests and tensile experiments with strains up to 3% were conducted—3% indicates that the strains of ST, STA-1, and STA-2 samples are just passing the yield point. At this time, the softer phase in the alloy preferentially undergoes plastic deformation, resulting in the formation of a slip trace [44,45]. Table 3 shows that the hardnesses of βt in the ST, STA-1, and STA-2 samples were 331 HV, 354 HV, and 301 HV, respectively. The hardness of βt increased and then decreased. The microstructures of specimens with tensile strains up to 3% are shown in Figure 11. For the ST sample, some slip traces were observed in both the βt and αp phases, as is presented in Figure 11a. For the STA-1 specimen, as shown in Figure 11b, it can be observed that the slip traces only appeared within the equiaxial αp phase. This situation indicates that, due to α’ decomposition, the hardness of the βt phase increased, resulting in plastic deformation occurring preferentially within the soft αp phase, which is consistent with the results regarding the hardness values of βt. The experimental results for the STA-2 sample are very different from those of the ST and STA-1 samples. A large number of slip traces were observed in both the αp and βt phases, as can be seen in Figure 11c. The reason for this phenomenon was that, after the 24 h aging treatment, the increase in the size of the αs phase and nano-β, as well as the significant decrease in dislocation density, led to a significant decrease in the hardness of the βt matrix. As a result, the deformation compatibility of STA-2 specimen was dramatically improved, favoring the increase in alloy ductility. The study suggests that the α’ decomposition, which leads to an increase in βt hardness, was the primary reason for the significant increase in strength in the STA-1 sample.
5. Conclusions
In this study, the microstructure characteristics and mechanical properties of Ti80 alloy subjected to solution treatment within the α+β phase region and aging were comparatively investigated. The present work aimed to explore the decomposition mechanisms of the α′ phase in aging, as well as its influence on the microstructure and mechanical properties. The main conclusions can be summarized as follows:
- (1)
- The YTS, UTS, and elongation of the ST sample reached 898 MPa, 1083 MPa, and 7.7%, respectively. Then, after subsequent aging for 5 h, the strength and plasticity of the STA-1 specimen were synergistically improved, with the YTS, UTS, and elongation reaching 1012 MPa, 1126 Mpa, and 8.1%, respectively. With further extension of the aging time to 24 h, the YTS and UTS of the STA-2 sample were reduced to 871 MPa and 958 Mpa, respectively, and the elongation increased to 10.2%.
- (2)
- The microstructures of the three specimens were mainly composed of equiaxed αp and αs (α’). For ST sample, the microstructure consisted of equiaxed αp + acicular α’. After subsequent aging, α’ decomposed into αs and nano-β phases in STA-1 and STA-2 specimens. Furthermore, as the aging time was extended, the dislocation density decreased, while the size of the αs and nano-β phases gradually increased.
- (3)
- The mechanical properties of the heat-treated samples were affected by the initial dislocation density, the size effect of αs, and nano-β. The fine lamellar αs and nano-β phase can effectively impede the movement of dislocations during plastic deformation, thus achieving alloy strengthening. Based on the above principles, a microstructures–properties correlation model of Ti80 alloy was constructed.
- (4)
- The distribution of slip traces in the supplementary 3% tensile experiments of heat-treated specimens was different. This suggests that α’ decomposition results in an increase in βt hardness, which was the primary cause of the significant strength increase observed in the STA-1 specimen.
Author Contributions
Data curation, C.X., B.H. and J.G.; investigation, C.X., B.H. and J.G.; methodology, C.X.; resources, B.K. and D.L.; writing—original draft preparation, C.X.; writing—review and editing, C.X., B.H., J.G., B.K., D.L., X.Z. and K.Z.; project administration, K.Z.; funding acquisition, X.Z. and K.Z. All authors have read and agreed to the published version of the manuscript.
Funding
This research was funded by the National Natural Science Foundation of China (No. 52371040), the Joint Funds of the Natural Science Foundation of Hunan Province (2023JJ50333), Graduate Innovation Project of Central South University (2023XQLH148), and the Technical Key Project of Hunan Province (2021GK1080).
Institutional Review Board Statement
Not applicable.
Informed Consent Statement
Not applicable.
Data Availability Statement
The original contributions presented in the study are included in the article material, further inquiries can be directed to the corresponding author.
Conflicts of Interest
Author Bin Kong was employed by Hunan Xiangtou Goldsky Titanium Metal Co., Ltd. Author Deng Luo was employed by Xiangtan Iron & Steel Group Co., Ltd. The remaining authors declare that the research was conducted in the absence of any commercial or financial relationships that could be construed as a potential conflict of interest.
References
- Wang, Q.; Ren, J.Q.; Wu, Y.K.; Jiang, P.; Li, J.Q.; Sun, Z.J.; Liu, X.T. Comparative study of crack growth behaviors of fully-lamellar and bi-lamellar Ti-6Al-3Nb-2Zr-1Mo alloy. J. Alloys Compd. 2019, 789, 249–255. [Google Scholar] [CrossRef]
- Gao, F.; Gao, Q.; Jiang, P.; Liu, Z.; Liao, Z. Microstructure and mechanical properties of Ti6321 alloy welded joint by EBW. Int. J. Lightweight Mater. Manuf. 2018, 1, 265–269. [Google Scholar] [CrossRef]
- Gaillard, Q.; Boulnat, X.; Cazottes, S.; Dancette, S.; Desrayaud, C. Strength/ductility trade-off of Laser Powder Bed Fusion Ti-6Al-4V: Synergetic effect of alpha-case formation and microstructure evolution upon heat treatments. Addit. Manuf. 2023, 76, 103772. [Google Scholar] [CrossRef]
- Youn, S.; Kim, Y.; Kim, H. Improvement in the high temperature mechanical properties of additively manufactured Ti–48Al–2Cr–2Nb alloy using heat treatment. Intermetallics 2023, 153, 107784. [Google Scholar] [CrossRef]
- Wang, K.; Wu, M.; Yan, Z.; Li, D.R.; Xin, R.L.; Liu, Q. Microstructure evolution and static recrystallization during hot rolling and annealing of an equiaxed-structure TC21 titanium alloy. J. Alloys Compd. 2018, 752, 14–22. [Google Scholar] [CrossRef]
- Shahmir, H.; Langdon, T.G. Using heat treatments, high-pressure torsion and post-deformation annealing to optimize the properties of Ti-6Al-4V alloys. Acta Mater. 2017, 141, 419–426. [Google Scholar] [CrossRef]
- Zhu, W.; Lei, J.; Su, B.; Sun, Q. The interdependence of microstructure, strength and fracture toughness in a novel β titanium alloy Ti-5Al-4Zr-8Mo-7V. Mater. Sci. Eng. A 2020, 782, 139248. [Google Scholar] [CrossRef]
- Hirano, T.; Murakami, T.; Narushima, T.; Ouchi, C. Variations in the Microstructure and Hardness with Solution Treating and Aging Conditions in New α+β Titanium Alloy Ti-4.5Al-6Nb-2Fe-2Mo. ISIJ Int. 2007, 47, 1042–1049. [Google Scholar] [CrossRef]
- Dumas, O.; Malet, L.; Kwaśniak, P.; Prima, F.; Godet, S. Design rules to develop solute lean α+β titanium alloys exhibiting high work-hardening by reorientation induced plasticity. Mater. Sci. Eng. A 2024, 890, 145935. [Google Scholar] [CrossRef]
- Wang, F.; Lei, L.M.; Fu, X.; Song, Z.M.; Shi, L.; Zhang, B.; Zhang, G.P. Effect of heat treatment on microstructures and tensile properties of TA19 alloy fabricated by laser metal deposition. Mater. Sci. Eng. A 2020, 782, 139284. [Google Scholar] [CrossRef]
- Jiang, X.J.; Chen, G.Y.; Men, X.L. Grain refinement and excellent mechanical properties of a Ti-based alloy via laser melting and subsequent low temperature annealing. Mater. Sci. Eng. A 2018, 737, 182–187. [Google Scholar] [CrossRef]
- Ma, X.; Chen, Z.; Xiang, Z.; Zhang, S.; Liu, Y.; Ding, X. Influence of quenching plus aging on microstructures and mechanical properties evolutions for Ti-Al-Sn-Zr-Mo-Si-Nb-Ta-Er-C near-α high temperature titanium alloys. Mater. Today Commun. 2024, 38, 108457. [Google Scholar] [CrossRef]
- Su, J.; Xie, H.; Tan, C.; Xu, Z.; Liu, J.; Jiang, F.; Tang, J.; Fu, D.; Zhang, H.; Teng, J. Microstructural characteristics and tribological behavior of an additively manufactured Ti-6Al-4V alloy under direct aging and solution-aging treatments. Tribol. Int. 2022, 175, 107763. [Google Scholar] [CrossRef]
- Su, J.; Ji, X.; Liu, J.; Teng, J.; Jiang, F.; Fu, D.; Zhang, H. Revealing the decomposition mechanisms of dislocations and metastable α’ phase and their effects on mechanical properties in a Ti-6Al-4V alloy. J. Mater. Sci. Technol. 2022, 107, 136–148. [Google Scholar] [CrossRef]
- Ma, W.; Liu, S.; Zhang, X.; Cheng, B. Microstructural evolution and mechanical properties of hot-rolled Ti-30Zr-5Al-2.5Sn alloy with mixed α and α′ phases. Mater. Sci. Eng. A 2020, 792, 139812. [Google Scholar] [CrossRef]
- Lee, W.; Yeom, J.; Kim, J.; Oh, J.; Lee, T.; Liu, Y.; Li, S.; Nam, T. Precipitation of metastable intermetallic phases and nanoindentation behaviors of a Ti-20Zr-9 Nb-4Sn (at%) alloy during aging treatment. J. Alloys Compd. 2023, 933, 167762. [Google Scholar] [CrossRef]
- Chen, Z.; Xu, L.; Liang, Z.; Cao, S.; Yang, J.; Xiao, S.; Tian, J.; Chen, Y. Effect of solution treatment and aging on microstructure, tensile properties and creep behavior of a hot-rolled β high strength titanium alloy with a composition of Ti-3.5Al-5Mo-6V-3Cr-2Sn-0.5Fe-0.1B-0.1C. Mater. Sci. Eng. A 2021, 823, 141728. [Google Scholar] [CrossRef]
- Sun, S.; Fang, H.; Li, Y.; Chen, R.; Zhu, B.; Guo, J. Formation mechanism of titanium solid solution and its influence on equiaxed behavior of α phase of Ti-5Al-5Mo-5Cr-2Zr-xNb alloys. J. Mater. Res. Technol. 2023, 26, 434–444. [Google Scholar] [CrossRef]
- Matsumoto, H.; Yoneda, H.; Sato, K.; Kurosu, S.; Maire, E.; Fabreg, D.; Konno, T.; Chiba, A. Room-temperature ductility of Ti-6Al-4V alloy with α′ martensite microstructure. Mater. Sci. Eng. A 2011, 528, 1512–1520. [Google Scholar] [CrossRef]
- Zhu, Q.; Yang, X.; Lan, H.; Wang, D.; Lou, H.; Li, J. Effect of solution treatments on microstructure and mechanical properties of Ti-6Al-4V alloy hot rolled sheet. J. Mater. Res. Technol. 2023, 23, 5760–5771. [Google Scholar] [CrossRef]
- Chen, J.; Wang, L.; Fan, Q. Effect of aging temperature on microstructure and mechanical properties of a novel Ti-6121 alloy. J. Alloys Compd. 2023, 947, 169612. [Google Scholar] [CrossRef]
- Mandal, P.K.; Daniel, B.; Mathews, M.S.; Joseph, A.; Siby, C.; Devasia, J. Martensitic transformation in a α+β–Ti alloy after cryogenic treatment and its influencing to low elastic modulus biomaterials. Mater. Today Proc. 2021, 46, 2820–2826. [Google Scholar] [CrossRef]
- Shi, X.; Zeng, W.; Long, Y.; Zhu, Y. Microstructure evolution and mechanical properties of near-α Ti-8Al-1Mo-1V alloy at different solution temperatures and cooling rates. J. Alloys Compd. 2017, 727, 555–564. [Google Scholar] [CrossRef]
- Ahmed, T.; Rack, H.J. Phase transformations during cooling in α+β titanium alloys. Mater. Sci. Eng. A 1998, 243, 206–211. [Google Scholar] [CrossRef]
- Cao, S.; Zhang, B.; Yang, Y.; Jia, Q.; Li, L.; Xin, S.; Wu, X.; Hu, Q.; LIM, C. On the role of cooling rate and temperature in forming twinned α′ martensite in Ti-6Al-4V. J. J. Alloys Compd. 2020, 813, 152247. [Google Scholar] [CrossRef]
- Tunes, M.A.; Gammer, C.; Pfeifer, T.; Musi, M.; Martin, F.; Clemens, H. On the existence of orthorhombic martensite in a near-α titanium base alloy used for additive manufacturing. J. Alloys Compd. 2022, 897, 163155. [Google Scholar]
- Abdel-Hady, M.; Fuwa, H.; Hinoshita, K.; Kimura, H.; Shinzato, Y.; Morinaga, M. Phase stability change with Zr content in β-type Ti-Nb alloys. Scr. Mater. 2007, 57, 1000–1003. [Google Scholar] [CrossRef]
- Yi, X.; Sheng, L.; Fu, G.; Sun, B.; Huang, B.; Sun, K.; Meng, X.; Gao, Z.; Zhang, S.; Wang, H. Microstructural design for achieving high performances in Ti-V-Al lightweight shape memory alloys by optimizing Zr content. Mater. Charact. 2023, 205, 113283. [Google Scholar] [CrossRef]
- Nu, H.T.M.; Le, T.T.; Minh, L.P.; Loc, N.H. A Study on Rotary Friction Welding of Titanium Alloy (Ti-6Al-4V). Adv. Mater. Sci. Eng. 2019, 2019, 4728213. [Google Scholar]
- Liang, Z.; Sun, Z.; Zhang, W.; Wu, S.; Chang, H. The effect of heat treatment on microstructure evolution and tensile properties of selective laser melted Ti-6Al-4V alloy. J. Alloys Compd. 2019, 782, 1041–1048. [Google Scholar] [CrossRef]
- Xu, W.; Brandt, M.; Sun, S.; Elambasseril, J. Additive manufacturing of strong and ductile Ti-6Al-4V by selective laser melting via in situ martensite decomposition. Acta Mater. 2015, 85, 74–84. [Google Scholar] [CrossRef]
- Rout, M.; Ranjan, R.; Pal, S.K.; Singh, S. EBSD study of microstructure evolution during axisymmetric hot compression of 304LN stainless steel. Mater. Sci. Eng. A 2018, 711, 378–388. [Google Scholar] [CrossRef]
- Omale, J.; Ohaeri, E.G.; Tiamiyu, A.A.; Eskandari, M.; Mostafijur, K.M.; Szpunar, J.A. Microstructure, texture evolution and mechanical properties of X70 pipeline steel after different thermomechanical treatments. Mater. Sci. Eng. A-Struct. Mater. Prop. Microstruct. Process. 2017, 703, 477–485. [Google Scholar] [CrossRef]
- Luo, Q.; Guo, Y.; Liu, B.; Feng, Y.; Zhang, J.; Li, Q.; Chou, K. Thermodynamics and kinetics of phase transformation in rare earth-magnesium alloys: A critical review. J. Mater. Sci. Technol. 2020, 44, 171–190. [Google Scholar] [CrossRef]
- Huang, S.; Zhang, J.; Ma, Y.; Zhang, S.; Youssef, S.; Qi, M.; Wang, H.; Qiu, J.; Xu, D.; Lei, J.; et al. Influence of thermal treatment on element partitioning in α+β titanium alloy. J. Alloys Compd. 2019, 791, 575–585. [Google Scholar] [CrossRef]
- Wang, S.; Liang, Y.; Sun, H.; Feng, X.; Huang, C. Thermomechanical treatment-induced microstructure refinement to optimize mechanical properties of TC21 titanium alloys. Mater. Sci. Eng. A 2021, 812, 141095. [Google Scholar] [CrossRef]
- Wang, B.B.; Xie, G.M.; Wu, L.H.; Xue, P. Grain size effect on tensile deformation behaviors of pure aluminum. Mater. Sci. Eng. A 2021, 820, 141504. [Google Scholar] [CrossRef]
- Kaushik, H.C.; Korayem, M.H.; Shaha, S.K.; Kacher, J.; Hadadzadeh, A. Achieving strength-ductility synergy in a laser-powder bed fused near-α titanium alloy through well-crafted heat treatments. J. Alloys Compd. 2023, 968, 171913. [Google Scholar] [CrossRef]
- Li, S.; Zhang, L.; Zhang, Y.; Yang, Q. Coherent ω phase induced yield strength improvement in Ti-19Nb-1.5Mo-4Zr-8Sn alloy. Results Phys. 2020, 19, 103366. [Google Scholar] [CrossRef]
- Tan, C.; Sun, Q.; Xiao, L.; Zhao, Y. Slip transmission behavior across α/β interface and strength prediction with a modified rule of mixtures in TC21 titanium alloy. J. Alloys Compd. 2017, 724, 112–120. [Google Scholar] [CrossRef]
- Angelier, C.; Bein, S.; Béchet, J. Building a continuous cooling transformation diagram of β-CEZ alloy by metallography and electrical resistivity measurements. Metall. Mater. Trans. A 1997, 28, 2467–2475. [Google Scholar] [CrossRef]
- Mantri, S.A.; Choudhuri, D.; Alam, T.; Viswanathan, G.B. Tuning the scale of α precipitates in β-titanium alloys for achieving high strength. Scr. Mater. 2018, 154, 139–144. [Google Scholar] [CrossRef]
- Yue, K.; Liu, J.; Zhu, S.; Wang, L.; Wang, Q.; Yang, R. Origins of different tensile behaviors induced by cooling rate in a near alpha titanium alloy Ti65. Materialia 2018, 1, 128–138. [Google Scholar] [CrossRef]
- Harr, M.E.; Daly, S.; Pilchak, A.L. The effect of temperature on slip in microtextured Ti-6Al-2Sn-4Zr-2Mo under dwell fatigue. Int. J. Fatigue 2021, 147, 106–173. [Google Scholar] [CrossRef]
- Wang, K.; Yan, Z.; Zhou, Y.; Wei, S.; Wang, X.; Xin, R.; Liu, Q. Slip initiation in interlayered β and corresponding slip transfer during compression of a lamellar-structure titanium alloy. Results Phys. 2020, 18, 103276. [Google Scholar] [CrossRef]
Figure 1.
Initial microstructure of Ti80 alloy: (a) low magnification initial microstructure of Ti80 alloy; (b) high magnification initial microstructure of Ti80 alloy.
Figure 1.
Initial microstructure of Ti80 alloy: (a) low magnification initial microstructure of Ti80 alloy; (b) high magnification initial microstructure of Ti80 alloy.

Figure 2.
(a–c) Schematic diagram of heat treatment process: (a) ST; (b) STA-1; (c) STA-2. (d) Diagram of the tensile specimen.
Figure 2.
(a–c) Schematic diagram of heat treatment process: (a) ST; (b) STA-1; (c) STA-2. (d) Diagram of the tensile specimen.
Figure 3.
Tensile properties of Ti80 alloy subjected to three heat treatments: (a) engineering stress–strain curve; (b) ultimate tensile strength; (c) yield tensile strength; (d) elongation.
Figure 3.
Tensile properties of Ti80 alloy subjected to three heat treatments: (a) engineering stress–strain curve; (b) ultimate tensile strength; (c) yield tensile strength; (d) elongation.
Figure 4.
Fracture micrographs of different tensile test samples. (a,a1) ST, (b,b1) STA-1, and (c,c1) STA-2.
Figure 4.
Fracture micrographs of different tensile test samples. (a,a1) ST, (b,b1) STA-1, and (c,c1) STA-2.
Figure 5.
SEM and TEM microstructure and selected area electron diffraction pattern of the samples after heat treatment. (a–c) Low magnification SEM image; (a1–c1) High magnification SEM image; (a2–c2) TEM image corresponding to the red square in (a1–c1) and SAED pattern corresponding to the red circle; (a3–c3) High magnification TEM image.

Figure 6.
HAADF-STEM images and corresponding element EDS mapping results for (a) ST; (b) STA-1; (c) STA-2.
Figure 6.
HAADF-STEM images and corresponding element EDS mapping results for (a) ST; (b) STA-1; (c) STA-2.
Figure 7.
(a–a5) HAADF-STEM images of STA-1 sample and the corresponding elemental EDS mapping results; (b,b1) HRTEM image corresponds to the red dotted rectangle in (a).
Figure 7.
(a–a5) HAADF-STEM images of STA-1 sample and the corresponding elemental EDS mapping results; (b,b1) HRTEM image corresponds to the red dotted rectangle in (a).
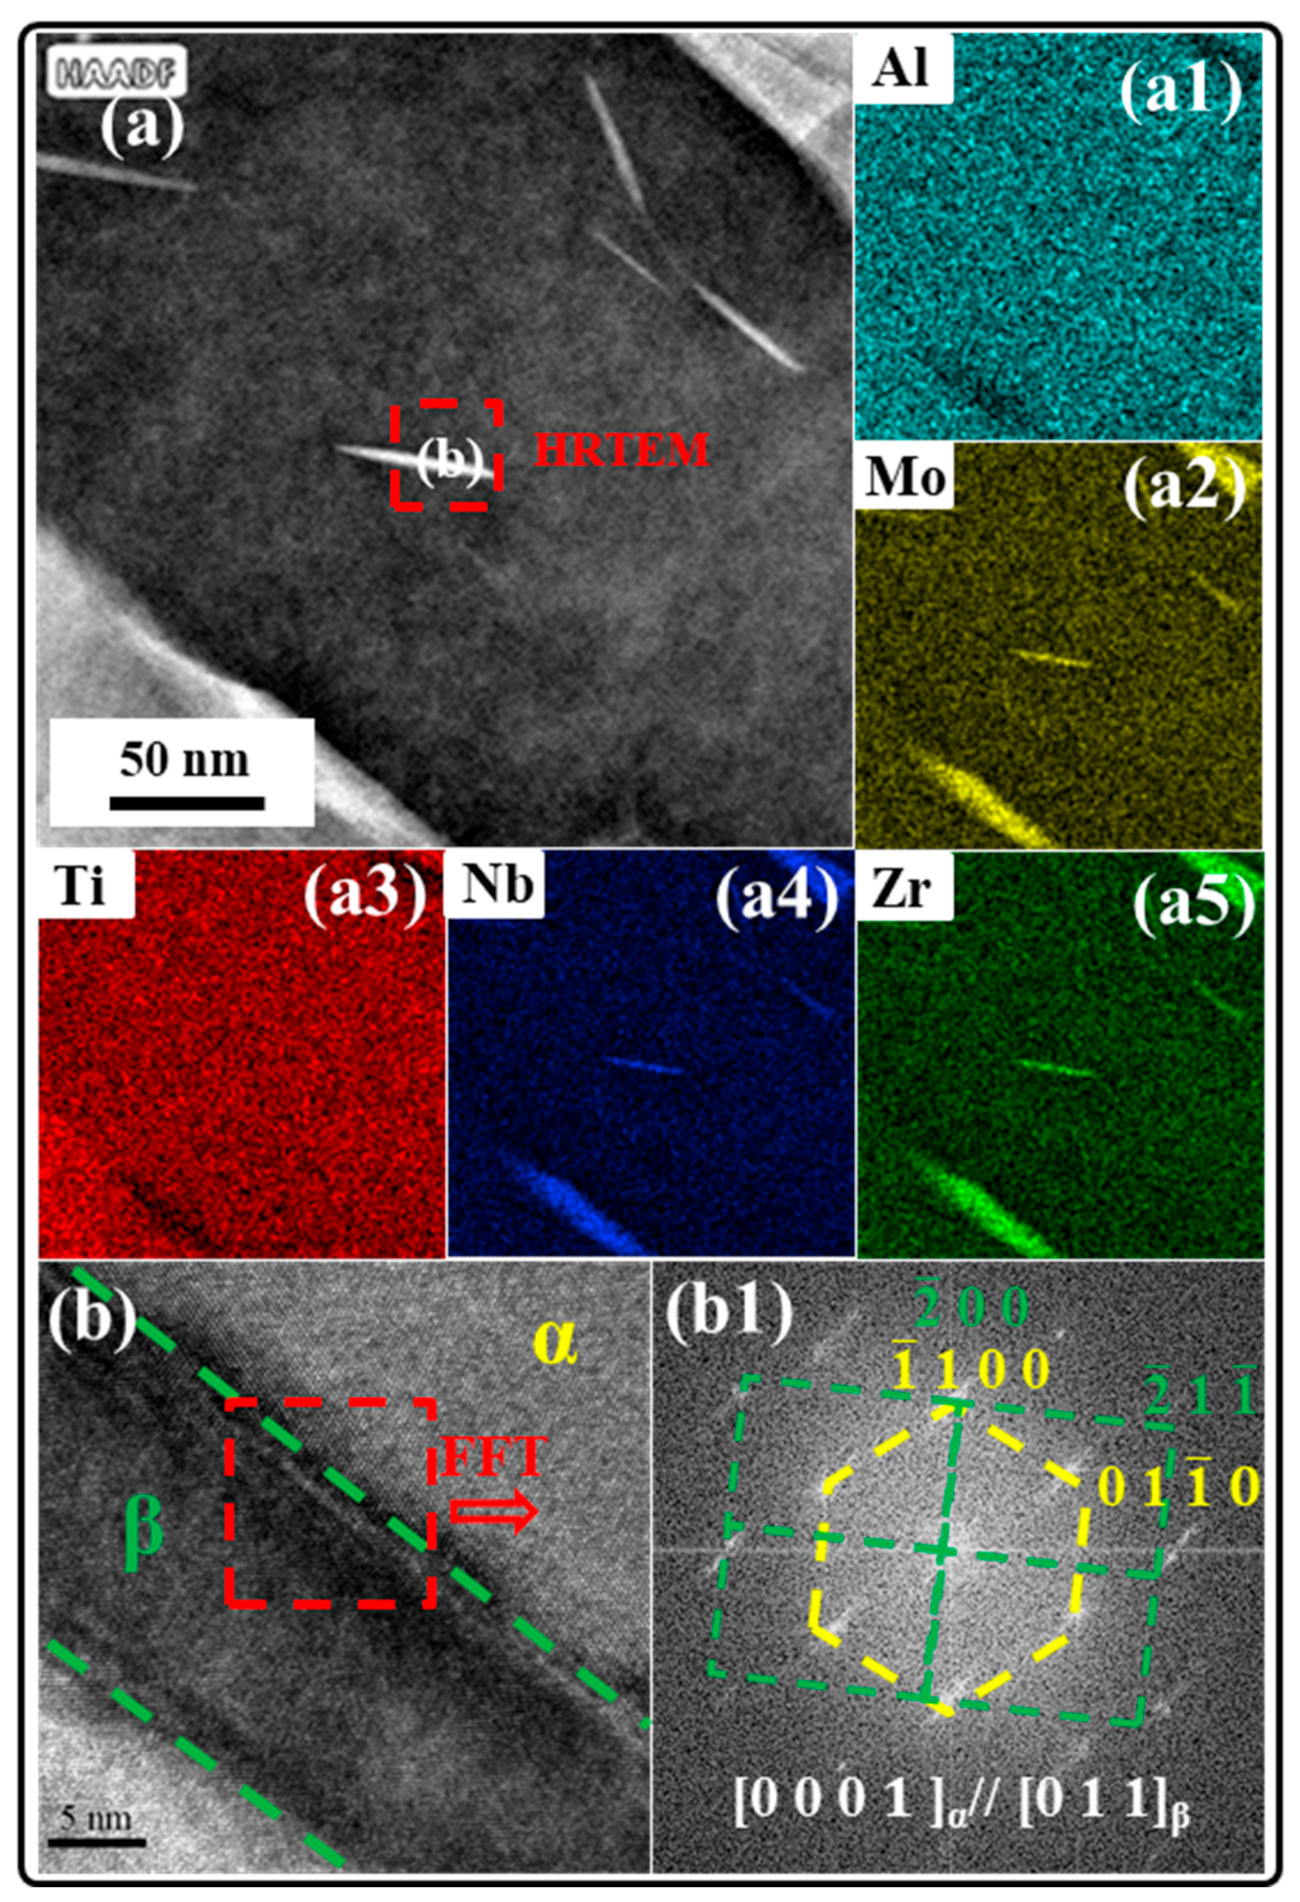
Figure 8.
EBSD maps of the alloy after heat treatment. (a–c) IQ mappings; (a1–c1) IPF mappings; (a2–c2) KAM mappings.
Figure 8.
EBSD maps of the alloy after heat treatment. (a–c) IQ mappings; (a1–c1) IPF mappings; (a2–c2) KAM mappings.
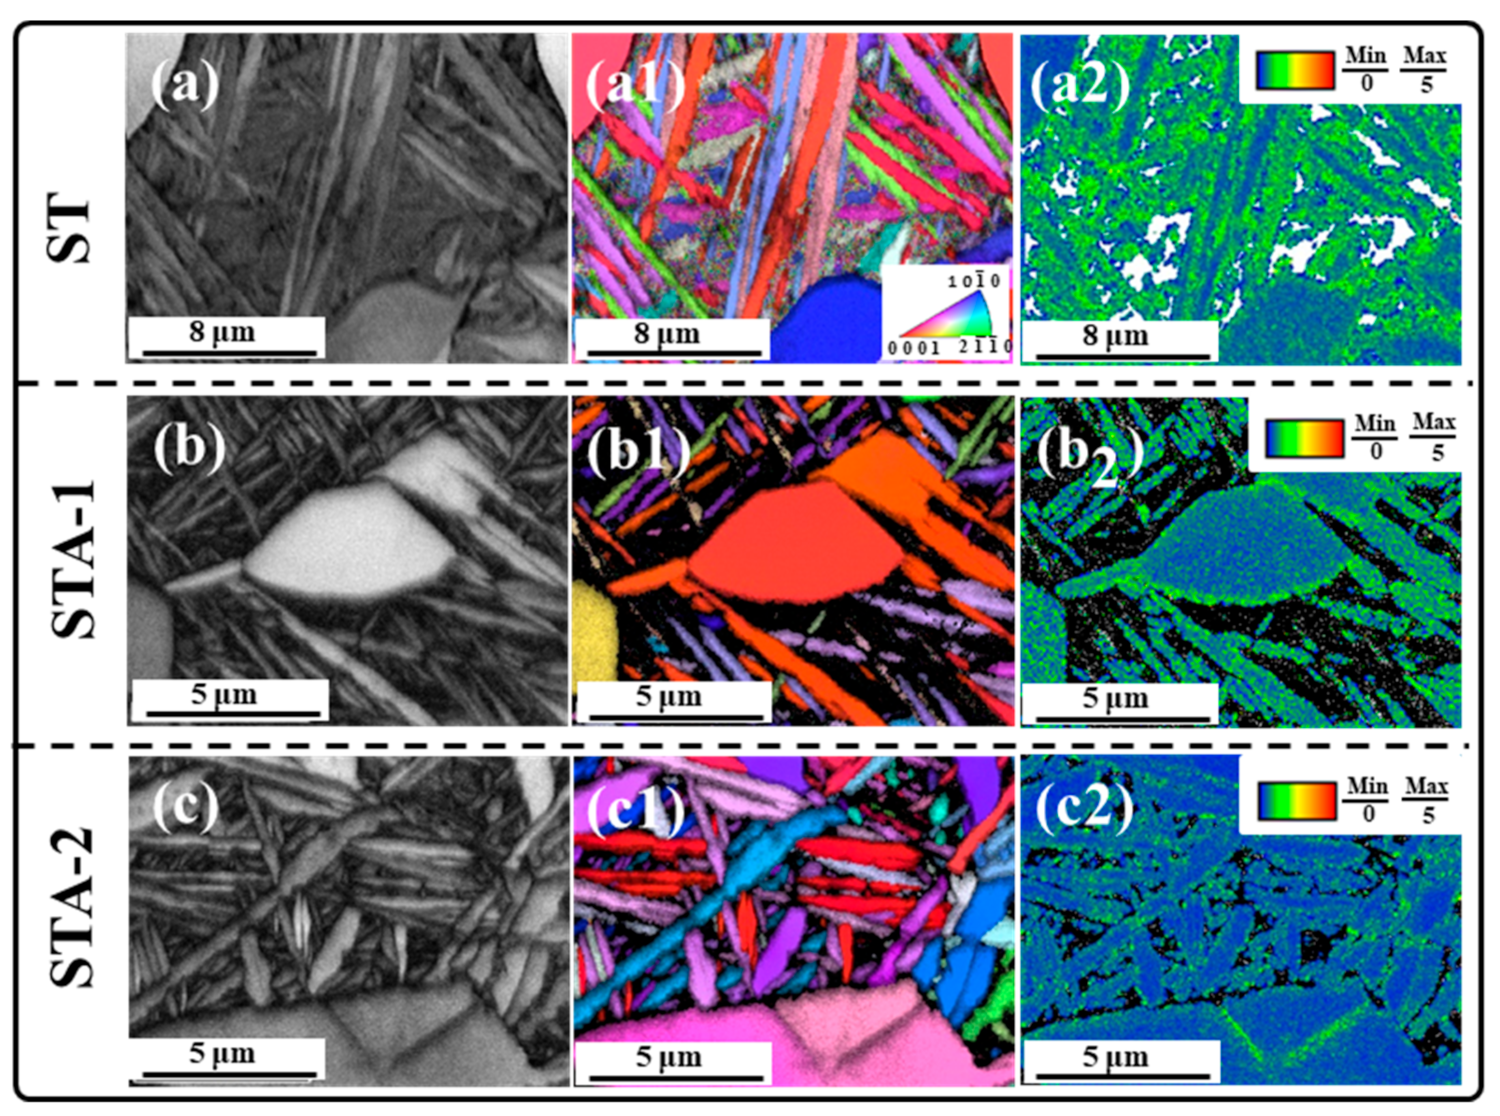
Figure 9.
Schematic diagram of the microstructure evolution of Ti80 alloy during solution treatment and aging.
Figure 9.
Schematic diagram of the microstructure evolution of Ti80 alloy during solution treatment and aging.
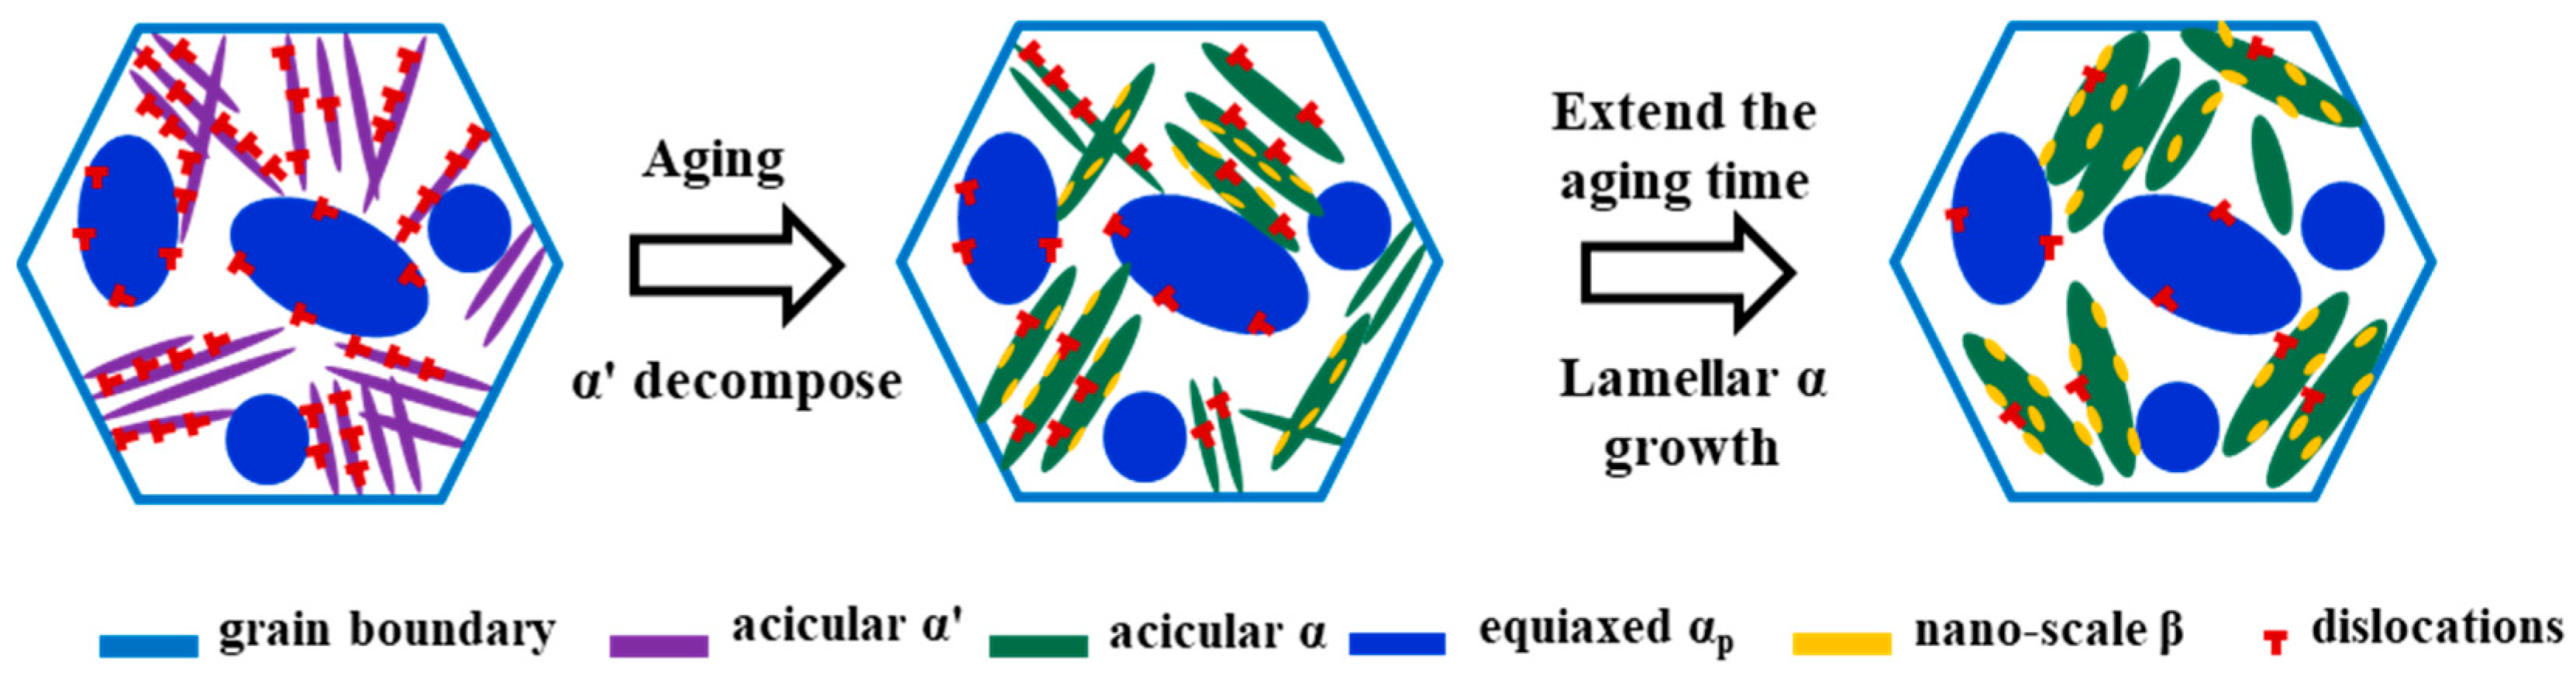
Figure 10.
TEM images of heat-treated Ti80 alloy after tensile test near fracture. (a–c) Low magnification BF image; (a1–c1) High magnification BF image; (a2–c2) SAED pattern corresponding to the red circle in (a,b1,c1).
Figure 10.
TEM images of heat-treated Ti80 alloy after tensile test near fracture. (a–c) Low magnification BF image; (a1–c1) High magnification BF image; (a2–c2) SAED pattern corresponding to the red circle in (a,b1,c1).
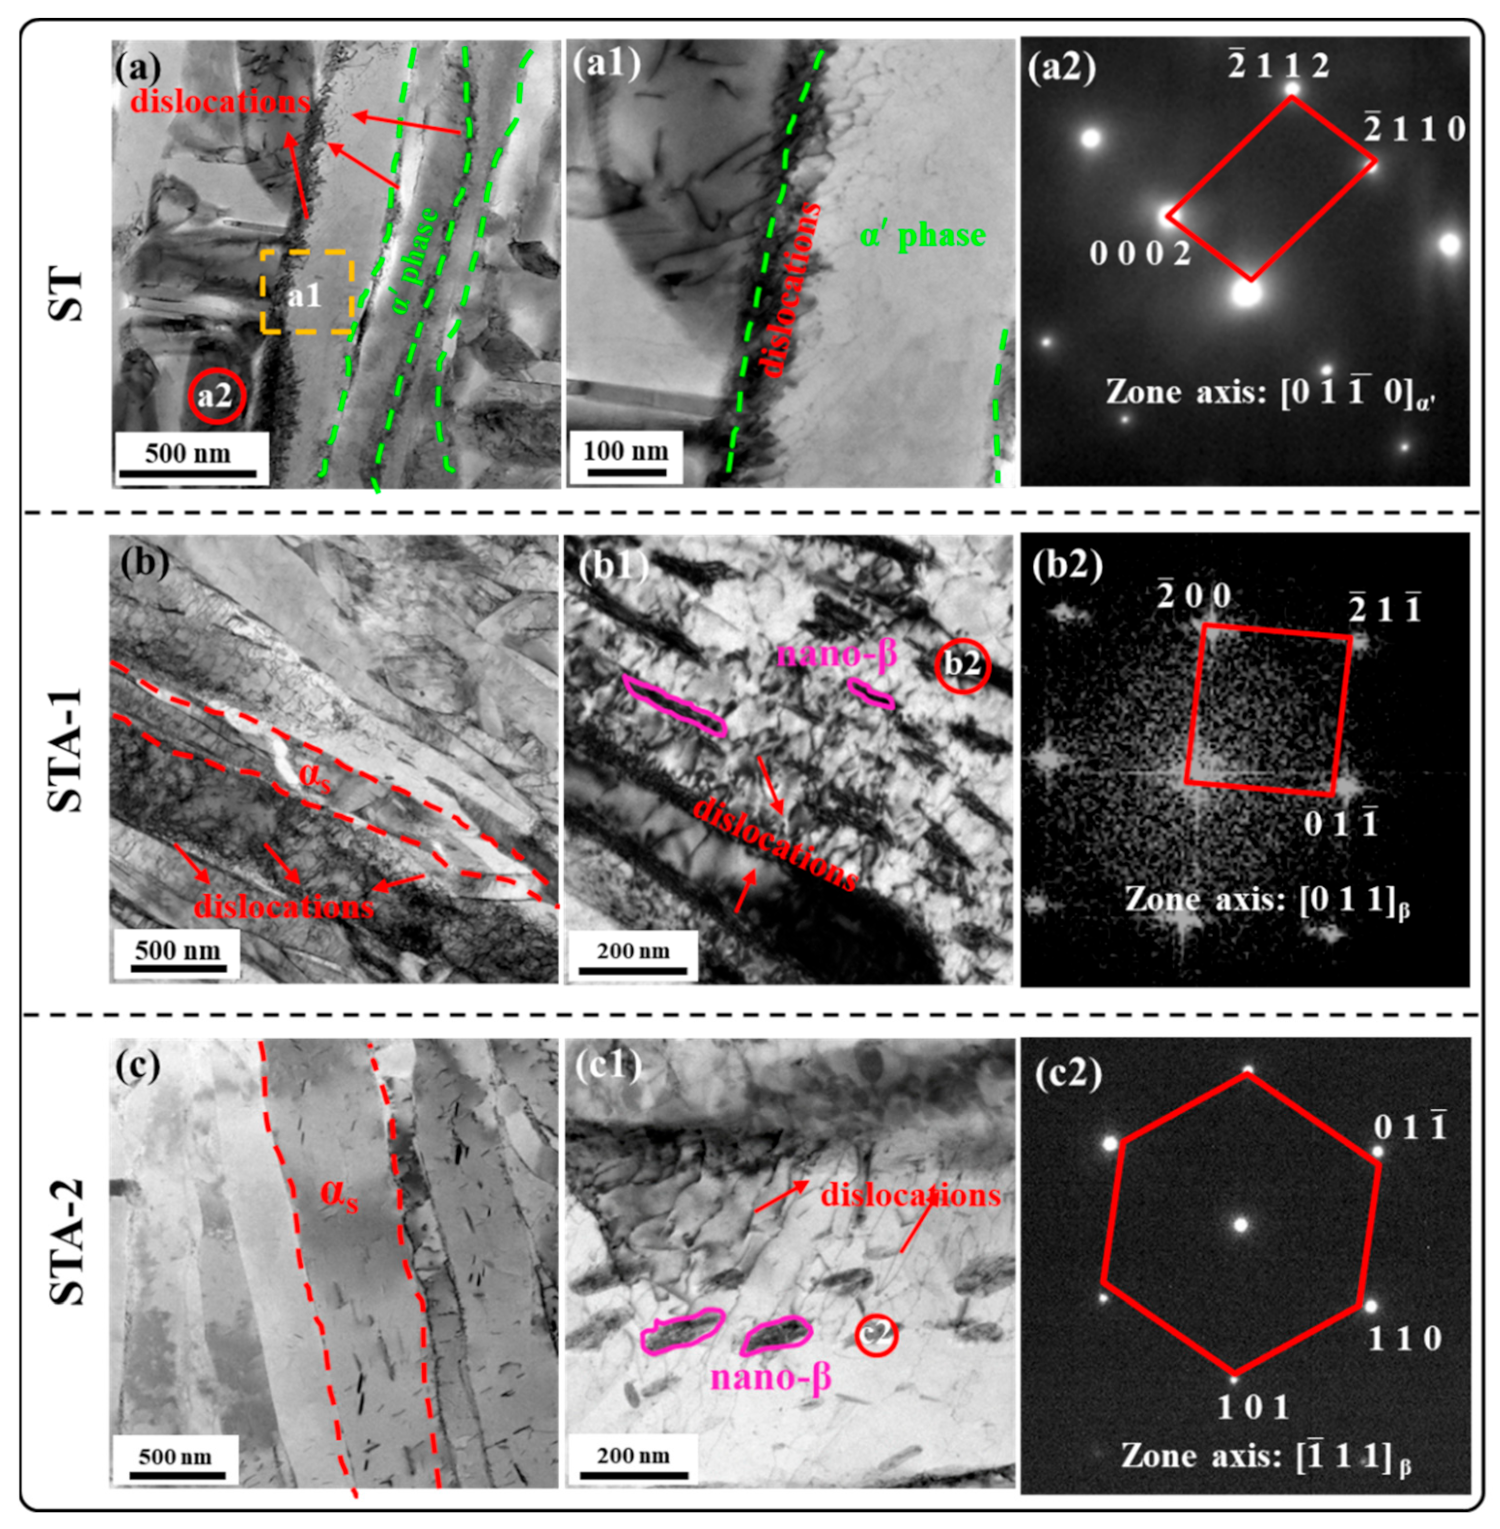
Figure 11.
SEM images of different heat-treated samples of Ti80 alloy at a strain of 3%, where red arrows represent slip traces in βt and yellow arrows in αp. (a) ST; (b) STA-1; (c) STA-2.
Figure 11.
SEM images of different heat-treated samples of Ti80 alloy at a strain of 3%, where red arrows represent slip traces in βt and yellow arrows in αp. (a) ST; (b) STA-1; (c) STA-2.


Table 1.
Chemical composition of Ti-6Al-3Nb-2Zr-1Mo alloy (wt.%).
| Element | Al | Nb | Zr | Mo | Si | Fe | O | C | N | H | Ti |
|---|---|---|---|---|---|---|---|---|---|---|---|
| Wt.% | 6.30 | 3.04 | 2.04 | 1.07 | <0.03 | 0.1 | 0.039 | 0.0085 | 0.0040 | <0.001 | Bal. |
Table 2.
Volume fraction of the αp phase and the widths of the αp phases for the samples.
| Heat Treatment Samples | Fraction of αp Phase/% | Width of αp Phase/μm |
|---|---|---|
| ST | 31.1 ± 3.7 | 8.0 ± 0.3 |
| STA-1 | 33.5 ± 1.2 | 7.9 ± 0.4 |
| STA-2 | 32.0 ± 3.0 | 8.1 ± 0.3 |
Table 3.
Vickers hardness for the samples under different heat treatment processes.
| Sample | Vickers-Hardness/HV |
|---|---|
| ST | 331 ± 4 |
| STA-1 | 354 ± 7 |
| STA-2 | 301 ± 5 |
Disclaimer/Publisher’s Note: The statements, opinions and data contained in all publications are solely those of the individual author(s) and contributor(s) and not of MDPI and/or the editor(s). MDPI and/or the editor(s) disclaim responsibility for any injury to people or property resulting from any ideas, methods, instructions or products referred to in the content. |
© 2024 by the authors. Licensee MDPI, Basel, Switzerland. This article is an open access article distributed under the terms and conditions of the Creative Commons Attribution (CC BY) license (https://creativecommons.org/licenses/by/4.0/).
Share and Cite
MDPI and ACS Style
Xiao, C.; Hu, B.; Ge, J.; Kong, B.; Luo, D.; Zhang, X.; Zhou, K. Revealing the Effect of α’ Decomposition on Microstructure Evolution and Mechanical Properties in Ti80 Alloy. Materials 2024, 17, 2238. https://doi.org/10.3390/ma17102238
AMA Style
Xiao C, Hu B, Ge J, Kong B, Luo D, Zhang X, Zhou K. Revealing the Effect of α’ Decomposition on Microstructure Evolution and Mechanical Properties in Ti80 Alloy. Materials. 2024; 17(10):2238. https://doi.org/10.3390/ma17102238
Chicago/Turabian StyleXiao, Chunhong, Bin Hu, Jinyang Ge, Bin Kong, Deng Luo, Xiaoyong Zhang, and Kechao Zhou. 2024. "Revealing the Effect of α’ Decomposition on Microstructure Evolution and Mechanical Properties in Ti80 Alloy" Materials 17, no. 10: 2238. https://doi.org/10.3390/ma17102238
Note that from the first issue of 2016, this journal uses article numbers instead of page numbers. See further details here.