
Investigation of the Cementing Efficiency of Fly Ash Activated by Microsilica in Low-Cement Concrete

1
Institute of Civil Engineering and Architecture, National University of Water and Environmental Engineering, 33028 Rivne, Ukraine
2
Ukrainian Research and Design Institute of Building Materials and Products, 04080 Kyiv, Ukraine
3
Department of Civil Engineering, Ariel University, Ariel 40700, Israel
*
Author to whom correspondence should be addressed.
Materials 2023, 16(21), 6859; https://doi.org/10.3390/ma16216859
Submission received: 11 September 2023
/
Revised: 15 October 2023
/
Accepted: 24 October 2023
/
Published: 25 October 2023
(This article belongs to the Special Issue Recycling and Development of New Building Materials or Products (Second Volume))
Abstract
:This paper presents experimental results on the influence of concrete composition factors on the criterion characterizing the ratio between the compressive strength of activated low-cement concrete and clinker consumption. The investigation was carried out using mathematical planning of the experiments. Experimental and statistical models describing the influence of the fly ash, activating additive (microsilica), consumption of cement and aggregates, as well as the superplasticizer on the strength of low-cement concrete under normal hardening conditions and after steaming were obtained. The values of the clinker efficiency criterion and the mineral additive cementing efficiency coefficient were calculated, and models of these parameters were obtained for the investigated concrete compositions. It was shown that the activating effect of microsilica yields an increase in ash cementing efficiency and clinker efficiency criterion in concrete. Using the obtained models, an example for calculating the ash cementing efficiency coefficient is given.
1. Introduction
An important indicator of cement concrete’s economic and environmental efficiency is the ratio between the strength it achieves (fcm), the specific consumption of Portland cement (C), and accordingly, the clinker component included in it. Both the costs of the main material, the energy resources, and the environmental impact of cement production are associated with the clinker. Increasing the value of criterion L = fcm/C is especially important for low-cement concrete, the technology for which is attracting more and more attention of researchers and manufacturers [1,2,3]. According to the available data [1], the average value of this criterion for normal strength concrete is 0.1 MPa/(kg/m3). For high-strength concrete, it can reach 0.2 or more.
The main way to increase the criterion L in modern concrete technology is by using active mineral additives in combination with superplasticizers [4,5]. The main qualitative indicator of mineral additives is their pozzolanic activity due to the increased reactivity of their constituent silicate and aluminosilicate compounds. The pozzolanic activity of additives varies over a wide range, from 50–100 mg of CaO/g for fly ash to 350–400 and more for highly active materials as microsilica and metakaolin [6,7]. Due to the pozzolanic activity, mineral additives increase the content of hydrated compounds in the cement paste, which has a positive effect on its strength. At the same time, it is important to prevent the possible negative effect of increasing the concrete mixture’s water demand, which is especially characteristic when using highly active and at the same time highly dispersed mineral additives, such as microsilica and metakaolin. This problem is solved by adding to concrete mixtures modern plasticizing additives—superplasticizers.
As active mineral additives in concrete, a large group of dispersed and mainly industrial byproducts is used [8]. Of these, fly ash has found the widest application. Having a high specific surface, comparable to Portland cement, fly ash practically does not increase the water demand of concrete. Fly ash can even slightly reduce the water demand, as it has a certain plasticizing effect due to the vitrified surface of the particles. Adding fly ash limits concrete mixture bleeding and helps retain its workability, increases corrosion resistance, reduces shrinkage deformations, and improves a number of other concrete properties [9,10,11,12]. It is possible to obtain ash–cement concrete with minimum cement and ash consumptions of 150 kg/m3 and up to 200 kg/m3, respectively. Table 1 shows our data on the value of the strength indicators and criterion L compositions [13] obtained using the ash of the Ladyzhenskaya Thermal Power Plant (Ukraine) for normal weight concrete with a concrete mix slump of 40–50 mm and Portland cement class 32.5. The values were obtained by testing standard 100 mm cube specimens prepared according to [14].
Analysis of the data presented in Table 1 shows that with a cement consumption of 150 kg/m3 in a wide range of ash consumption, the value of criterion L both at normal curing and after steaming remains relatively low. To improve the physical and mechanical properties of low-cement fly ash concrete and the criterion L, well-known activation methods developed mainly for cement should be used [15]. These methods, however, are characterized by high energy consumption and require special equipment. More affordable is adding into ash–cement concrete mixtures activating surfactant additives and ultradispersed powders with high pozzolanic activity. A necessary condition for the effectiveness of surfactants is their ability to chemisorb on the surface of mineral additives. In general, cation-active surfactants are recommended for acid-type mineral additives and anion-active ones for base-type [16].
It is recommended to design compositions of low-cement activated concrete using experimental methods [17]. Of the computational and experimental methods, the method of “modified C/W” can be considered the most promising [18,19,20]. As in ordinary concrete design, this method is based on the dependence of the strength on C/W, but it assumes that in the C/W expression (“modified C/W”), the amount of additive that replaces cement without reducing the concrete strength should be taken into account:
where C is the cement content; D is the consumption of an active mineral additive; W is the water demand; Kc.e is a coefficient considering the mineral additive efficiency.
If necessary, the influence of air introduced into the concrete mixture with additives or porous fillers can be taken into account in the denominator.
The coefficient Kc.e was proposed by A. Smith as the “cementing efficiency” coefficient of mineral additives [10]. It is determined based on experimental data for normal weight concrete as follows:
where C1 is the cement consumption in concrete without additives; C2 is the cement consumption in concrete with additives without a change in the concrete’s strength.
For concretes of equal strength with the same workability, the saving of cement ΔC due to using an active mineral additive (filler) can be found from the equation:
where ΔW = W0 − WD is the change in the concrete mixture water demand when adding additives. W0 and WD are the concrete mixture water content without and with the mineral additives, respectively. At ΔW < 0, the additive effect decreases, and at ΔW > 0, it increases. At , using active mineral additives does not allow achieving an economy of the cement and clinker or even leads to their overconsumption. This condition determines the advantage of the joint introduction of active additives and plasticizers into the concrete mixture.
The value of Kc.e. for an active mineral additive allows finding (C/W)m and designing the concrete composition containing an active mineral additive with a given hardened concrete strength. The value of Kc.e is usually found experimentally and depends on the cement consumption and the additive content. Table 2 presents our experimental data for concrete using fly ash, Portland cements CEM I 32.5 and CEM I 42.5, medium fineness sand and crushed granite stone 5–20 mm, steamed according to the 2 + 3 + 6 + 2 mode at 80 °C [13].
In the present study, statistical models of criterion L for low-cement ash-containing concrete and, based on them, the calculated values of Kc.e for complex mineral additives are presented and analyzed. The novelty of this approach is that the models enable assessment of the main technological factors and evaluation of the effectiveness of adding active components into low-cement concrete containing mineral additives.
2. Materials and Methods
Cement–ash concrete was made using Portland cement CEM I (Zdolbuniv, Ukraine) with compressive strength class 32.5, strength after two days–13 MPa, and strength after 28 days–44.5 MPa. Fly ash from Ladyzhyn TPP (Ukraine) was used as the additive in concrete mixtures. The chemical composition of the Portland cement and ash is given in Table 3.
The ash had a specific surface of 310 m2/kg, and the pozzolanic activity after 7 days was 15 mg/g, after 28 days was 45 mg/g, and after 60 days was 65 mg/g. To increase the activity of the fly ash, a microsilica additive was used. The microsilica contained 93% ultradispersed amorphous SiO2; it was characterized by a specific surface area of 19,000 m2/kg and a pozzolanic activity of 420 mg/g.
To solve the problems in the frame of this study, mathematical experiment planning methods [21] were used. Experiments were performed, and after statistical processing of the experimental data, mathematical models were obtained. These models take into account the influence of the cement–ash binders’ composition and additives on the compressive strength and criterion L. The models make it possible to estimate the influence of each of the factors and their interaction effects on the hardened concrete strength after normal curing, after steaming, and its relation to the cement consumption and to obtain the calculated values of the cementing efficiency coefficient of activated ash in concrete of different strengths, taking into account its composition.
When planning the experiment, the following concrete structure parameters were taken as factors:
—part of the microsilica activator (Vms) in the total volume of the active mineral additive (Vash—volume of fly ash);
—part of the active mineral additive volume in the total volume of the binder (Vc—cement volume);
—part of the binder volume in the binder paste volume (Vw—water volume);
—part of the binder paste volume in the concrete volume (Va—aggregate volume);
—part of the superplasticizer volume in an aqueous solution (Vsp—volume of naphthalene–formaldehyde type superplasticizer).
The conditions for experiment planning and the factor variation range are shown in Table 4.
Transition from the concrete structure parameters to the component’s consumption can be easily carried out using equations assuming that the absolute volume of the concrete mixture is equal to the sum of the volumes of its individual components:
where MS, Ash, C, W, A, and SP are the consumption of the activator (microsilica), ash, Portland cement, water, aggregate, and superplasticizer, respectively, kg/m3; ρ is the components density, kg/m3.
The experiment planning matrix for the Ha5 plan close to D-optimal [21] is given in Table 5. The concrete composition at the experimental points, the compressive strength of concrete specimens (cubes 100 mm in size) at 28 days of normal curing [14,22] and after steaming according to the (2 + 3 + 6 + 2) mode at 80 °C, as well as the calculated values of criterion L and the cementing efficiency coefficient of the mineral additive Kc.e., are given in Table 6.
The concrete compositions for the tested specimens were obtained according to the conditions given in Table 4 and the experiment plan (Table 5). The concrete mix components consumptions are calculated using Equations (4)–(9), according to the values of the factors for each experimental point (Table 5) and are shown in Table 6.
3. Results
Statistical processing of the experimental results allowed us to obtain mathematical models of the concrete strength after 28 days of normal curing, the strength of the concrete subjected to steaming, the corresponding criteria L, and the cementing efficiency coefficients of the mineral admixture. The obtained models were considered adequate with a confidence level of 95%, which is considered satisfactory for concrete technology [21]. The models were obtained in the form of polynomial regression equations:
- −
- Concrete compressive strength after 28 days of normal curing
- −
- Concrete compressive strength after steaming
- −
- Criterion L for concrete compressive strength after 28 days of normal curing
- −
- Criterion L for concrete compressive strength after steaming
- −
- Cementing efficiency coefficient Kc.e for concrete compressive strength after 28 days of normal curing
- −
- Cementing efficiency coefficient Kc.e for concrete compressive strength after steaming
Analysis of the obtained models shows that the concrete strength varied in the range from 4.1 to 33.1 MPa for normal curing and from 0.2 to 29.7 MPa after steaming. The transition of all the studied factors’ values from the lower to the upper level helped to increase the concrete strength. The highest impact on the increasing strength was factor X1 (part of the activator (microsilica) in the volume of mineral additive). A lower effect was caused by factor X2 (part of the mineral additive in the binder) (Figure 1a). Factor X5, which characterizes the superplasticizer content, had a quite noticeable influence (Figure 1b). Factor X4 characterizes the cement paste content in the total volume of concrete. When changing within the specified range, this factor had virtually no effect on the strength characteristics. According to A.M. Neville [23], the ratio between aggregate and cement is a secondary factor for concrete strength, especially for medium and low concrete classes; however, it has been found that constant W/C lean concrete mixtures have higher strength. It is suggested that this trend is due to the water absorption by the aggregate: more aggregate absorbs more water, and the effective water–cement ratio decreases.
There was a significant interaction of factors X1 and X5 in the models (Equations (10) and (11)), which is evident in Figure 1b. This interaction showed an increase in activator effectiveness when the superplasticizer content in concrete increases. An increase in the superplasticizer content neutralizes the negative effect of the activator’s (microsilica) large specific surface area on the concrete mixture’s water demand and, accordingly, causes a positive effect on the strength.
The investigated factors affected the concrete strength after steaming in a similar way (Figure 2). Thus, the mineral additive (fly ash) activation, due to addition of microsilica in presence of superplasticizer caused a twofold increase in the concrete strength at normal curing and 2.5-fold at steaming. When using the activator, the cement–ash binder hydration degree increased significantly (by 20–25%) due to the high pozzolanic activity of the microsilica. The structure-forming role of activated fillers is not limited to their significant effect on the hydration degree [24]. Microsilica increases the surface energy of the ash additive, which is manifested by a change in the autocohesion effect and wetting heat [13]. Microsilica increases the strength of the coagulation structure and improves the crystallization conditions of products during the cement–ash hardening, reduces the water and mortar separation of concrete mixtures, and increases the cement adhesive capacity [1].
Based on the experimentally obtained values of the strength at normal curing and after steaming, the values of L as the efficiency criterion for the use of cement and its main component, clinker, and the cementing efficiency coefficient of the mineral additive were calculated at all points of the experiment. Based on these values, mathematical models of criterion L and the coefficient of cementing efficiency for activated fly ash were obtained. Following the obtained mathematical models of criterion L (Equations (12) and (13)), this criterion varied from 0.03 to 0.26 MPa/kg at normal curing (Figure 3a) and from 0.1 to 0.22 at steaming (Figure 3b).
All the investigated factors had a positive effect on criterion L, similar to the effect on the concrete strength. Accordingly, the maximum value of the criterion was observed at the maximum content of the activator (microsilica), fly ash, and superplasticizer.
Table 7 shows the values of the strength and criterion L calculated by the models (Equations (10) and (11)) for the typical experimental compositions of concrete mixtures. As shown in the table, adding the optimal amount of microsilica allows increasing the clinker efficiency by 1.2–2 times.
Analysis of the mathematical models of the active mineral additive cementing efficiency coefficient shows that this indicator depends on the conditions of concrete hardening and varies from −0.36 to 0.61 for concrete after normal curing and from −0.45 to 0.5 for concrete after steaming. An increase in the fly ash cementing efficiency is observed when the content of activator and superplasticizer in the concrete mixture increases. The cementing efficiency coefficient decreases with the cement content increase in concrete. With a high cement content, the addition of activated ash becomes ineffective, and Kc.e acquires negative values (Figure 4). Reducing the cement content, as well as increasing the effective action of the mineral additive due to its activation and the superplasticizer introduction, contributes to an increase in the values of Kc.e and transfers it from the area of negative values to positive ones.
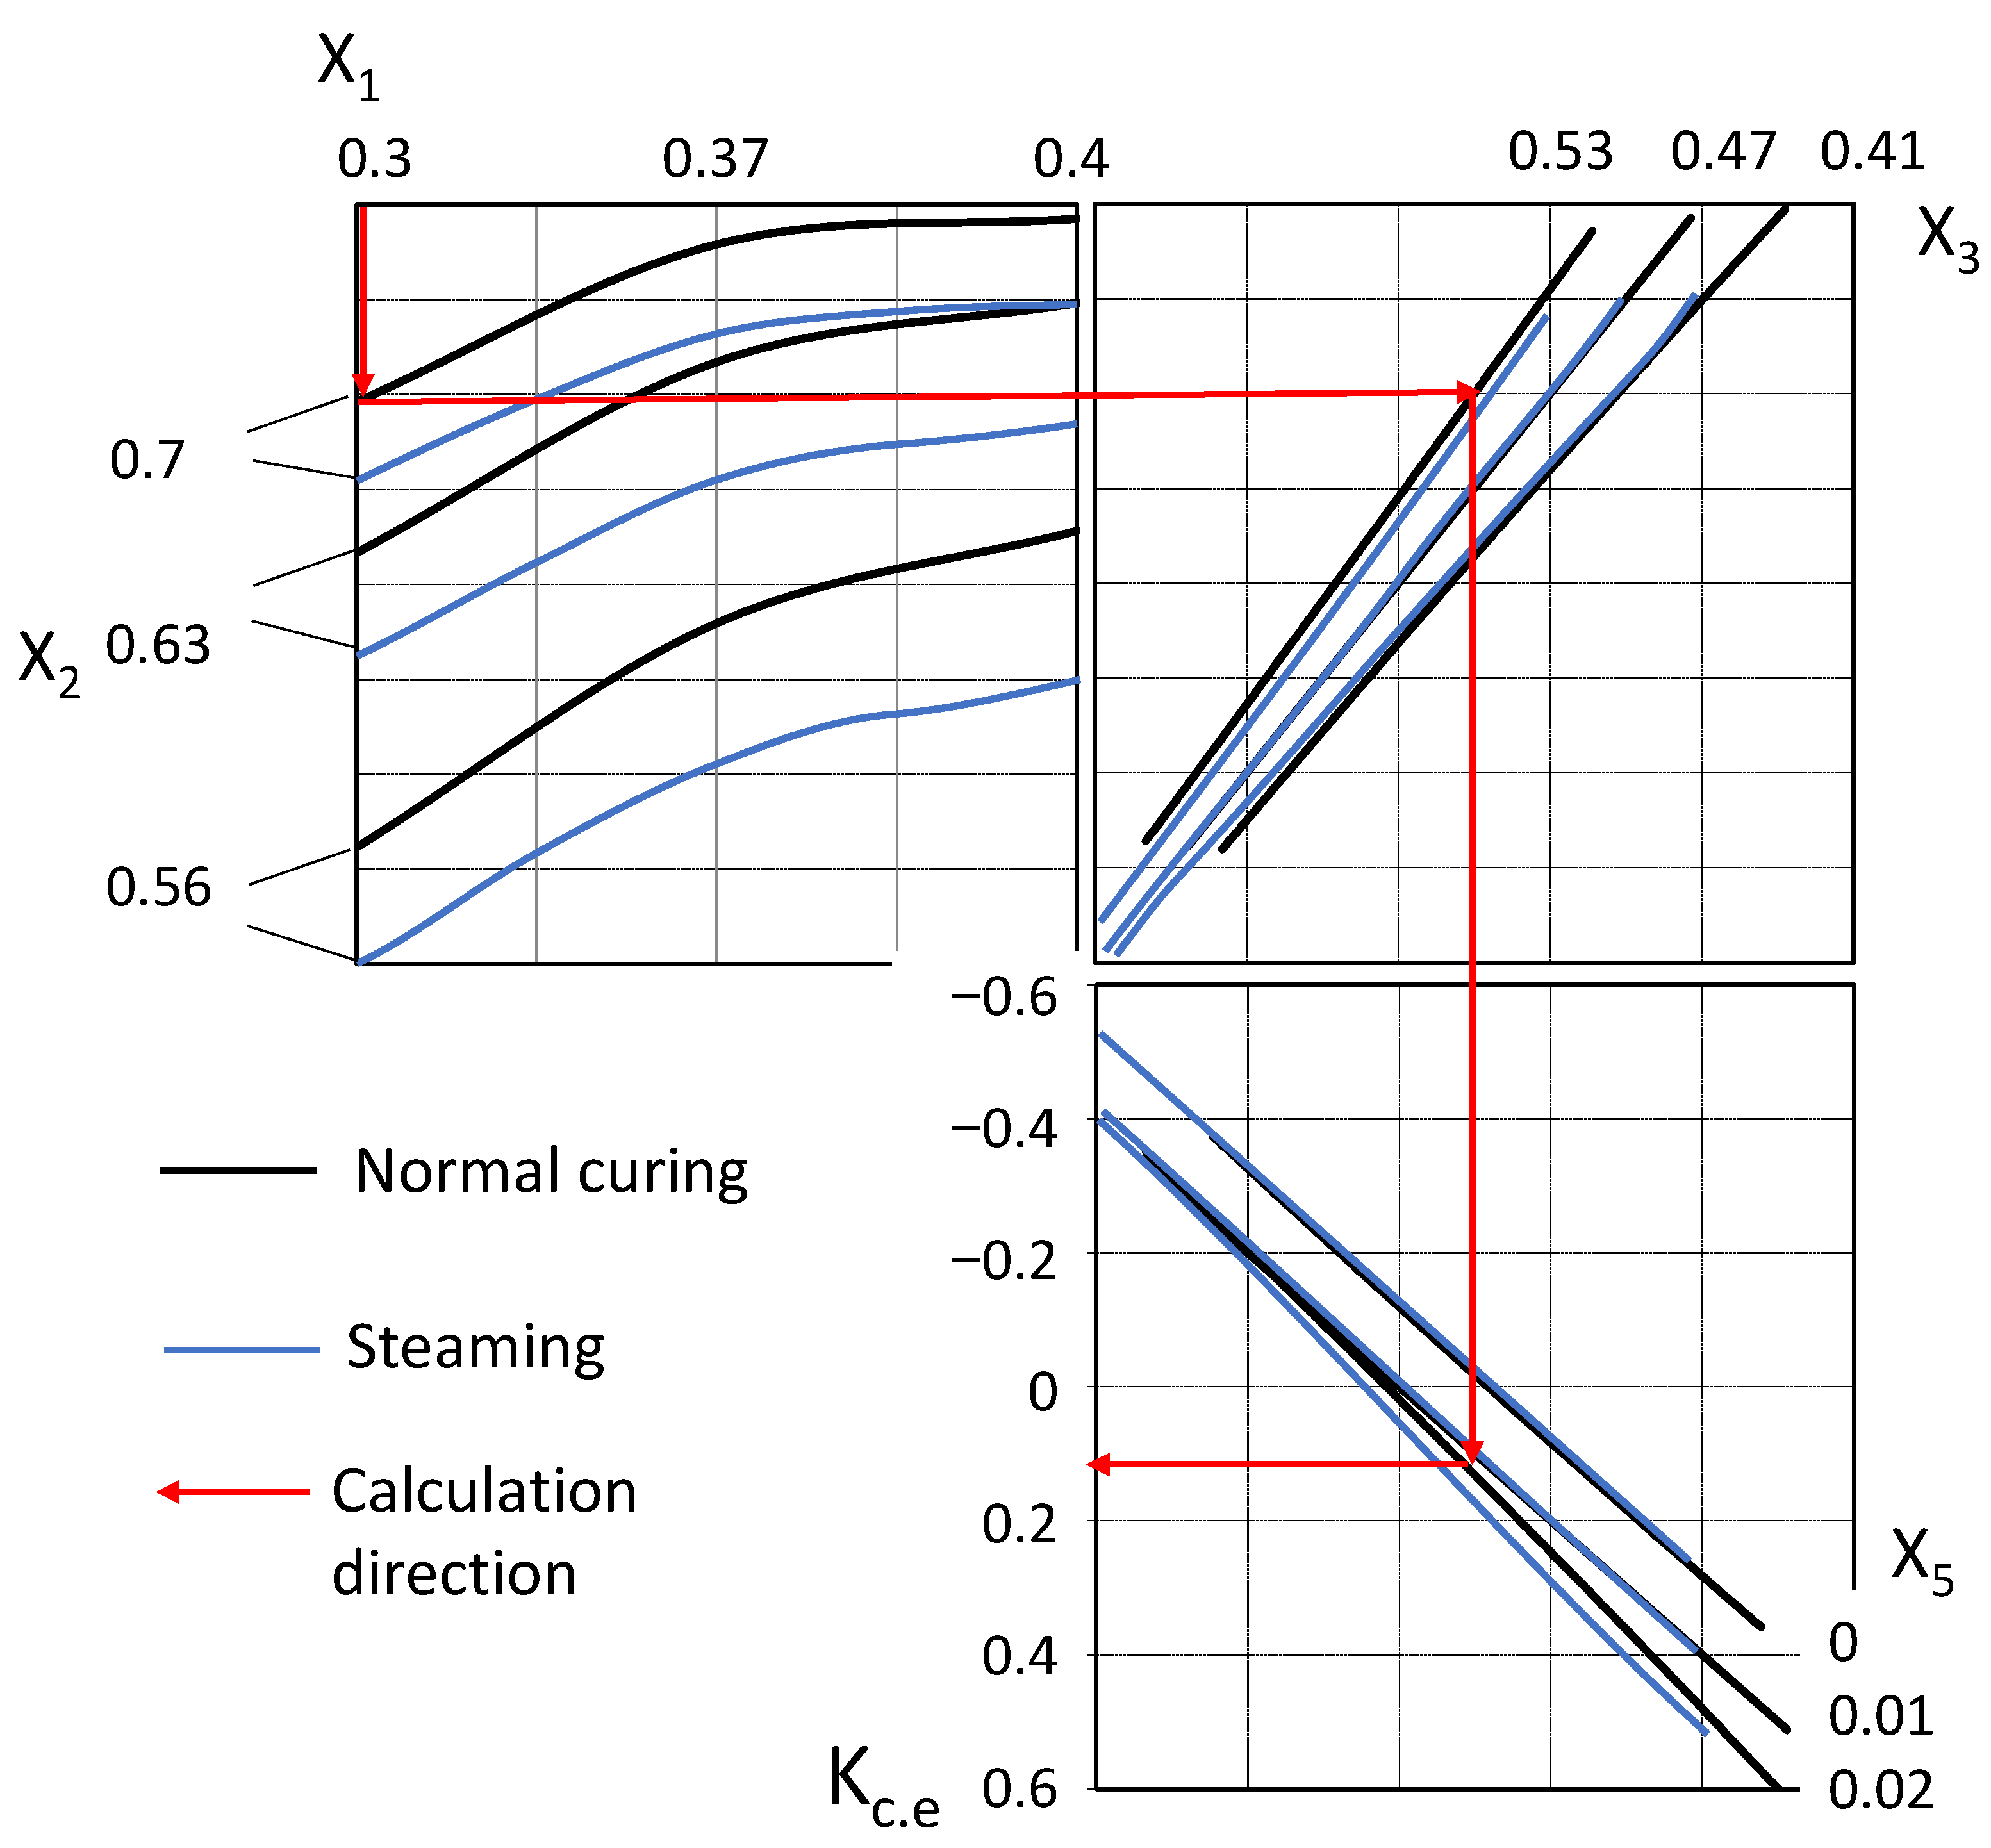
For a known consumption of the active mineral additive, cement, and superplasticizer, it is possible to find the cementing efficiency coefficient for the mineral additive using the obtained experimental and statistical models (14–15). For a more convenient graphical solution of the mathematical models (Equations (14) and (15)), a Kc.e nomogram was obtained (Figure 5). According to this nomogram, for the known concrete composition indicators, it is possible to find the value of the active mineral additive cementing efficiency coefficient and use it to calculate the concrete composition with given properties.
Example. Calculate the cementing efficiency coefficient of fly ash when used as an activator of microsilica, if the concrete with activated fly ash has after 28 days of hardening a compressive strength of 21 MPa. Concrete composition of (per 1 m3): cement (C)—123 kg; water (W)—118 L; ash—135 kg; microsilica (MS)—70 kg; sand (S)—648 kg; crushed stone (CS)—1377 kg; superplasticizer (SP)—2.6 kg. Density of concrete components: cement—ρc = 3100 kg/m3, ash—ρAsh = 2600 kg/m3; microsilica—ρms = 2500 kg/m3, superplasticizer—1100 kg/m3, water—1000 kg/m3.
Solution.
- The part of the activator (microsilica) in the volume of the active mineral additive (X1) is:
- 2.
- The part of the active mineral additive in the binder volume (X2) is:
- 3.
- The part of the binder in the binding paste volume (X3) is:
- 4.
- The part of the superplasticizer in the aqueous solution (X5) is:
- 5.
- From Equation (14) or according to the nomogram (Figure 5), the value of Kc.e is:
- Kc.e = 0.11.
4. Conclusions
A set of experimental–statistical dependences of strength, criterion L, and cementing efficiency coefficient at normal hardening and steaming was obtained for cement–ash concrete with microsilica additive and a naphthalene–formaldehyde-type superplasticizer using the mathematical experiment planning method.
The analysis of the obtained models made it possible to establish the range of changes of the studied parameters and their influence on the concrete composition factors. It has been found that activation by mineral additive (fly ash), due to the addition of microsilica in presence of a superplasticizer yields a twofold increase in the concrete strength at normal hardening, and after steaming the strength increases about 2.5 times.
The compositions of cement–ash concrete with a cement consumption of 100–140 kg/m3 exhibited the maximum efficiency criterion L; these compositions contained the maximum microsilica and superplasticizer values.
To find the fly ash cementing efficiency coefficient values, a corresponding nomogram was created. It allowed taking into account the influence of the cement, ash, activating mineral, and superplasticizer consumption and the concrete hardening conditions.
The obtained cementing efficiency coefficient can be used to calculate compositions of concrete containing fly ash.
Author Contributions
Conceptualization, L.D. and V.Z.; methodology, L.D. and V.Z.; software, S.L.; validation, V.Z. and S.L.; formal analysis, V.Z.; investigation, V.Z.; resources, Y.R.; data curation, V.Z.; writing—original draft preparation, L.D., V.Z. and Y.R.; writing—review and editing, L.D., V.Z. and Y.R.; visualization, S.L.; supervision, L.D.; project administration, S.L.; funding acquisition, L.D. and Y.R. All authors have read and agreed to the published version of the manuscript.
Funding
This research received no external funding.
Institutional Review Board Statement
Not applicable.
Informed Consent Statement
Not applicable.
Data Availability Statement
Not applicable.
Conflicts of Interest
The authors declare no conflict of interest.
References
- Campos, H.F.; Klein, N.S.; Marques Filho, J.; Bianchini, M. Low-cement high-strength concrete with partial replacement of Portland cement with stone powder and silica fume designed by particle packing optimization. J. Clean. Prod. 2020, 261, 121228. [Google Scholar] [CrossRef]
- Damineli, B.L.; Kemeid, F.M.; Aguiar, P.S.; John, V.M. Measuring the eco-efficiency of cement use. Cem. Concr. Compos. 2010, 32, 555–562. [Google Scholar] [CrossRef]
- Güneyisi, E.; Gesoğlu, M.; Karaoğlu, S.; Mermerdaş, K. Strength, permeability and shrinkage cracking of silica fume and metakaolin concretes. Constr. Build. Mater. 2012, 34, 120–130. [Google Scholar] [CrossRef]
- Konieczna, K.; Chilmon, K.; Jackiewicz-Rek, W. Investigation of Mechanical Properties, Durability and Microstructure of Low-Clinker High-Performance Concretes Incorporating Ground Granulated Blast Furnace Slag, Siliceous Fly Ash and Silica Fume. Appl. Sci. 2021, 11, 830. [Google Scholar] [CrossRef]
- Zhang, J.; Ye, H.; Gao, X.; Wu, W. Adsorption and desorption of polycarboxylate ether superplasticizer in fresh cementitious materials blended with mineral admixtures. J. Mater. Res. Technol. 2022, 17, 1740–1751. [Google Scholar] [CrossRef]
- Bapat, J.D. Mineral Admixtures in Cement and Concrete; CRC Press: Boca Raton, FL, USA, 2012; 310p. [Google Scholar]
- Shvarzman, A.; Kovler, K.; Schamban, I.; Grader, G.S.; Shter, G.E. Influence of chemical and phase composition of mineral admixtures on their pozzolanic activity. Adv. Cem. Res. 2002, 14, 35–41. [Google Scholar] [CrossRef]
- Papayianni, I.; Anastasiou, E. Production of high-strength concrete using high volume of industrial by-products. Constr. Build. Mater. 2010, 24, 1412–1417. [Google Scholar] [CrossRef]
- Dvorkin, L.; Zhitkovsky, V.; Sitarz, M.; Hager, I. Cement with Fly Ash and Metakaolin Blend—Drive towards a More Sustainable Construction. Energies 2022, 15, 3556. [Google Scholar] [CrossRef]
- Smith, I.A. The design of fly ash concretes. Proc. Inst. Civ. Eng. 1967, 36, 769–790. [Google Scholar] [CrossRef]
- Stolnikov, V.V. Using Fly Ash from Combustion of Pulverized Fuel at Thermal Power Plants; Energiya: Leningrad, Russia, 1989; 50p. (In Russian) [Google Scholar]
- Golewski, G.L. The Effect of the Addition of Coal Fly Ash (CFA) on the Control of Water Movement within the Structure of the Concrete. Materials 2023, 16, 5218. [Google Scholar] [CrossRef] [PubMed]
- Dvorkin, L.I. Effective Ash-Containing Cements, Concretes and Mortars; NUWEE: Rivne, Ukraine, 2022; 419p. (In Ukrainian) [Google Scholar]
- EN 12390-1:2021; Testing Hardened Concrete—Part 1: Shape, Dimensions and Other Requirements for Specimens and Moulds. CEN: Brussels, Belgium, 2021.
- Wilińska, I.; Pacewska, B. Influence of selected activating methods on hydration processes of mixtures containing high and very high amount of fly ash—A review. J. Therm. Anal. Calorim. 2018, 133, 823–843. [Google Scholar] [CrossRef]
- Zhang, Y.; Sun, X. Synergistic Effects of Nano-Silica and Fly Ash on the Mechanical Properties and Durability of Internal-Cured Concrete Incorporating Artificial Shale Ceramsite. J. Build. Eng. 2023, 66, 105905. [Google Scholar] [CrossRef]
- Shi, C.; Wu, Z.; Lu, K.; Wu, L. A review on mixture design methods for self-compacting concrete. Constr. Build. Mater. 2015, 84, 387–398. [Google Scholar] [CrossRef]
- Ghosh, R.S. Proportioning of Fly Ash Cement Concrete Mixes. Can. J. Civ. Eng. 1976, 3, 68–82. [Google Scholar] [CrossRef]
- Babu, K.G.; Rao, G.S.N. Efficiency of fly ash in concrete. Cem. Concr. Compos. 1993, 15, 223–229. [Google Scholar] [CrossRef]
- Biswas, R.; Baboo, R. Efficiency Concepts and Models that Evaluates the Strength of Concretes Containing Different Supplementary Cementitious Materials. Civ. Eng. J. 2019, 5, 18–32. [Google Scholar] [CrossRef]
- Dvorkin, L.; Dvorkin, O.; Ribakov, Y. Mathematical Experiments Planning in Concrete Technology; Nova Science Publishers, Inc.: New York, NY, USA, 2012; 173p. [Google Scholar]
- EN 12350-2:2009; Testing Fresh Concrete—Part 2: Slump-Test. CEN: Brussels, Belgium, 2009.
- Neville, A.M. Properties of Concrete, 5th ed.; Longman: London, UK, 2011; 846p. [Google Scholar]
- Liao, W.; Sun, X.; Kumar, A.; Sun, H.; Ma, H. Hydration of Binary Portland Cement Blends Containing Silica Fume: A Decoupling Method to Estimate Degrees of Hydration and Pozzolanic Reaction. Front. Mater. 2019, 6, 78. [Google Scholar] [CrossRef]
Figure 1.
Dependence of the concrete strength at normal curing on (a) the active mineral additive part in the binder and (b) the part of the activator in the active mineral additive.
Figure 1.
Dependence of the concrete strength at normal curing on (a) the active mineral additive part in the binder and (b) the part of the activator in the active mineral additive.
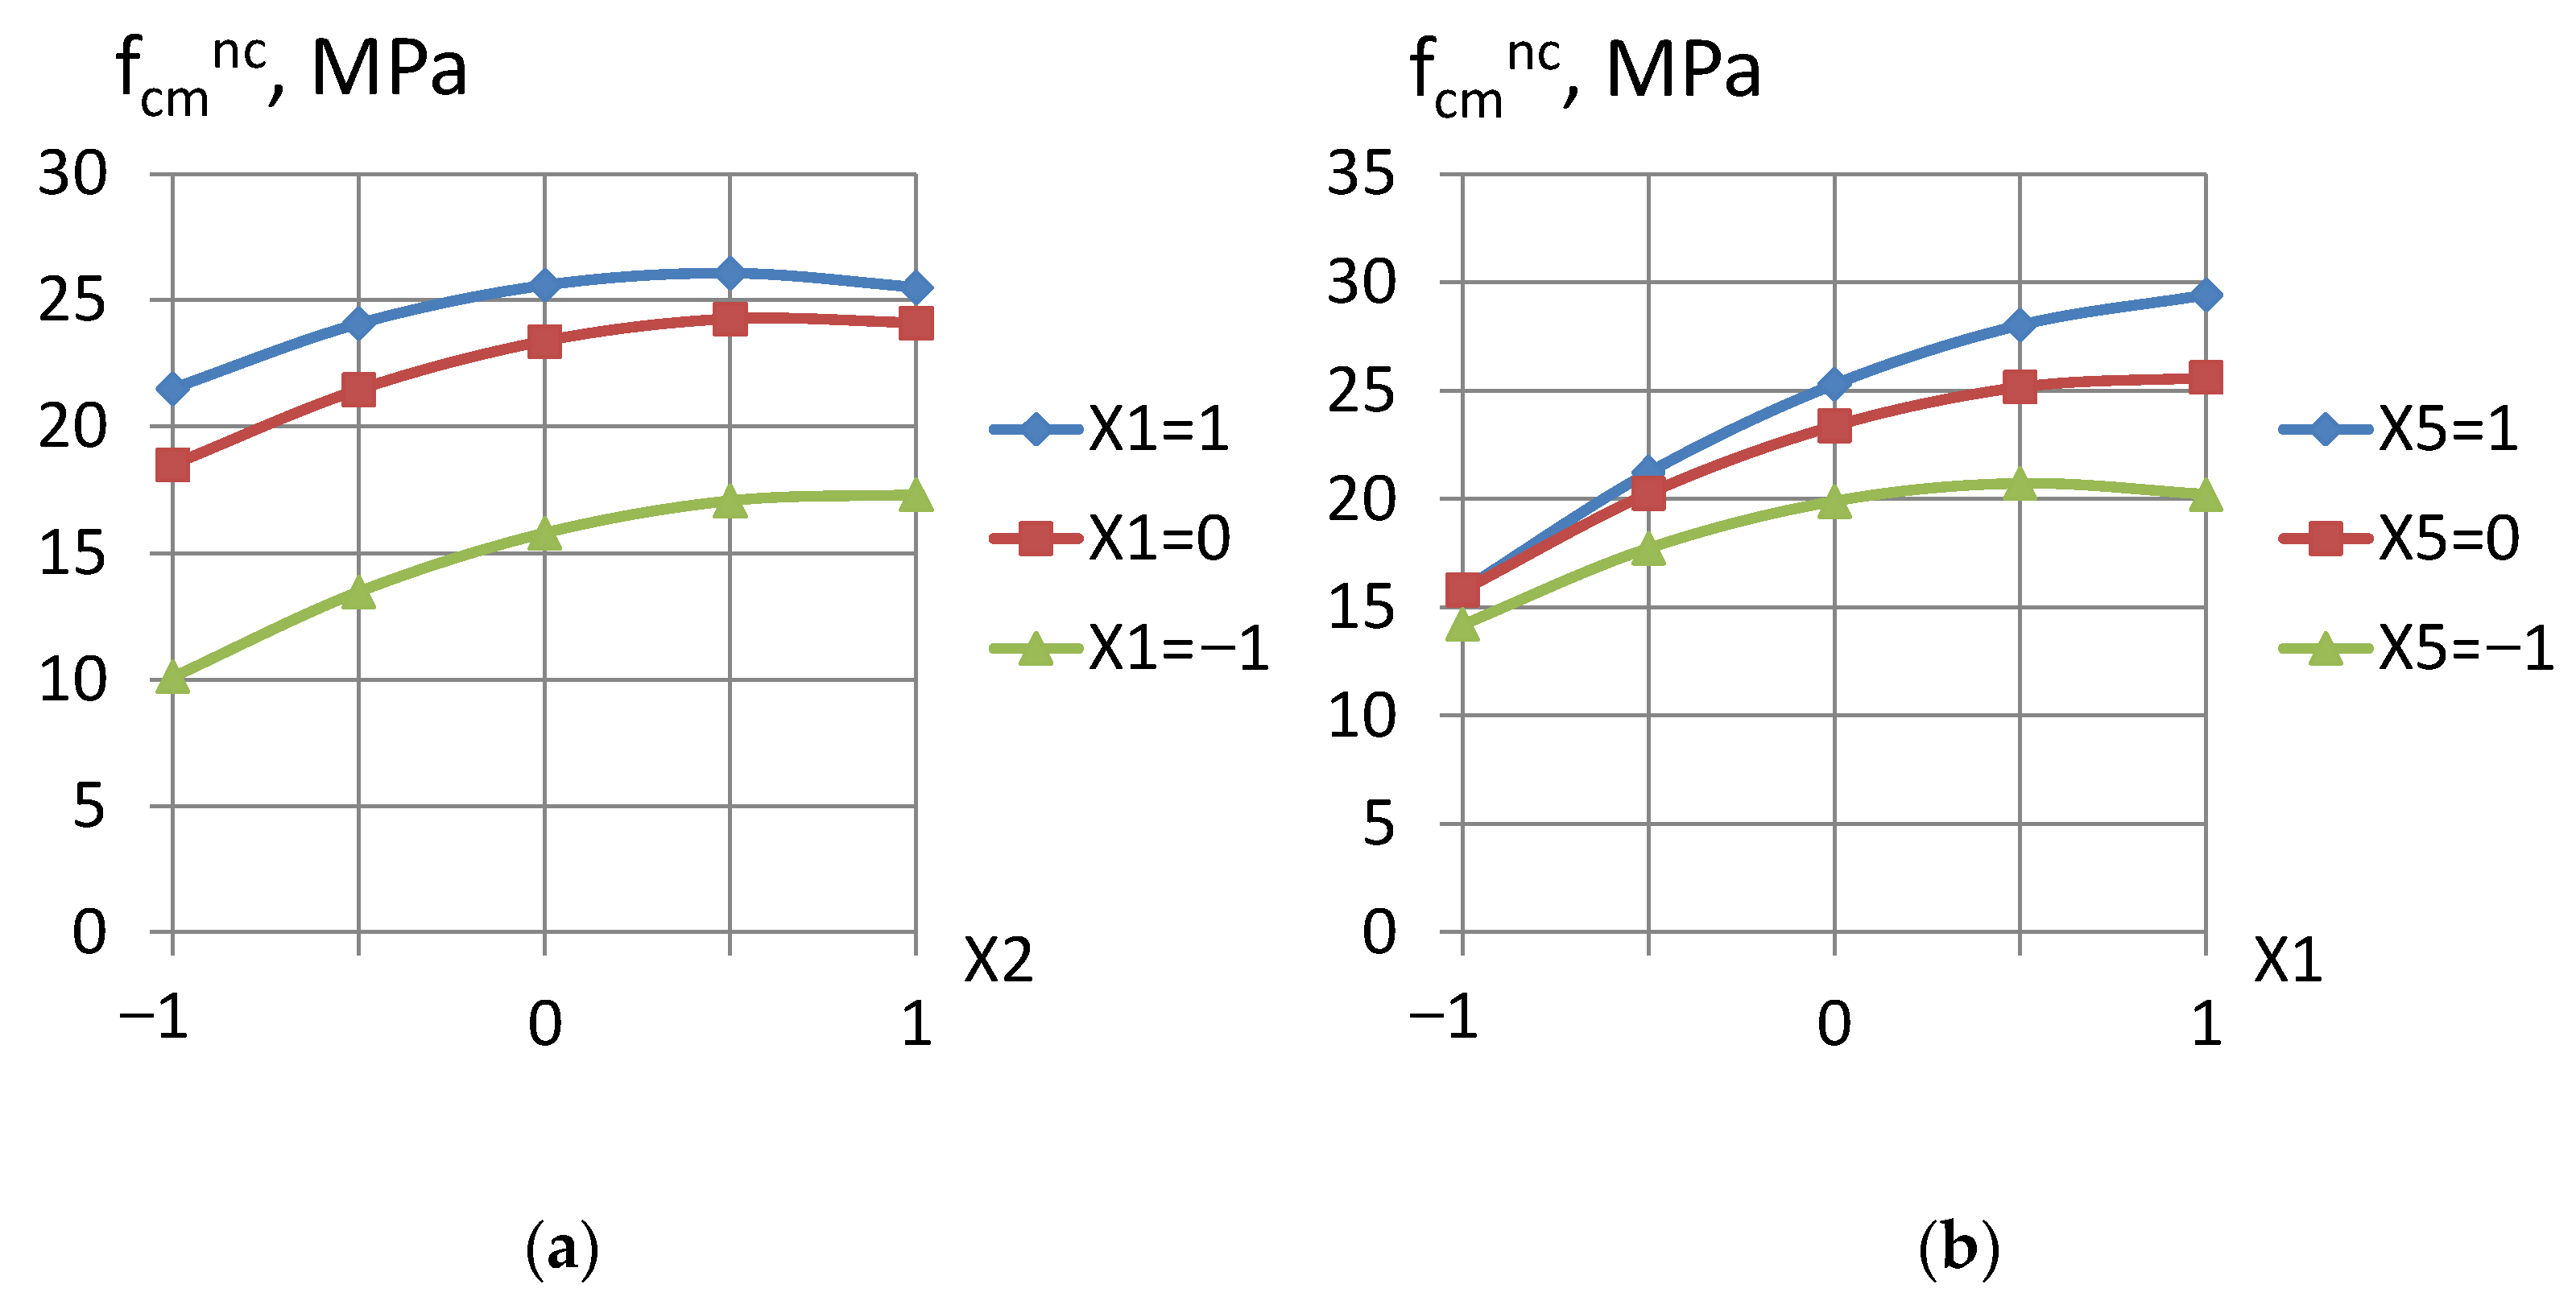
Figure 2.
Dependence of the concrete strength after steaming on: (a) the activator part in the active mineral additive and (b) the part of superplasticizer in the aqueous solution.
Figure 2.
Dependence of the concrete strength after steaming on: (a) the activator part in the active mineral additive and (b) the part of superplasticizer in the aqueous solution.

Figure 3.
Dependence of criterion L on the investigated factors: (a) after normal hardening, (b) after steaming.
Figure 3.
Dependence of criterion L on the investigated factors: (a) after normal hardening, (b) after steaming.

Figure 4.
Response surfaces of the cementing efficiency coefficient (Kc.e) of activated fly ash at concrete normal curing vs. the interaction of factors: (a) X1–X2, (b) X1–X5.
Figure 4.
Response surfaces of the cementing efficiency coefficient (Kc.e) of activated fly ash at concrete normal curing vs. the interaction of factors: (a) X1–X2, (b) X1–X5.
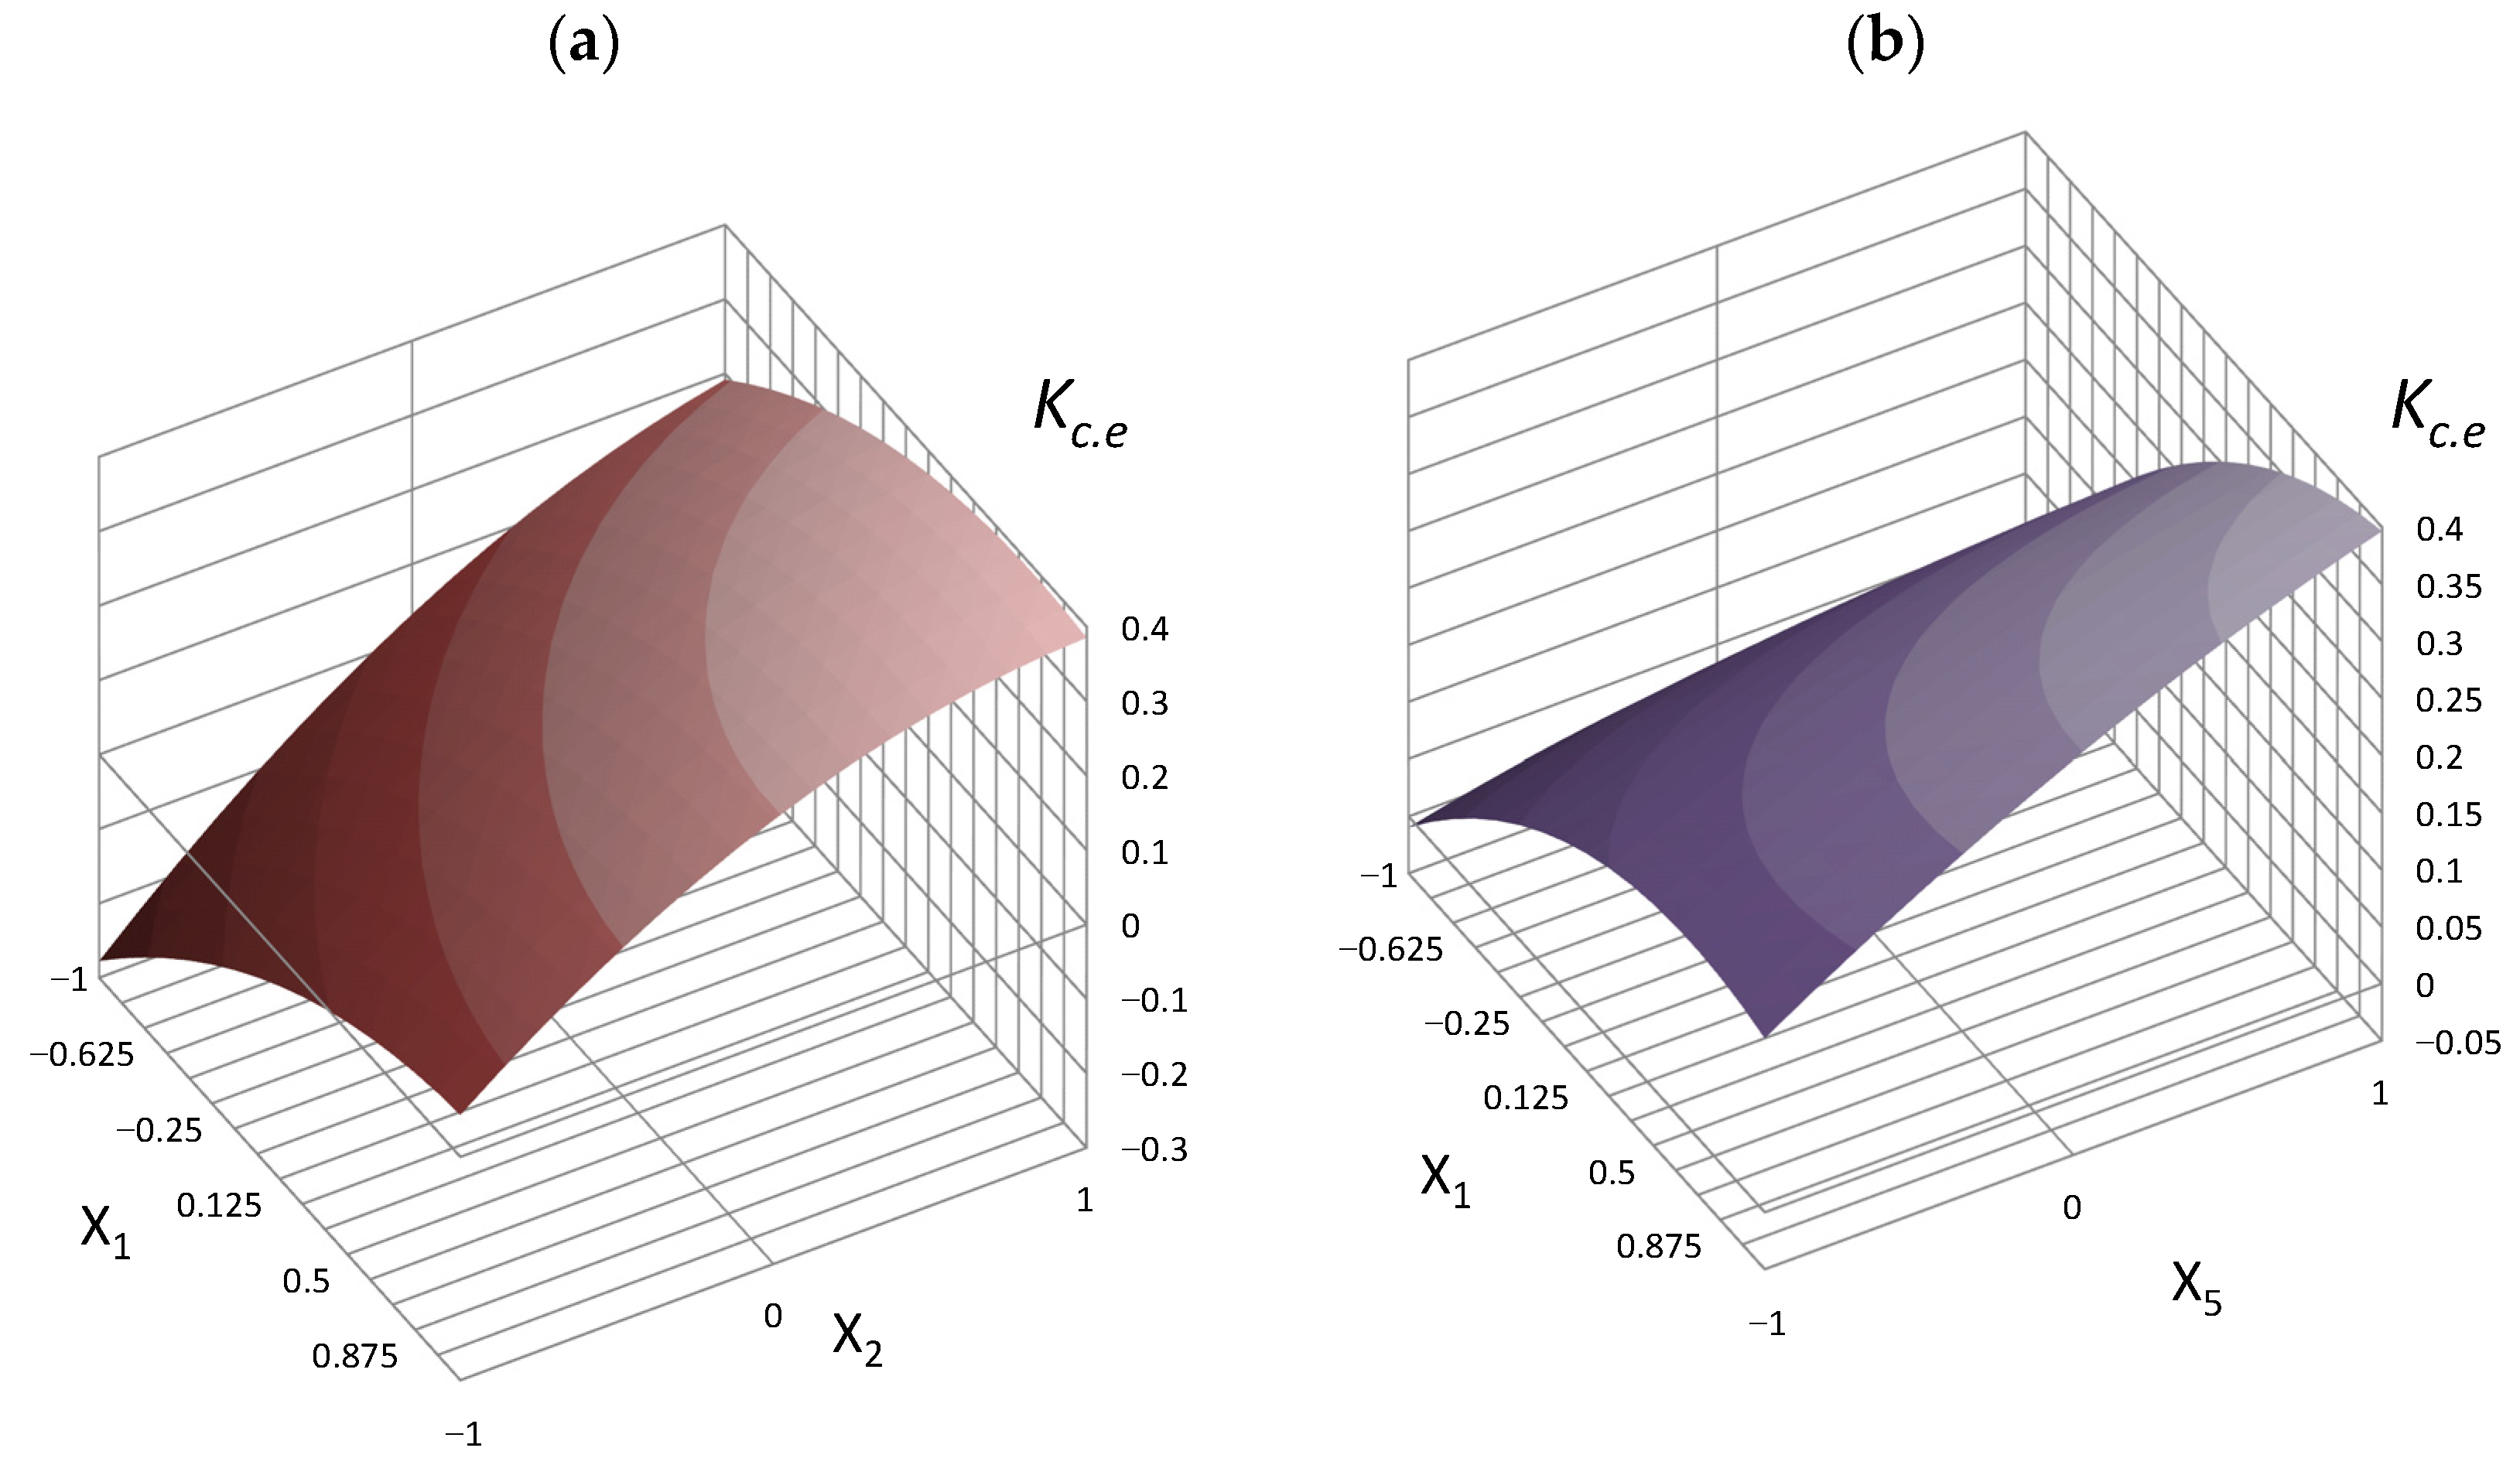
Figure 5.
Nomogram for obtaining the cementing efficiency coefficient according to Equations (14) and (15).
Figure 5.
Nomogram for obtaining the cementing efficiency coefficient according to Equations (14) and (15).

Table 1.
The value of criterion L for cement–ash concretes with cement and ash consumptions of 150 kg/m3 and 50–200 kg/m3, respectively.
Table 1.
The value of criterion L for cement–ash concretes with cement and ash consumptions of 150 kg/m3 and 50–200 kg/m3, respectively.
| Consumption, kg/m3 | Binder/Water | Compressive Strength, MPa | Criterion L | |||||
|---|---|---|---|---|---|---|---|---|
| Cement (C) | Ash (A) | After Steaming fcm′ | 28 Days after Steaming fcm″ | After 28 Days of Normal Curing fcm‴ | fcm′ C | fcm″ C | fcm‴ C | |
| 150 | - | 0.89 | 4.4 | 6.4 | 7.8 | 0.029 | 0.043 | 0.052 |
| 150 | 50 | 1.15 | 9.7 | 11.6 | 11.4 | 0.065 | 0.077 | 0.076 |
| 150 | 75 | 1.28 | 11.6 | 14.0 | 10.6 | 0.077 | 0.093 | 0.072 |
| 150 | 100 | 1.42 | 14.2 | 14.9 | 12.5 | 0.095 | 0.099 | 0.083 |
| 150 | 125 | 1.58 | 14.4 | 16.1 | 15.6 | 0.096 | 0.107 | 0.104 |
| 150 | 150 | 1.72 | 15.7 | 16.6 | 14.7 | 0.105 | 0.110 | 0.098 |
| 150 | 175 | 1.85 | 15.6 | 16.8 | 15.3 | 0.104 | 0.112 | 0.102 |
| 150 | 200 | 2.0 | 16.1 | 17.3 | 16.6 | 0.107 | 0.115 | 0.111 |
Table 2.
Experimental data on Kc.e for ash-containing concretes.
| Concrete Class by Compression Strength | Cement Class | Ash Consumption, kg/m3 | C/W | (C/W)m | Cement Consumption, kg/m3 | Kc.e |
|---|---|---|---|---|---|---|
| Normal curing | ||||||
| C12/15 | 32.5 | - | 1.46 | - | 293 | - |
| 150 | 1.23 | 1.46 | 246 | 0.31 | ||
| C15/20 | 32.5 | - | 1.79 | - | 357 | - |
| 150 | 1.58 | 1.79 | 317 | 0.27 | ||
| C20/25 | 42.5 | - | 1.66 | - | 331 | - |
| 150 | 1.49 | 1.66 | 298 | 0.22 | ||
| Steaming | ||||||
| C12/15 | 32.5 | - | 1.46 | - | 293 | - |
| 200 | 1.16 | 1.46 | 233 | 0.3 | ||
| C15/20 | 32.5 | - | 1.79 | - | 357 | - |
| 200 | 1.53 | 1.79 | 305 | 0.26 | ||
| C20/25 | 42.5 | - | 1.66 | - | 331 | - |
| 200 | 1.46 | 1.66 | 291 | 0.2 | ||
Table 3.
Chemical composition of the Portland cement and fly ash (%).
| Material | CaO | SiO2 | Al2O3 | Fe2O3 + FeO | MgO | Na2O + K2O | SO3 | L.O.I. * |
|---|---|---|---|---|---|---|---|---|
| Portland cement | 64.4 | 21.3 | 5.7 | 3.5 | 0.8 | 0.9 | 2.5 | 0.4 |
| Fly ash | 2.3 | 55.4 | 26.6 | 8.5 | 1.6 | 4.4 | 0.3 | 0.5 |
* L.O.I.—loss on ignition.
Table 4.
Experiment planning conditions.
| Variation Factors | Factors’ Variation Levels | ||
|---|---|---|---|
| −1 | 0 | +1 | |
| X1 | 0.3 | 0.37 | 0.44 |
| X2 | 0.56 | 0.63 | 0.7 |
| X3 | 0.41 | 0.47 | 0.53 |
| X4 | 0.25 | 0.265 | 0.28 |
| X5 | 0.0 | 0.01 | 0.02 |
Table 5.
Experiment planning matrix (Ha5).
| Experiment Point No. | Factors Value in Coded Form | ||||
|---|---|---|---|---|---|
| X1 | X2 | X3 | X4 | X5 | |
| 1 | +1 | +1 | +1 | +1 | +1 |
| 2 | −1 | −1 | +1 | +1 | +1 |
| 3 | −1 | +1 | −1 | −1 | −1 |
| 4 | +1 | −1 | −1 | −1 | −1 |
| 5 | −1 | +1 | −1 | +1 | +1 |
| 6 | +1 | −1 | −1 | +1 | +1 |
| 7 | +1 | +1 | +1 | −1 | −1 |
| 8 | −1 | −1 | +1 | −1 | −1 |
| 9 | −1 | +1 | +1 | +1 | −1 |
| 10 | +1 | −1 | +1 | +1 | −1 |
| 11 | +1 | +1 | −1 | −1 | +1 |
| 12 | −1 | −1 | −1 | −1 | +1 |
| 13 | −1 | +1 | +1 | −1 | +1 |
| 14 | +1 | −1 | +1 | −1 | +1 |
| 15 | +1 | +1 | −1 | +1 | −1 |
| 16 | −1 | −1 | −1 | +1 | −1 |
| 17 | +1 | 0 | 0 | 0 | 0 |
| 18 | −1 | 0 | 0 | 0 | 0 |
| 19 | 0 | +1 | 0 | 0 | 0 |
| 20 | 0 | −1 | 0 | 0 | 0 |
| 21 | 0 | 0 | +1 | 0 | 0 |
| 22 | 0 | 0 | −1 | 0 | 0 |
| 23 | 0 | 0 | 0 | +1 | 0 |
| 24 | 0 | 0 | 0 | −1 | 0 |
| 25 | 0 | 0 | 0 | 0 | +1 |
| 26 | 0 | 0 | 0 | 0 | −1 |
| 27 | 0 | 0 | 0 | 0 | 0 |
Table 6.
Concrete compositions at experimental points, values of strength, and calculated values of criterion L and coefficient Kc.e.
Table 6.
Concrete compositions at experimental points, values of strength, and calculated values of criterion L and coefficient Kc.e.
| No. | Consumption of Concrete Components, kg/m3 | Compressive Strength, MPa | Criterion L, | Cementing Efficiency Coefficient Kc.e | ||||||||
|---|---|---|---|---|---|---|---|---|---|---|---|---|
| MS | Ash | C | W | A | SP | fcm (nc) | fcm (st) | nc | st | nc | st | |
| 1 | 114 | 151 | 138 | 132 | 1944 | 3.0 | 33.1 | 29.7 | 0.240 | 0.215 | 0.32 | 0.26 |
| 2 | 62 | 151 | 202 | 132 | 1944 | 3.0 | 13.9 | 9.3 | 0.069 | 0.046 | −0.33 | −0.43 |
| 3 | 54 | 131 | 95 | 148 | 2025 | 0.0 | 11.3 | 7.7 | 0.119 | 0.081 | 0.21 | 0.11 |
| 4 | 63 | 84 | 140 | 148 | 2025 | 0.0 | 11.7 | 5.3 | 0.084 | 0.038 | −0.02 | −0.26 |
| 5 | 60 | 146 | 107 | 165 | 1944 | 3.7 | 12.9 | 8.5 | 0.121 | 0.080 | 0.26 | 0.13 |
| 6 | 71 | 94 | 157 | 165 | 1944 | 3.7 | 20.9 | 15.7 | 0.133 | 0.100 | 0.31 | 0.12 |
| 7 | 102 | 135 | 123 | 118 | 2025 | 0.0 | 23.9 | 19.3 | 0.194 | 0.157 | 0.16 | 0.08 |
| 8 | 56 | 135 | 181 | 118 | 2025 | 0.0 | 12.3 | 8.5 | 0.068 | 0.047 | −0.36 | −0.45 |
| 9 | 78 | 189 | 138 | 132 | 1944 | 0.0 | 19.5 | 16.3 | 0.141 | 0.118 | 0.08 | 0.02 |
| 10 | 91 | 121 | 202 | 132 | 1944 | 0.0 | 19.9 | 13.9 | 0.098 | 0.069 | −0.19 | −0.33 |
| 11 | 79 | 104 | 95 | 148 | 2025 | 3.3 | 24.9 | 21.1 | 0.261 | 0.221 | 0.61 | 0.50 |
| 12 | 43 | 104 | 140 | 148 | 2025 | 3.3 | 5.7 | 0.7 | 0.041 | 0.005 | −0.24 | −0.42 |
| 13 | 70 | 169 | 123 | 118 | 2025 | 2.6 | 21.1 | 17.1 | 0.171 | 0.139 | 0.11 | 0.04 |
| 14 | 82 | 108 | 181 | 118 | 2025 | 2.6 | 29.1 | 24.3 | 0.161 | 0.134 | 0.01 | −0.10 |
| 15 | 88 | 117 | 107 | 165 | 1944 | 0.0 | 15.7 | 10.7 | 0.147 | 0.100 | 0.34 | 0.20 |
| 16 | 48 | 117 | 157 | 165 | 1944 | 0.0 | 4.1 | 0.2 | 0.026 | 0.100 | −0.30 | −0.45 |
| 17 | 86 | 114 | 143 | 140 | 1985 | 1.6 | 25.6 | 20.6 | 0.179 | 0.144 | 0.29 | 0.16 |
| 18 | 59 | 143 | 143 | 140 | 1985 | 1.6 | 15.8 | 11.6 | 0.111 | 0.081 | 0.04 | −0.07 |
| 19 | 81 | 143 | 116 | 140 | 1985 | 1.6 | 24.1 | 19.9 | 0.208 | 0.172 | 0.35 | 0.25 |
| 20 | 65 | 114 | 170 | 140 | 1985 | 1.6 | 18.5 | 13.3 | 0.109 | 0.078 | −0.03 | −0.18 |
| 21 | 82 | 145 | 161 | 125 | 1985 | 1.4 | 27.2 | 22.3 | 0.169 | 0.138 | 0.11 | 0.01 |
| 22 | 63 | 112 | 125 | 156 | 1985 | 1.7 | 19 | 13.7 | 0.152 | 0.110 | 0.35 | 0.18 |
| 23 | 77 | 136 | 151 | 148 | 1944 | 1.6 | 23.4 | 18.5 | 0.155 | 0.123 | 0.23 | 0.11 |
| 24 | 68 | 121 | 135 | 133 | 2025 | 1.5 | 23.4 | 18.5 | 0.174 | 0.137 | 0.23 | 0.11 |
| 25 | 73 | 129 | 143 | 140 | 1985 | 3.2 | 25.3 | 20.6 | 0.177 | 0.144 | 0.28 | 0.16 |
| 26 | 73 | 129 | 143 | 140 | 1985 | 0.0 | 19.9 | 15 | 0.139 | 0.105 | 0.14 | 0.02 |
| 27 | 73 | 129 | 143 | 140 | 1985 | 1.6 | 23.4 | 18.5 | 0.164 | 0.129 | 0.23 | 0.11 |
Notes: art of sand in aggregate (sand and crushed stone)–0.32; nc—normal curing (28 days), st—steaming.
Table 7.
Calculated values of the concrete strength and criterion L.
| Structure Parameters | Materials’ Consumption, kg/m3 | Compressive Strength, MPa, at 28 Days | Criterion L | ||||||
|---|---|---|---|---|---|---|---|---|---|
| X1 | X2 | X3 | X5 | MS | Ash | C | W | ||
| Microsilica activator | |||||||||
| 0.3 | 0.70 | 0.53 | 0.02 | 63 | 148 | 128 | 122 | 22 | 0.172 |
| 0.37 | 0.70 | 0.53 | 0.02 | 78 | 133 | 128 | 122 | 30 | 0.234 |
| 0.3 | 0.70 | 0.41 | 0.02 | 48 | 112 | 99 | 153 | 15 | 0.152 |
| 0.37 | 0.70 | 0.41 | 0.02 | 60 | 103 | 99 | 153 | 19 | 0.192 |
| 0.44 | 0.70 | 0.53 | 0.02 | 93 | 119 | 128 | 122 | 33 | 0.258 |
| 0.37 | 0.63 | 0.47 | 0.02 | 62 | 107 | 140 | 138 | 23 | 0.164 |
| Without activator | |||||||||
| 0.0 | 0.47 | 0.36 | 0.0 | - | 113 | 174 | 189 | 15 | 0.086 |
| 0.0 | 0.47 | 0.36 | 0.02 | - | 113 | 174 | 164 | 20 | 0.115 |
Note: Concrete compositions with MS additive were calculated at X4 = 0.26.
Disclaimer/Publisher’s Note: The statements, opinions and data contained in all publications are solely those of the individual author(s) and contributor(s) and not of MDPI and/or the editor(s). MDPI and/or the editor(s) disclaim responsibility for any injury to people or property resulting from any ideas, methods, instructions or products referred to in the content. |
© 2023 by the authors. Licensee MDPI, Basel, Switzerland. This article is an open access article distributed under the terms and conditions of the Creative Commons Attribution (CC BY) license (https://creativecommons.org/licenses/by/4.0/).
Share and Cite
MDPI and ACS Style
Dvorkin, L.; Zhitkovsky, V.; Lapovskaya, S.; Ribakov, Y. Investigation of the Cementing Efficiency of Fly Ash Activated by Microsilica in Low-Cement Concrete. Materials 2023, 16, 6859. https://doi.org/10.3390/ma16216859
AMA Style
Dvorkin L, Zhitkovsky V, Lapovskaya S, Ribakov Y. Investigation of the Cementing Efficiency of Fly Ash Activated by Microsilica in Low-Cement Concrete. Materials. 2023; 16(21):6859. https://doi.org/10.3390/ma16216859
Chicago/Turabian StyleDvorkin, Leonid, Vadim Zhitkovsky, Svetlana Lapovskaya, and Yuri Ribakov. 2023. "Investigation of the Cementing Efficiency of Fly Ash Activated by Microsilica in Low-Cement Concrete" Materials 16, no. 21: 6859. https://doi.org/10.3390/ma16216859
Note that from the first issue of 2016, this journal uses article numbers instead of page numbers. See further details here.