
CuO Nanoparticles and Microaggregates: An Experimental and Computational Study of Structure and Electronic Properties
 , , , ,
  and
and
Abstract
:
1. Introduction
2. Materials and Methods
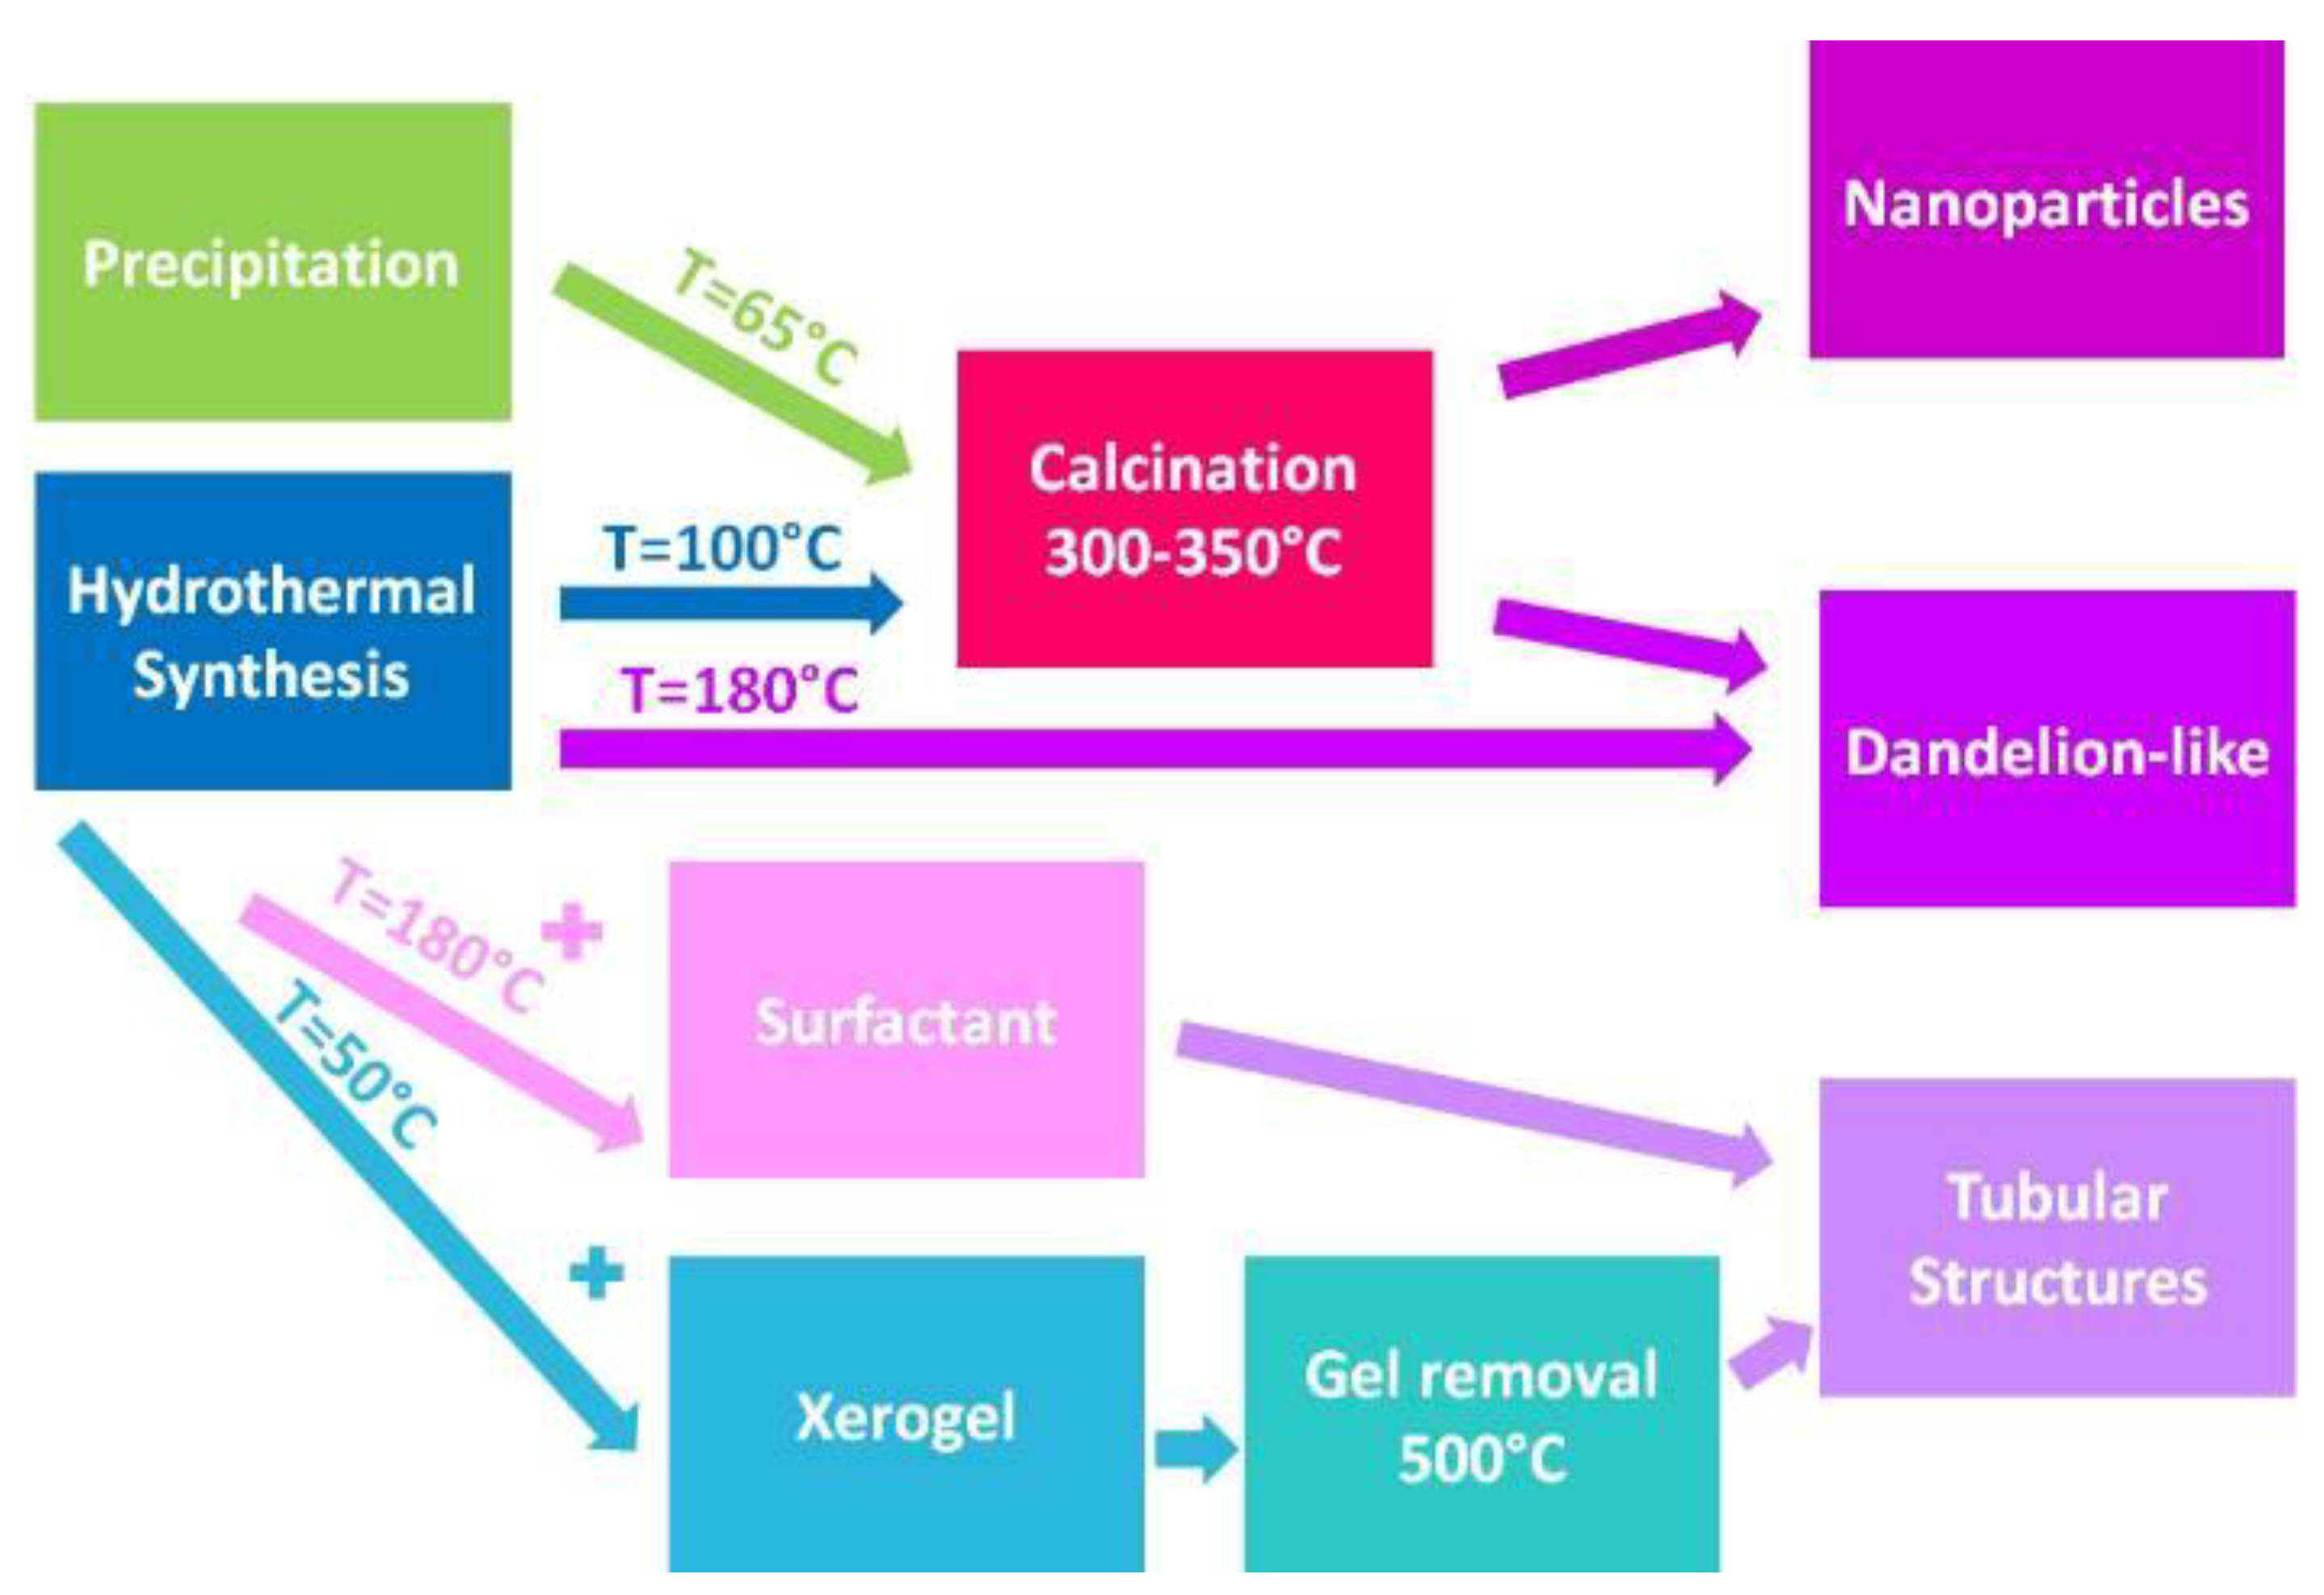
2.1. Materials and Sample Preparation
2.2. Apparatuses
2.3. Computations
3. Results and Discussion
3.1. Characterization of Precursors
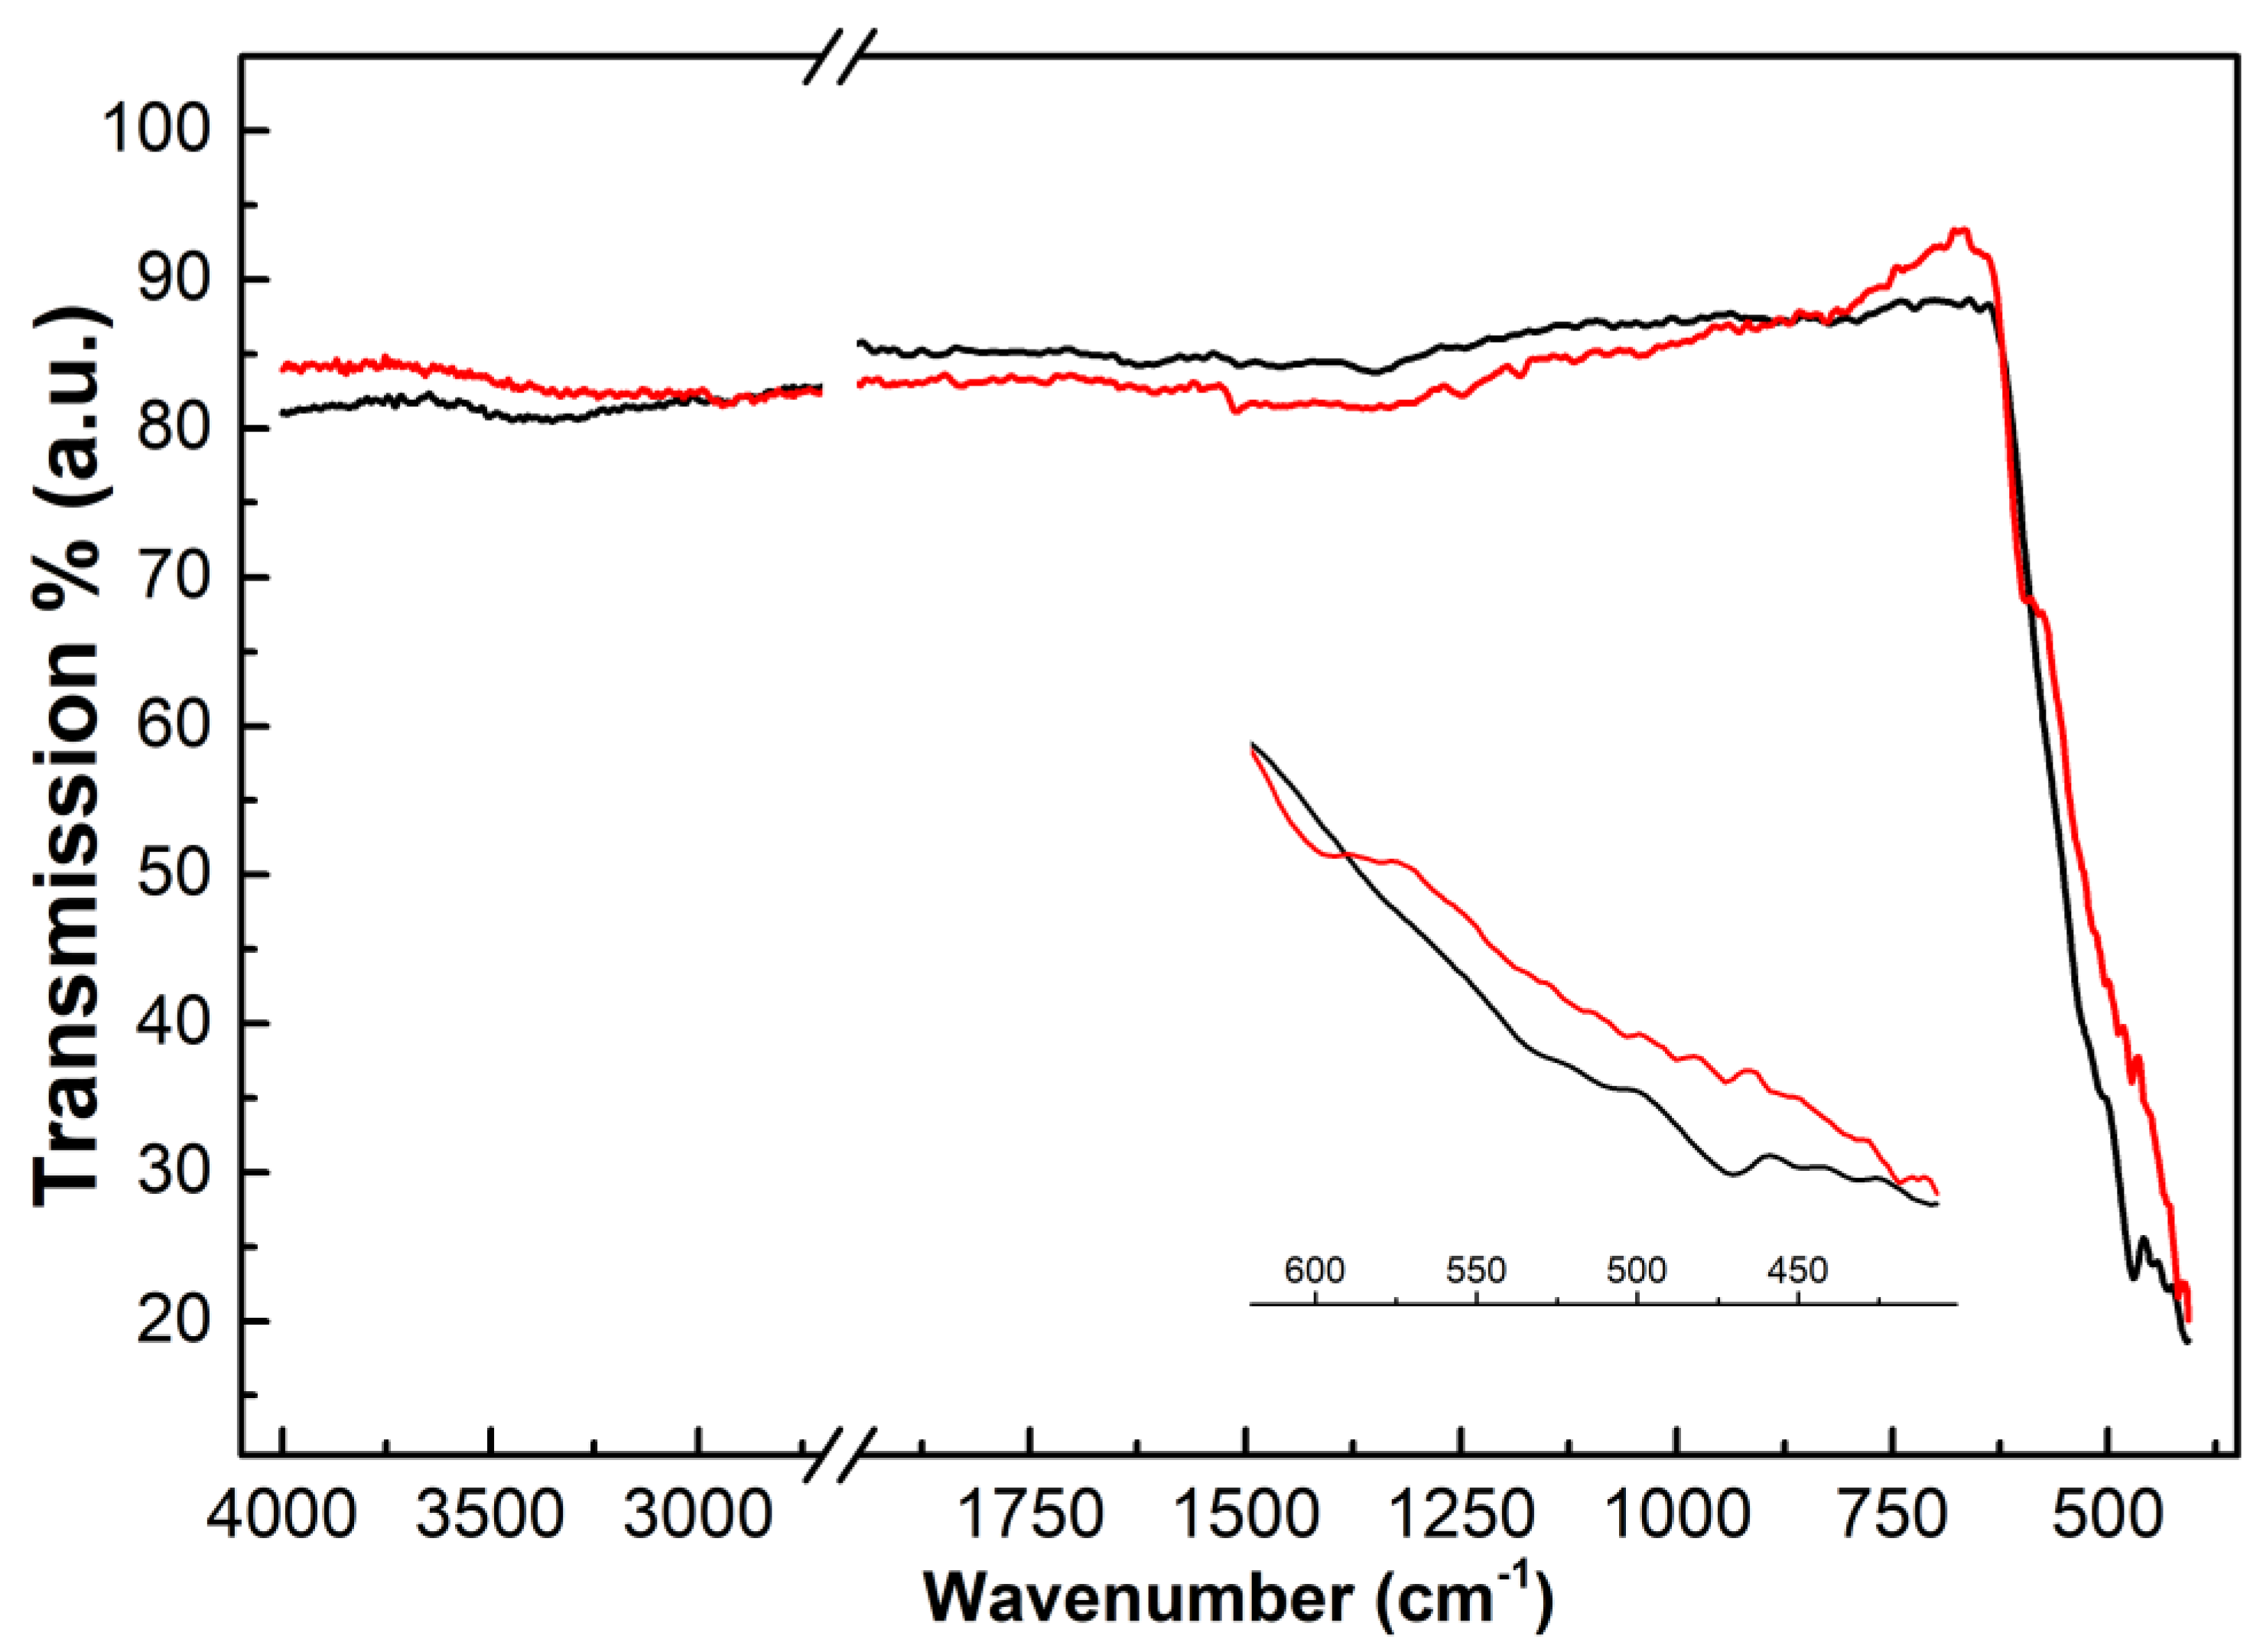
3.1.1. FTIR Spectra
- 3404 and 3313 cm−1, OH stretching, redshifted due to the interaction with the metal cation;
- 1504 and 1381 cm−1, coordinated and non-coordinated C-O stretching;
- 1095, 1045, 873 cm−1, O-H bending and C-O + O-Cu coupled stretching;
- 815 and 748 cm−1, out-of-plane bending and antisymmetric O-C-O group vibration.
- The peaks falling below 600 cm−1 are related to Cu-O skeleton vibration.
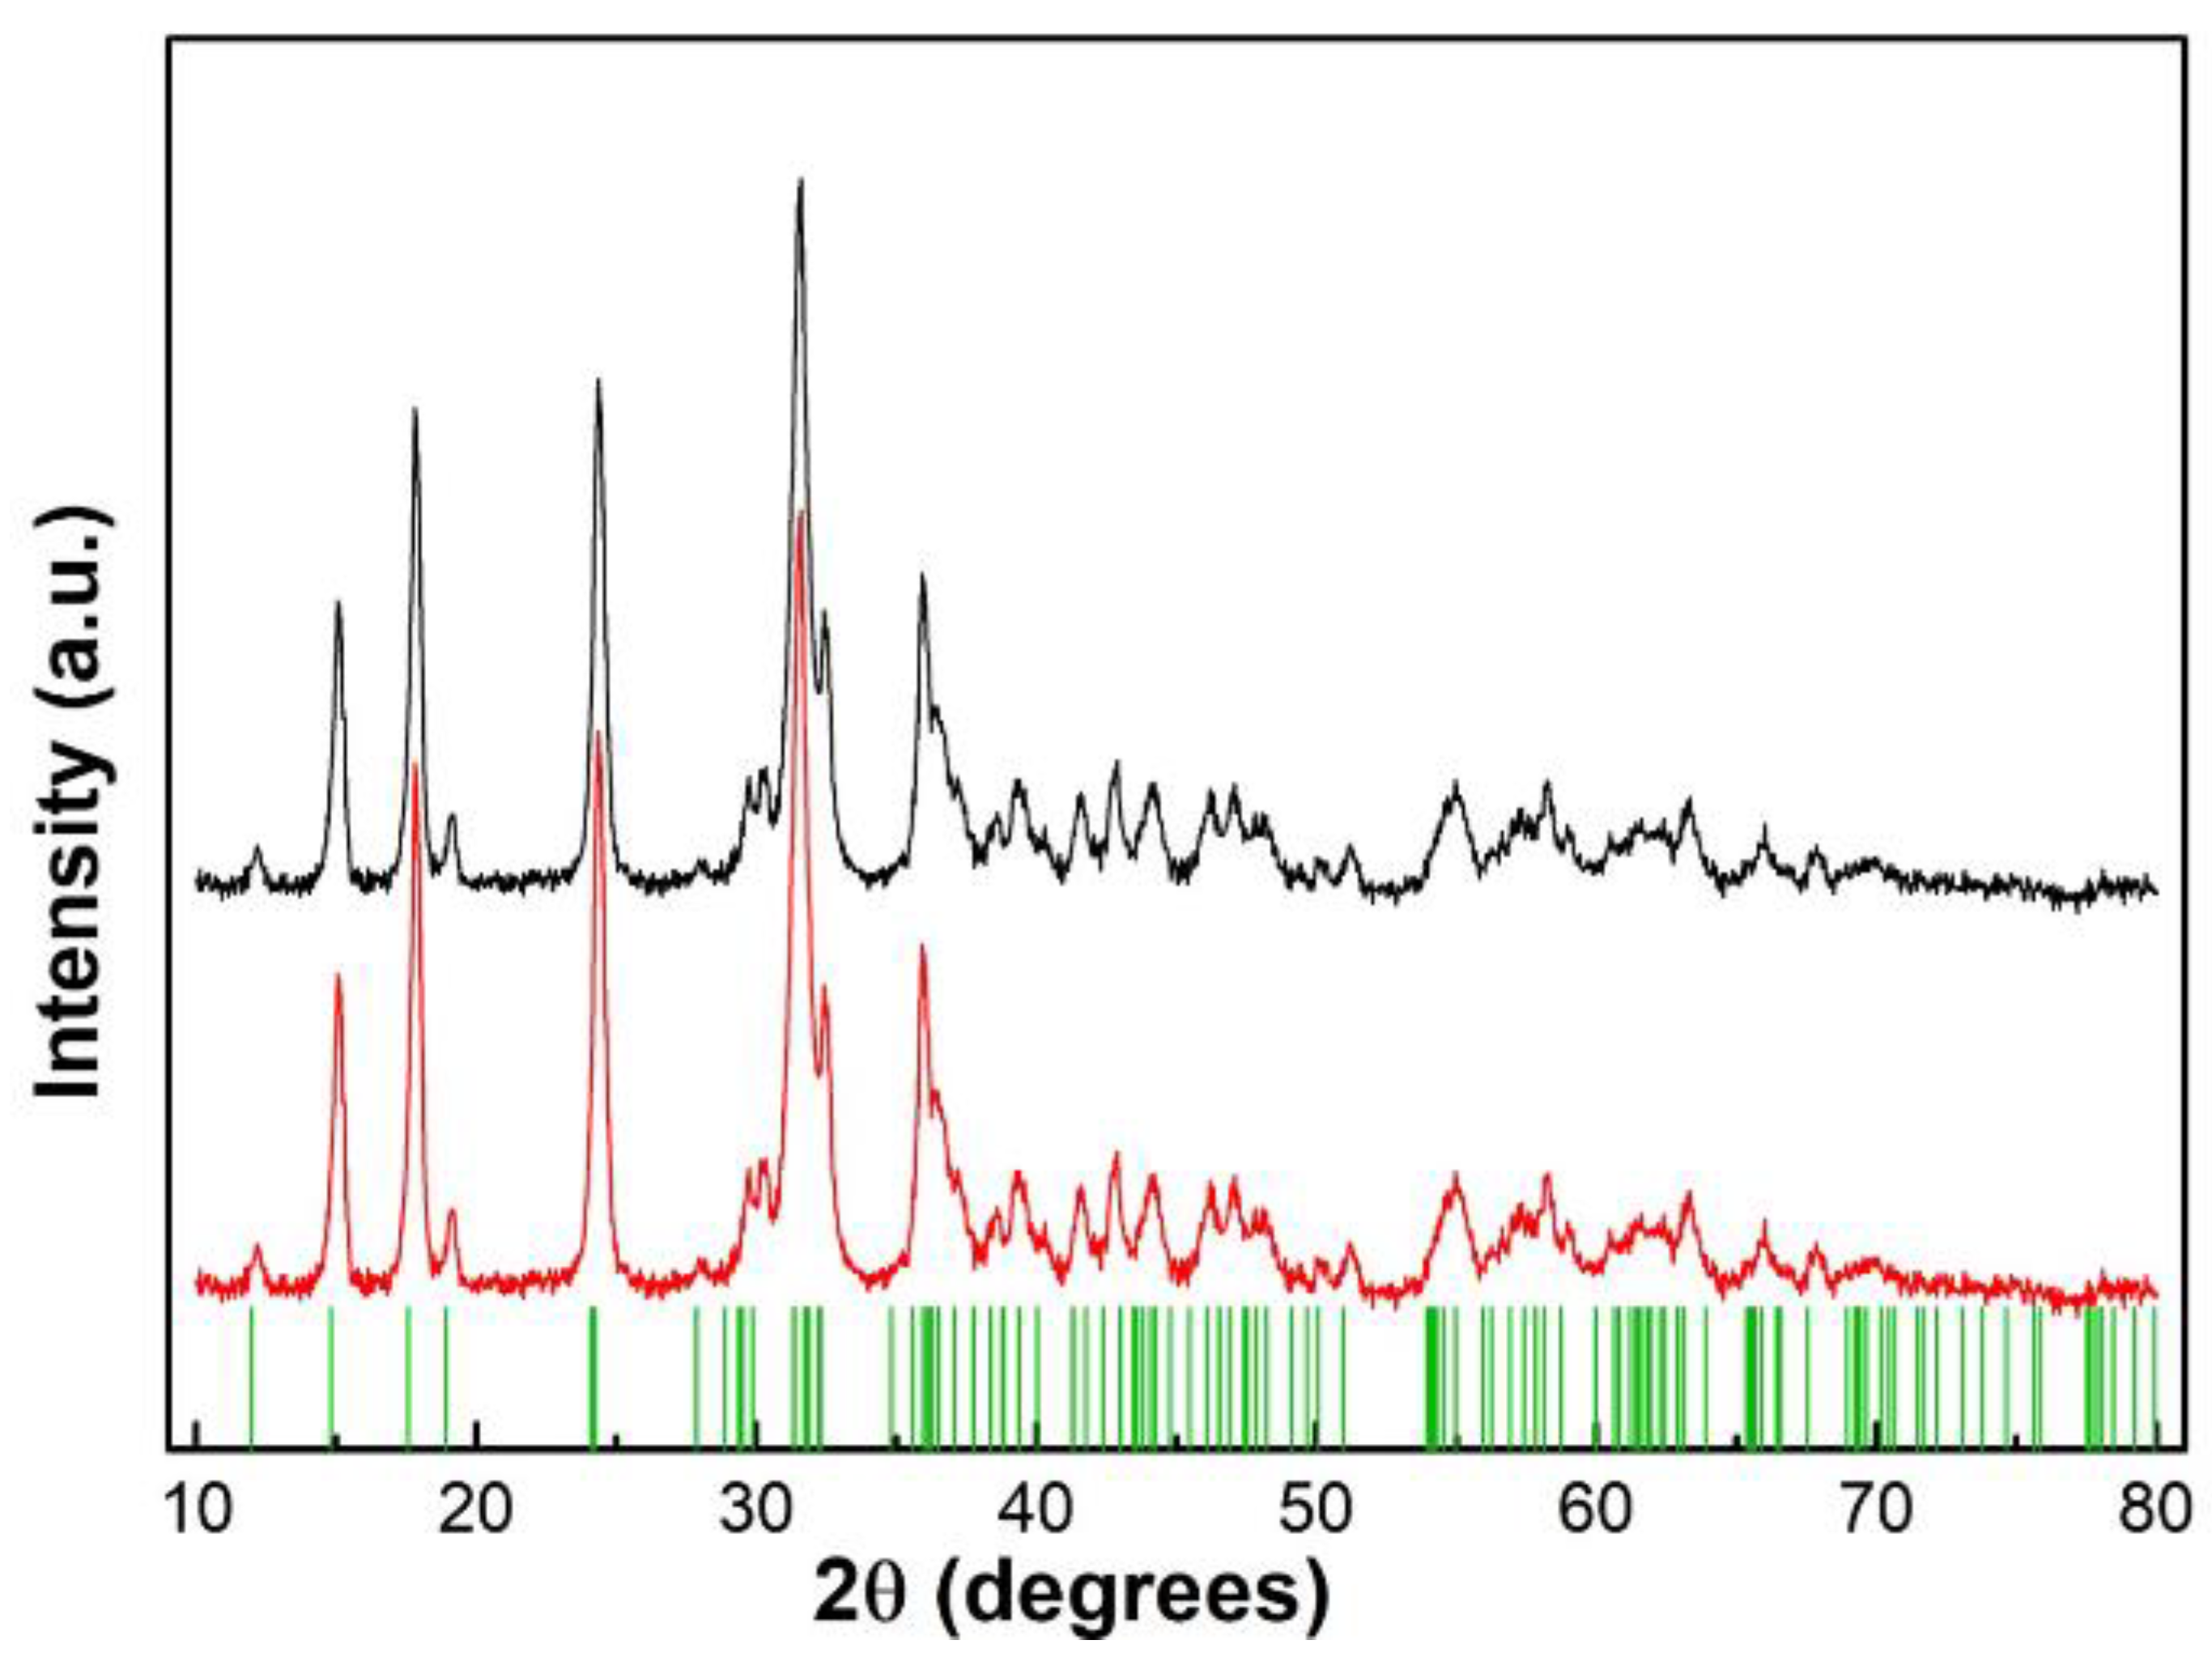
3.1.2. XRD
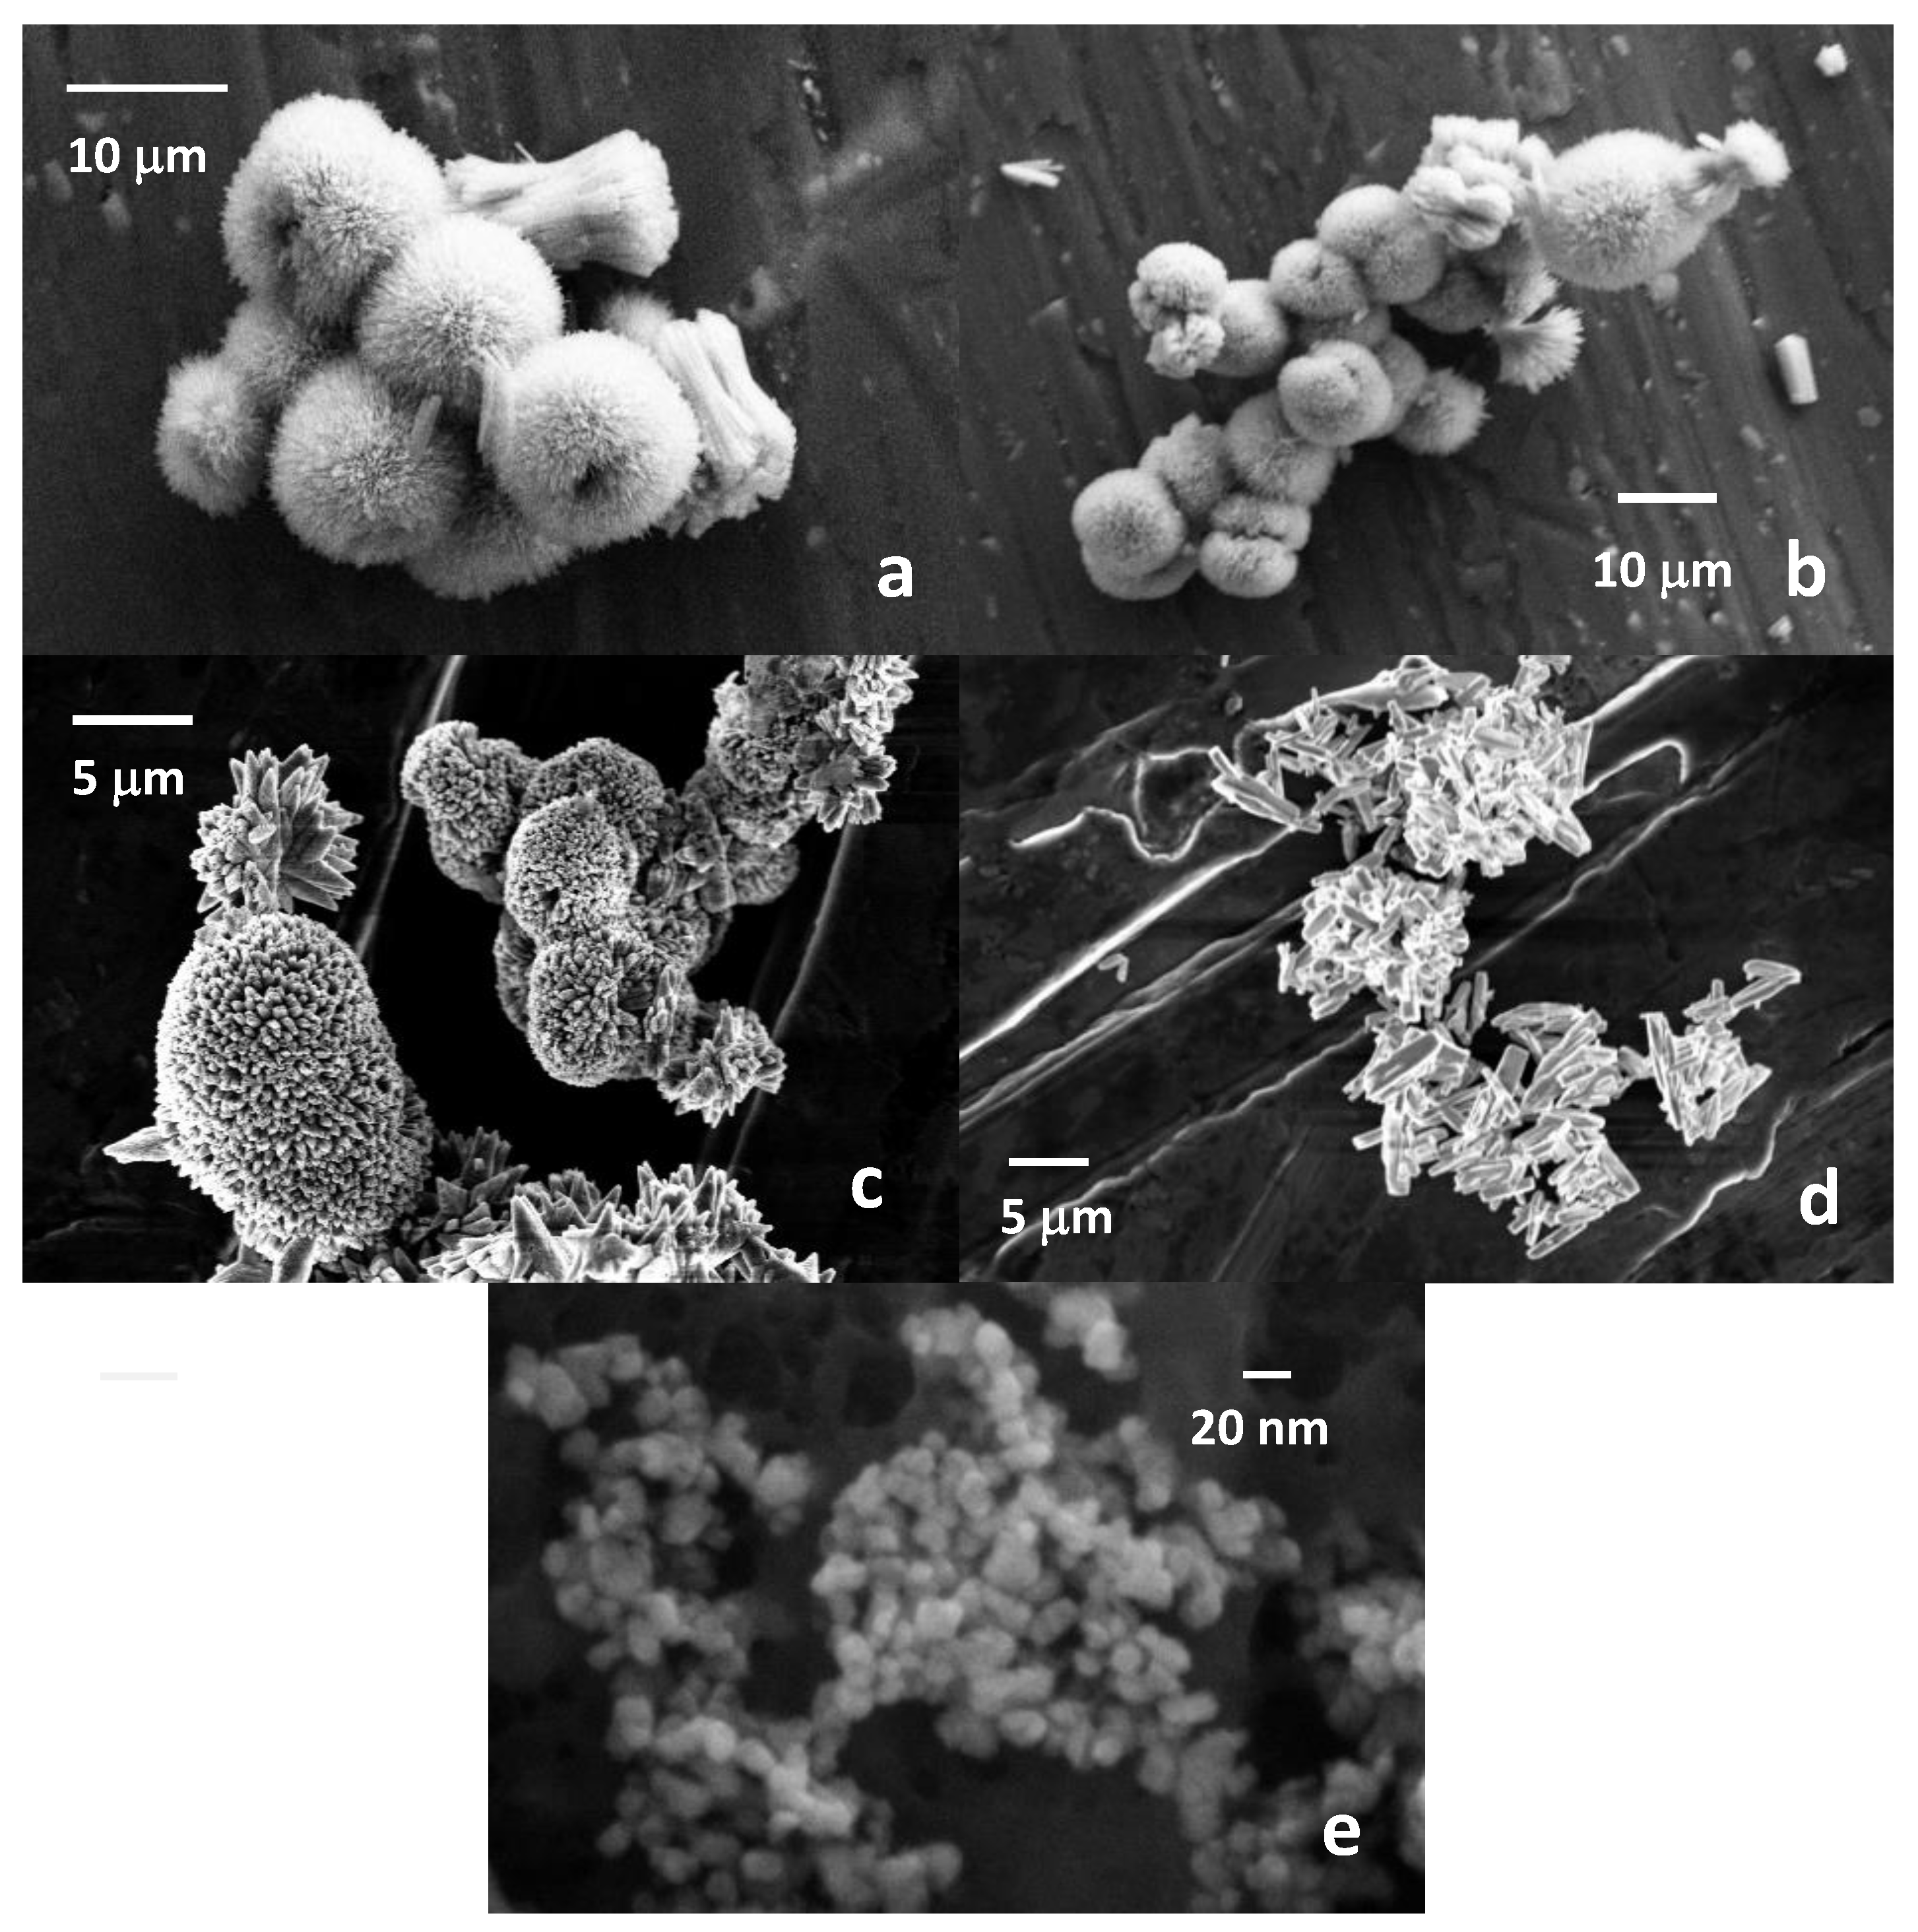
3.1.3. SEM Analysis
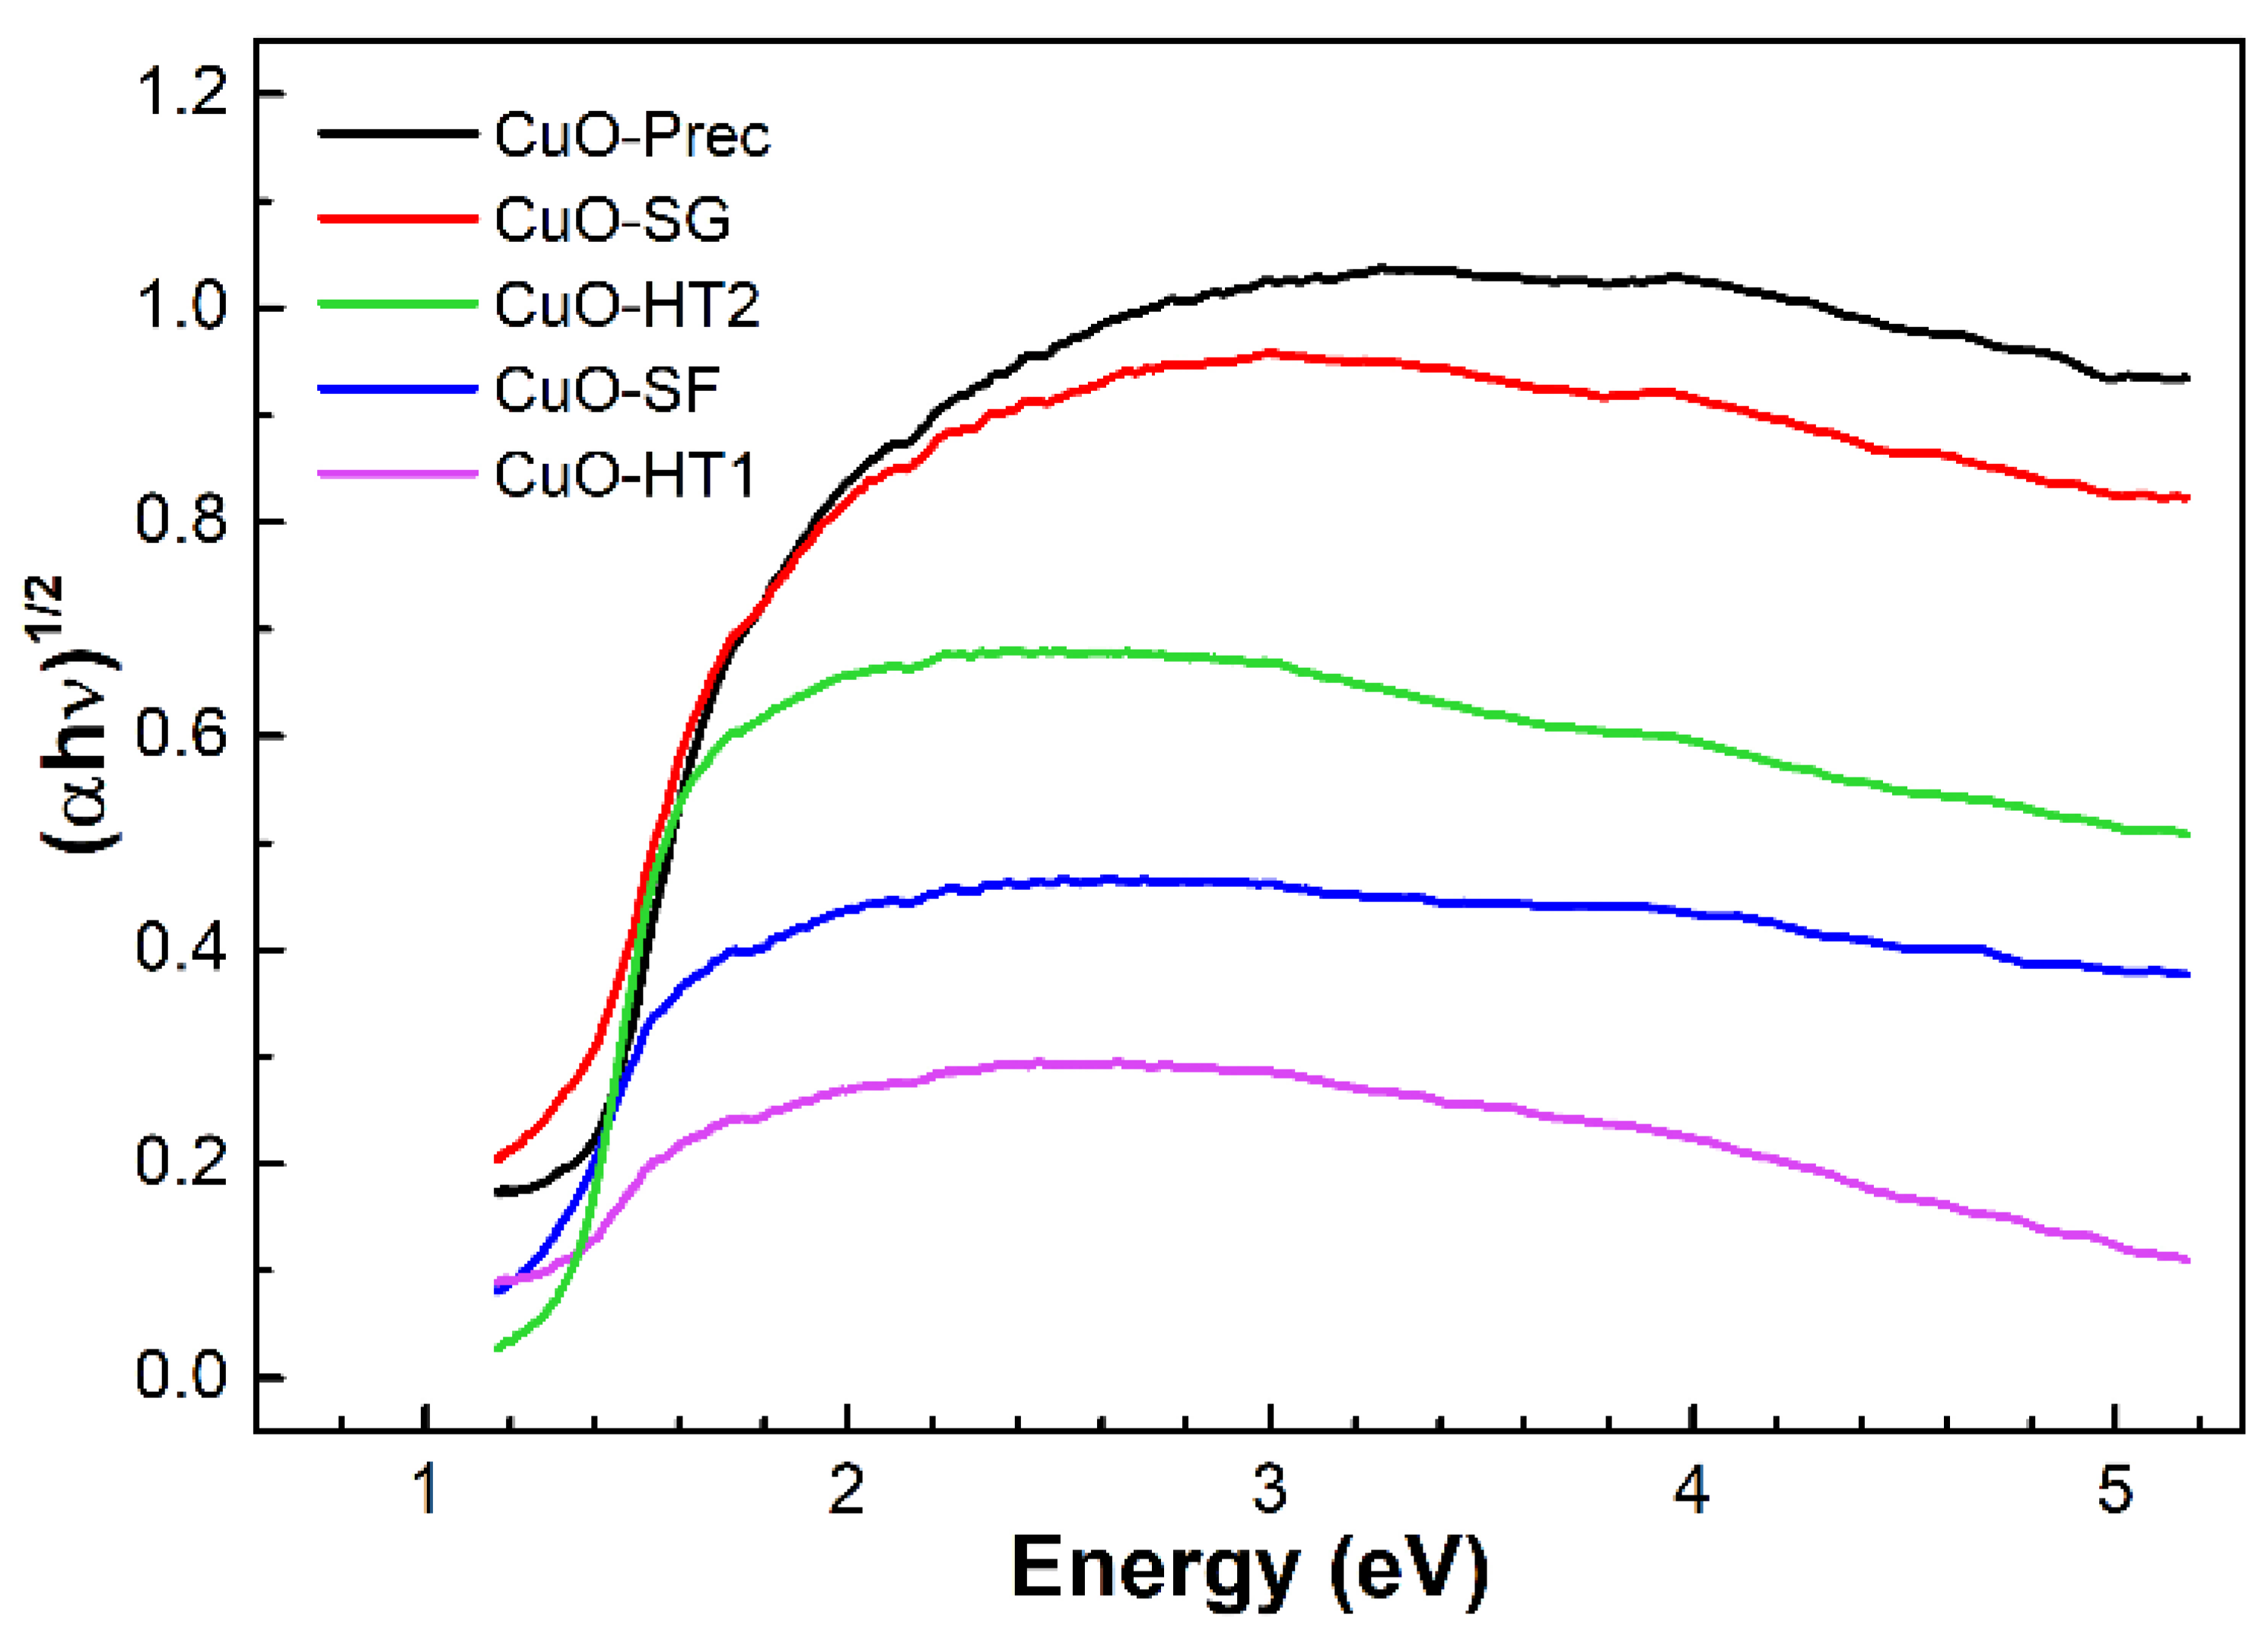
3.1.4. Diffuse Reflectance Spectroscopy
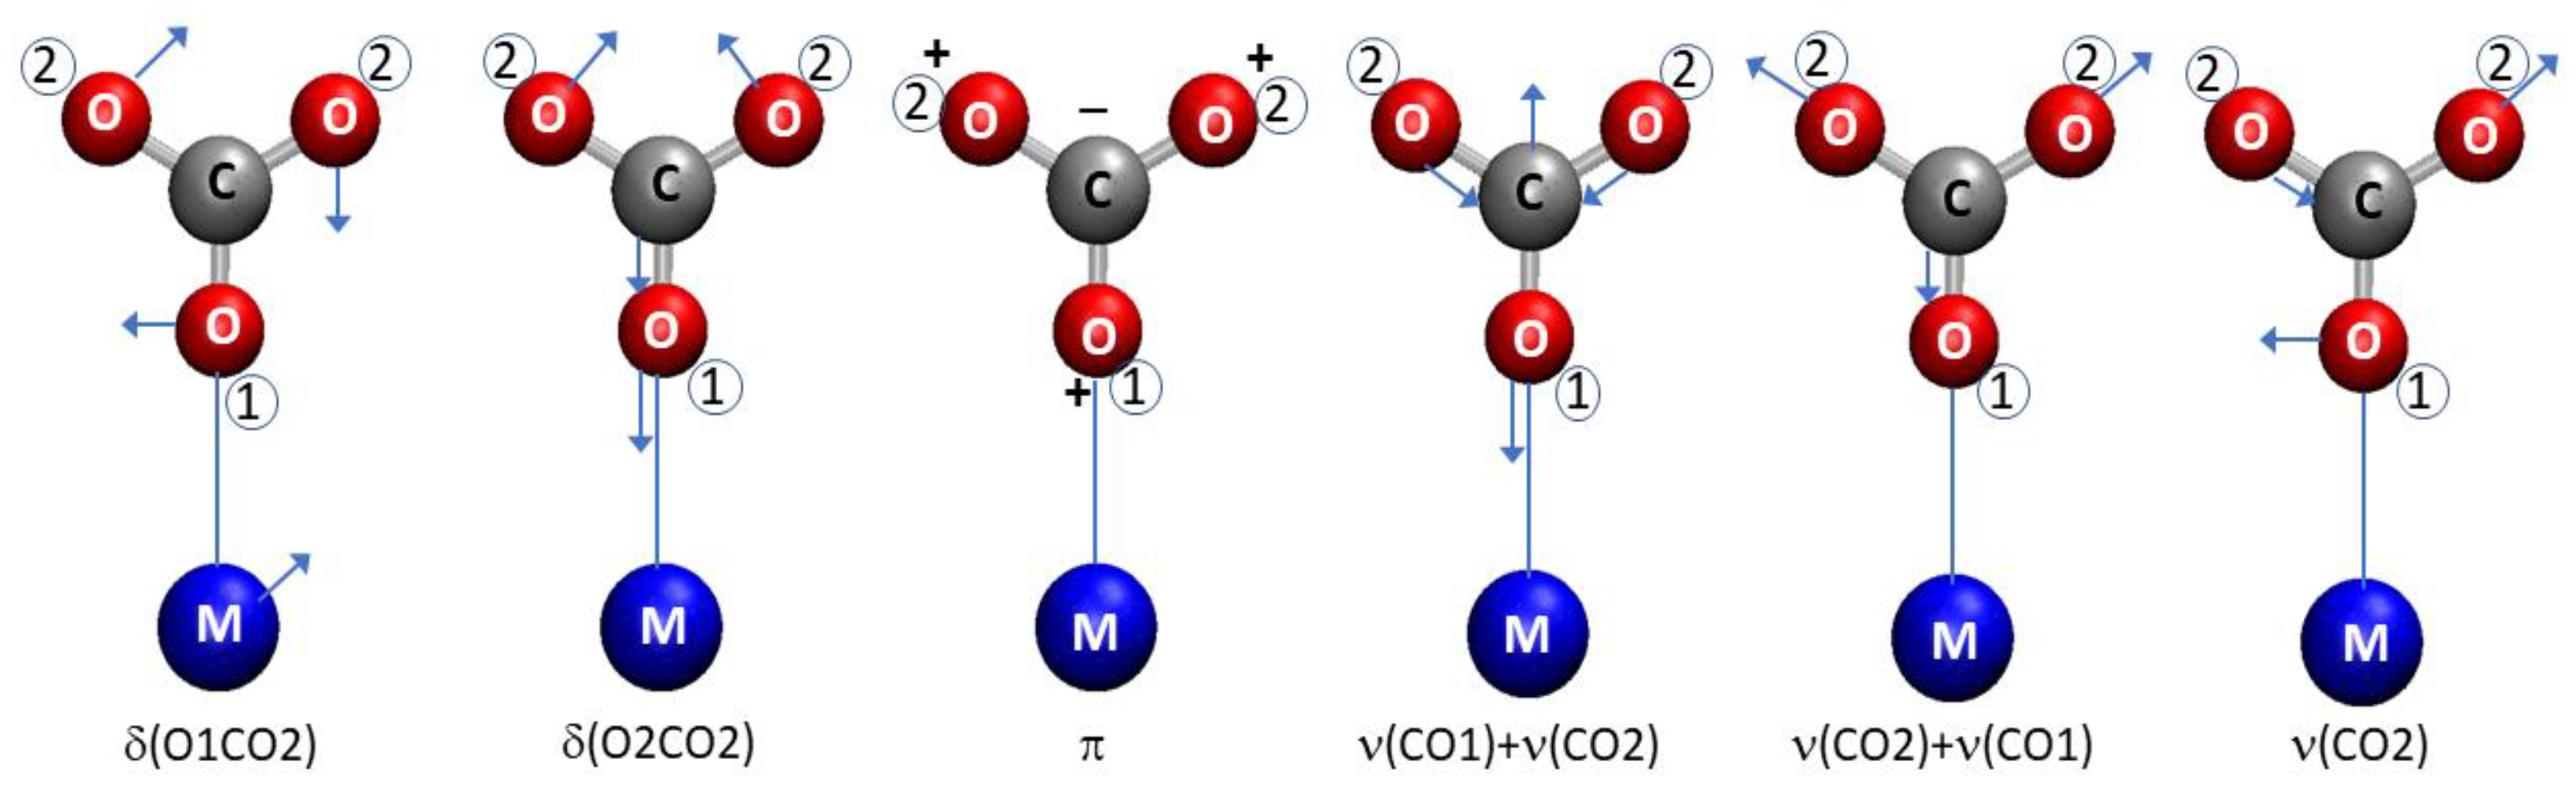
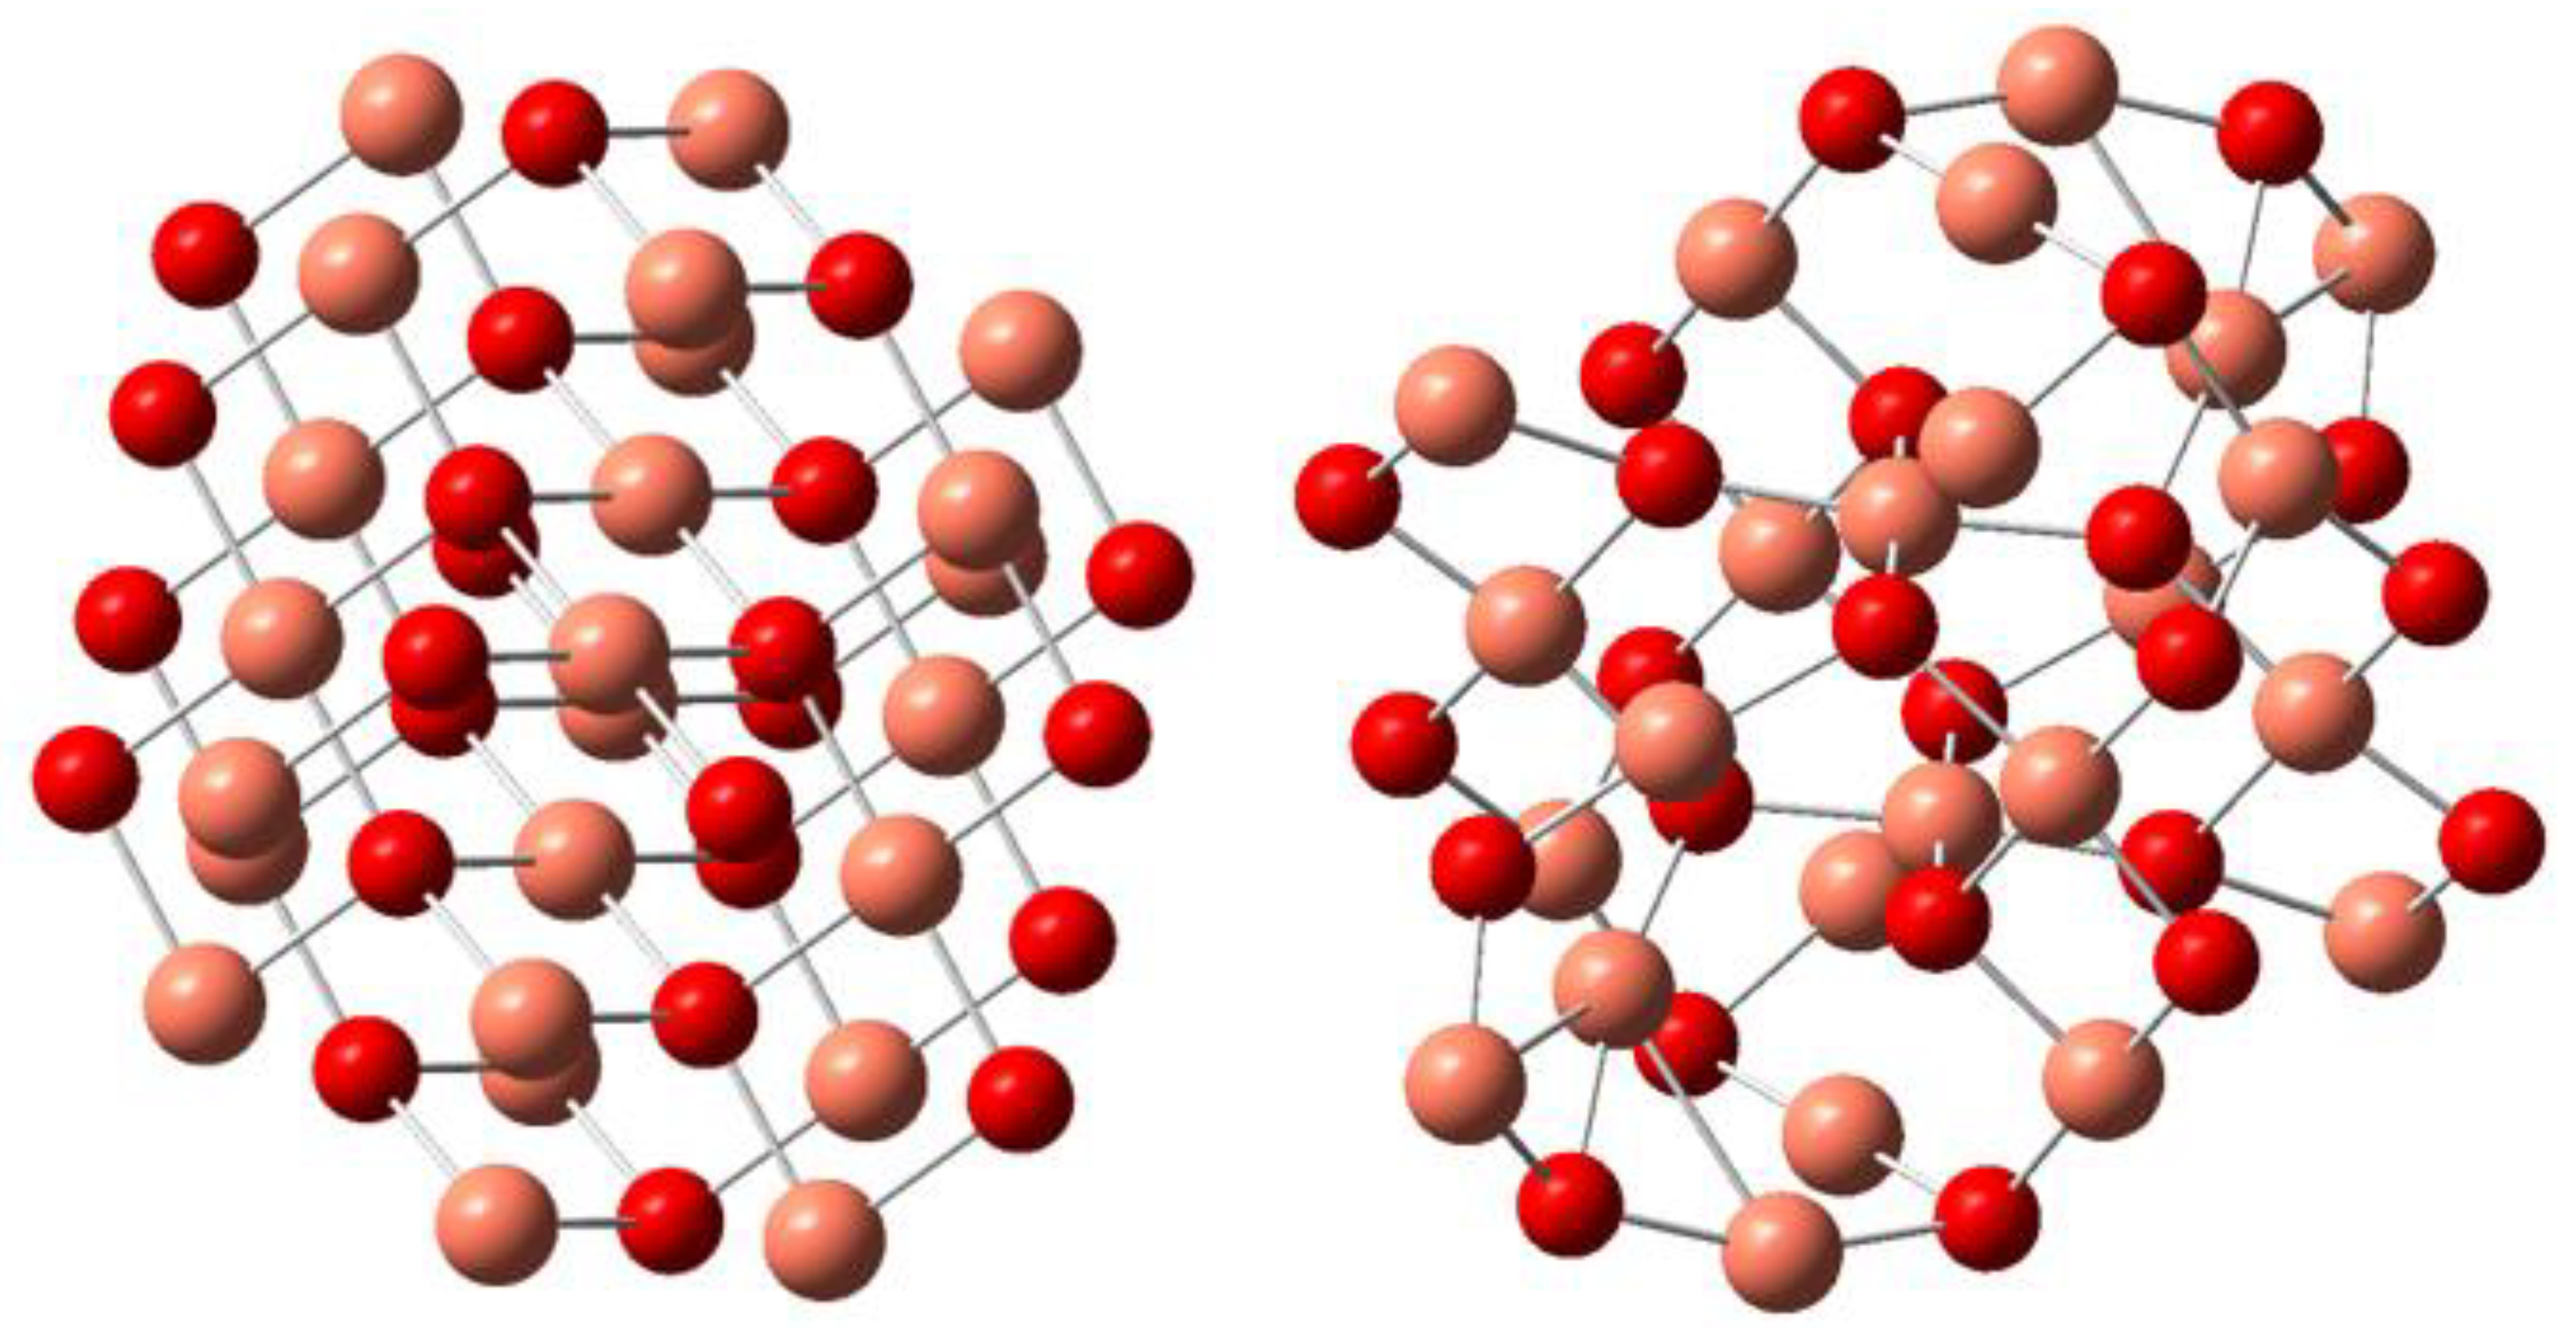
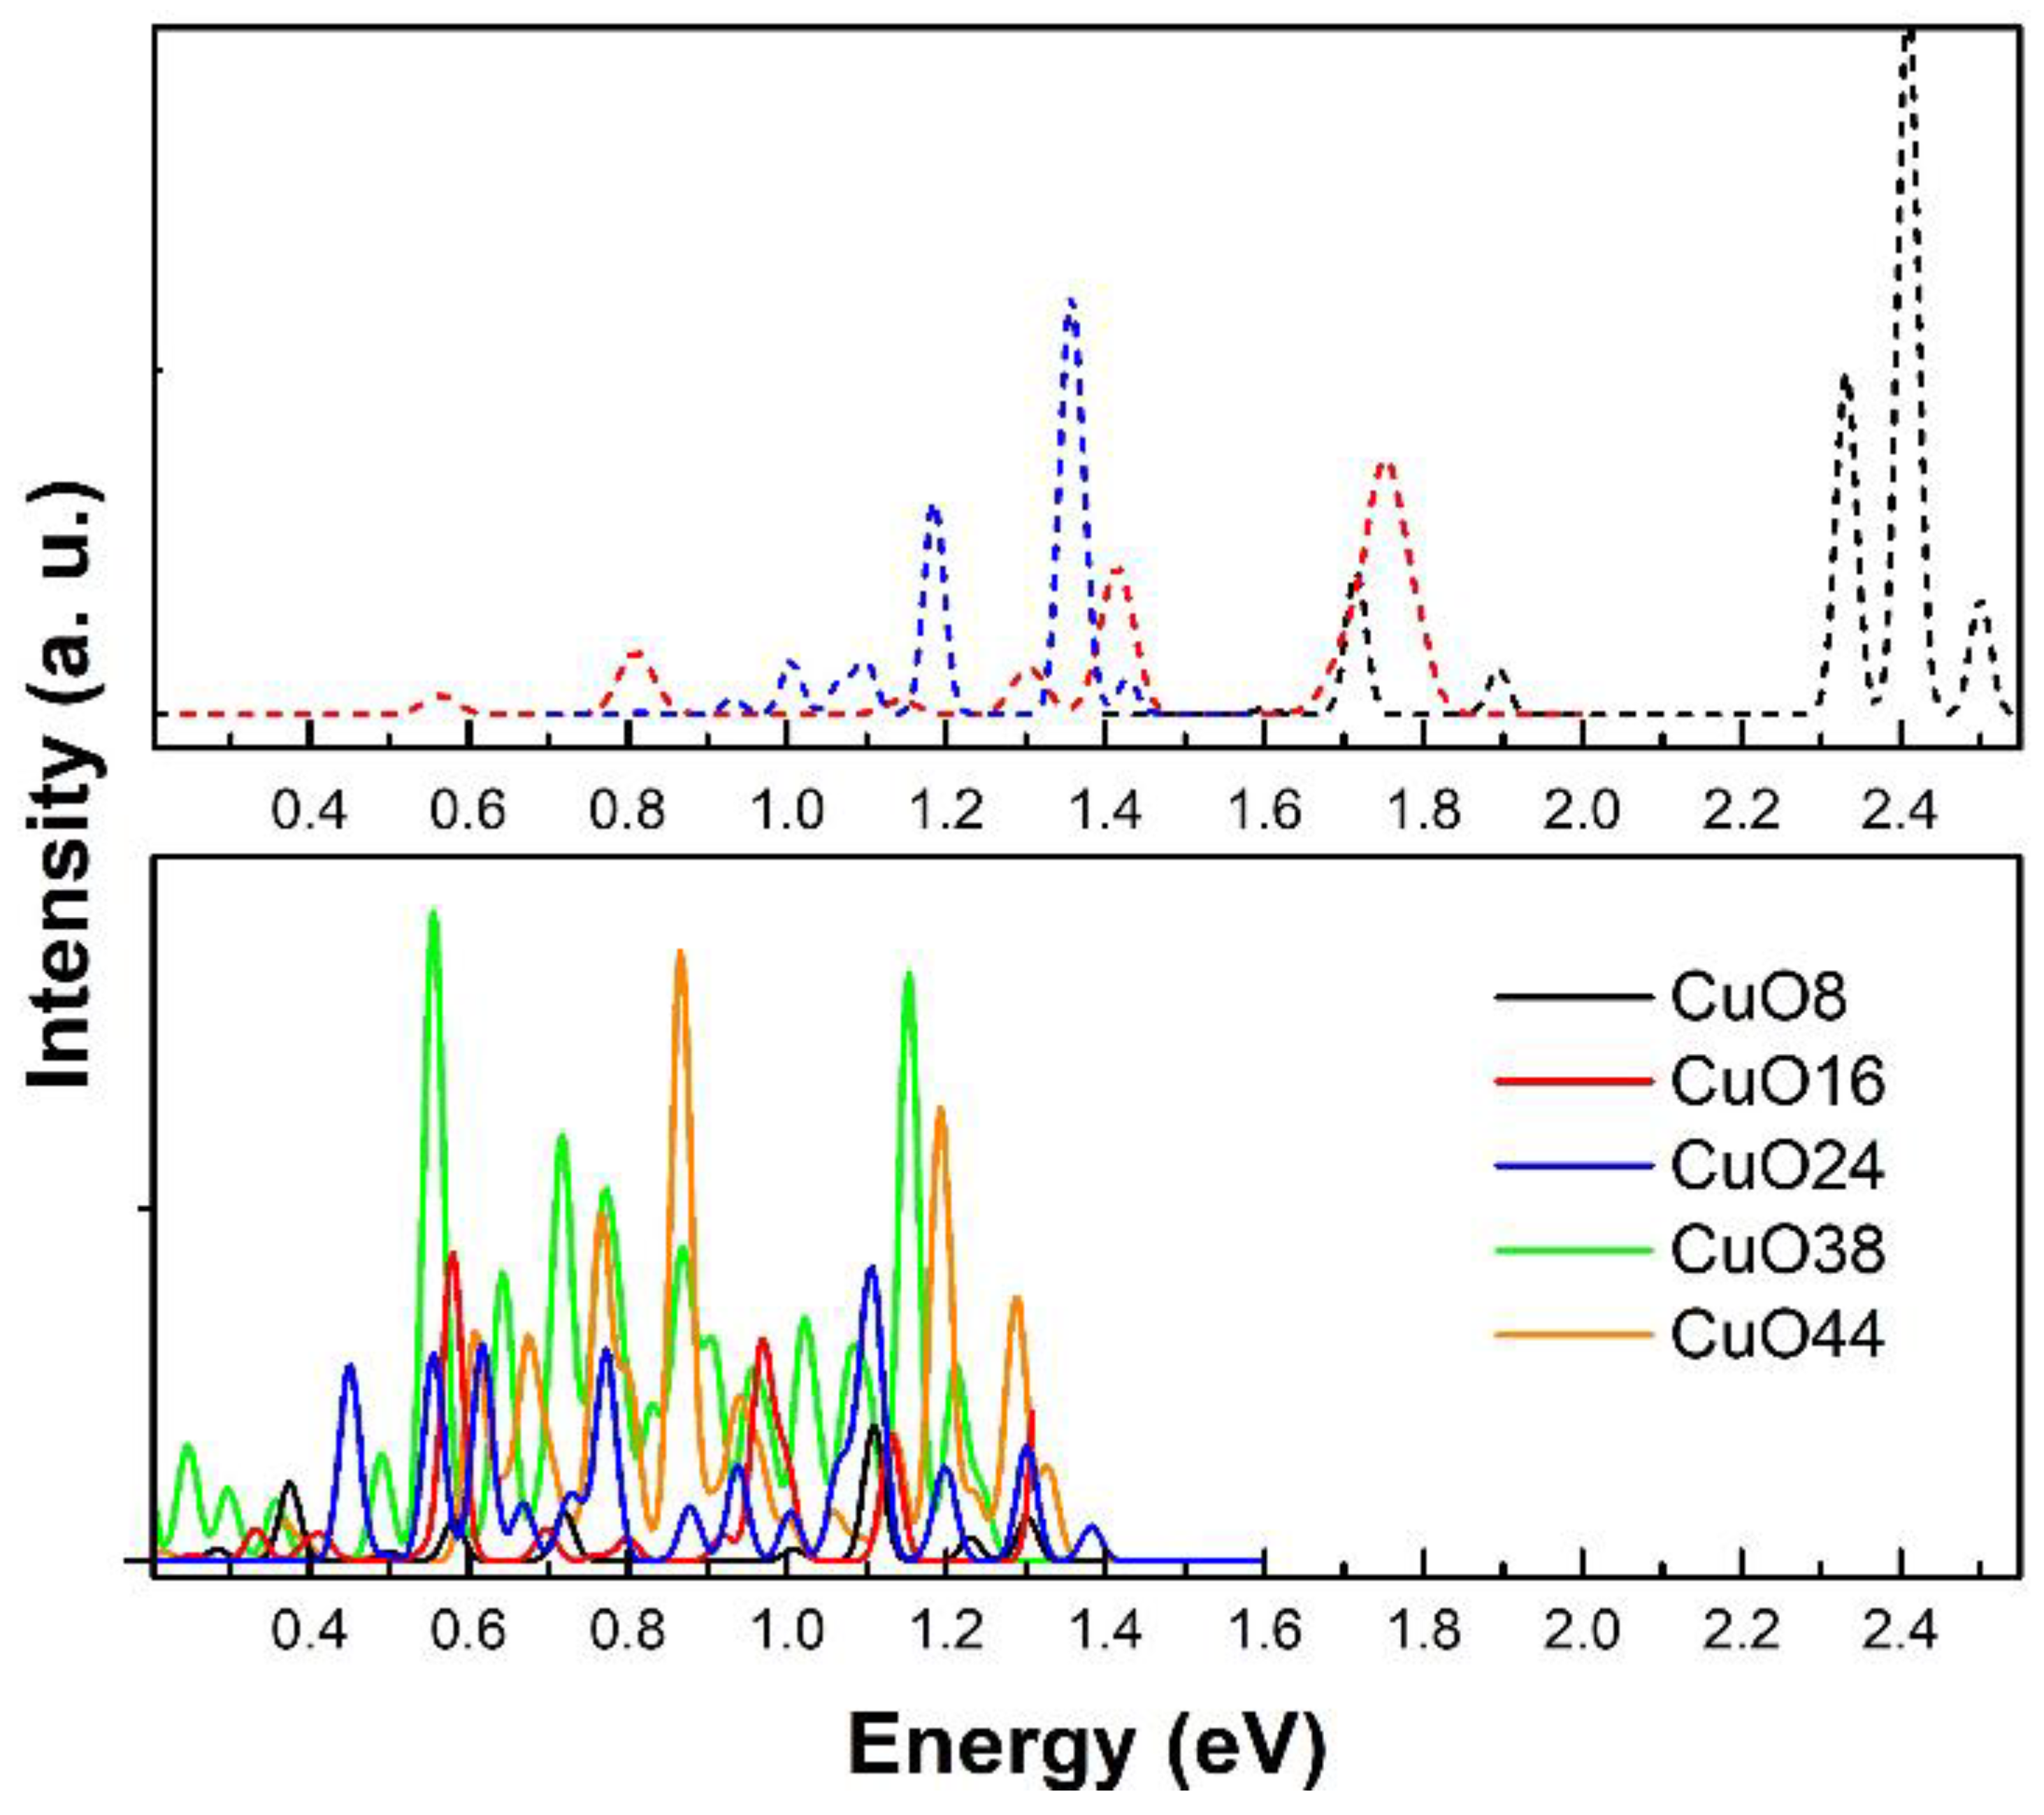
3.1.5. Theoretical Spectra
4. Conclusions
Supplementary Materials
Author Contributions
Funding
Institutional Review Board Statement
Data Availability Statement
Acknowledgments
Conflicts of Interest
References
- Wang, X.-F.; Kitao, O.; Hosono, E.; Zhou, H.; Sasaki, S.; Tamiaki, H. TiO2- and ZnO-Based Solar Cells Using a Chlorophyll a Derivative Sensitizer for Light-Harvesting and Energy Conversion. J. Photochem. Photobiol. A Chem. 2010, 210, 145–152. [Google Scholar] [CrossRef]
- Rani, S.; Suri, P.; Shishodia, P.; Mehra, R. Synthesis of Nanocrystalline ZnO Powder via Sol–Gel Route for Dye-Sensitized Solar Cells. Sol. Energy Mater. Sol. Cells 2008, 92, 1639–1645. [Google Scholar] [CrossRef]
- Li, W.Y.; Xu, L.N.; Chen, J. Co3O4 Nanomaterials in Lithium-Ion Batteries and Gas Sensors. Adv. Funct. Mater. 2005, 15, 851–857. [Google Scholar] [CrossRef]
- Carbone, M. Cu Zn Co Nanosized Mixed Oxides Prepared from Hydroxycarbonate Precursors. J. Alloys Compd. 2016, 688, 202–209. [Google Scholar] [CrossRef]
- Lorenzut, B.; Montini, T.; De Rogatis, L.; Canton, P.; Benedetti, A.; Fornasiero, P. Hydrogen Production through Alcohol Steam Reforming on Cu/ZnO-Based Catalysts. Appl. Catal. B 2011, 101, 397–408. [Google Scholar] [CrossRef]
- Zander, S.; Kunkes, E.L.; Schuster, M.E.; Schumann, J.; Weinberg, G.; Teschner, D.; Jacobsen, N.; Schlögl, R.; Behrens, M. The Role of the Oxide Component in the Development of Copper Composite Catalysts for Methanol Synthesis. Angew. Chem. Int. Ed. 2013, 52, 6536–6540. [Google Scholar] [CrossRef] [PubMed]
- Carbone, M.; Tagliatesta, P. NiO Grained-Flowers and Nanoparticles for Ethanol Sensing. Materials 2020, 13, 1880. [Google Scholar] [CrossRef] [Green Version]
- Carbone, M. CQDs@NiO: An Efficient Tool for CH4 Sensing. Appl. Sci. 2020, 10, 6251. [Google Scholar] [CrossRef]
- Carbone, M.; Aneggi, E.; Figueredo, F.; Susmel, S. NiO-Nanoflowers Decorating a Plastic Electrode for the Non-Enzymatic Amperometric Detection of H2O2 in Milk: Old Issue, New Challenge. Food Control 2022, 132, 108549. [Google Scholar] [CrossRef]
- Babazadeh, S.; Bisauriya, R.; Carbone, M.; Roselli, L.; Cecchetti, D.; Bauer, E.M.; Sennato, S.; Prosposito, P.; Pizzoferrato, R. Colorimetric Detection of Chromium(VI) Ions in Water Using Unfolded-Fullerene Carbon Nanoparticles. Sensors 2021, 21, 6353. [Google Scholar] [CrossRef]
- Hossain, F.; Perales-Perez, O.J.; Hwang, S.; Román, F. Antimicrobial Nanomaterials as Water Disinfectant: Applications, Limitations and Future Perspectives. Sci. Total Environ. 2014, 466–467, 1047–1059. [Google Scholar] [CrossRef]
- Baek, Y.-W.; An, Y.-J. Microbial Toxicity of Metal Oxide Nanoparticles (CuO, NiO, ZnO, and Sb2O3) to Escherichia coli, Bacillus subtilis, and Streptococcus aureus. Sci. Total Environ. 2011, 409, 1603–1608. [Google Scholar] [CrossRef] [PubMed]
- Carbone, M.; Briancesco, R.; Bonadonna, L. Antimicrobial Power of Cu/Zn Mixed Oxide Nanoparticles to Escherichia coli. Environ. Nanotechnol. Monit. Manag. 2017, 7, 97–102. [Google Scholar] [CrossRef]
- Holban, A.M.; Grumezescu, A.M.; Andronescu, E. Inorganic Nanoarchitectonics Designed for Drug Delivery and Anti-Infective Surfaces. In Surface Chemistry of Nanobiomaterials; Elsevier: Amsterdam, The Netherlands, 2016; pp. 301–327. [Google Scholar]
- Zhu, J.; Li, D.; Chen, H.; Yang, X.; Lu, L.; Wang, X. Highly Dispersed CuO Nanoparticles Prepared by a Novel Quick-Precipitation Method. Mater. Lett. 2004, 58, 3324–3327. [Google Scholar] [CrossRef]
- Marino, E.; Huijser, T.; Creyghton, Y.; van der Heijden, A. Synthesis and Coating of Copper Oxide Nanoparticles Using Atmospheric Pressure Plasmas. Surf. Coat. Technol. 2007, 201, 9205–9208. [Google Scholar] [CrossRef]
- Brayner, R.; Dahoumane, S.A.; Yéprémian, C.; Djediat, C.; Meyer, M.; Couté, A.; Fiévet, F. ZnO Nanoparticles: Synthesis, Characterization, and Ecotoxicological Studies. Langmuir 2010, 26, 6522–6528. [Google Scholar] [CrossRef] [PubMed]
- Lin, D.; Xing, B. Root Uptake and Phytotoxicity of ZnO Nanoparticles. Environ. Sci. Technol. 2008, 42, 5580–5585. [Google Scholar] [CrossRef]
- Carbone, M. Zn Defective ZnCo2O4 Nanorods as High Capacity Anode for Lithium Ion Batteries. J. Electroanal. Chem. 2018, 815, 151–157. [Google Scholar] [CrossRef]
- Carbone, M.; Sabbatella, G.; Antonaroli, S.; Remita, H.; Orlando, V.; Biagioni, S.; Nucara, A. Exogenous Control over Intracellular Acidification: Enhancement via Proton Caged Compounds Coupled to Gold Nanoparticles. Biochim. Biophys. Acta—Gen. Subj. 2015, 1850, 2304–2307. [Google Scholar] [CrossRef] [Green Version]
- Carbone, M.; Missori, M.; Micheli, L.; Tagliatesta, P.; Bauer, E.M. NiO Pseudocapacitance and Optical Properties: Does the Shape Win? Materials 2020, 13, 1417. [Google Scholar] [CrossRef] [Green Version]
- Valentini, F.; Ciambella, E.; Boaretto, A.; Rizzitelli, G.; Carbone, M.; Conte, V.; Cataldo, F.; Russo, V.; Casari, C.S.; Chillura-Martino, D.F.; et al. Sensor Properties of Pristine and Functionalized Carbon Nanohorns. Electroanalysis 2016, 28, 2489–2499. [Google Scholar] [CrossRef]
- Kim, J.W.; Carbone, M.; Tallarida, M.; Dil, J.H.; Horn, K.; Casaletto, M.P.; Flammini, R.; Piancastelli, M.N. Adsorption of 2,3-Butanediol on Si(1 0 0). Surf. Sci. 2004, 559, 179–185. [Google Scholar] [CrossRef]
- Donia, D.T.; Bauer, E.M.; Missori, M.; Roselli, L.; Cecchetti, D.; Tagliatesta, P.; Gontrani, L.; Carbone, M. Room Temperature Syntheses of ZnO and Their Structures. Symmetry 2021, 13, 733. [Google Scholar] [CrossRef]
- Limosani, F.; Bauer, E.M.; Cecchetti, D.; Biagioni, S.; Orlando, V.; Pizzoferrato, R.; Prosposito, P.; Carbone, M. Top-Down N-Doped Carbon Quantum Dots for Multiple Purposes: Heavy Metal Detection and Intracellular Fluorescence. Nanomaterials 2021, 11, 2249. [Google Scholar] [CrossRef] [PubMed]
- Tripathi, A.; Dixit, T.; Agrawal, J.; Singh, V. Bandgap Engineering in CuO Nanostructures: Dual-Band, Broadband, and UV-C Photodetectors. Appl. Phys. Lett. 2020, 116, 111102. [Google Scholar] [CrossRef]
- Habibi, M.H.; Karimi, B. Preparation of Nanostructure CuO/ZnO Mixed Oxide by Sol–Gel Thermal Decomposition of a CuCO3 and ZnCO3: TG, DTG, XRD, FESEM and DRS Investigations. J. Ind. Eng. Chem. 2014, 20, 925–929. [Google Scholar] [CrossRef]
- Habibi, M.H.; Karimi, B. Effect of the Annealing Temperature on Crystalline Phase of Copper Oxide Nanoparticle by Copper Acetate Precursor and Sol–Gel Method. J. Therm. Anal. Calorim. 2014, 115, 419–423. [Google Scholar] [CrossRef]
- Wang, Y.; Zhang, S.; Xiao, D.; Wang, S.; Zhang, T.; Yang, X.; Heng, S.; Sun, M. CuO/WO3 Hollow Microsphere P-N Heterojunction Sensor for Continuous Cycle Detection of H2S Gas. Sens. Actuators B Chem. 2023, 374, 132823. [Google Scholar] [CrossRef]
- Onthath, H.; Maurya, M.R.; Bykkam, S.; Morsy, H.; Ibrahim, M.; Ahmed, A.E.; Riyaz, N.; Abuznad, R.; Alruwaili, A.; Kumar, B.; et al. Development and Fabrication of Carbon Nanotube (CNT)/CuO Nanocomposite for Volatile Organic Compounds (VOCs) Gas Sensor Application. Macromol. Symp. 2021, 400, 2100202. [Google Scholar] [CrossRef]
- Jamal, M.; Billah, M.M.; Ayon, S.A. Opto-Structural and Magnetic Properties of Fluorine Doped CuO Nanoparticles: An Experimental Study. Ceram. Int. 2022, 49, 10107–10118. [Google Scholar] [CrossRef]
- Li, C.-J.; Xu, Y.-T.; Lu, M.-J.; Li, Y.-M.; Ban, R.; Hu, J.; Gao, G.; Dong, X.-Y.; Zhou, H.; Lin, P.; et al. Semiconducting Metal-Organic Framework Derivatives-Gated Organic Photoelectrochemical Transistor Immunoassay. Biosens. Bioelectron. 2022, 217, 114700. [Google Scholar] [CrossRef] [PubMed]
- Golmohammadi, M.; Sattari, M. Catalytic Supercritical Water Oxidation of Tri-n-Butyl Phosphate: Process Optimization by Response Surface Methodology and Cytotoxicity Assessment. Ceram. Int. 2022, 48, 36401–36409. [Google Scholar] [CrossRef]
- Li, J.; Guo, J.; Zhang, J.; Sun, Z.; Gao, J. Surface Etching and Photodeposition Nanostructures Core-Shell Cu2O@CuO-Ag with S-Scheme Heterojunction for High Efficiency Photocatalysis. Surf. Interfaces 2022, 34, 102308. [Google Scholar] [CrossRef]
- Lo, C.-H.; Tsung, T.-T.; Chen, L.-C. Fabrication and Characterization of CuO Nanorods by a Submerged Arc Nanoparticle Synthesis System. J. Vac. Sci. Technol. B Microelectron. Nanometer Struct. 2005, 23, 2394–2397. [Google Scholar] [CrossRef]
- Ahmed Shehab, M.; Szőri-Dorogházi, E.; Szabó, S.; Valsesia, A.; Chauhan, T.; Koós, T.; Muránszky, G.; Szabó, T.; Hernadi, K.; Németh, Z. Virus and Bacterial Removal Ability of TiO2 Nanowire-Based Self-Supported Hybrid Membranes. Arab. J. Chem. 2023, 16, 104388. [Google Scholar] [CrossRef]
- Agredo–Trochez, Y.A.; Molano-Cabezas, A.C.; Arciniegas-Grijalba, P.A.; Rodríguez-Páez, J.E. Nanoparticles of Magnesium Oxyhydroxide and Copper Oxide: Synthesis and Evaluation of Their in Vitro Fungicidal Activity on the Fungus omphalia sp. Inorg. Chem. Commun. 2022, 146, 110085. [Google Scholar] [CrossRef]
- Gvozdenko, A.A.; Siddiqui, S.A.; Blinov, A.v.; Golik, A.B.; Nagdalian, A.A.; Maglakelidze, D.G.; Statsenko, E.N.; Pirogov, M.A.; Blinova, A.A.; Sizonenko, M.N.; et al. Synthesis of CuO Nanoparticles Stabilized with Gelatin for Potential Use in Food Packaging Applications. Sci. Rep. 2022, 12, 12843. [Google Scholar] [CrossRef]
- Saleh, A.K.; El-Gendi, H.; El-Fakharany, E.M.; Owda, M.E.; Awad, M.A.; Kamoun, E.A. Exploitation of Cantaloupe Peels for Bacterial Cellulose Production and Functionalization with Green Synthesized Copper Oxide Nanoparticles for Diverse Biological Applications. Sci. Rep. 2022, 12, 19241. [Google Scholar] [CrossRef]
- Kalati, M.; Akhbari, K. Copper(II) Nitrate and Copper(II) Oxide Loading on ZIF-8; Synthesis, Characterization and Antibacterial Activity. J. Porous Mater. 2022, 29, 1909–1917. [Google Scholar] [CrossRef]
- Elwakil, B.H.; Toderas, M.; El-Khatib, M. Arc Discharge Rapid Synthesis of Engineered Copper Oxides Nano Shapes with Potent Antibacterial Activity against Multi-Drug Resistant Bacteria. Sci. Rep. 2022, 12, 20209. [Google Scholar] [CrossRef]
- Mahmood, R.I.; Kadhim, A.A.; Ibraheem, S.; Albukhaty, S.; Mohammed-Salih, H.S.; Abbas, R.H.; Jabir, M.S.; Mohammed, M.K.A.; Nayef, U.M.; AlMalki, F.A.; et al. Biosynthesis of Copper Oxide Nanoparticles Mediated Annona Muricata as Cytotoxic and Apoptosis Inducer Factor in Breast Cancer Cell Lines. Sci. Rep. 2022, 12, 16165. [Google Scholar] [CrossRef] [PubMed]
- Gupta, G.; Cappellini, F.; Farcal, L.; Gornati, R.; Bernardini, G.; Fadeel, B. Copper Oxide Nanoparticles Trigger Macrophage Cell Death with Misfolding of Cu/Zn Superoxide Dismutase 1 (SOD1). Part. Fibre Toxicol. 2022, 19, 33. [Google Scholar] [CrossRef] [PubMed]
- Liu, Y.; Xu, J.; Li, H.; Cai, S.; Hu, H.; Fang, C.; Shi, L.; Zhang, D. Rational Design and in Situ Fabrication of MnO2@NiCo2O4 Nanowire Arrays on Ni Foam as High-Performance Monolith de-NOx Catalysts. J. Mater. Chem. A Mater. 2015, 3, 11543–11553. [Google Scholar] [CrossRef]
- Fei, Z.; Lu, P.; Feng, X.; Sun, B.; Ji, W. Geometrical Effect of CuO Nanostructures on Catalytic Benzene Combustion. Catal. Sci. Technol. 2012, 2, 1705–1710. [Google Scholar] [CrossRef]
- Huang, M.H.; Rej, S.; Hsu, S.-C. Facet-Dependent Properties of Polyhedral Nanocrystals. Chem. Commun. 2014, 50, 1634–1644. [Google Scholar] [CrossRef]
- Waqas Alam, M.; Khatoon, U.; Qurashi, A. Synthesis and Characterization of Cu-SnO2 Nanoparticles Deposited on Glass Using Ultrasonic Spray Pyrolysis and Their H2S Sensing Properties. Curr. Nanosci. 2012, 8, 919–924. [Google Scholar] [CrossRef]
- Alam, M.W.; Ansari, M.Z.; Aamir, M.; Waheed-Ur-Rehman, M.; Parveen, N.; Ansari, S.A. Preparation and Characterization of Cu and Al Doped ZnO Thin Films for Solar Cell Applications. Crystals 2022, 12, 128. [Google Scholar] [CrossRef]
- Naz, S.; Gul, A.; Zia, M.; Javed, R. Synthesis, Biomedical Applications, and Toxicity of CuO Nanoparticles. Appl. Microbiol. Biotechnol. 2023, 107, 1039–1061. [Google Scholar] [CrossRef]
- Ahmad, M.; Kotb, H.; Mushtaq, S.; Waheed-Ur-Rehman, M.; Maghanga, C.; Alam, M. Green Synthesis of Mn + Cu Bimetallic Nanoparticles Using Vinca Rosea Extract and Their Antioxidant, Antibacterial, and Catalytic Activities. Crystals 2022, 12, 72. [Google Scholar] [CrossRef]
- Stojanovic, B.D.; Dzunuzovic, A.S.; Ilic, N.I. Review of Methods for the Preparation of Magnetic Metal Oxides. In Magnetic, Ferroelectric and Multiferroic Metal Oxides; Elsevier: Amsterdam, The Netherlands, 2018; pp. 333–359. [Google Scholar]
- Blinov, A.; Gvozdenko, A.; Golik, A.; Siddiqui, S.A.; Göğüş, F.; Blinova, A.; Maglakelidze, D.; Shevchenko, I.; Rebezov, M.; Nagdalian, A. Effect of MnxOy Nanoparticles Stabilized with Methionine on Germination of Barley Seeds (Hordeum vulgare L.). Nanomaterials 2023, 13, 1577. [Google Scholar] [CrossRef]
- Yadav, V.K.; Ali, D.; Khan, S.H.; Gnanamoorthy, G.; Choudhary, N.; Yadav, K.K.; Thai, V.N.; Hussain, S.A.; Manhrdas, S. Synthesis and Characterization of Amorphous Iron Oxide Nanoparticles by the Sonochemical Method and Their Application for the Remediation of Heavy Metals from Wastewater. Nanomaterials 2020, 10, 1551. [Google Scholar] [CrossRef] [PubMed]
- Blinov, A.V.; Kachanov, M.D.; Gvozdenko, A.A.; Nagdalian, A.A.; Blinova, A.A.; Rekhman, Z.A.; Golik, A.B.; Vakalov, D.S.; Maglakelidze, D.G.; Nagapetova, A.G.; et al. Synthesis and Characterization of Zinc Oxide Nanoparticles Stabilized with Biopolymers for Application in Wound-Healing Mixed Gels. Gels 2023, 9, 57. [Google Scholar] [CrossRef] [PubMed]
- Caminiti, R.; Carbone, M.; Panero, S.; Sadun, C. Conductivity and Structure of Poly(ethylene glycol) Complexes Using Energy Dispersive X-ray Diffraction. J. Chem. Phys. B 1999, 103, 10348–10355. [Google Scholar] [CrossRef]
- Ponomarenko, L.A.; Schedin, F.; Katsnelson, M.I.; Yang, R.; Hill, E.W.; Novoselov, K.S.; Geim, A.K. Chaotic Dirac Billiard in Graphene Quantum Dots. Science 2008, 320, 356–358. [Google Scholar] [CrossRef] [PubMed] [Green Version]
- Zeng, H.C. Ostwald Ripening: A Synthetic Approach for Hollow Nanomaterials. Curr. Nanosci. 2007, 3, 177–181. [Google Scholar] [CrossRef]
- Ogwu, A.A.; Darma, T.H.; Bouquerel, E. Electrical Resistivity of Copper Oxide Thin Films Prepared by Reactive Magnetron Sputtering. J. Achiev. Mater. Manuf. Eng. 2007, 24, 172–177. [Google Scholar]
- Yang, M.; He, J.; Hu, X.; Yan, C.; Cheng, Z. CuO Nanostructures as Quartz Crystal Microbalance Sensing Layers for Detection of Trace Hydrogen Cyanide Gas. Environ. Sci. Technol. 2011, 45, 6088–6094. [Google Scholar] [CrossRef]
- Borgohain, K.; Mahamuni, S. Formation of Single-Phase CuO Quantum Particles. J. Mater. Res. 2002, 17, 1220–1223. [Google Scholar] [CrossRef]
- Zihan, J.; Yang, Z.; Dongmei, Y.; Yang, J.; Jiaming, S.; Peng, H.; Haibo, F.; Feng, T. Multifunctional optoelectronic device based on CuO/ZnO heterojunction structure. J. Lumin. 2023, 257, 119762. [Google Scholar] [CrossRef]
- Sawicka-Chudy, P.; Sibiński, M.; Wisz, G.; Rybak-Wilusz, E.; Cholewa, M. Numerical Analysis and Optimization of Cu2O/TiO2, CuO/TiO2, Heterojunction Solar Cells Using SCAPS. J. Phys. Conf. Ser. 2018, 1033, 012002. [Google Scholar] [CrossRef] [Green Version]
- Ghijsen, J.; Tjeng, L.H.; van Elp, J.; Eskes, H.; Westerink, J.; Sawatzky, G.A.; Czyzyk, M.T. Electronic Structure of Cu2O and CuO. Phys. Rev. B 1988, 38, 11322–11330. [Google Scholar] [CrossRef]
- Grioni, M.; Czyzyk, M.T.; de Groot, F.M.F.; Fuggle, J.C.; Watts, B.E. Unoccupied Electronic States of CuO: An Oxygen 1s X-ray-Absorption Spectroscopy Investigation. Phys. Rev. B 1989, 39, 4886–4890. [Google Scholar] [CrossRef]
- Heinemann, M.; Eifert, B.; Heiliger, C. Band Structure and Phase Stability of the Copper Oxides Cu2O, CuO, and Cu3O4. Phys. Rev. B 2013, 87, 115111. [Google Scholar] [CrossRef]
- Wu, D.; Zhang, Q.; Tao, M. LSDA+U Study of Cupric Oxide: Electronic Structure and Native Point Defects. Phys. Rev. B 2006, 73, 235206. [Google Scholar] [CrossRef]
- Lany, S. Band-Structure Calculations for the 3d Transition Metal Oxides in GW. Phys. Rev. B 2013, 87, 085112. [Google Scholar] [CrossRef] [Green Version]
- Rödl, C.; Sottile, F.; Reining, L. Quasiparticle Excitations in the Photoemission Spectrum of CuO from First Principles: A GW Study. Phys. Rev. B 2015, 91, 045102. [Google Scholar] [CrossRef]
- Wang, Y.; Lany, S.; Ghanbaja, J.; Fagot-Revurat, Y.; Chen, Y.P.; Soldera, F.; Horwat, D.; Mücklich, F.; Pierson, J.F. Electronic Structures of Cu2O, Cu4O3, and CuO: A Joint Experimental and Theoretical Study. Phys. Rev. B 2016, 94, 245418. [Google Scholar] [CrossRef] [Green Version]
- Ramannathan, C.; Subramanian, S.; Valantina, R. Structural and Electronic Properties of CuO, CuO2 and Cu2O Nanoclusters—A DFT approach. Mater. Sci. 2015, 21, 173–178. [Google Scholar] [CrossRef] [Green Version]
- Wang, B.; Nagase, S.; Zhao, J.; Wang, G. Structural Growth Sequences and Electronic Properties of Zinc Oxide Clusters (ZnO)n (n = 2–18). J. Phys. Chem. C 2007, 111, 4956–4963. [Google Scholar] [CrossRef]
- Pandey, D.K.; Kagdada, H.L.; Materny, A.; Singh, D.K. Hybrid Structure of Ionic Liquid and ZnO Nano Clusters for Potential Application in Dye-Sensitized Solar Cells. J. Mol. Liq. 2021, 322, 114538. [Google Scholar] [CrossRef]
- Gontrani, L.; Pulci, O.; Carbone, M.; Pizzoferrato, R.; Prosposito, P. Detection of Heavy Metals in Water Using Graphene Oxide Quantum Dots: An Experimental and Theoretical Study. Molecules 2021, 26, 5519. [Google Scholar] [CrossRef]
- Downs, R.T.; Hall-Wallace, M. The American Mineralogist Crystal Structure Database. Am. Mineral. 2003, 88, 247–250. [Google Scholar]
- Niggli, P. XII. Die Kristallstruktur Einiger Oxyde I. Z. Krist. Cryst. Mater. 1922, 57, 253–299. [Google Scholar] [CrossRef] [Green Version]
- Sigurdarson, J.J.; Svane, S.; Karring, H. The Molecular Processes of Urea Hydrolysis in Relation to Ammonia Emissions from Agriculture. Rev. Environ. Sci. Biotechnol. 2018, 17, 241–258. [Google Scholar] [CrossRef] [Green Version]
- Adamo, C.; Barone, V. Toward Reliable Density Functional Methods without Adjustable Parameters: The PBE0 Model. J. Chem. Phys. 1999, 110, 6158–6170. [Google Scholar] [CrossRef]
- Heyd, J.; Scuseria, G.E. Efficient Hybrid Density Functional Calculations in Solids: Assessment of the Heyd–Scuseria–Ernzerhof Screened Coulomb Hybrid Functional. J. Chem. Phys. 2004, 121, 1187–1192. [Google Scholar] [CrossRef] [Green Version]
- Yanai, T.; Tew, D.P.; Handy, N.C. A New Hybrid Exchange–Correlation Functional Using the Coulomb-Attenuating Method (CAM-B3LYP). Chem. Phys. Lett. 2004, 393, 51–57. [Google Scholar] [CrossRef] [Green Version]
- Henderson, T.M.; Izmaylov, A.F.; Scalmani, G.; Scuseria, G.E. Can Short-Range Hybrids Describe Long-Range-Dependent Properties? J. Chem. Phys. 2009, 131, 044108. [Google Scholar] [CrossRef]
- Macrae, C.F.; Sovago, I.; Cottrell, S.J.; Galek, P.T.A.; McCabe, P.; Pidcock, E.; Platings, M.; Shields, G.P.; Stevens, J.S.; Towler, M.; et al. Mercury 4.0: From Visualization to Analysis, Design and Prediction. J. Appl. Cryst. 2020, 53, 226–235. [Google Scholar] [CrossRef] [Green Version]
- Humphrey, W.; Dalke, A.; Schulten, K. VMD—Visual Molecular Dynamics. J. Mol. Graph. 1996, 14, 33–38. [Google Scholar] [CrossRef]
- Frisch, M.J.; Trucks, G.W.; Schlegel, H.B.; Scuseria, G.E.; Robb, M.A.; Cheeseman, J.R.; Scalmani, G.; Barone, V.; Petersson, G.A.; Nakatsuji, H.; et al. Gaussian 16 Revision A.03. 2016. [Google Scholar]
- Gijs Schaftenaar Molden. Available online: https://www3.cmbi.umcn.nl/molden (accessed on 22 June 2023).
- Dennington, R.; Keith, T.A.; Millam, J.M. GaussView Version 6. 2019. [Google Scholar]
- Seiferth, O.; Wolter, K.; Dillmann, B.; Klivenyi, G.; Freund, H.-J.; Scarano, D.; Zecchina, A. IR Investigations of CO2 Adsorption on Chromia Surfaces: Cr2O3 (0001)/Cr(110) versus Polycrystalline α-Cr2O3. Surf. Sci. 1999, 421, 176–190. [Google Scholar] [CrossRef]
- Menzies, A.C. The Normal Vibrations of Carbonate and Nitrate Ions. Proc. R. Soc. Lond. Ser. A Contain. Pap. Math. Phys. Character 1931, 134, 265–277. [Google Scholar] [CrossRef]
- Guha, S.; Peebles, D.; Terence Wieting, J. Raman and Infrared Studies of Cupric Oxide. Bull. Mater. Sci. 1991, 14, 539–543. [Google Scholar] [CrossRef]
- Chen, C.; Zheng, Y.; Zhan, Y.; Lin, X.; Zheng, Q.; Wei, K. Reduction of Nanostructured CuO Bundles: Correlation between Microstructure and Reduction Properties. Cryst. Growth Des. 2008, 8, 3549–3554. [Google Scholar] [CrossRef]
- Gherasim, C.; Pascariu, P.; Asandulesa, M.; Dobromir, M.; Doroftei, F.; Fifere, N.; Dascalu, A.; Airinei, A. Copper Oxide Nanostructures: Preparation, Structural, Dielectric and Catalytic Properties. Ceram. Int. 2022, 48, 25556–25568. [Google Scholar] [CrossRef]
- Yang, C.; Su, X.; Wang, J.; Cao, X.; Wang, S.; Zhang, L. Facile Microwave-Assisted Hydrothermal Synthesis of Varied-Shaped CuO Nanoparticles and Their Gas Sensing Properties. Sens. Actuators B Chem. 2013, 185, 159–165. [Google Scholar] [CrossRef]
- Süsse, P. Verfeinerung der Kristallstruktur des Malachits, Cu2(OH)2CO3. Acta Crystallogr. 1967, 22, 146–151. [Google Scholar] [CrossRef]
- Åsbrink, S.; Norrby, L.J. A Refinement of the Crystal Structure of Copper(II) Oxide with a Discussion of Some Exceptional e.s.d.’s. Acta Crystallogr. B 1970, 26, 8–15. [Google Scholar] [CrossRef]
- Li, M.; Wang, J.; Zhang, P.; Deng, Q.; Zhang, J.; Jiang, K.; Hu, Z.; Chu, J. Superior Adsorption and Photoinduced Carries Transfer Behaviors of Dandelion-Shaped Bi2S3@MoS2: Experiments and Theory. Sci. Rep. 2017, 7, 42484. [Google Scholar] [CrossRef] [Green Version]
- Zhou, R.; Chen, Y.; Fu, Y.; Li, Y.; Chen, S.; Song, Y.; Wang, L. Dandelion-like Mesoporous Co3O4 as Anode Materials for Lithium Ion Batteries. Ionics 2018, 24, 1595–1602. [Google Scholar] [CrossRef]
- Missori, M.; Pulci, O.; Teodonio, L.; Violante, C.; Kupchak, I.; Bagniuk, J.; Łojewska, J.; Conte, A.M. Optical Response of Strongly Absorbing Inhomogeneous Materials: Application to Paper Degradation. Phys. Rev. B 2014, 89, 054201. [Google Scholar] [CrossRef]
- Kubelka, P.; Munk, F. Ein Beitrag zur Optik der Farbanstriche (Contribution to the Optic of Paint). Z. Tech. Phys. 1931, 12, 593–601. [Google Scholar]
- Missori, M. Optical Spectroscopy of Ancient Paper and Textiles. IL Nuovo Cim. 2016, 39 C 293, 1–10. [Google Scholar]
- Smith, R.A. Semiconductors, 2nd ed.; Cambridge University Press: Cambridge, UK, 1978. [Google Scholar]
- Bredas, J.-L. Mind the Gap! Mater. Horiz. 2014, 1, 17–19. [Google Scholar] [CrossRef]
- Asha, A.B.; Narain, R. Nanomaterials Properties. In Polymer Science and Nanotechnology; Elsevier: Amsterdam, The Netherlands, 2020; pp. 343–359. [Google Scholar]
- Carella, A.; Franzini, M.; Fusco, S.; Centore, R.; Barra, M.; Chiarella, F.; Cassinese, A.; Bonomo, M.; Nejrotti, S.; Carbone, M.; et al. Isoindigo Dyes Functionalized with Terminal Electron-Withdrawing Groups: Computational, Optical and Electrical Characterization. Dye Pigment. 2022, 208, 110866. [Google Scholar] [CrossRef]


| Sample | [Cu(NO3)2] | Method | Base/Gel | Ratio | Surfact. | Temp. | Time | pH | Precursor | Calcination |
|---|---|---|---|---|---|---|---|---|---|---|
| CuO-HT1 | 0.1 M | Hydroth. | CO(NH2)2 | 1:3 | - | 100 °C | 6 h | 6.5–7 | Cu2(CO3)(OH)2 | 300 °C–3 h |
| CuO-HT2 | 0.1 M | Hydroth. | NaHCO3 | 1:3 | - | 180 °C | 6 h | - | No | NO |
| CuO-SF | 0.06 M | Hydroth. | CO(NH2)2 | 1:3 | CTAB | 180 °C | 6 h | - | No | NO |
| CuO-SG | 0.04 M | Sol-Gel | Citric Acid | 1:1 | - | 50 °C | 12 h | - | No | 500 °C * |
| CuO-Prec | 0.07 M | Precip. | NaHCO3 | 1:5 | - | 65 °C | 3 h | 10–8.5 | Cu2(CO3)(OH)2 | 350 °C–3 h |
| Sample | Gap (eV) | Particle Size (nm) |
|---|---|---|
| CuO-HT1 | 1.10 | 20–100 * |
| CuO-HT2 | 1.30 | 20–100 * |
| CuO-SF | 1.16 | 100–200 * |
| CuO-SG | 1.18 | 200–700 * |
| CuO-Prec | 1.26 | 10–20 nm |
| E(HOMO) a.u | E(LUMO) a.u | E(HOMO) eV | E(LUMO) eV | Gap eV | |
|---|---|---|---|---|---|
| CuO8 | −0.29244 | −0.13219 | −7.96 | −3.60 | 4.36 |
| CuO16 | −0.30306 | −0.14384 | −8.25 | −3.91 | 4.33 |
| CuO24 | −0.31875 | −0.16348 | −8.67 | −4.45 | 4.23 |
| CuO38 | −0.27582 | −0.17094 | −7.51 | −4.65 | 2.85 |
| CuO44 | −0.30197 | −0.15239 | −8.22 | −4.15 | 4.07 |
Disclaimer/Publisher’s Note: The statements, opinions and data contained in all publications are solely those of the individual author(s) and contributor(s) and not of MDPI and/or the editor(s). MDPI and/or the editor(s) disclaim responsibility for any injury to people or property resulting from any ideas, methods, instructions or products referred to in the content. |
© 2023 by the authors. Licensee MDPI, Basel, Switzerland. This article is an open access article distributed under the terms and conditions of the Creative Commons Attribution (CC BY) license (https://creativecommons.org/licenses/by/4.0/).
Share and Cite
Gontrani, L.; Bauer, E.M.; Talone, A.; Missori, M.; Imperatori, P.; Tagliatesta, P.; Carbone, M. CuO Nanoparticles and Microaggregates: An Experimental and Computational Study of Structure and Electronic Properties. Materials 2023, 16, 4800. https://doi.org/10.3390/ma16134800
Gontrani L, Bauer EM, Talone A, Missori M, Imperatori P, Tagliatesta P, Carbone M. CuO Nanoparticles and Microaggregates: An Experimental and Computational Study of Structure and Electronic Properties. Materials. 2023; 16(13):4800. https://doi.org/10.3390/ma16134800
Chicago/Turabian StyleGontrani, Lorenzo, Elvira Maria Bauer, Alessandro Talone, Mauro Missori, Patrizia Imperatori, Pietro Tagliatesta, and Marilena Carbone. 2023. "CuO Nanoparticles and Microaggregates: An Experimental and Computational Study of Structure and Electronic Properties" Materials 16, no. 13: 4800. https://doi.org/10.3390/ma16134800