
Compositional Effects on Indentation Mechanical Properties of Chemically Strengthened TiO2-Doped Soda Lime Silicate Glasses


Glass Unit, Department of Building and Real Estate, Division of Built Environment, RISE Research Institutes of Sweden, Vejdes plats 3, 352 52 Växjö, Sweden
Materials 2022, 15(2), 577; https://doi.org/10.3390/ma15020577
Submission received: 4 December 2021
/
Revised: 7 January 2022
/
Accepted: 10 January 2022
/
Published: 13 January 2022
(This article belongs to the Special Issue Feature Paper Collection of Topical Advisory Members)
Abstract
:TiO2 is an important oxide for property modifications in the conventional soda lime silicate glass family. It offers interesting optical and mechanical properties, for instance, by substituting heavy metals such as lead in consumer glasses. The compositional effects on the hardness, reduced elastic modulus and crack resistance as determined by indentation of chemically strengthened (CS) TiO2-doped soda lime silicate glass was studied in the current paper. The CS, which was performed by a K+ for Na+ ion exchange in a molten KNO3 salt bath at 450 °C for 15 h, yielded significant changes in the indentation mechanical properties. The hardness of the glass samples increased, and this was notably dependent on the SiO2, CaO and TiO2 content. The reduced elastic modulus was less affected by the CS but showed decrease for most samples. The crack resistance, an important property in many applications where glasses are subjected to contact damage, showed very different behaviors among the series. Only one of the series did significantly improve the crack resistance where low CaO content, high TiO2 content, high molar volume and increased elastic deformation favored an increased crack resistance.
1. Introduction
Soda lime silicate (SLS) glass compositions dominate a wide range of industrial applications [1]. For instance, SLS glass is used in windows, containers, household glasses, displays, cover glasses and in automotive glazing. The industrial importance of this glass composition originates from its forming ability that yields a low-cost manufacturing process [2] but also transparency in the visible range, relatively high hardness and good chemical durability. However, due to their brittle, fracturing nature and their low resistance to surface defects, the practical strength of commercially available glass products is low [3]. As a route toward sustainable development [4], reducing the thickness of glass products is important as it affects sustainability in multiple ways, e.g., by resource efficiency, energy efficiency and fuel efficiency. The routes towards thinner and stronger glass are multiple [3], of which the strengthening of glass [5] is one route besides damage-resistant glass [6] and defect-free glass production [7]. Strengthened glass products are also used in a wide variety of applications, e.g., architectural, automotive, containers, displays, cover glasses and household glasses. Thermal strengthening is dominating but is less suitable for thin glass (i.e., below 2 mm) whereas chemical strengthening (hereinafter called CS) has reached wide market success, especially for electronic handheld devices [5], pharmaceutical auto-injectors [8], aircraft windshields [8] and high-speed trains [9]. However, CS has also found applications in other market segments, e.g., photovoltaics [10,11,12], automotive [13], wine glasses (e.g., the Stem Zero collection from Nude Glass), architectural applications [14] and flexible photonics [15].
CS is based on an ion exchange of smaller ions in the glass with larger ions from a salt bath, e.g., typically Na+ for K+ or Li+ for Na+ ion exchange. There is also the possibility of performing a two-step ion exchange (e.g., Li+ for Na+ and Na+ for K+ ion exchange) and thereby tailoring the stress profile, the so-called Engineered Stress Profile (ESP). The requirements for a well-performing CS glass are a high exchange rate of ions, high build-up of compressive stresses, low stress relaxation and high damage resistance [5,16,17]. Aluminosilicate and boroaluminosilicate glasses are typically high-performance glass compositions [18]; however, they are compositions with a set of properties that are not suited for all possible applications, e.g., for optical applications. The alumina content, which should ideally be in the range of the alkali content, also implies a high viscosity and high melting temperature [19,20,21]. It is therefore interesting to investigate the CS of other glass compositions in terms of kinetics, build-up of compressive stresses, stress relaxation and damage resistance.
Indentation is a powerful tool for investigating mechanical properties through which it is possible to determine the hardness, elastic modulus, and crack-initiation probability [22]. The mechanical properties of glasses have recently received much interest and they are of great importance when designing glasses for specific products [3]. Cover glass for electronic handheld devices is, for instance, subjected to different sources of mechanical contact damage and thus the mechanical properties are of great importance [23]. Other products in very different applications, e.g., wine glasses, are also subjected to different sources of contact damage, for instance, during handling and dishwashing. The latter also give demands on the chemical durability. In both product examples, cover glass and wine glasses, damage resistance is beneficial for the product and both examples are topics that most people can relate to.
TiO2 is an interesting component for incorporation into silicate glass mainly owing to its optical properties [24,25,26,27,28,29,30,31]. It has been used as a coloring agent [32,33], UV-protective agent [34,35,36] and for tailoring optical properties for different applications, e.g., optical glasses and lead-free crystal glass [24,37]. It has also found uses as a nucleating agent [38] for glass ceramics. TiO2 in glass has recently been studied more frequently for its effect on the structural, thermal and mechanical properties [39,40,41,42,43]. TiO2 is classified as an intermediate network former which means that it can act as both a network former and as a network modifier; however, in the soda-(lime)-silicate-glass system it mainly acts as a network former. TiO2, as it replaces SiO2, affects the mechanical properties by increasing the hardness and elastic modulus [39,41]. The crack initiation resistance was found to depend on Poisson’s ratio and a minimum was found around ν = 0.21. As SiO2 is replaced by TiO2, Poisson’s ratio increases. The effect of TiO2 on CS and the resulting properties has previously not been reported in the scientific literature; thus, the current paper will provide a novel study on the effect of CS on the mechanical properties in TiO2-containing soda lime silicate glass compositions. In a related paper, the effect of ion-exchange kinetics, structure and optical properties of some selected soda lime titanosilicate glasses was studied [44].
2. Materials and Methods
2.1. Glass Compositions
The compositional variations of the glass samples originate from a conventional SLS composition, and then the compositional changes categorize them into three different series while still keeping the Na2O relatively constant, as described in detail in [24] and given in Table 1. In summary, in Series 1 the SiO2 and TiO2 increases while the CaO decreases, in Series 2 the TiO2 replaces SiO2 and in Series 3 the TiO2 is replacing CaO. The glasses were molten in Pt/Rh10 crucibles at 1450 °C for 18 h followed by 1 h of homogenization by stirring with a Pt/Rh10 flag and a conditioning step at 1500 °C for 2 h before pour quenching into non-tempered steel molds. Silica sand (MAM1S, Sibelco, Antwerp, Belgium) and reagent grade NaNO3 (Scharlab, Barcelona, Spain, ≥99.5%), Na2CO3 (anhydrous, Fisher Scientific, Waltham, MA, USA, ≥99.5%), CaCO3 (Sigma Aldrich, St. Louis, MO, USA, ≥99.0%) and TiO2 (Acros Organics, Geel, Belgium ≥98.0) were used as raw materials. Annealing was performed at 550–580 °C for 1 h before conventional slow cooling of 0.5 °C/min to 400–430 °C and further cooling to ambient temperature by 2 °C/min. The chemical compositions that were analyzed using Laser Ablation Inductively Coupled Plasma Mass Spectrometry (LA-ICP-MS) (see [24,39] for details), are given in Table 1. The glass compositions will hereinafter be referred to as Series 1, Series 2 and Series 3 and the samples 1.1, 1.2, etc., where the first number denotes the series number and the second the sample in that series. However, please note that sample 1.1 is the start composition of each series, such that 1.1 = 2.1 = 3.1.
The density (ρ) was measured using Archimedes’ principle in distilled water and the values of the glass samples were calculated using the expression
where md is the weight of the dry glass sample, mw is the weight of the sample immersed in deionized water and ρw is the density for water. Sample weights varied between 6 and 10 g and the densities were estimated to be reproducible within the uncertainty of ±0.2%.
The molar volume of the glass sample was obtained by using the conventional expression
where xi is the molar fraction, Mi is the molar mass of element i and ρ is the density of the glass. The atomic packing density was calculated according to
where Vi is the volume for oxide i (i = MxOy where M is the cation and O the oxygen) calculated by , N is Avogadro’s constant and r is the ionic radii of the corresponding cations and oxygen [45]. The ionic radii data were taken from [46] with the following coordination numbers (CNi) for the ions i; Si4+: CNSi = 4 and rSi = 0.26 Å, O−2: CNO = 2 and rO = 1.35 Å, Na+: CNNa = 8 [47] and rNa = 1.18 Å, Ca2+: CNCa = 8 [47] and rCa = 1.12 Å as well as Ti4+: CNTi = 4 [39] and rTi = 0.42 Å. The oxygen packing density (COx) was calculated according to
which is the molar amount of oxygen per unit volume of glass [48,49]. Nox,i is the stoichiometric number of oxygen atoms provided by each glass component, i.e., Nox,Si = 2, Nox,Na = 1, Nox,Ca = 1 and Nox,Ti = 2.
2.2. Ion-Exchange Procedure
Pre-polished glass pieces were subjected to a thermally assisted ion-exchange process in a Hybe muffle furnace (model KUT180) at 450 °C. The glass pieces were put into a metal mesh basket and were initially heated next to a stainless-steel container that contained KNO3 salt (reagent grade from Acros Organics, Geel, Belgium ≥99%). The salt was first melted at 450 °C before the metal mesh basket with the glass pieces was put inside the salt bath for 15 h. Then the metal mesh basket with the glass samples inside was removed from the salt bath and placed next to the steel container inside the furnace. The furnace was turned off and the door was left open by a couple of centimeters so that the cooling was about 3–5 °C/min. The salt bath temperature was controlled to be within ±5 °C of the target temperature using a P655 logger from Dustmann Electronic GmbH and a thermocouple of type K. The samples and series that were subjected to the ion-exchange strengthening are referred to as chemically strengthened (CS), e.g., Series 1-CS.
2.3. Indentation Characterizations
The hardness (H) and reduced elastic modulus (Er) was measured by nano-indentation using Oliver and Pharr’s method [50] on polished glass samples before and after ion-exchange treatment. Hardness is defined by H = Fm/Ap, where Fm is the maximum applied load and Ap is the projected contact area. Ap is calculated by a fitting polynomial, where Cx are indenter tip specific factors (C0 = 24.56 for a perfect Berkovich indenter) and hc is the real contact depth considering the sink-in effect, calculated from Oliver and Pharr’s method, , where hm is the initial contact depth, ε is a tip factor (ε = 0.72 for a Berkovich tip) and S is the stiffness as determined from the slope during unloading, . The reduced elastic modulus is determined through , where β is a geometrical tip factor (β = 1.034 for a Berkovich indenter).
The nano-indenter was an Anton Paar NHT2 instrument. The measurements were made with the loads 1, 5, 10, 15, 25, 50 and 75 mN. For the 1 mN load, 40 indents were made (except for sample 3.5 where only 20 indents at 1 mN were measured) while 20 indents were made for each of the other load levels. In some cases, one indentation outlier datapoint, or for the 1 mN load, sometimes two datapoints, was removed from the analyzed data due to unrealistic scattering. The full information on the amount of data is given in the dataset.
The acquisition rate for the nano-indentation was 10 Hz, the loading-and-unloading rate was twice the load per minute (e.g., 2 mN/min for max load of 1 mN), the holding time at the max load was 10 s, the approach distance was 3 µm, the approach speed was 4 µm/s, the retract speed was 6 µm/s, the frame compliance was 0.2 µm/N and the stiffness threshold was 500 µN/µm. The Poisson’s ratio (ν) values were taken from [39]. The Berkovich tip geometry was calibrated using a certified standard sample made of fused quartz.
Crack resistance was measured by micro-indentation on the polished and ion-exchange-treated glasses using a Micro-Combi Tester (MCT) from CSM Instruments. Fifteen indents for each load were made using a diamond Vickers indenter. The micro-indentations were made with an acquisition rate of 10 Hz using linear loading with a load-and-unload rate of two times the load per minute, and the holding time at the load was 15 s. The approach speed was 8 µm/min and the retract speed was 16.6 µm/min, the contact force was 25 mN and the contact stiffness threshold was 25,000 µN/µm. The crack-resistance method is described in detail in [51] and follows the original procedure of Kato et al. [52] and Wada et al. [53]. The least-square method was used for the fitting procedure using the Weibull sigmoidal function,
where PCI is the probability of radial crack initiation, x is the load, xc is the characteristic value and m is the Weibull modulus. The crack resistance is then defined as the load when the PCI is 50%. However, using the Weibull cumulative function, xc can be used as a relative measure of the crack resistance. The characteristic value, xc, has the property that when x = xc, the PCI is equal to 1 − e−1, which is approximately 0.632 or 63.2%. All indentations, both nano and micro, were performed in an environment with a temperature of 23 ± 2 °C and a relative humidity of 40 ± 10%.
3. Results
3.1. Hardness and Reduced Elastic Modulus from Nano-Indentation
The implications of CS on the mechanical properties are primarily influenced by the compressive stresses that arise due to the exchange of larger ions into the glass from the molten salt bath. In fact, the mixed alkali effect [54] is generally not seen in CS glasses [55] and therefore the hardness generally increases with CS. In Figure 1a it can be seen that the hardness as a function of TiO2 content follows trends similar to what has previously been reported [39], and that the CS glasses generally exhibit a shift from the original reference hardness. The increase in hardness is generally about 5 ± 2%, but for some samples with higher TiO2 content it is slightly lower, around 2 ± 1%, while the errors for all samples are quite similar. Hereinafter, the difference in hardness will be called ΔHCS, which is given by ΔHCS = HCS − Href. However, any explicit trends regarding the ΔHCS are not seen from the data in Figure 1a; instead, the trends are discussed in the next section where hardness as a function of load is discussed.
The reduced elastic modulus (Er) shown in Figure 1b shows different trends compared to the hardness. In general, most of the samples show a decrease of Er because of the CS. The reduction of Er is in contrast to aluminosilicate glass, in which an increase is observed for alumina contents larger than 4 mol% [55]. However, it is important to note that the Er is dependent on Poisson’s ratio, which was assumed not to change with the CS.
3.2. Hardness as a Function of Indentation Load from Nano-Indentation
In Figure 2, the hardness before and after CS for Series 1 can be seen. At low loads ΔHCS is increasing with TiO2 content. It is suspected that the indentation at low loads is affected by the stress relaxation that occurs during CS. In a previous study [56], it was observed that the SiO2 content had close to a linear correlation to the viscosity in these compositions. Thus, as SiO2 is increases, the viscous relaxation is reduced. However, the stress relaxation is also dependent on the inherent instantaneous stress relaxation that occurs in CS [57]. Either way, the trend of the ΔHCS is likely strongly influenced by the increasing SiO2 content (Table 1). The trends in Figure 2 are also affected by the ion-exchange kinetics, and since ΔHCS is clearly decreasing with increasing load it is reasonable that the ion-exchange interdiffusion coefficient is decreasing in that series. In Figure S1 in the Supplementary Materials, the ΔHCS for Series 1 as a function of different components is shown and it also reveals that as a function of TiO2, ΔHCS has a similar trend to SiO2, but the opposite of CaO.
In Figure 3, the trend changes resulting from the CS are small and the values of ΔHCS are within error or slightly above. In Figure S2 in the Supplementary Materials, it is also shown that ΔHCS does not reveal any trend as a function of the SiO2, TiO2 or CaO content. Regardless, from studying the data closely it can be seen that the trends at low loads are different from those at high loads, but it must be considered that the error at low loads is also much higher. It is known from a separate study that the ion-exchange interdiffusion coefficient decreases with increasing TiO2 content [44]. However, as Er increases with the TiO2 content, a hypothesis is that the instantaneous stress relaxation becomes lower with increasing TiO2 content, but at the same time the viscous relaxation increases due to the suppressing effect of TiO2 on viscosity [56]. This can explain why the trends at low loads are slightly different from those at high loads.
In Figure 4, the hardness as a function of load for Series 3 can be seen. The ΔHCS generally has a decreasing trend with increasing TiO2 content (see Figure S3 in the Supplementary Materials). In Series 3, the SiO2 content is almost the same (Table 1) and in principle only the CaO is reduced. TiO2 is nevertheless considered likely to reduce the ion-exchange kinetics, but at the same time the reduction of Ca2+ increases the ionic mobility. It is well known that Ca2+ hinders ionic mobility, not only in the application of ion exchange [55,58] but also in the application of ionic conductivity [59]. For samples 3.6 and 3.7 there is a trend change as ΔHCS is negative at low loads. However, whether this depends on the low CaO content, the coordination change for Ti4+ [39], or a combination of the two is impossible to say.
In summary, since the three series are very different in terms of their composition (Table 1) and nature, which is also reflected in the trends of their properties (Figure 1), there is not a simple explanation for the trend in ΔHCS. As can be seen from Figures S1–S3 in the Supplementary Materials, there is not a single definitive correlation for all three series. Instead, there are likely several causes of the ΔHCS trend. However, it is possible to draw some general observations based on the results: (1) increasing the SiO2 content tends to increase the ΔHCS; (2) increasing the TiO2 content tends to slightly decrease ΔHCS; and (3) increasing the CaO content tends to give an increasing trend of ΔHCS with a maximum around 9 mol%. These observed trends are probably primarily dependent on the compressive-stress profiles of the different samples.
3.3. Crack Resistance
The crack resistance (CR) is an important property of CS glass as it helps to determine the service lifetime of the glass. An increasing CR generally reduces the probability of inflicted critical flaws and ultimately determines the strength of the glass. As an indenter is pressed into a glass, the energy is dissipated either as elastic or plastic deformation; however, if the glass’s ability to deform is not sufficient then it will crack [22,60]. Most frequently, glass shows radial and half-penny cracking and depending on the method of CR, the probability of crack initiation can be measured [52]. The understanding of CR is of high interest. There are many studies trying to elucidate the underlying parameters affecting crack resistance [6,22,52,60,61,62,63,64,65,66,67,68,69,70,71,72]. Their purpose is to advance the understanding of glass science and provide the possibility of modeling CR with the aim of developing more crack-initiation-resistant glasses [3,73,74].
In Figure 5, the CR as a function of the TiO2 content can be seen. The three different series show different behavior. It is clear from Figure 5 that Series 1 and Series 3 have an increasing trend in the CR as the TiO2 content increases. R2 is 0.95 and 0.88 for Series 1 and Series 3, respectively, while the R2 for Series 2 is 0.42. Linear fitting gives positive derivatives for all functions, including Series 2. The trend for all series is thus similar in the sense that the CR tends to increase with the TiO2 content. Although, it is noted that the CR is lower than previously reported CR values that were not subjected to CS, at least for Series 1 and 2 [39]. Note, since neither the same indenter instrument, the same indenter tip nor the same loads were used, the results cannot be directly compared to the previous study. However, it has previously been observed that the CR may become lower with CS [55,75] and it is quite likely that this is the case for some of the studied compositions here as well.
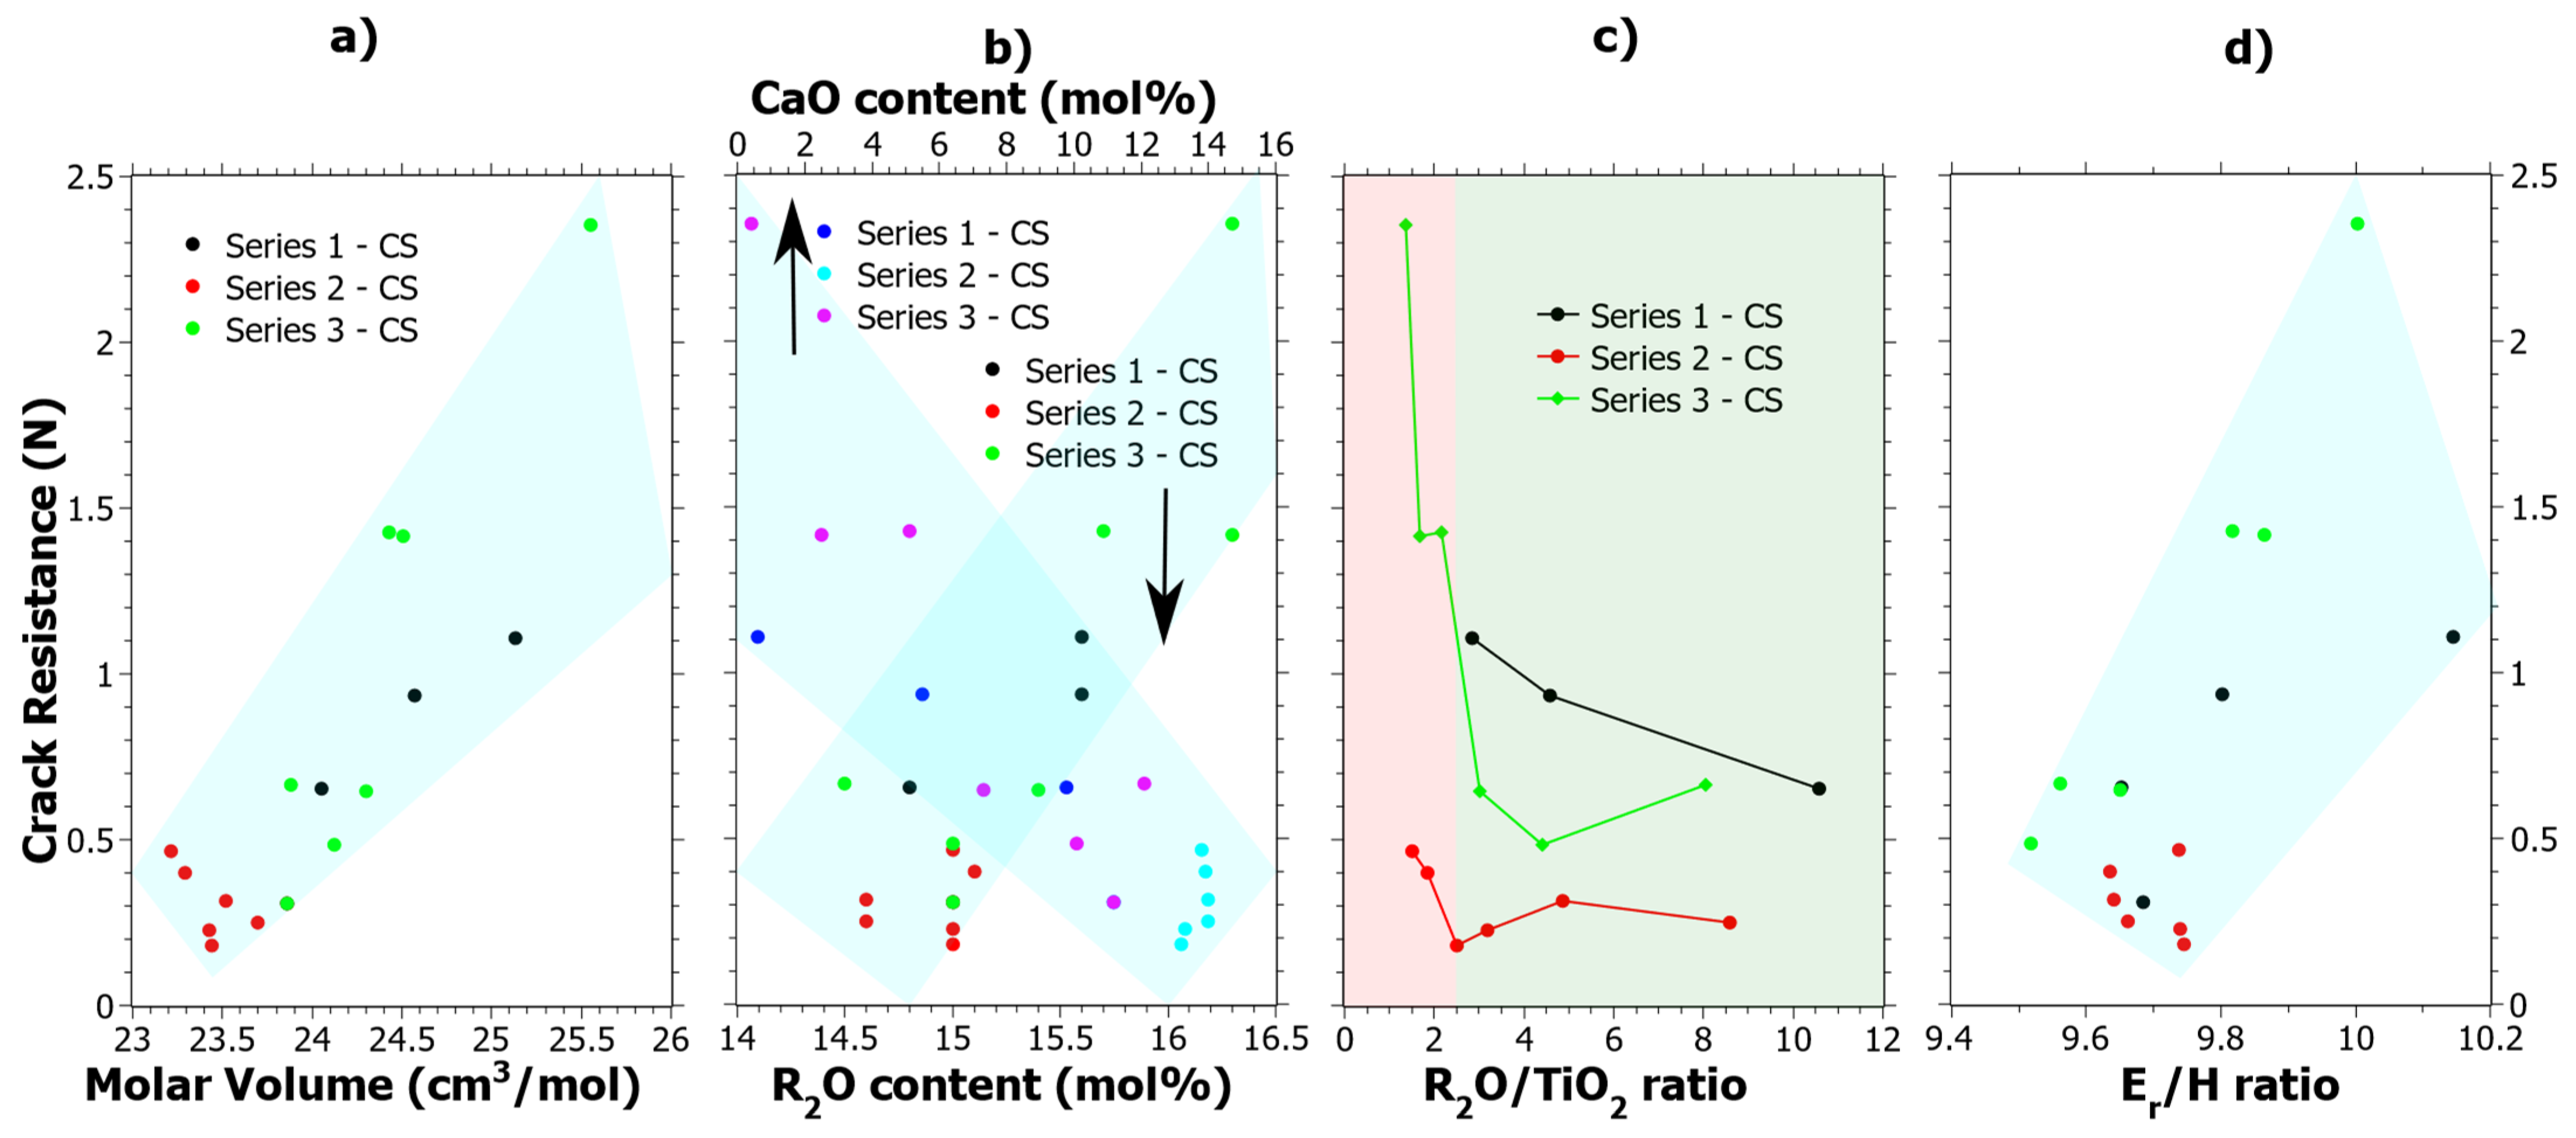
Series 3 after CS stands out in terms of CR values, which show a clear increase as compared to the values in the unstrengthened state [39]. The CR results given in Table S1 were cross correlated to all the data given in Table 1, and four general observations could be made, which are shown in Figure 6. In Figure 6a, it is shown that increasing the molar volume generally has a positive effect on the CR. In Figure 6b, the compositional effects are shown, whereby increasing R2O (where R = Na or K) and decreasing CaO content tend to increase the CR. Both Figure 6a,b show quite clear correlations. In Figure 6c, the CR as a function of Na2O/TiO2 ratio is shown. Previous studies of the structural effects in these glass samples explained that a coordination change occurs when the Na2O/TiO2 ratio is about 2.5 [24,39], which has also been observed by others [76,77]. In Figure 6c, the coordination change is shown by the different background colors where green is the tetrahedral coordination and red is the mix of [TiO4] and [TiO5] polyhedra. In the previous study [39], it was concluded that Ti4+ mostly exists in the tetrahedral configuration up to about 10 mol% of TiO2 and upon further increase of the [TiO5] polyhedral form. At TiO2 content levels exceeding 15 mol% the [TiO5] polyhedral is the dominating coordination of Ti4+. In Figure 6d, CR is generally seen to increase as a function of the Er/H ratio, which is calculated from the nano-indentation data of the CS samples in Figure 1a,b. Er/H is a ratio that has previously been noted to effect crack-initiation behavior in oxide glasses [63] and it is correlated to the elastic volume recovery [78]. Since more of the energy from the indentation can be stored by elastic deformation as the Er/H is increased, it is reasonable that the CR increases. Radial cracking is a result of the elastic-plastic mismatch in the stress field upon unloading. Hypothetically, by increasing the elastic part, a better balance is achieved which results in an increased CR.
4. Discussion
The indentation mechanical properties of glasses are today an important topic in glass science, and it is well known that isostatic compression gives enhanced mechanical properties, such as the CS of glass. CS generally yields an increase in the hardness, but a less apparent change is the reduced elastic modulus, and the underlying reasons for this are probably primarily caused by the CS-induced compressive-stress profiles. Therefore, it is planned to study the stress profiles and the stress relaxation of these glasses in the future in order to understand the mechanical properties as a function of indentation load.
The crack resistance after CS does seem to be somehow connected to the coordination of Ti4+. However, from this study it is unclear why, and this needs further investigation. One possibility would be the analogy to Si4+, which is mainly in a tetrahedral coordination, but can become five-coordinated under pressure [79]. In molecular-dynamics simulations, it has been shown that five-coordinated Si4+ has a higher propensity to carry out local shear deformation than four-coordinated Si4+ [80]. Perhaps a similar phenomenon occurs for Ti4+ when it is five-coordinated. However, the effect of the Ti4+ coordination could be in combination with the elastic volume recovery, as indicated by the general increase as a function of Er/H.
5. Conclusions
In the current study, it was found that the compositional changes affected the mechanical properties after chemical strengthening (CS). The results led to several general observations that will serve as the conclusion of the study. A new term, ΔHCS, was introduced that denotes the difference in hardness before and after CS. Increasing SiO2 and CaO contents tended to increase ΔHCS, the latter by up to around 9 mol%, while increasing TiO2 tended to slightly decrease ΔHCS. Crack resistance, which is an established method for studying crack initiation, showed that CS possibly decreases the crack resistance value for most samples compared to the non-strengthened glass. However, not for Series 3, where a clear increase was seen. Given the compositional changes, the crack resistance is favored by an increased molar volume, lower CaO content, higher Na2O content and high TiO2 content where Ti4+ is both four and five-coordinated. The crack resistance also generally correlates with the ratio reduced elastic modulus over hardness (Er/H), which is related to the elastic volume recovery upon unloading. The causes of the observed trends will be further clarified by studying the induced compressive-stress profiles in a future study.
Supplementary Materials
The following are available online at https://www.mdpi.com/article/10.3390/ma15020577/s1. Figure S1: ΔHCS of Series 1 for different nano-indentation loads as a function of (a) SiO2, (b) TiO2 content and (c) CaO content. Figure S2: ΔHCS of Series 2 for different nano-indentation loads as a function of (a) SiO2, (b) TiO2 content and (c) CaO content. Figure S3: ΔHCS of Series 3 for different nano-indentation loads as a function of (a) SiO2, (b) TiO2 content and (c) CaO content. Table S1: The crack resistance (CR) results as well as fitting data xc (characteristic value) and m (Weibull modulus) for the Weibull fit.
Funding
The research and the Article Processing Charges was funded by FORMAS, the Swedish Research Council for Environment, Agricultural Sciences and Spatial Planning, Grant No. 2018-00707.
Institutional Review Board Statement
Not applicable.
Informed Consent Statement
Not applicable.
Data Availability Statement
The datasets generated for this study can be found in the Swedish National Data Service Repository: https://snd.gu.se/en (accessed on 1 December 2021), doi:10.5878/2rze-dy74.
Conflicts of Interest
The author declares no conflict of interest. The funders had no role in the design of the study; in the collection, analyses, or interpretation of data; in the writing of the manuscript, or in the decision to publish the results.
References
- Axinte, E. Glasses as engineering materials: A review. Mater. Des. 2011, 32, 1717–1732. [Google Scholar] [CrossRef]
- Hand, R.J.; Tadjiev, D.R. Mechanical properties of silicate glasses as a function of composition. J. Non-Cryst. Solids 2010, 356, 2417–2423. [Google Scholar] [CrossRef]
- Wondraczek, L.; Mauro, J.C.; Eckert, J.; Kühn, U.; Horbach, J.; Deubener, J.; Rouxel, T. Towards ultrastrong glasses. Adv. Mater. 2011, 23, 4578–4586. [Google Scholar] [CrossRef]
- Griggs, D.; Stafford-Smith, M.; Gaffney, O.; Rockström, J.; Öhman, M.C.; Shyamsundar, P.; Steffen, W.; Glaser, G.; Kanie, N.; Noble, I. Sustainable development goals for people and planet. Nature 2013, 495, 305–307. [Google Scholar] [CrossRef] [PubMed]
- Karlsson, S.; Wondraczek, L. Strengthening of oxide glasses. In Encyclopedia for Glass Science, Technology, History and Culture; Richet, P., Ed.; John Wiley & Sons: Hoboken, NJ, USA, 2021. [Google Scholar]
- Januchta, K.; Youngman, R.E.; Goel, A.; Bauchy, M.; Logunov, S.L.; Rzoska, S.; Bockowski, M.; Jensen, L.R.; Smedskjaer, M.M. Discovery of ultra-crack-resistant oxide glasses with adaptive networks. Chem. Mater. 2017, 29, 5865–5876. [Google Scholar] [CrossRef]
- Molnár, G.; Bojtár, I. Effects of manufacturing inhomogeneities on strength properties of float glass. Mech. Mater. 2013, 59, 1–13. [Google Scholar] [CrossRef]
- Varshneya, A.K.; Spinelli, I.M. High-strength, large-case-depth chemically strengthened lithium aluminosilicate glass. Am. Ceram. Soc. Bull. 2009, 88, 27–33. [Google Scholar]
- Peng, Y.; Ma, W.; Wang, S.; Wang, K.; Gao, G. Investigation of the fracture behaviors of windshield laminated glass used in high-speed trains. Compos. Struct. 2019, 207, 29–40. [Google Scholar] [CrossRef]
- Dziedzic, J.; Inglot, M. Ultrathin glass for the photovoltaic applications. Acta Phys. Pol. A 2017, 132, 176–178. [Google Scholar] [CrossRef]
- Wang, H.F.; Xing, G.Z.; Wang, X.Y.; Zhang, L.L.; Zhang, L.; Li, S. Chemically strengthened protection glasses for the applications of space solar cells. AIP Adv. 2014, 4, 047133. [Google Scholar] [CrossRef]
- Kambe, M.; Hara, K.; Mitarai, K.; Takeda, S.; Fukawa, M.; Ishimaru, N.; Kondo, M. Chemically strengthened cover glass for preventing potential induced degradation of crystalline silicon solar cells. In Proceedings of the 2013 IEEE 39th Photovoltaic Specialists Conference (PVSC), Tampa, FL, USA, 16–21 June 2013; pp. 3500–3503. [Google Scholar]
- Leonhard, T.; Cleary, T.M.; Moore, M.J.; Seyler, S.; Fisher, W.K. Novel Lightweight laminate concept with ultrathin chemically strengthened glass for automotive windshields. SAE Int. J. Passeng. Cars-Mech. Syst. 2015, 8, 95–103. [Google Scholar] [CrossRef] [Green Version]
- Louter, C.; Akilo, M.; Miri, B.; Neeskens, T.; Ribeiro Silveira, R.; Topcu, Ö.; van der Weijde, I.; Zha, C.; Bilow, M.; Turrin, M. Adaptive and composite thin glass concepts for architectural applications. Heron 2018, 63, 199–218. [Google Scholar]
- Macrelli, G.; Varshneya, A.K.; Mauro, J.C. Ultra-thin glass as a substrate for flexible photonics. Opt. Mater. 2020, 106, 109994. [Google Scholar] [CrossRef]
- Varshneya, A.K. Chemical strengthening of glass: Lessons learned and yet to be learned. Int. J. Appl. Glas. Sci. 2010, 1, 131–142. [Google Scholar] [CrossRef]
- Gross, T.M. Chemical strengthening of glass. In Springer Handbook of Glass; Musgraves, J.D., Hu, J., Calvez, L., Eds.; Springer: Cham, Switzerland, 2019; pp. 273–296. [Google Scholar]
- Varshneya, A.K.; Kreski, P.K. The chemistry of chemical strengthening of glass. In Processing, Properties, and Applications of Glass and Optical Materials; John Wiley & Sons: New York, NY, USA, 2012; pp. 107–114. [Google Scholar]
- Toplis, M.J.; Dingwell, D.B.; Lenci, T. Peraluminous viscosity maxima in Na2O-Al2O3-SiO2 liquids: The role of triclusters in tectosilicate melts. Geochim. Cosmochim. Acta 1997, 61, 2605–2612. [Google Scholar] [CrossRef]
- Webb, S.L.; Banaszak, M.; Köhler, U.; Rausch, S.; Raschke, G. The viscosity of Na2O-CaO-Al2O3-SiO2 melts. Eur. J. Miner. 2007, 19, 681–692. [Google Scholar] [CrossRef]
- Karlsson, S. Viscosity of alumina doped soda lime silicate glasses–observation of anomaly in the linear increase as Al2O3 replaces SiO2. J. Non-Cryst. Solids 2021, 573, 121149. [Google Scholar] [CrossRef]
- Rouxel, T.; Jang, J.-I.; Ramamurty, U. Indentation of glasses. Prog. Mater. Sci. 2021, 121, 100834. [Google Scholar] [CrossRef]
- Dejneka, M.; Kiczenski, T.J. Display glass. In Springer Handbook of Glass; Musgraves, J.D., Hu, J., Calvez, L., Eds.; Springer: Cham, Switzerland, 2019; pp. 1521–1553. [Google Scholar]
- Karlsson, S.; Bäck, L.G.; Kidkhunthod, P.; Lundstedt, K.; Wondraczek, L. Effect of TiO2 on optical properties of glasses in the soda-lime-silicate system. Opt. Mater. Express 2016, 6, 1198. [Google Scholar] [CrossRef] [Green Version]
- Dimitrov, V.; Komatsu, T. Electronic polarizability and average single bond strength of ternary oxide glasses with high TiO2 contents. Phys. Chem. Glasses Eur. J. Glass Sci. Technol. Part B 2011, 52, 225–230. [Google Scholar]
- Abdel-Baki, M.; Wahab, F.A.A.; El-Diasty, F. Optical characterization of xTiO2-(60−x)SiO2-40Na2O glasses: I. Linear and nonlinear dispersion properties. Mater. Chem. Phys. 2006, 96, 201–210. [Google Scholar] [CrossRef]
- Abdel-Baki, M.; El-Diasty, F.; Wahab, F.A.A. Optical characterization of xTiO2-(60−x)SiO2-40Na2O glasses: II. Absorption edge, Fermi level, electronic polarizability and optical basicity. Opt. Commun. 2006, 261, 65–70. [Google Scholar] [CrossRef]
- Higazy, A.A.; Hussein, A.; Ewaida, M.A.; El-Hofy, M. The effect of temperature on the optical absorption edge of the titanium oxide-doped soda-lime silica glasses. J. Mater. Sci. Lett. 1988, 7, 453–456. [Google Scholar] [CrossRef]
- Higazy, A.A.; Hussein, A.; Awaida, M.A. A study of the optical absorption edge in silicate glasses containing TiO2 oxide. J. Mater. Sci. 1989, 24, 2203–2208. [Google Scholar] [CrossRef]
- Hogarth, C.; Khan, M. A study of optical absorption in some sodium titanium silicate glasses. J. Non-Cryst. Solids 1977, 24, 277–281. [Google Scholar] [CrossRef]
- Turnbull, R.C.; Lawrence, W.G. The role of titania in silica glasses. J. Am. Ceram. Soc. 1952, 35, 48–53. [Google Scholar] [CrossRef]
- Weyl, W.A. Coloured Glasses, 2nd ed.; Society of Glass Technology: Sheffield, UK, 1967. [Google Scholar]
- Falk, T.; Fredriksson, H.; Holmér, G.; Johansson, L.G.; Lang, M.; Sundberg, P. An Introduction to Glass-Craft, Technology and Art; Flygt, E., Ed.; Glafo—The Glass Research Institute: Växjö, Sweden, 2005. [Google Scholar]
- Allsopp, B.L.; Orman, R.; Johnson, S.R.; Baistow, I.; Sanderson, G.; Sundberg, P.; Stålhandske, C.; Grund, L.; Andersson, A.; Booth, J.; et al. Towards improved cover glasses for photovoltaic devices. Prog. Photovoltaics Res. Appl. 2020, 28, 1187–1206. [Google Scholar] [CrossRef]
- Allsopp, B.L.; Christopoulou, G.; Brookfield, A.; Forder, S.D.; Bingham, P.A. Optical and structural properties of d0 ion-doped silicate glasses for photovoltaic applications. Phys. Chem. Glasses Eur. J. Glass Sci. Technol. Part B 2018, 59, 193–202. [Google Scholar] [CrossRef]
- Johansson, W.; Peralta, A.; Jonson, B.; Anand, S.; Österlund, L.; Karlsson, S. Transparent TiO2 and ZnO thin films on glass for UV protection of PV modules. Front. Mater. 2019, 6, 259. [Google Scholar] [CrossRef]
- Hartmann, P.; Jedamzik, R.; Reichel, S.; Schreder, B. Optical glass and glass ceramic historical aspects and recent developments: A Schott view. Appl. Opt. 2010, 49, D157–D176. [Google Scholar] [CrossRef]
- Mukherjee, D.P.; Das, S.K. The influence of TiO2 content on the properties of glass ceramics: Crystallization, microstructure and hardness. Ceram. Int. 2014, 40, 4127–4134. [Google Scholar] [CrossRef]
- Limbach, R.; Karlsson, S.; Scannell, G.; Mathew, R.; Edén, M.; Wondraczek, L. The effect of TiO2 on the structure of Na2O-CaO-SiO2 glasses and its implications for thermal and mechanical properties. J. Non-Cryst. Solids 2017, 471, 6–18. [Google Scholar] [CrossRef]
- Scannell, G.; Koike, A.; Huang, L. Structure and thermo-mechanical response of TiO2-SiO2 glasses to temperature. J. Non-Cryst. Solids 2016, 447, 238–247. [Google Scholar] [CrossRef] [Green Version]
- Scannell, G.; Huang, L.; Rouxel, T. Elastic properties and indentation cracking behavior of Na2O-TiO2-SiO2 glasses. J. Non-Cryst. Solids 2015, 429, 129–142. [Google Scholar] [CrossRef]
- Scannell, G.; Huang, L. Structure and thermo-mechanical response of Na2O-TiO2-SiO2 glasses to temperature. J. Non-Cryst. Solids 2016, 453, 46–58. [Google Scholar] [CrossRef] [Green Version]
- Scannell, G.; Barra, S.; Huang, L. Structure and properties of Na2O-TiO2-SiO2 glasses: Role of Na and Ti on modifying the silica network. J. Non-Cryst. Solids 2016, 448, 52–61. [Google Scholar] [CrossRef] [Green Version]
- Bengtsson, F.; Bayrak Pehlivan, İ.; Österlund, L.; Karlsson, S. Alkali Ion diffusion and structure of chemically strengthened TiO2 doped soda-lime silicate glass. J. Non-Cryst. Solids, 2022; submitted. [Google Scholar]
- Rouxel, T. Elastic Properties and short-to medium-range order in glasses. J. Am. Ceram. Soc. 2007, 90, 3019–3039. [Google Scholar] [CrossRef]
- Shannon, R.D. Revised effective ionic radii and systematic studies of interatomic distances in halides and chalcogenides. Acta Crystallogr. Sect. A Cryst. Phys. Diffr. Theor. Gen. Crystallogr. 1976, A32, 751–767. [Google Scholar] [CrossRef]
- Cormier, L.; Neuville, D. Ca and Na environments in Na2O-CaO-Al2O3-SiO2 glasses: Influence of cation mixing and cation-network interactions. Chem. Geol. 2004, 213, 103–113. [Google Scholar] [CrossRef]
- Ray, N.H. Composition-property relationships in inorganic oxide glasses. J. Non-Cryst. Solids 1974, 15, 423–434. [Google Scholar] [CrossRef]
- Grammes, T.; Limbach, R.; Bruns, S.; Van Wüllen, L.; De Ligny, D.; Kamitsos, E.I.; Durst, K.; Wondraczek, L.; Brauer, D.S. Tailoring the mechanical properties of metaluminous aluminosilicate glasses by phosphate incorporation. Front. Mater. 2020, 7, 115. [Google Scholar] [CrossRef]
- Oliver, W.C.; Pharr, G.M. An improved technique for determining hardness and elastic modulus using load and displacement sensing indentation experiments. J. Mater. Res. 1992, 7, 1564–1583. [Google Scholar] [CrossRef]
- Sundberg, P.; Bäck, L.G.; Orman, R.; Booth, J.; Karlsson, S. Simultaneous chemical vapor deposition and thermal strengthening of glass. Thin Solid Films 2018, 669, 487–493. [Google Scholar] [CrossRef]
- Kato, Y.; Yamazaki, H.; Yoshida, S.; Matsuoka, J. Effect of densification on crack initiation under Vickers indentation test. J. Non-Cryst. Solids 2010, 356, 1768–1773. [Google Scholar] [CrossRef]
- Wada, M.; Furukawa, H.; Fujita, K. Crack resistance of glass on Vickers indentation. In Proceedings of the X International Congress on Glass (ICG), Kyoto, Japan, 8–12 July 1974; pp. 39–46. [Google Scholar]
- Day, D.E. Mixed alkali glasses—Their properties and uses. J. Non-Cryst. Solids 1976, 21, 343–372. [Google Scholar] [CrossRef]
- Karlsson, S.; Mathew, R.; Ali, S.; Edén, M. Investigations on ion exchange strengthened alumina doped soda lime silicate glasses: 27Al and 23Na NMR, DTA and indentation mechanical properties. 2021; submitted. [Google Scholar]
- Karlsson, S. The viscosity effect of TiO2 on soda-lime-silicate bearing glass. In Proceedings of the 4th International Workshop on Glass and Entropy and 9th International Otto Schott Colloquium, Jena, Germany, 9–12 September 2019. [Google Scholar]
- Varshneya, A.K.; Olson, G.A.; Kreski, P.K.; Gupta, P.K. Buildup and relaxation of stress in chemically strengthened glass. J. Non-Cryst. Solids 2015, 427, 91–97. [Google Scholar] [CrossRef]
- Ragoen, C.; Sen, S.; Lambricht, T.; Godet, S. Effect of Al2O3 content on the mechanical and interdiffusional properties of ion-exchanged Na-aluminosilicate glasses. J. Non-Cryst. Solids 2017, 458, 129–136. [Google Scholar] [CrossRef]
- Shelby, J.E. Introduction to Glass Science and Technology, 2nd ed.; The Royal Society of Chemistry: Cambridge, UK, 2005; pp. 249–264. [Google Scholar]
- Yoshida, S. Indentation deformation and cracking in oxide glass—Toward understanding of crack nucleation. J. Non-Cryst. Solids X 2019, 1, 100009. [Google Scholar] [CrossRef]
- Sheth, N.; Greenley, C.; Bermejo, R.; Mauro, J.C.; Pantano, C.G.; Kim, S.H. Effects of acid leaching treatment of soda-lime silicate glass on crack initiation and fracture. J. Am. Ceram. Soc. 2021, 104, 4550–4558. [Google Scholar] [CrossRef]
- To, T.; Jensen, L.R.; Smedskjaer, M.M. On the relation between fracture toughness and crack resistance in oxide glasses. J. Non-Cryst. Solids 2020, 534, 119946. [Google Scholar] [CrossRef]
- Sellappan, P.; Rouxel, T.; Célarié, F.; Becker, E.; Houizot, P.; Conradt, R. Composition dependence of indentation deformation and indentation cracking in glass. Acta Mater. 2013, 61, 5949–5965. [Google Scholar] [CrossRef]
- Rouxel, T.; Sellappan, P.; Célarié, F.; Houizot, P.; Sanglebœuf, J.-C. Toward glasses with better indentation cracking resistance. Comptes Rendus Mécanique 2014, 342, 46–51. [Google Scholar] [CrossRef]
- Logrado, M.; Eckert, H.; Murata, T.; Nakane, S.; Yamazaki, H. Structure-property relations in crack-resistant alkaline-earth aluminoborosilicate glasses studied by solid state NMR. J. Am. Ceram. Soc. 2021, 104, 2250–2267. [Google Scholar] [CrossRef]
- Liu, P.; Youngman, R.E.; Jensen, L.R.; Bockowski, M.; Smedskjaer, M.M. Achieving ultrahigh crack resistance in glass through humid aging. Phys. Rev. Mater. 2020, 4, 063606. [Google Scholar] [CrossRef]
- Limbach, R.; Winterstein-Beckmann, A.; Dellith, J.; Möncke, D.; Wondraczek, L. Plasticity, crack initiation and defect resistance in alkali-borosilicate glasses: From normal to anomalous behavior. J. Non-Cryst. Solids 2015, 417-418, 15–27. [Google Scholar] [CrossRef] [Green Version]
- Koike, A.; Akiba, S.; Sakagami, T.; Hayashi, K.; Ito, S. Difference of cracking behavior due to Vickers indentation between physically and chemically tempered glasses. J. Non-Cryst. Solids 2012, 358, 3438–3444. [Google Scholar] [CrossRef]
- Januchta, K.; Stepniewska, M.; Jensen, L.R.; Zhang, Y.; Somers, M.A.J.; Bauchy, M.; Yue, Y.; Smedskjaer, M.M. Breaking the limit of micro-ductility in oxide glasses. Adv. Sci. 2019, 6, 1901281. [Google Scholar] [CrossRef] [Green Version]
- Januchta, K.; Smedskjaer, M.M. Indentation deformation in oxide glasses: Quantification, structural changes, and relation to cracking. J. Non-Cryst. Solids X 2019, 1, 100007. [Google Scholar] [CrossRef]
- Hasdemir, I.; Striepe, S.; Deubener, J.; Simon, K. A 2000-year perspective on indentation crack resistance and brittleness of glass. J. Non-Cryst. Solids 2015, 408, 51–56. [Google Scholar] [CrossRef]
- Gross, T.; Wu, J.; Baker, D.; Price, J.; Yongsunthon, R. Crack-resistant glass with high shear band density. J. Non-Cryst. Solids 2018, 494, 13–20. [Google Scholar] [CrossRef]
- Wondraczek, L.; Mauro, J.C. Advancing glasses through fundamental research. J. Eur. Ceram. Soc. 2009, 29, 1227–1234. [Google Scholar] [CrossRef]
- Mauro, J.C. Grand challenges in glass science. Front. Mater. 2014, 1, 20. [Google Scholar] [CrossRef] [Green Version]
- Li, X.; Jiang, L.; Mohagheghian, I.; Dear, J.P.; Li, L.; Yan, Y. New insights into nanoindentation crack initiation in ion-exchanged sodium aluminosilicate glass. J. Am. Ceram. Soc. 2018, 101, 2930–2940. [Google Scholar] [CrossRef]
- Ponader, C.W.; Boek, H.; Dickinson, J.E. X-ray absorption study of the coordination of titanium in sodium-titanium-silicate glasses. J. Non-Cryst. Solids 1996, 201, 81–94. [Google Scholar] [CrossRef]
- Duffy, J.A. Refractivity and coordination number changes of the Ti4+ ion in glass. Phys. Chem. Glasses Eur. J. Glass Sci. Technol. Part B 2006, 47, 582–587. [Google Scholar]
- Rouxel, T. Driving force for indentation cracking in glass: Composition, pressure and temperature dependence. Philos. Trans. R. Soc. A Math. Phys. Eng. Sci. 2015, 373, 20140140. [Google Scholar] [CrossRef] [Green Version]
- Machacek, J.; Gedeon, O.; Liska, M. Molecular approach to the 5-coordinated silicon atoms in silicate glasses. Phys. Chem. Glasses Eur. J. Glass Sci. Part B 2007, 48, 345–353. [Google Scholar]
- Zhang, Y.; Huang, L.; Shi, Y. Silica glass toughened by consolidation of glassy nanoparticles. Nano Lett. 2019, 19, 5222–5228. [Google Scholar] [CrossRef]
Figure 1.
Properties determined by 75 mN nano-indentation before and after ion exchange: (a) Hardness and (b) Reduced Elastic Modulus (Er). The error bars are given from the standard deviations of the measurements. Series 1 refers to samples 1.1 to 1.4, Series 2 to samples 2.2 to 2.7, Series 3 to 3.2 to 3.7 and CS refers to values after ion-exchange strengthening.

Figure 2.
Nano-indentation hardness as a function load for Series 1 before and after chemical strengthening (CS).
Figure 2.
Nano-indentation hardness as a function load for Series 1 before and after chemical strengthening (CS).
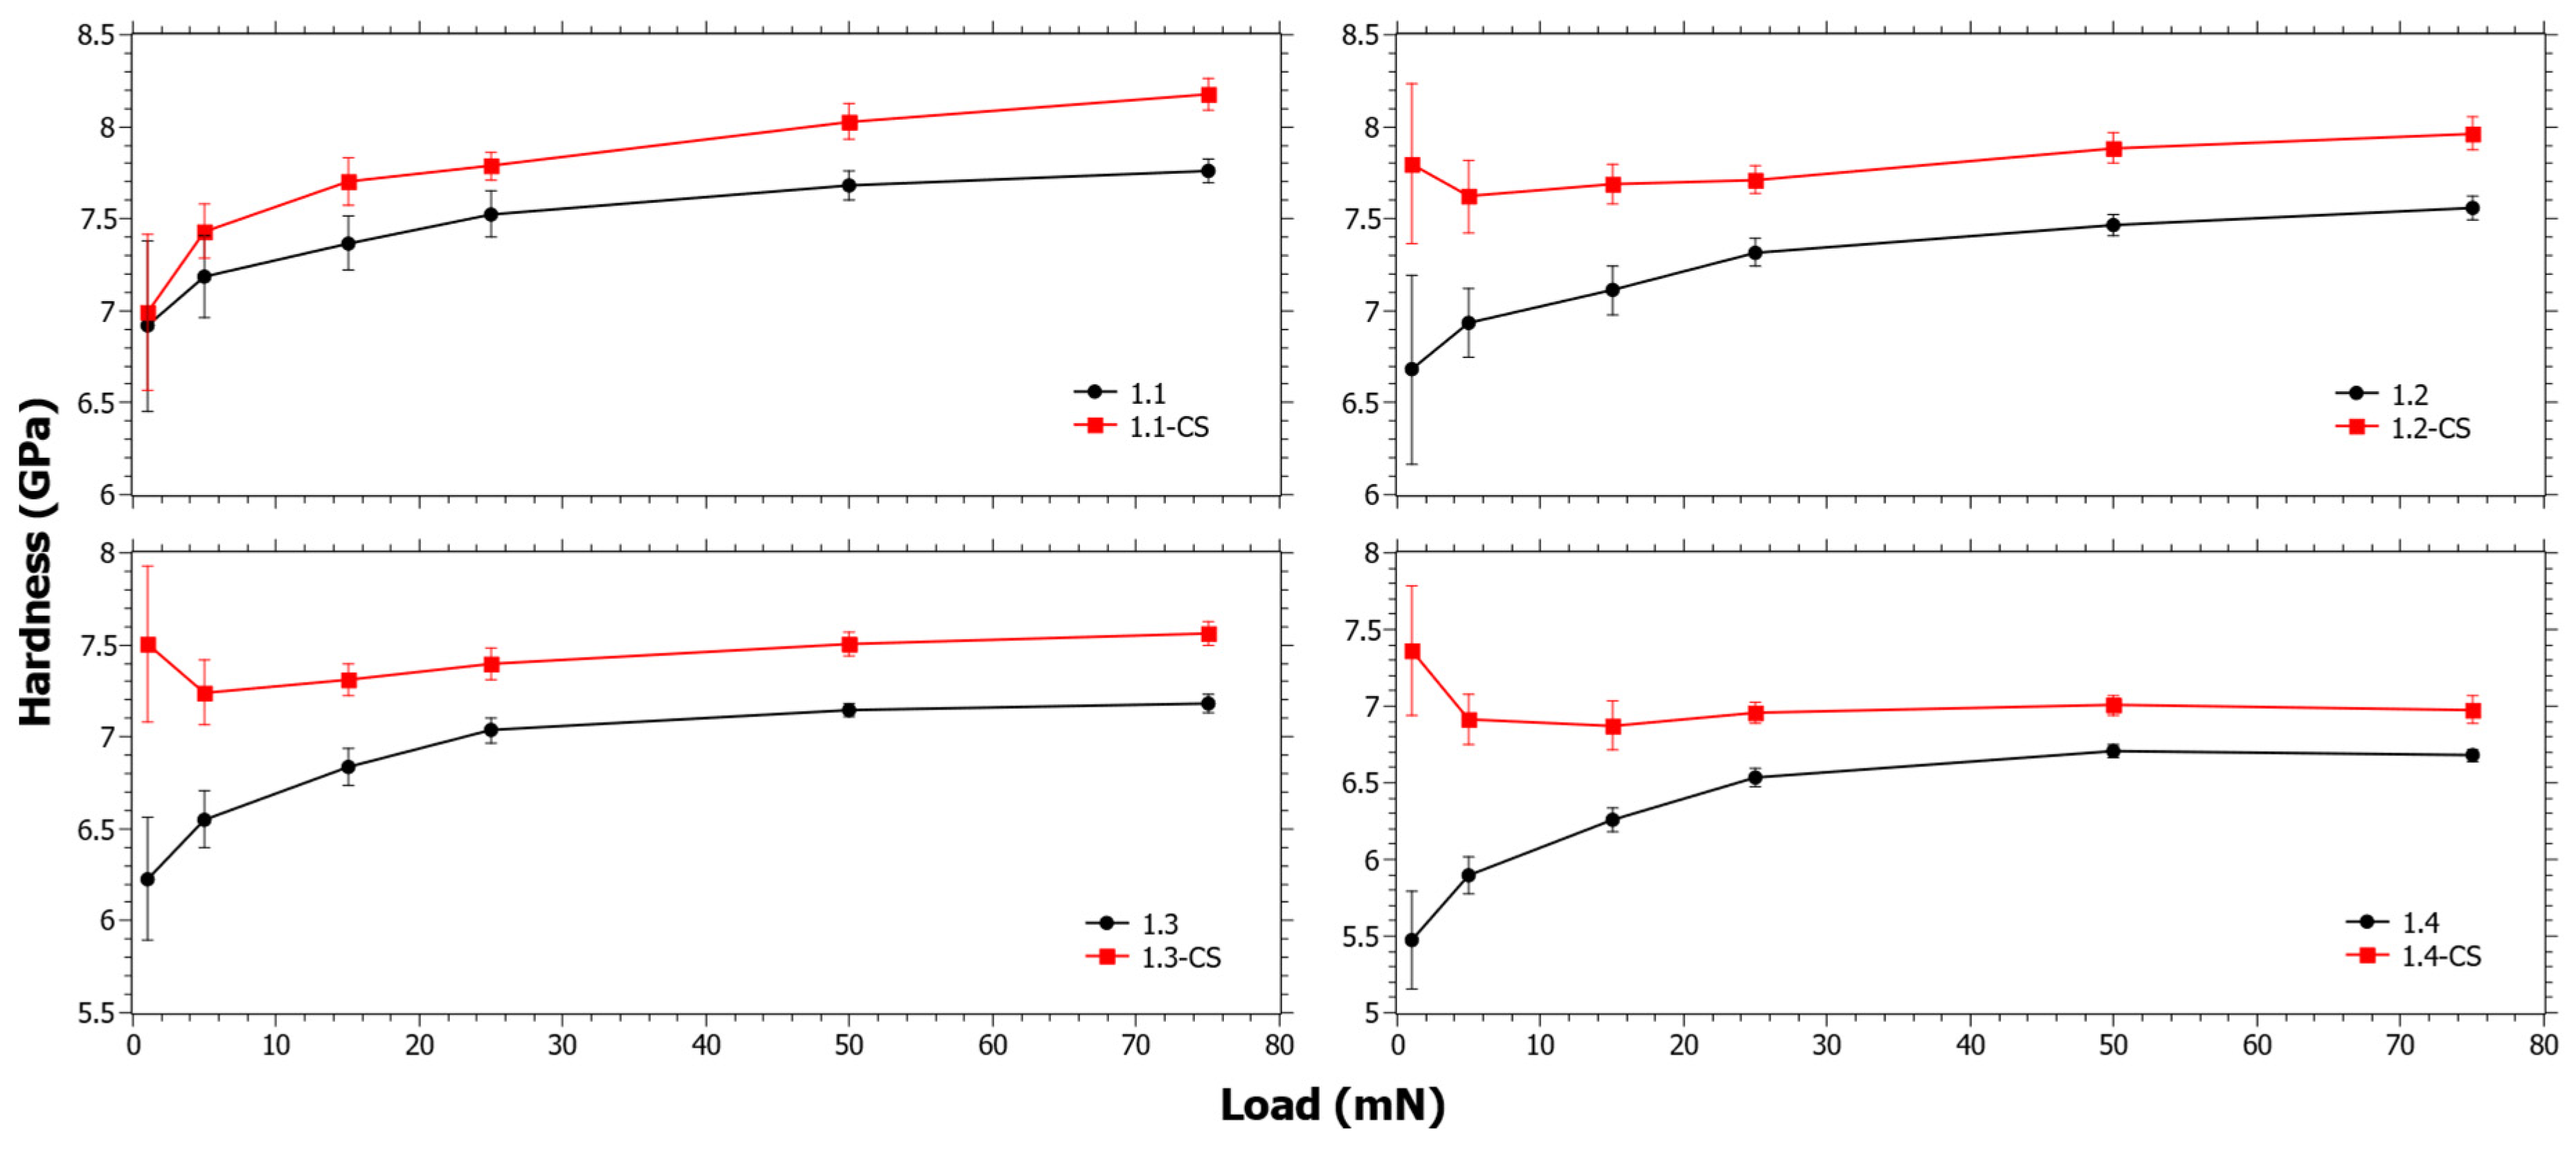
Figure 3.
Nano-indentation hardness as a function load for Series 2 before and after chemical strengthening (CS).
Figure 3.
Nano-indentation hardness as a function load for Series 2 before and after chemical strengthening (CS).

Figure 4.
Nano-indentation hardness as a function load for Series 3 before and after chemical strengthening (CS).
Figure 4.
Nano-indentation hardness as a function load for Series 3 before and after chemical strengthening (CS).
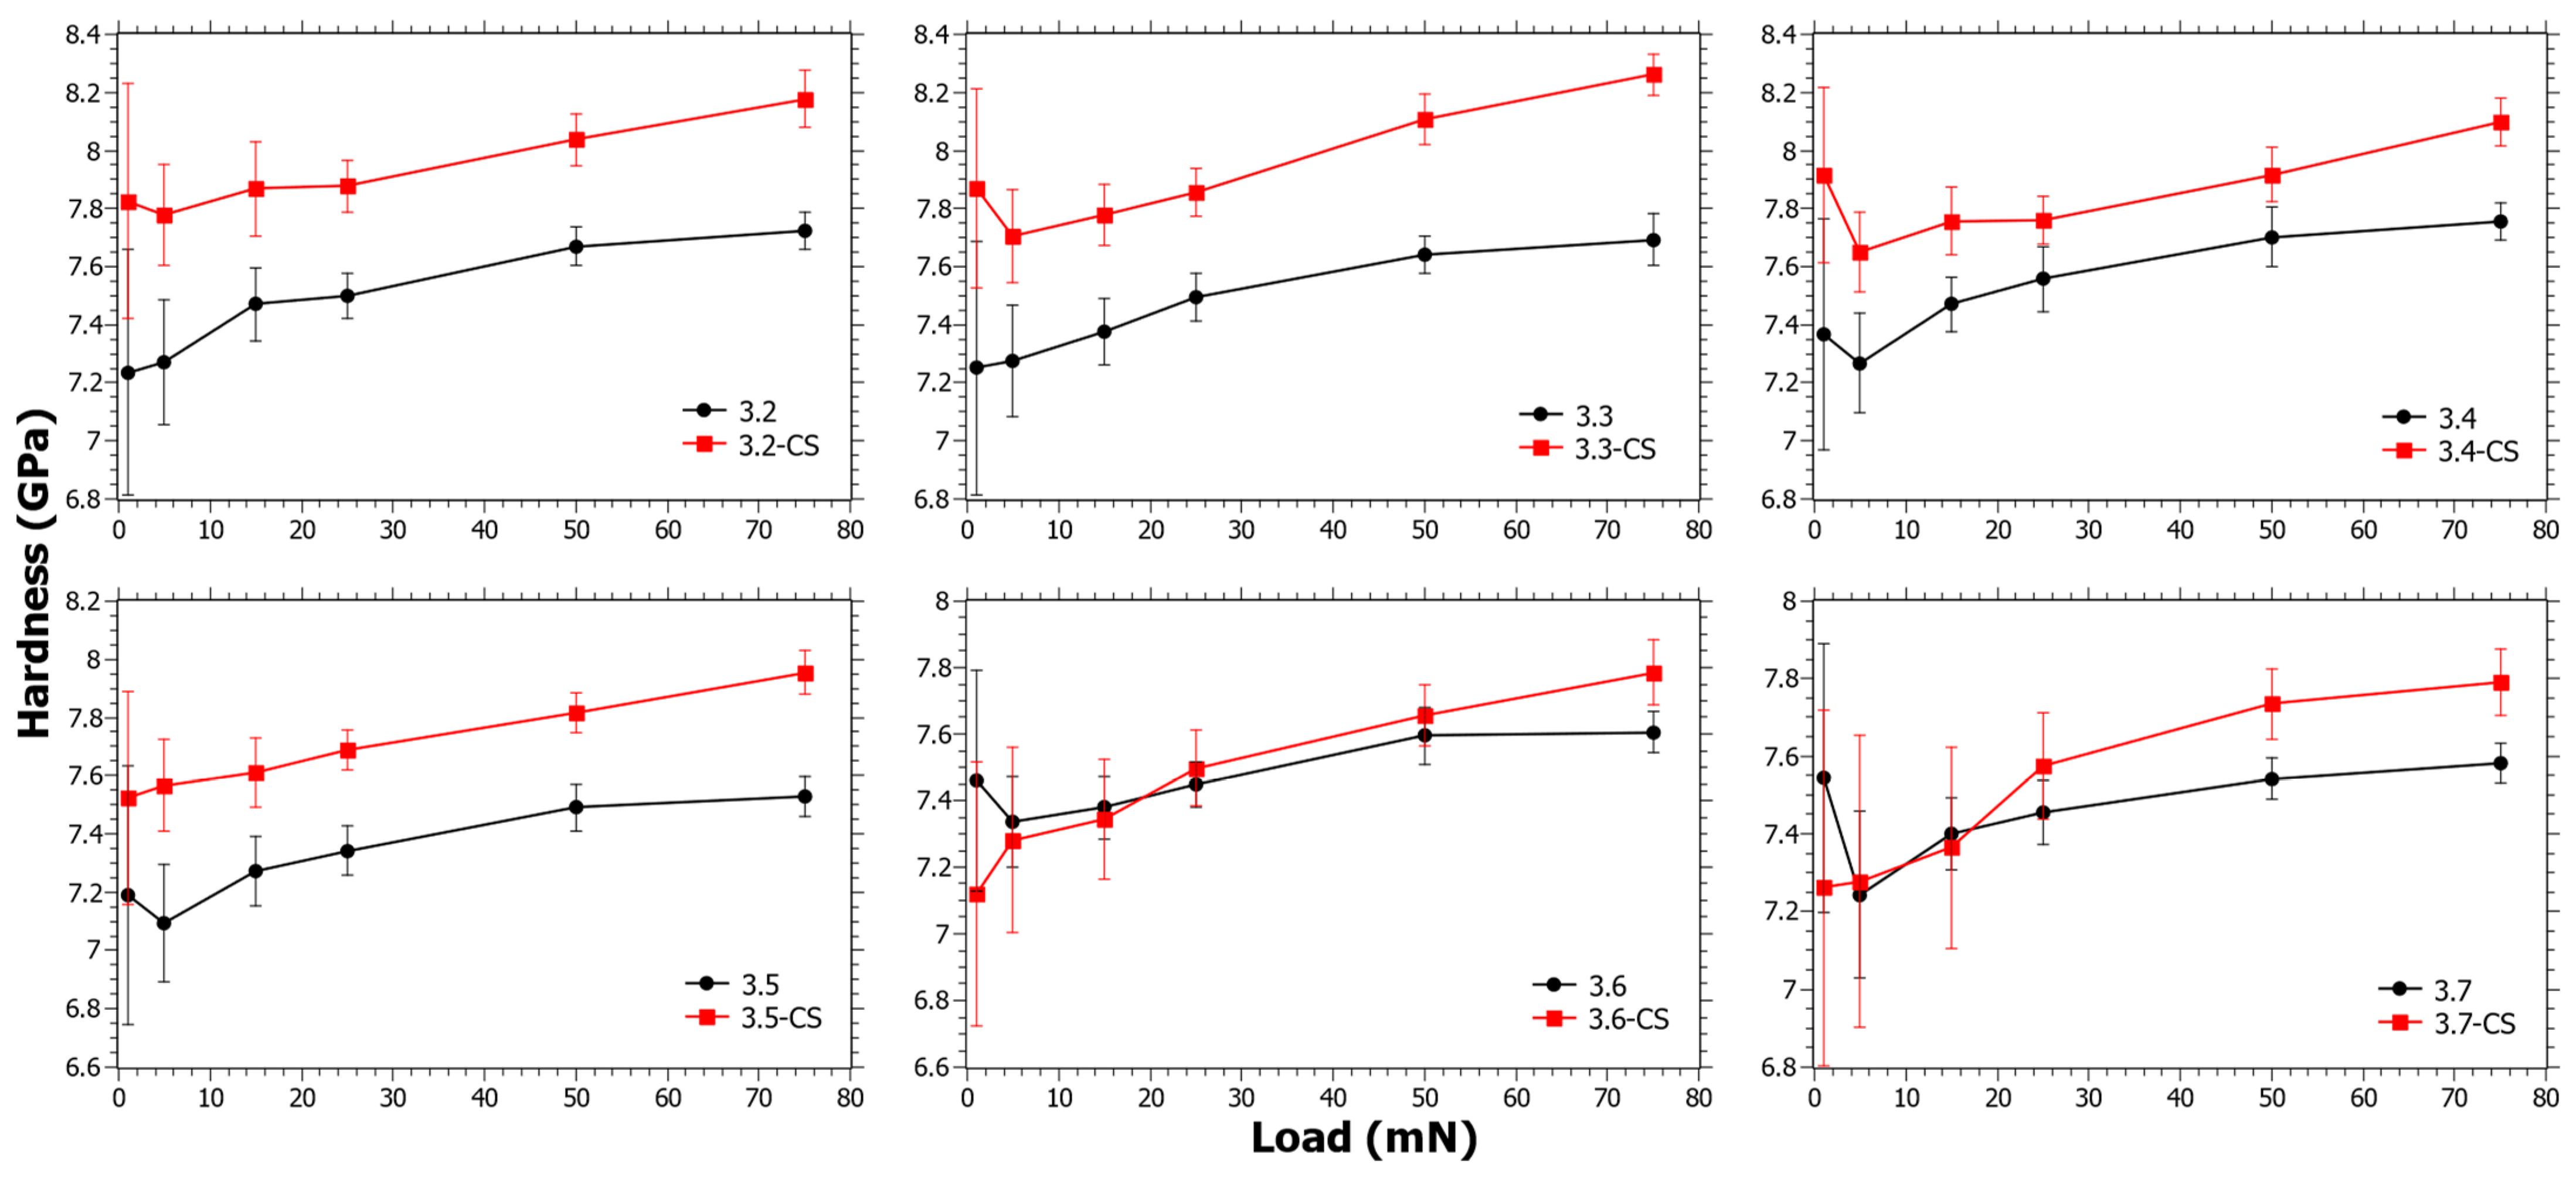
Figure 5.
Crack resistance (CR) as determined using a Vickers indenter and when the percentage of radial crack initiations is equal to 50% following the procedure in [51]. Estimated error is 20% of the CR value and is shown by the error bars in the graph.
Figure 5.
Crack resistance (CR) as determined using a Vickers indenter and when the percentage of radial crack initiations is equal to 50% following the procedure in [51]. Estimated error is 20% of the CR value and is shown by the error bars in the graph.
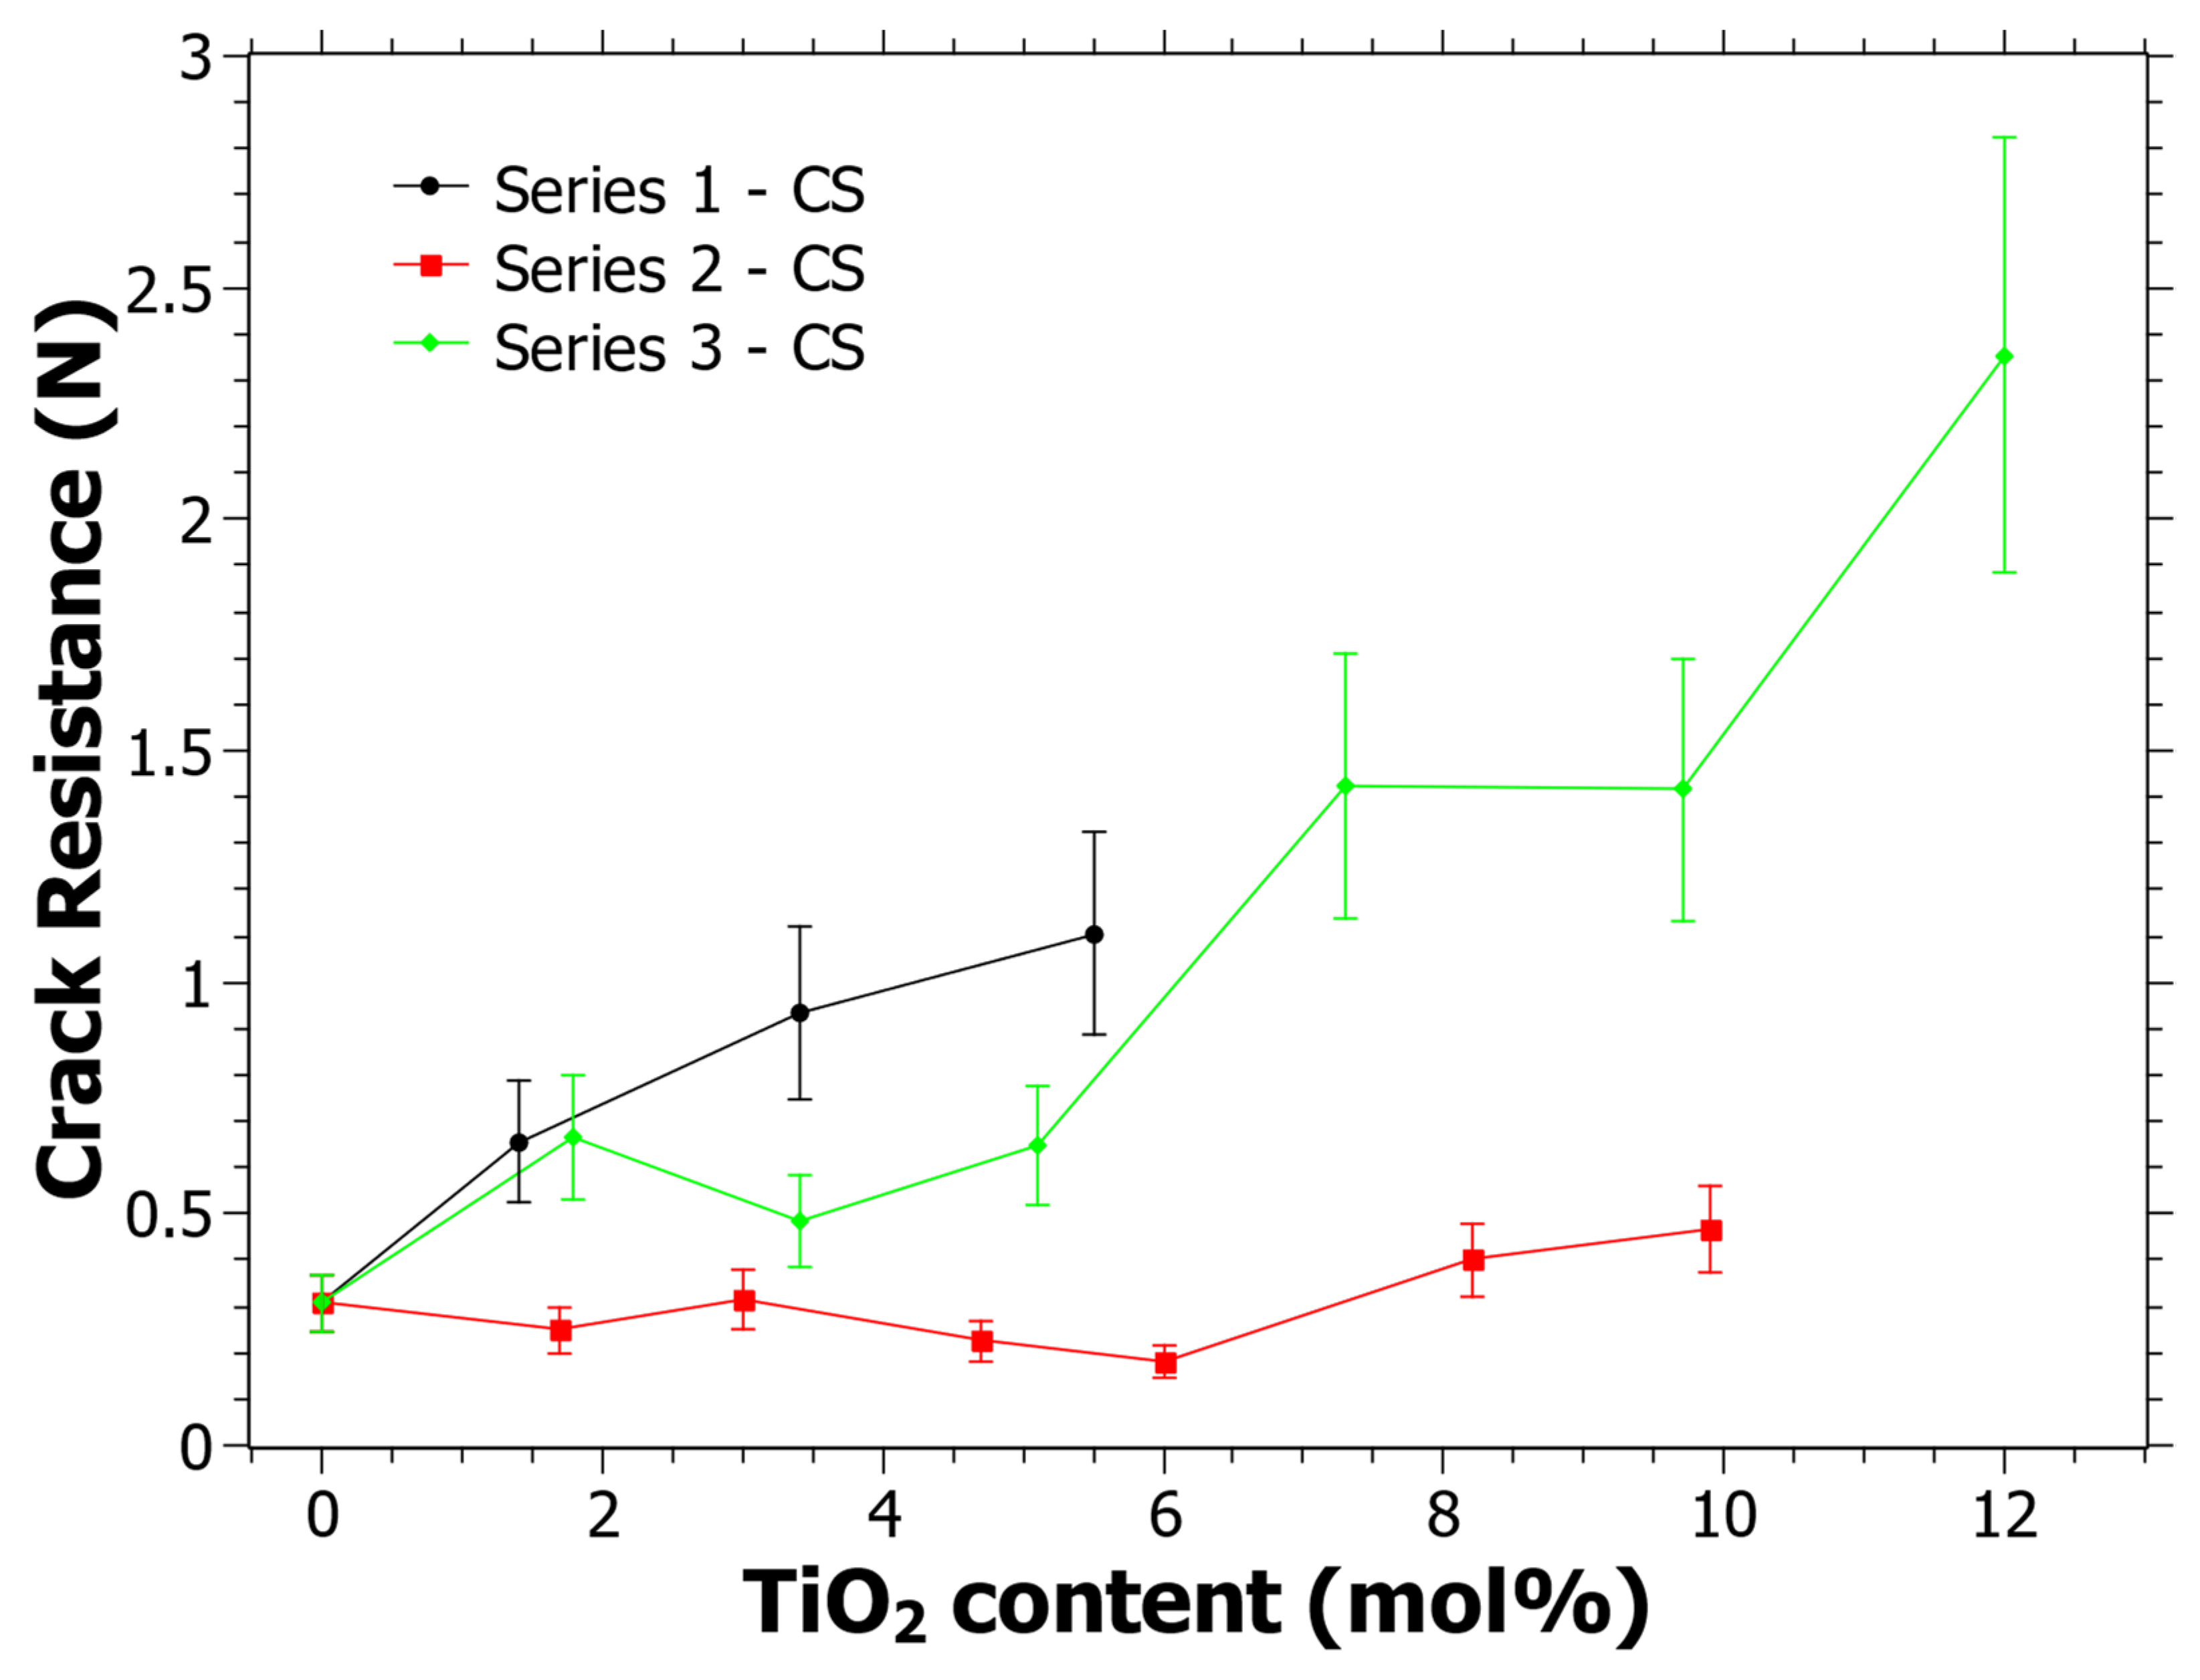
Figure 6.
Crack resistance correlation to (a) Molar Volume (Vm), (b) R2O content where R = Na or K, (c) Ti4+ coordination as shown by the R2O/TiO2 ratio where the red semi-transparent color indicates a mixture of four- and five-coordinated Ti4+ and the green color primarily tetrahedrally coordinated Ti4+ and (d) the Er/H ratio as calculated from the data in Figure 1, i.e., 75 mN nano-indentation load. The semi-transparent colored areas are guides for the eye.

Table 1.
Normalized glass compositions in mol% as analyzed by LA-ICP-MS, density (ρ), molar volume (Vm), atomic packing density (Cg) and oxygen packing density (Cox). The data were taken from refs [24,39] apart from Cox.
| Label | SiO2 | CaO | Na2O | TiO2 | ρ (g/cm3) | Vm (cm3/mol) | Cg | COx |
|---|---|---|---|---|---|---|---|---|
| Series 1 | ||||||||
| 1.1 | 73.9 | 11.2 | 15.0 | 0.0 | 2.514 | 23.86 | 0.499 | 0.07292 |
| 1.2 | 73.9 | 9.8 | 14.8 | 1.4 | 2.503 | 24.05 | 0.497 | 0.07286 |
| 1.3 | 75.6 | 5.5 | 15.6 | 3.4 | 2.478 | 24.57 | 0.494 | 0.07289 |
| 1.4 | 78.3 | 0.6 | 15.6 | 5.5 | 2.443 | 25.13 | 0.490 | 0.07315 |
| Series 2 | ||||||||
| 2.2 | 69.8 | 14.0 | 14.6 | 1.7 | 2.560 | 23.70 | 0.499 | 0.07242 |
| 2.3 | 68.3 | 14.0 | 14.6 | 3.0 | 2.566 | 23.52 | 0.502 | 0.07280 |
| 2.4 | 67.0 | 13.3 | 15.0 | 4.7 | 2.594 | 23.43 | 0.505 | 0.07329 |
| 2.5 | 65.8 | 13.2 | 15.0 | 6.0 | 2.605 | 23.44 | 0.505 | 0.07328 |
| 2.6 | 62.8 | 13.9 | 15.1 | 8.2 | 2.638 | 23.29 | 0.507 | 0.07342 |
| 2.7 | 61.3 | 13.8 | 15.0 | 9.9 | 2.661 | 23.21 | 0.509 | 0.07376 |
| Series 3 | ||||||||
| 3.2 | 71.6 | 12.1 | 14.5 | 1.8 | 2.519 | 23.88 | 0.497 | 0.07261 |
| 3.3 | 71.5 | 10.1 | 15.0 | 3.4 | 2.520 | 24.12 | 0.495 | 0.07251 |
| 3.4 | 72.3 | 7.3 | 15.4 | 5.1 | 2.526 | 24.30 | 0.497 | 0.07306 |
| 3.5 | 71.9 | 5.1 | 15.7 | 7.3 | 2.525 | 24.43 | 0.497 | 0.07334 |
| 3.6 | 71.6 | 2.5 | 16.3 | 9.7 | 2.535 | 24.51 | 0.500 | 0.07402 |
| 3.7 | 71.3 | 0.4 | 16.3 | 12.0 | 2.535 | 25.55 | 0.497 | 0.07174 |
| Uncertainties | ±1.3 | ±0.3 | ±0.3 | ±0.2 | ±0.2% | - | - | - |
Publisher’s Note: MDPI stays neutral with regard to jurisdictional claims in published maps and institutional affiliations. |
© 2022 by the author. Licensee MDPI, Basel, Switzerland. This article is an open access article distributed under the terms and conditions of the Creative Commons Attribution (CC BY) license (https://creativecommons.org/licenses/by/4.0/).
Share and Cite
MDPI and ACS Style
Karlsson, S. Compositional Effects on Indentation Mechanical Properties of Chemically Strengthened TiO2-Doped Soda Lime Silicate Glasses. Materials 2022, 15, 577. https://doi.org/10.3390/ma15020577
AMA Style
Karlsson S. Compositional Effects on Indentation Mechanical Properties of Chemically Strengthened TiO2-Doped Soda Lime Silicate Glasses. Materials. 2022; 15(2):577. https://doi.org/10.3390/ma15020577
Chicago/Turabian StyleKarlsson, Stefan. 2022. "Compositional Effects on Indentation Mechanical Properties of Chemically Strengthened TiO2-Doped Soda Lime Silicate Glasses" Materials 15, no. 2: 577. https://doi.org/10.3390/ma15020577
Note that from the first issue of 2016, this journal uses article numbers instead of page numbers. See further details here.