
Experimental and Analytical Research on Flexural Behavior of Concrete-Filled High-Strength Steel Tubular Members

Abstract
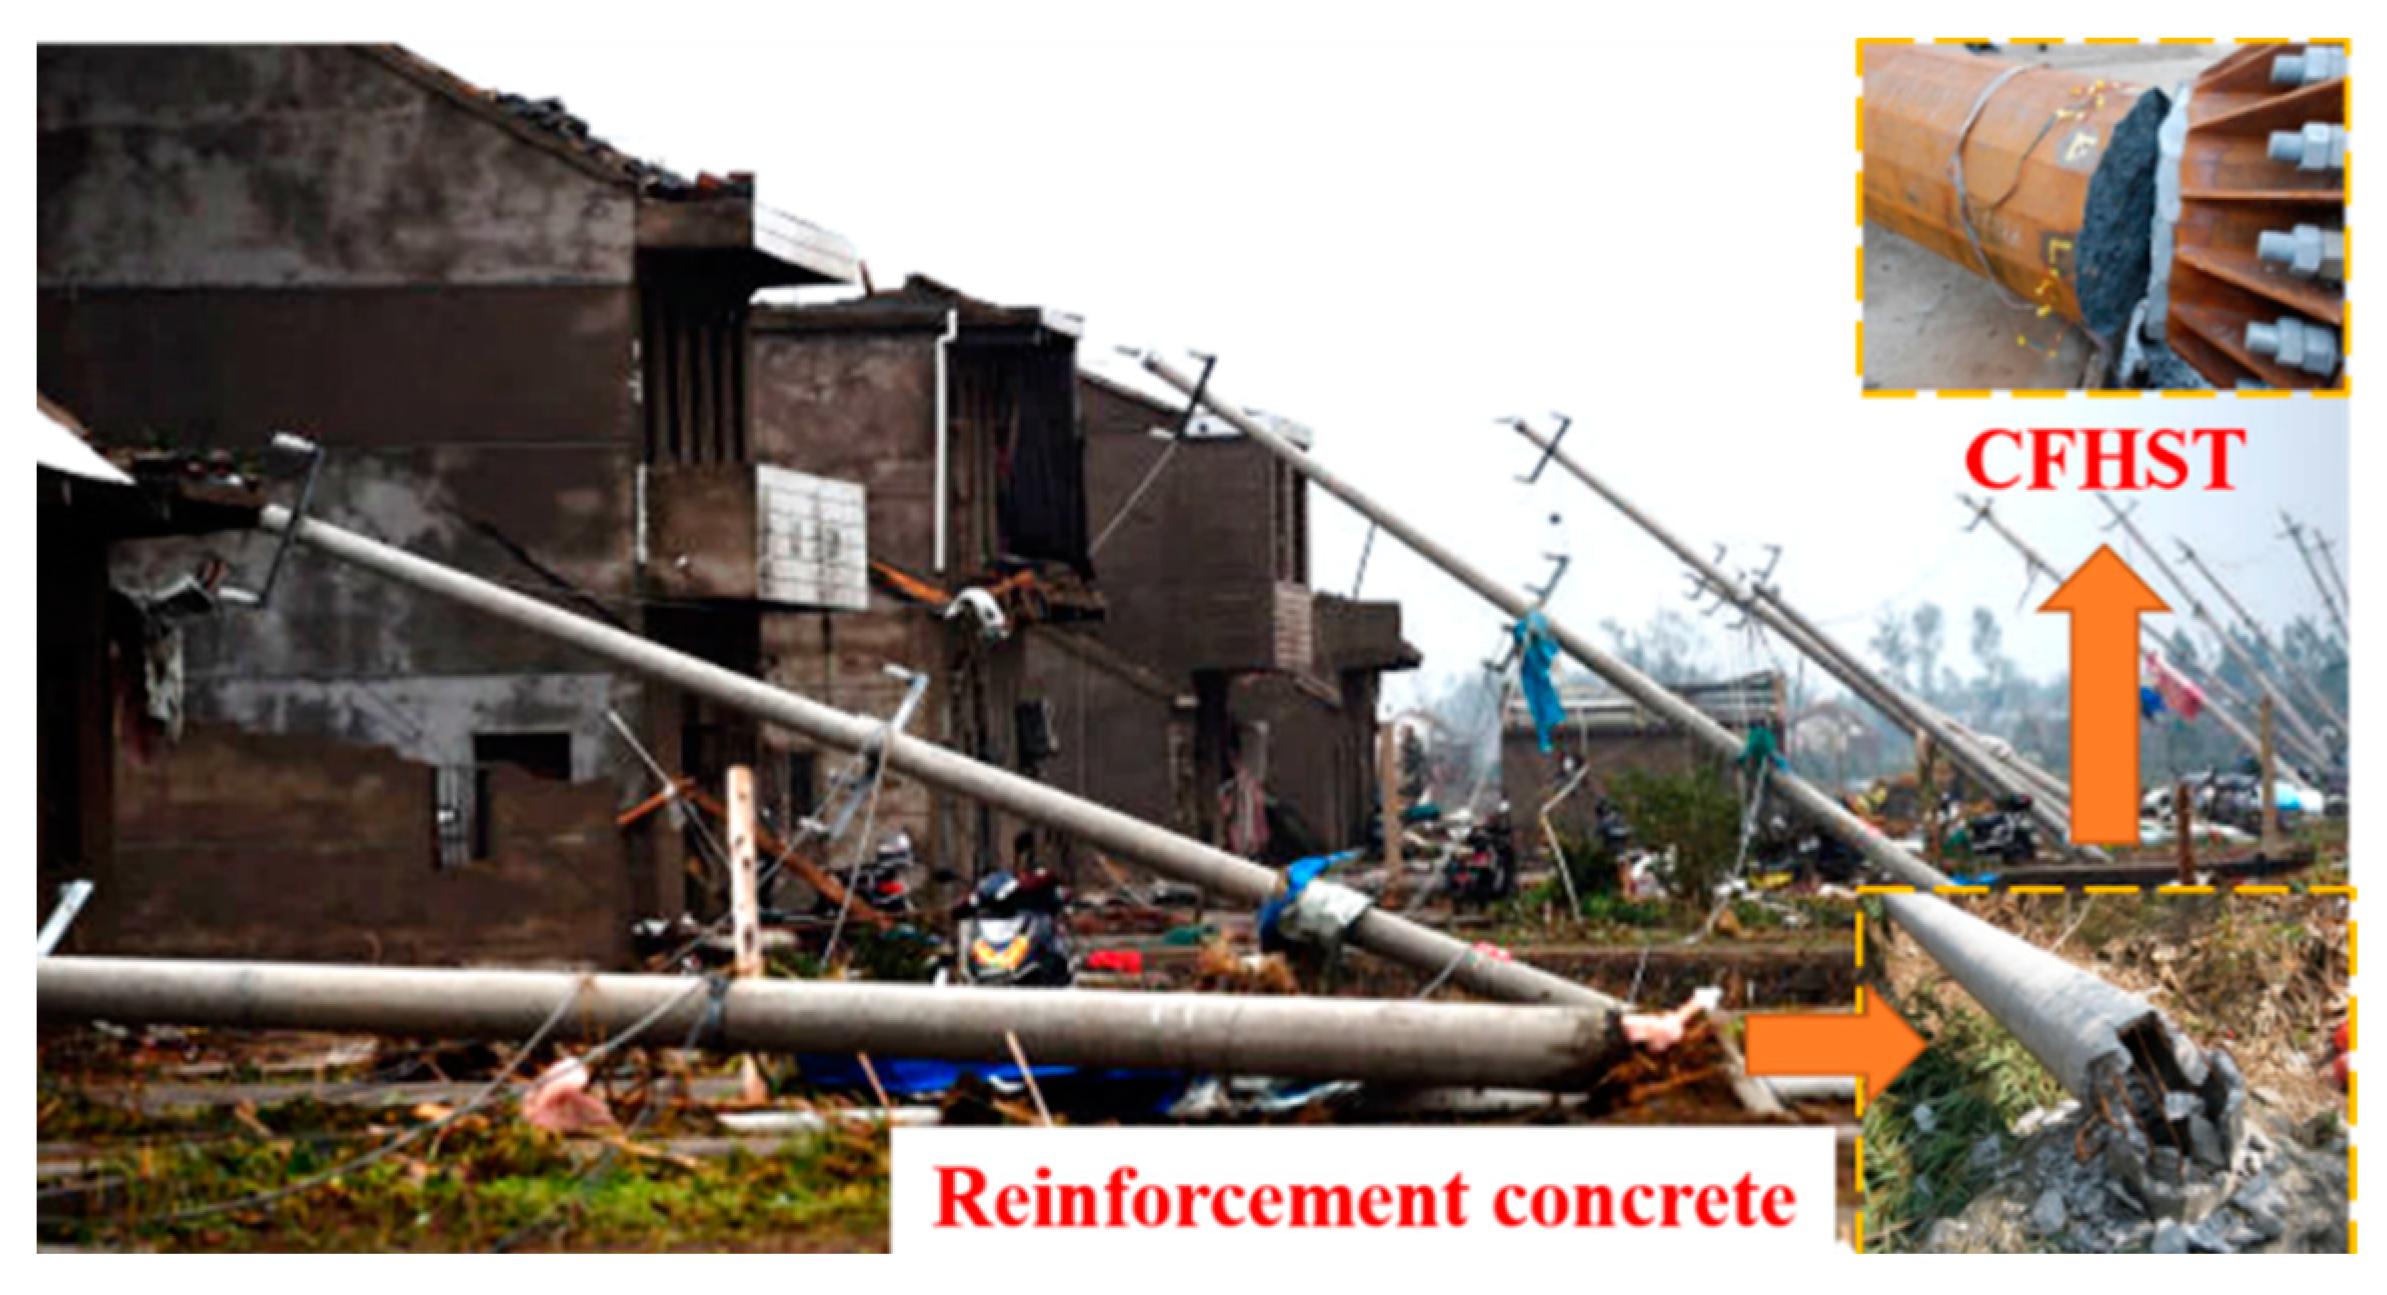
:1. Introduction
2. Experimental Program
2.1. Specimen Design
2.2. Materials
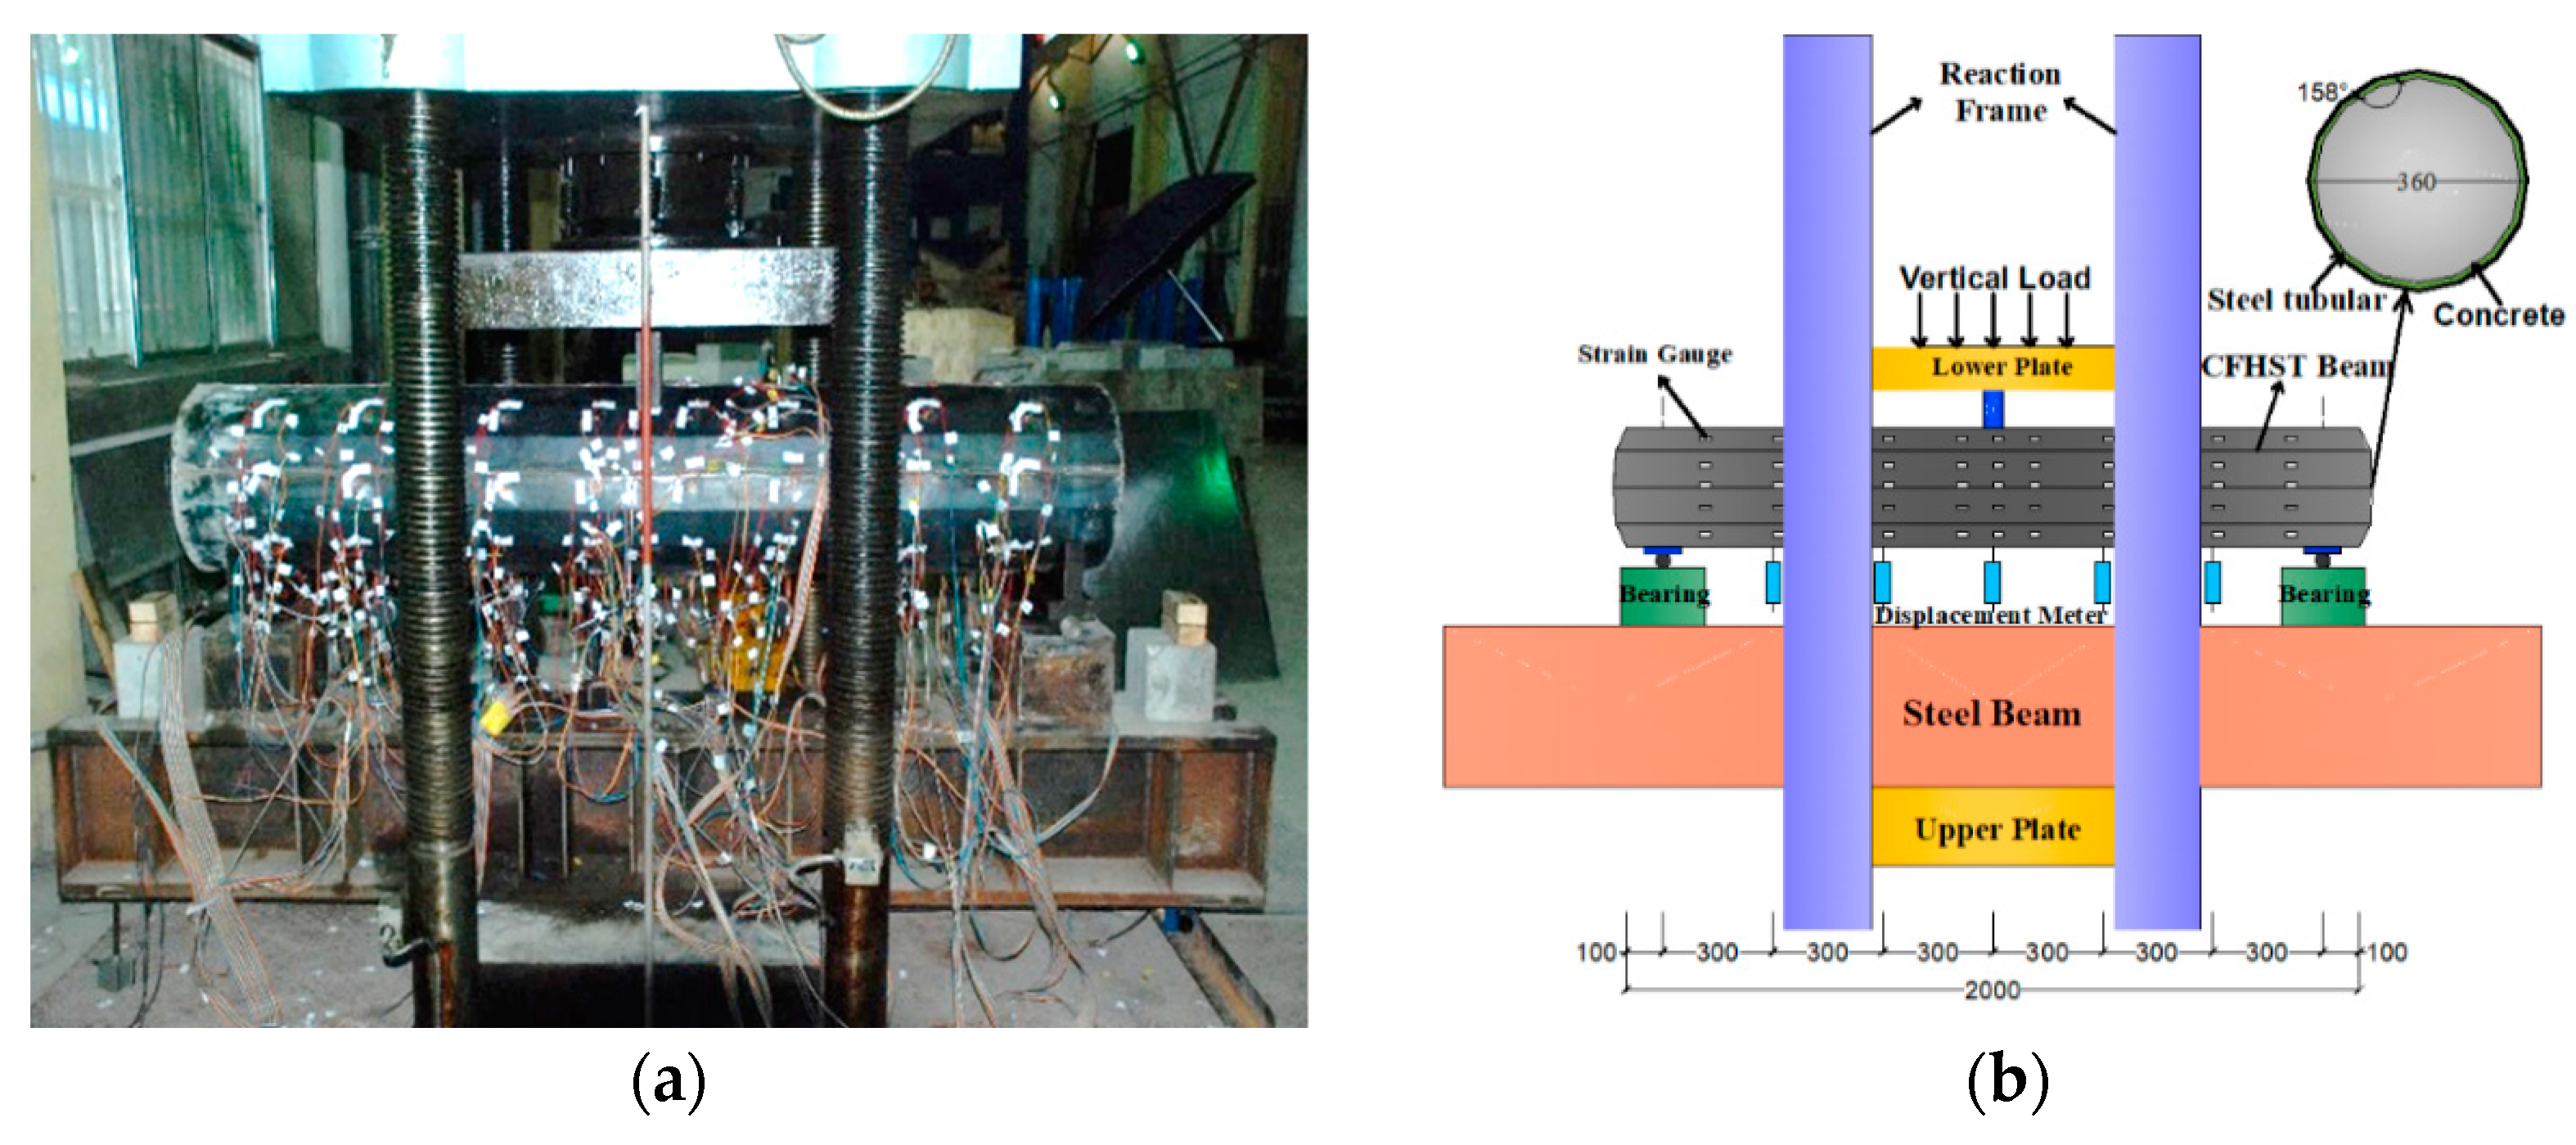
2.3. Test Setup and Procedure
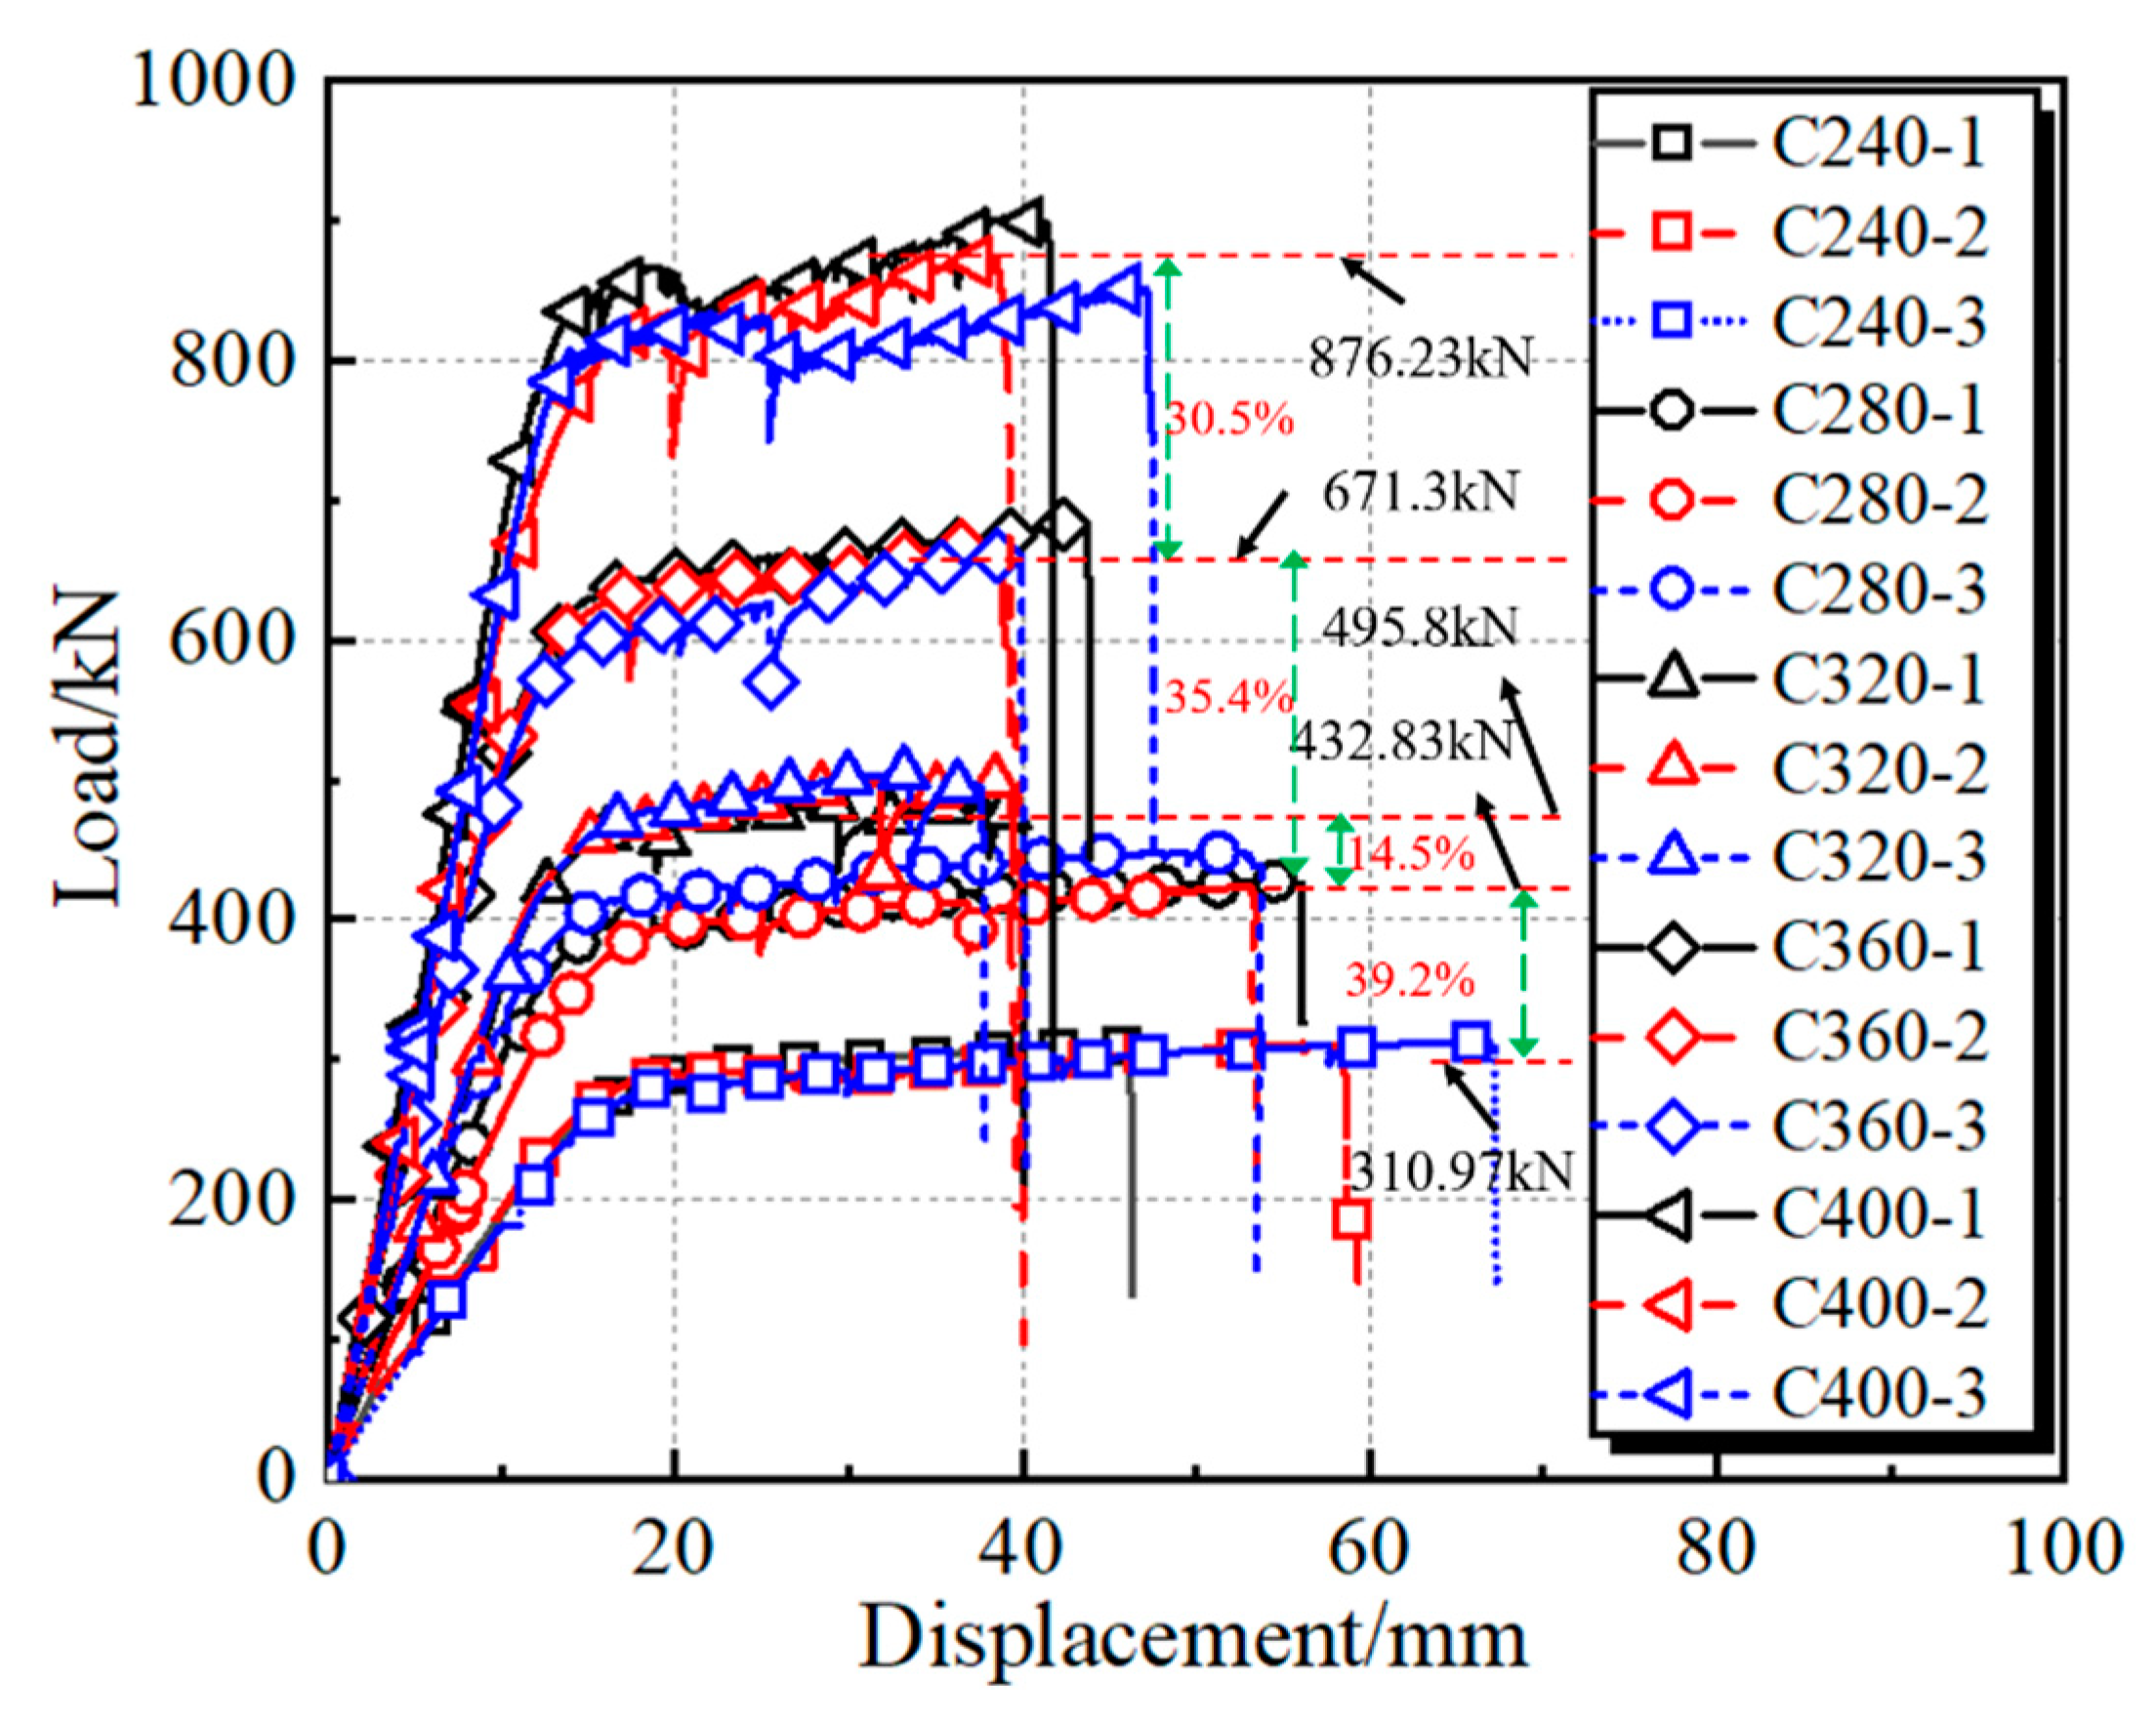
3. Experimental Results and Discussion
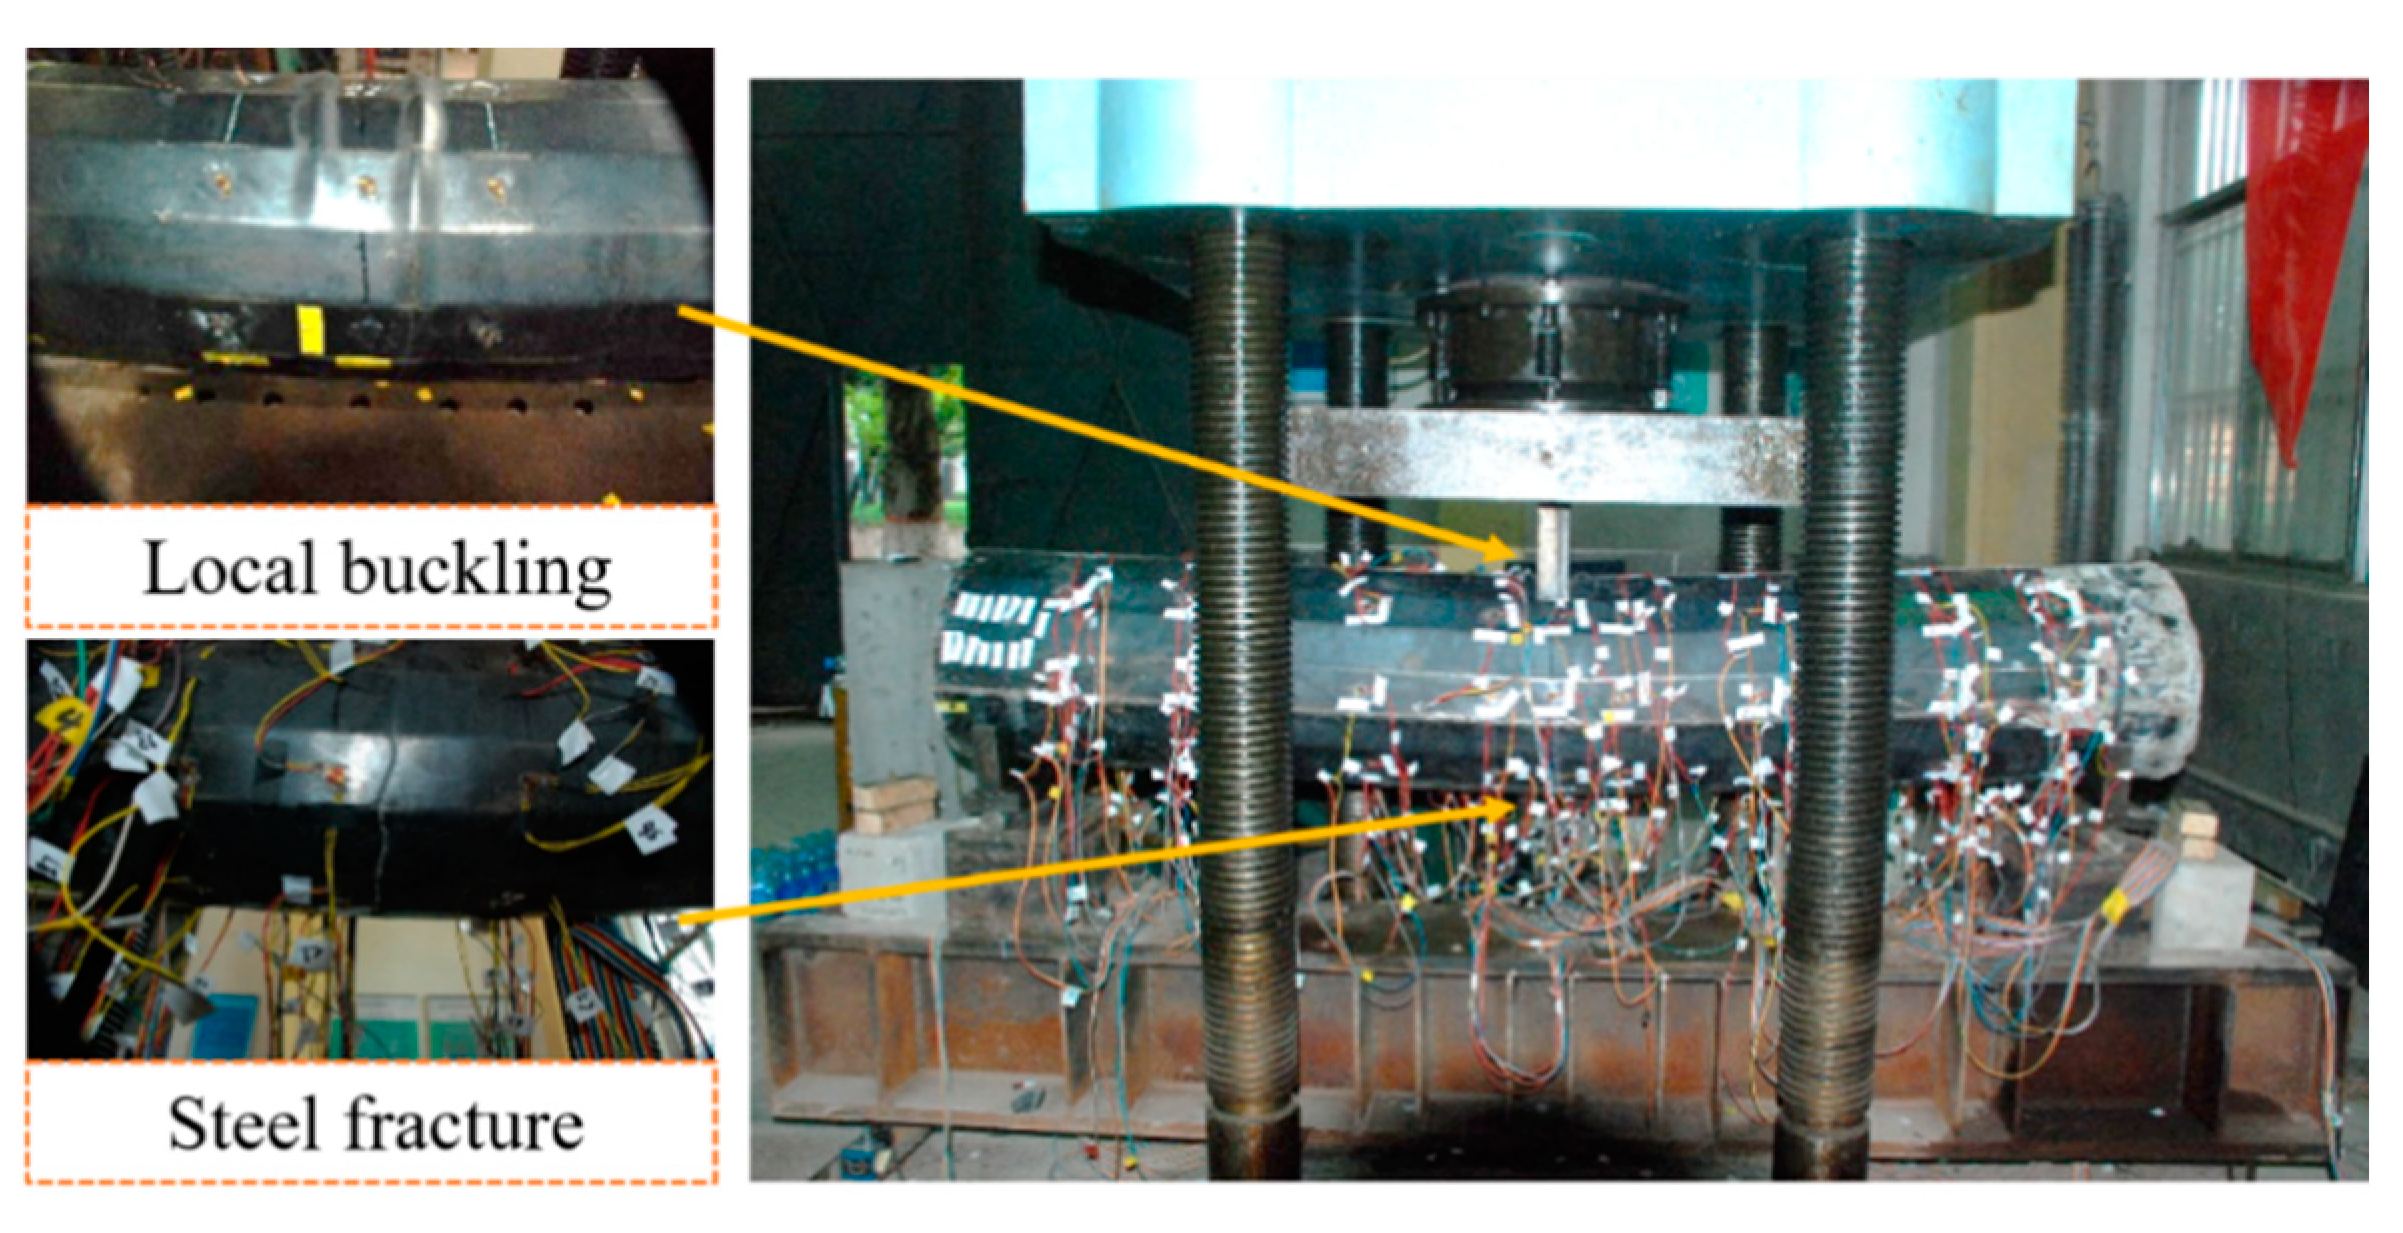
3.1. Failure Modes
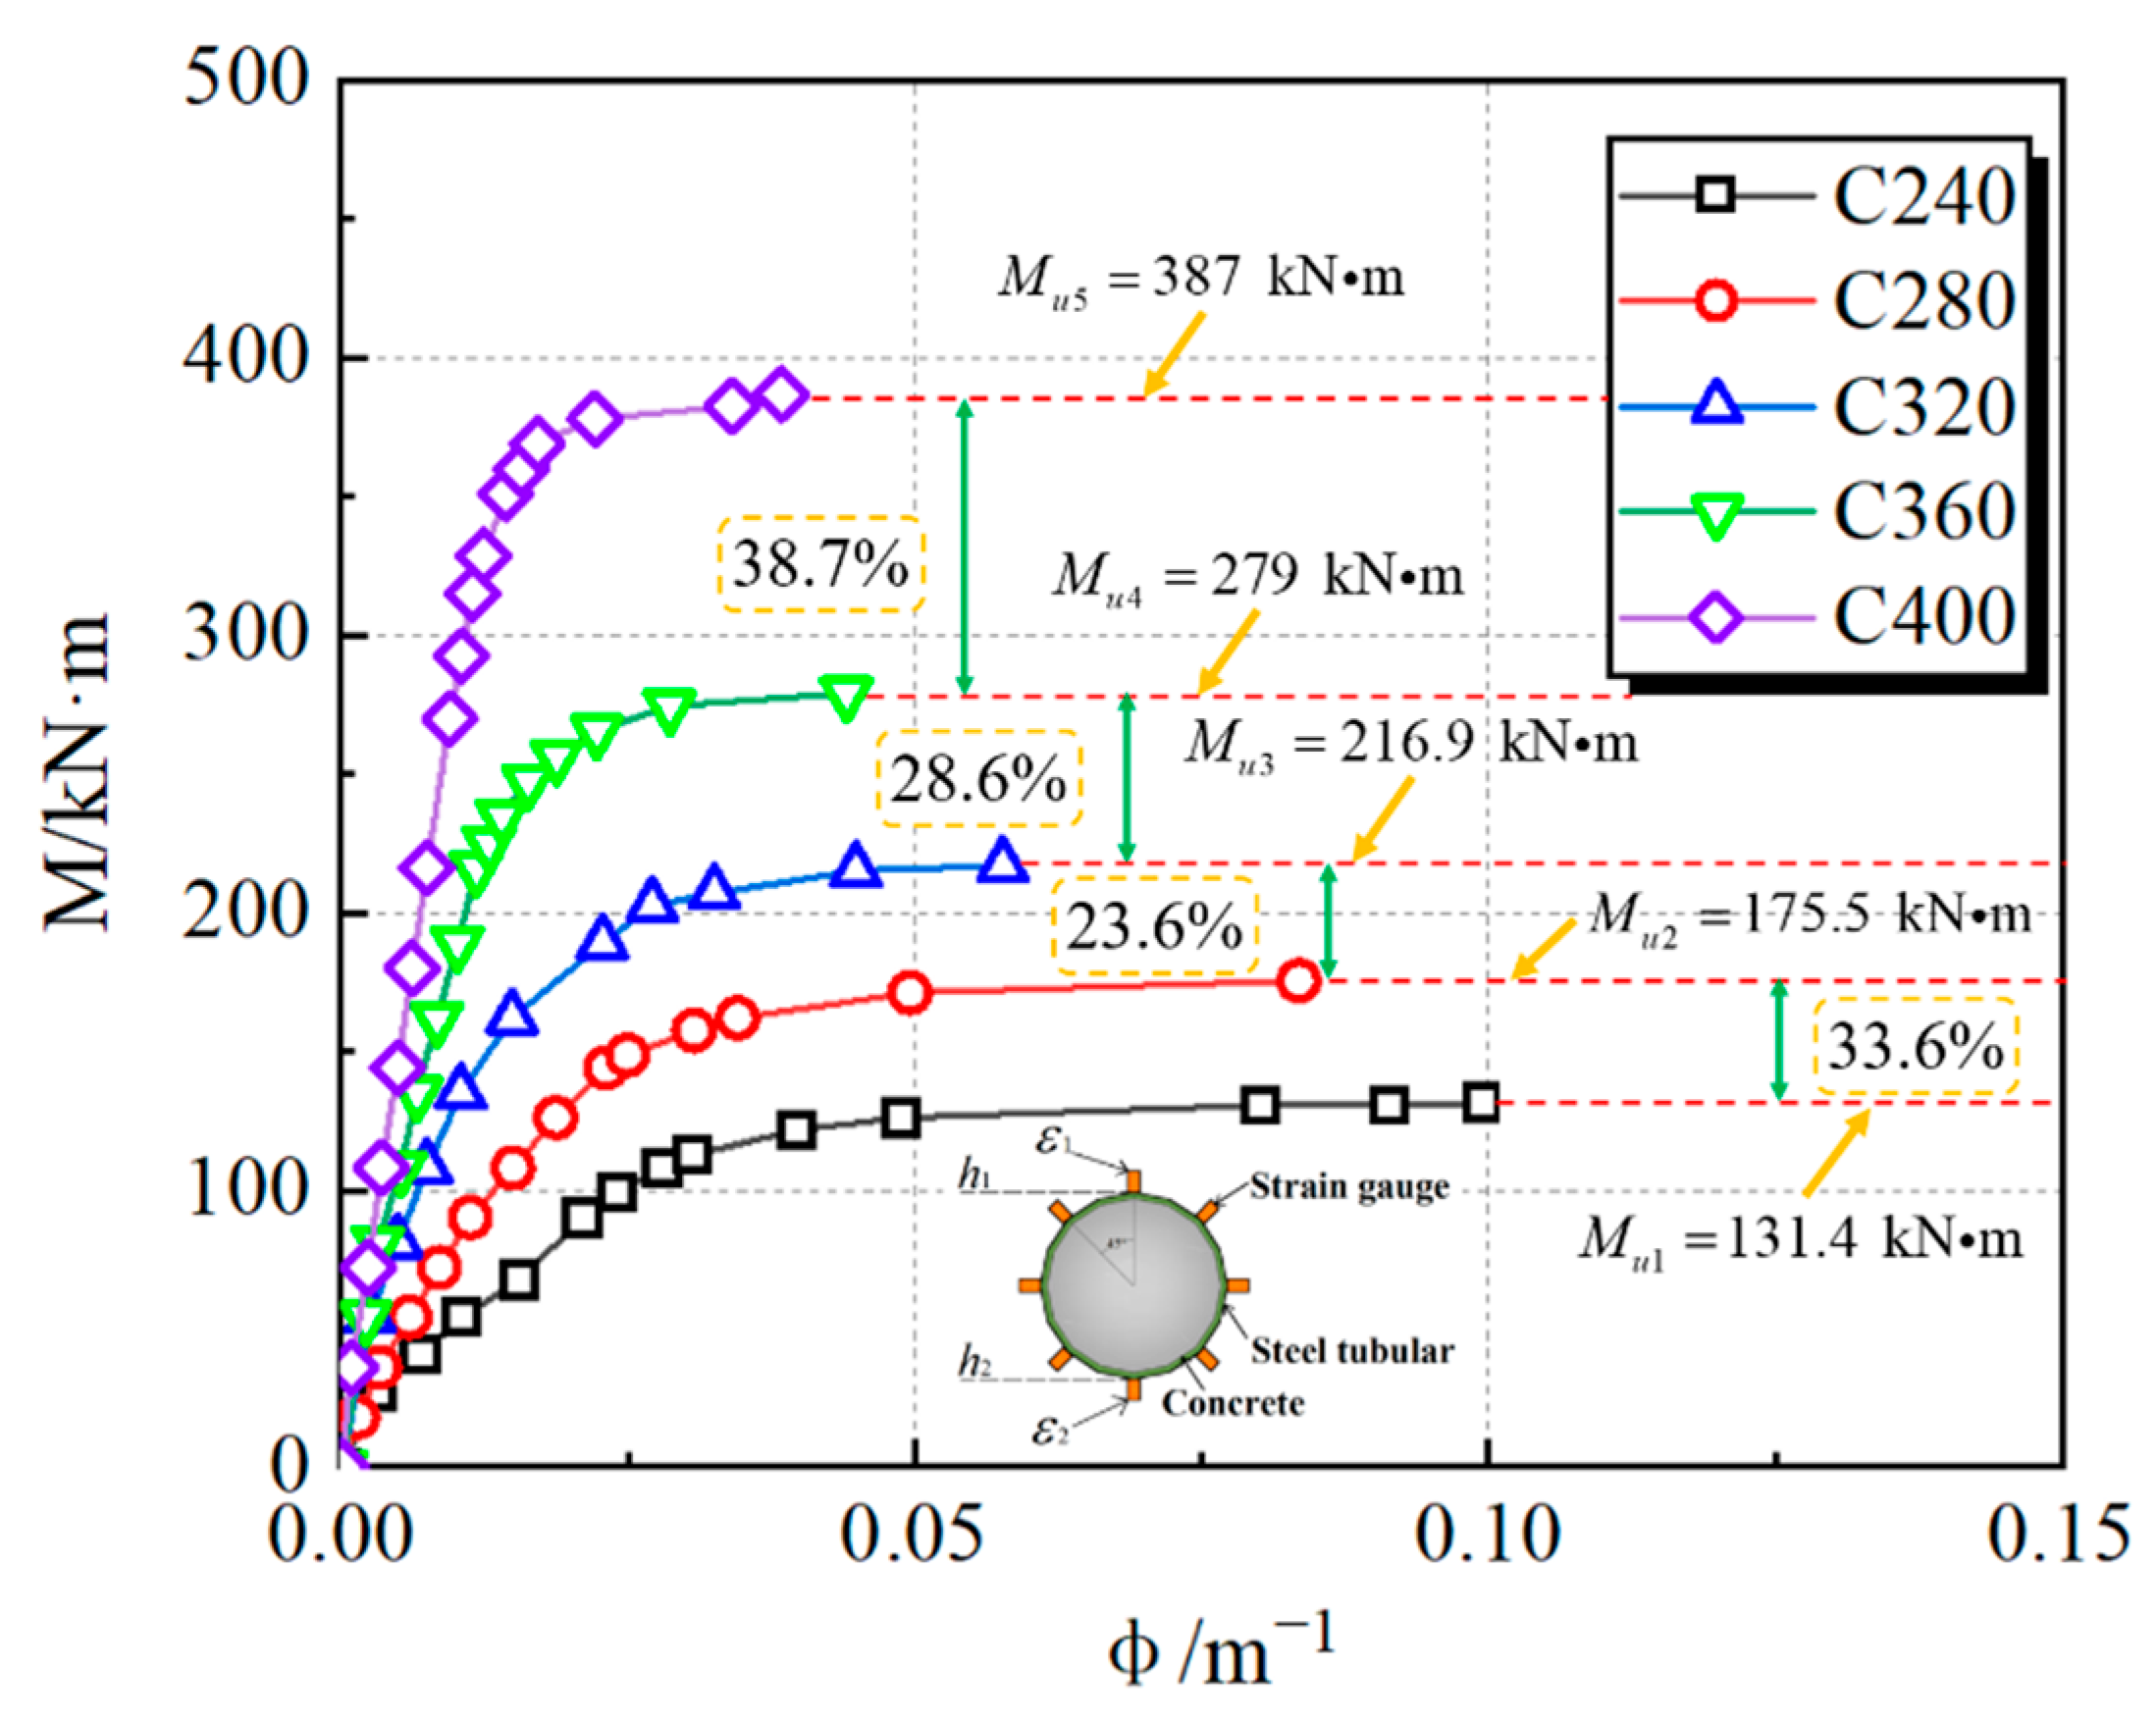
3.2. Analysis and Discussion
4. Numerical Investigation
4.1. Finite Element Model
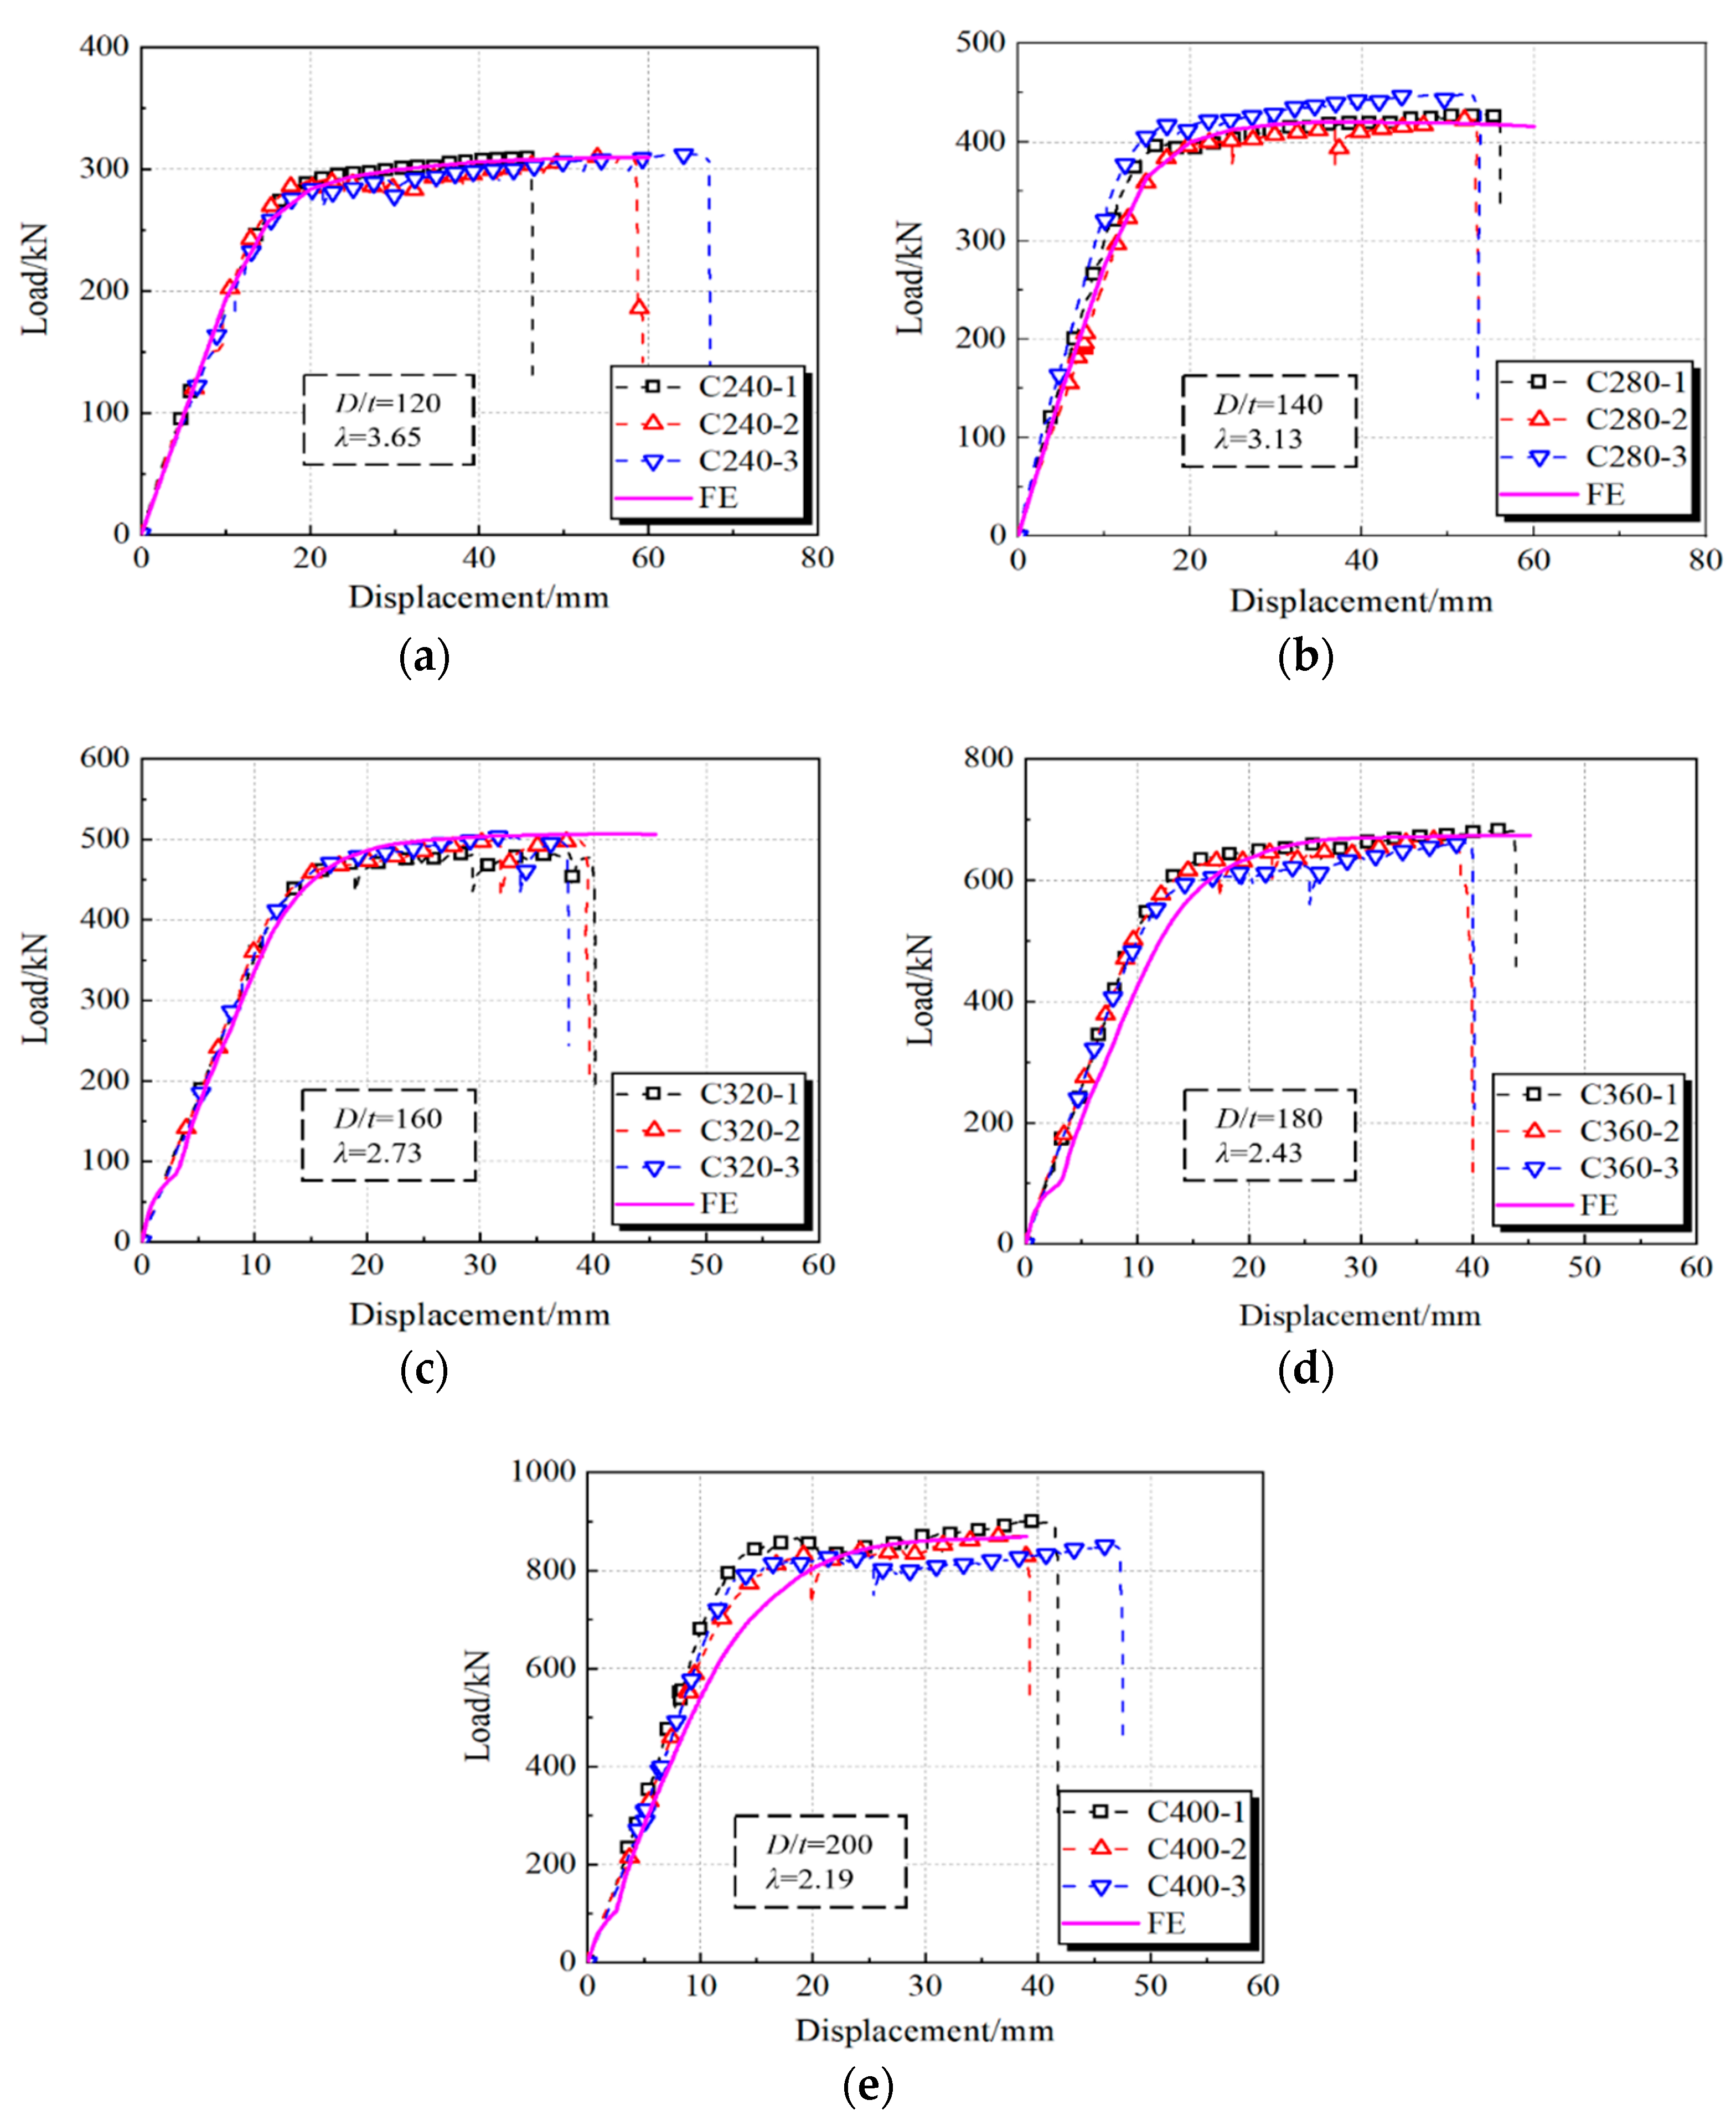
4.2. Verification of the FEMs
4.3. Full-Range Analysis on Flexural Performance
- (1)
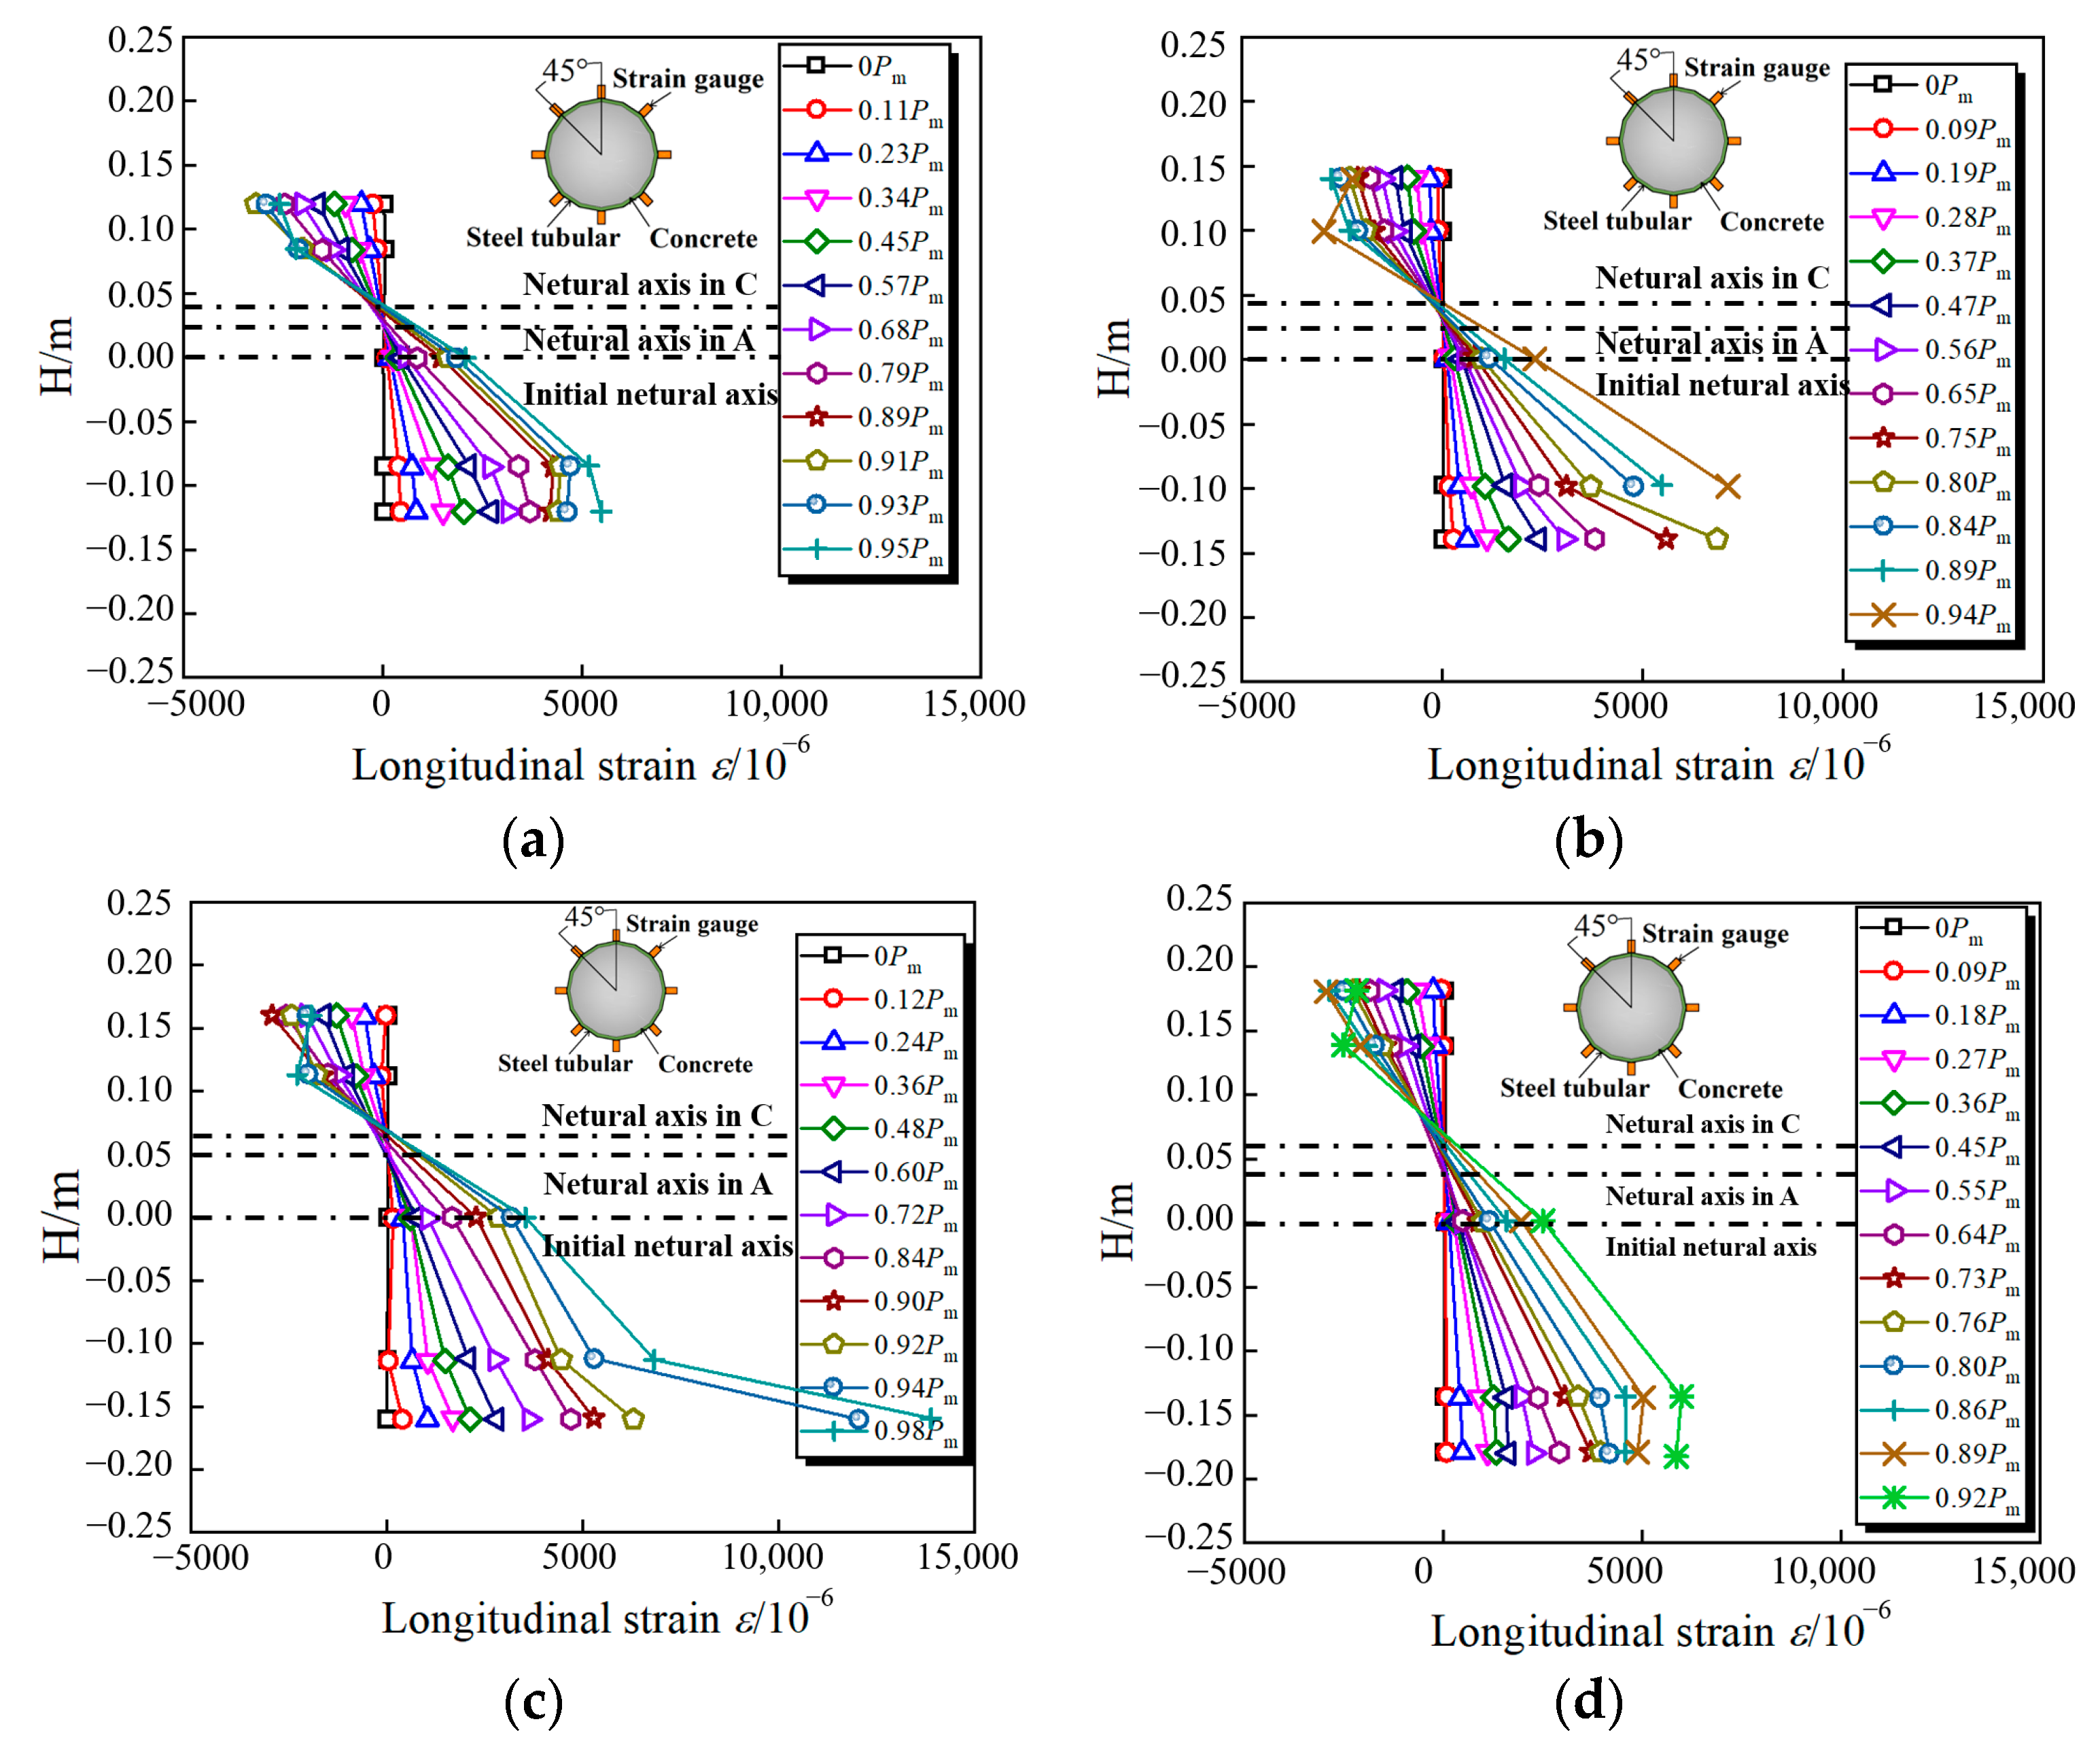
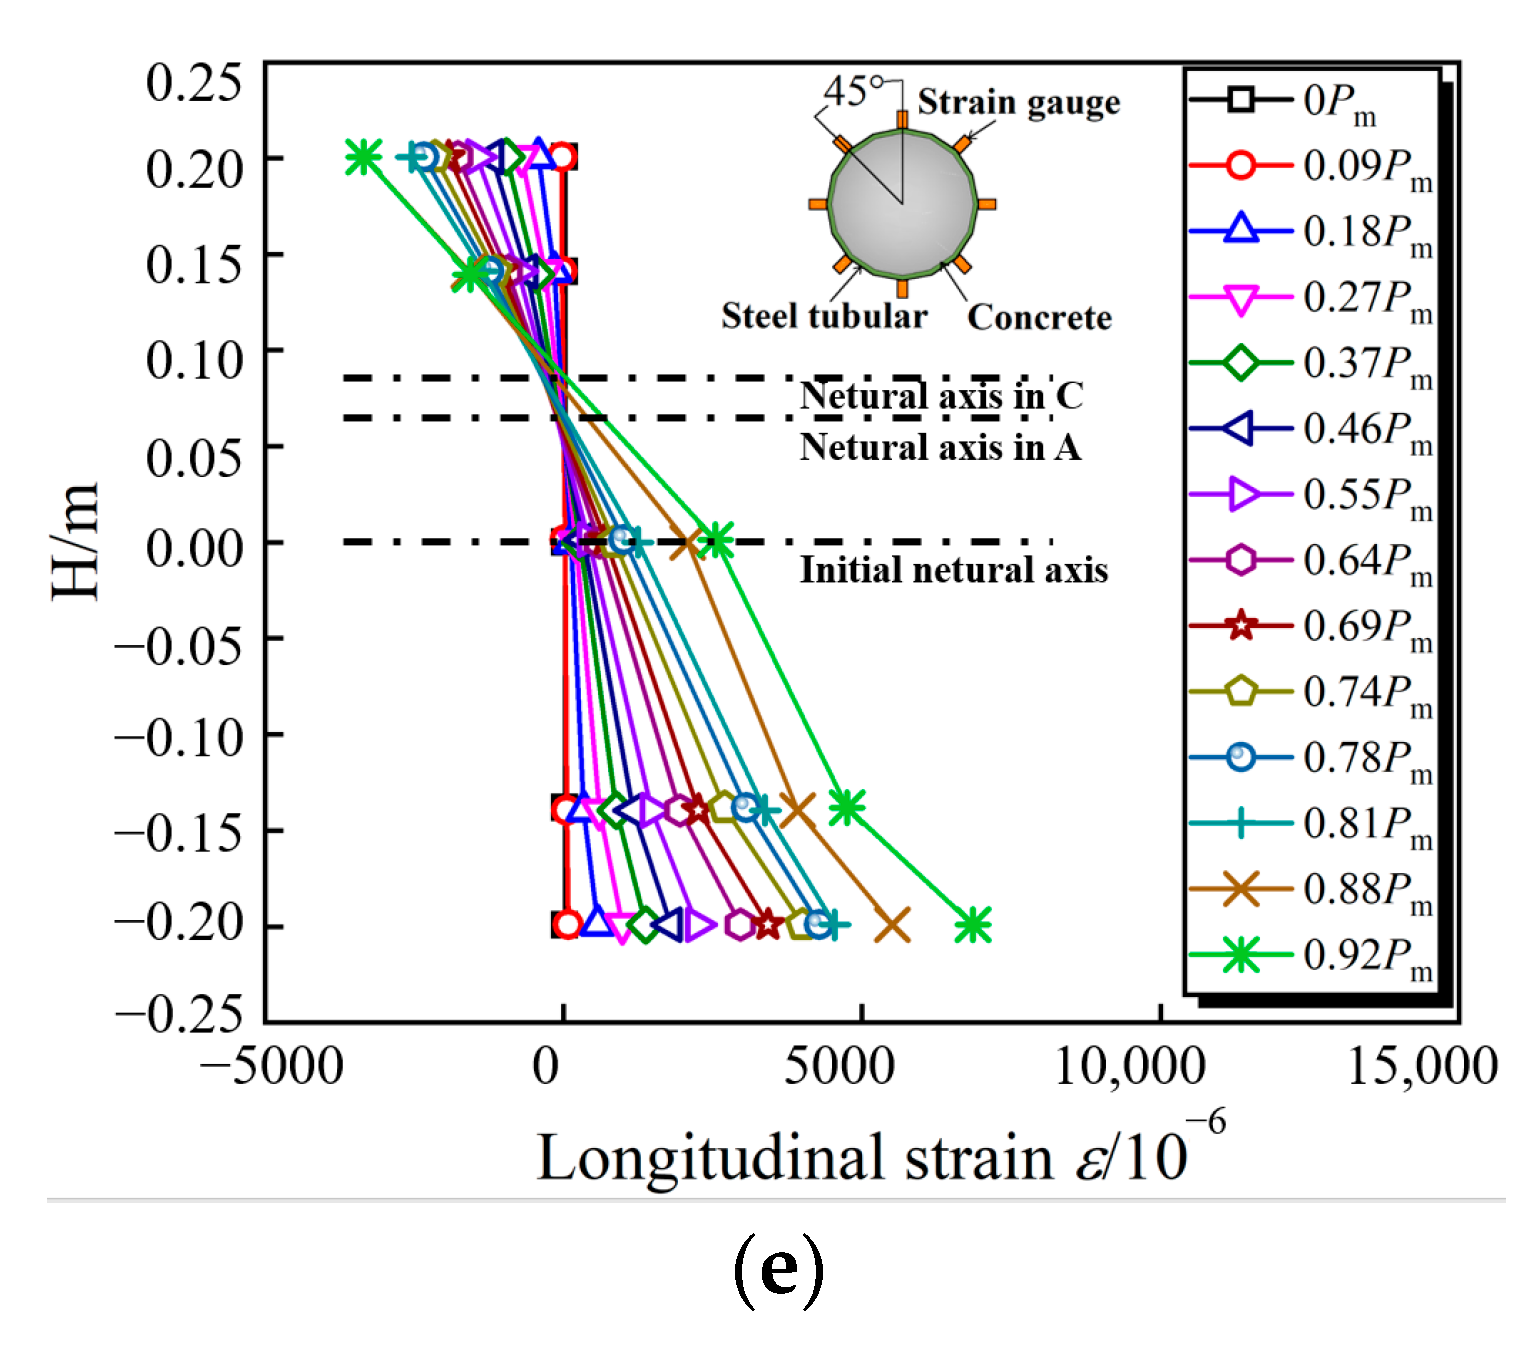
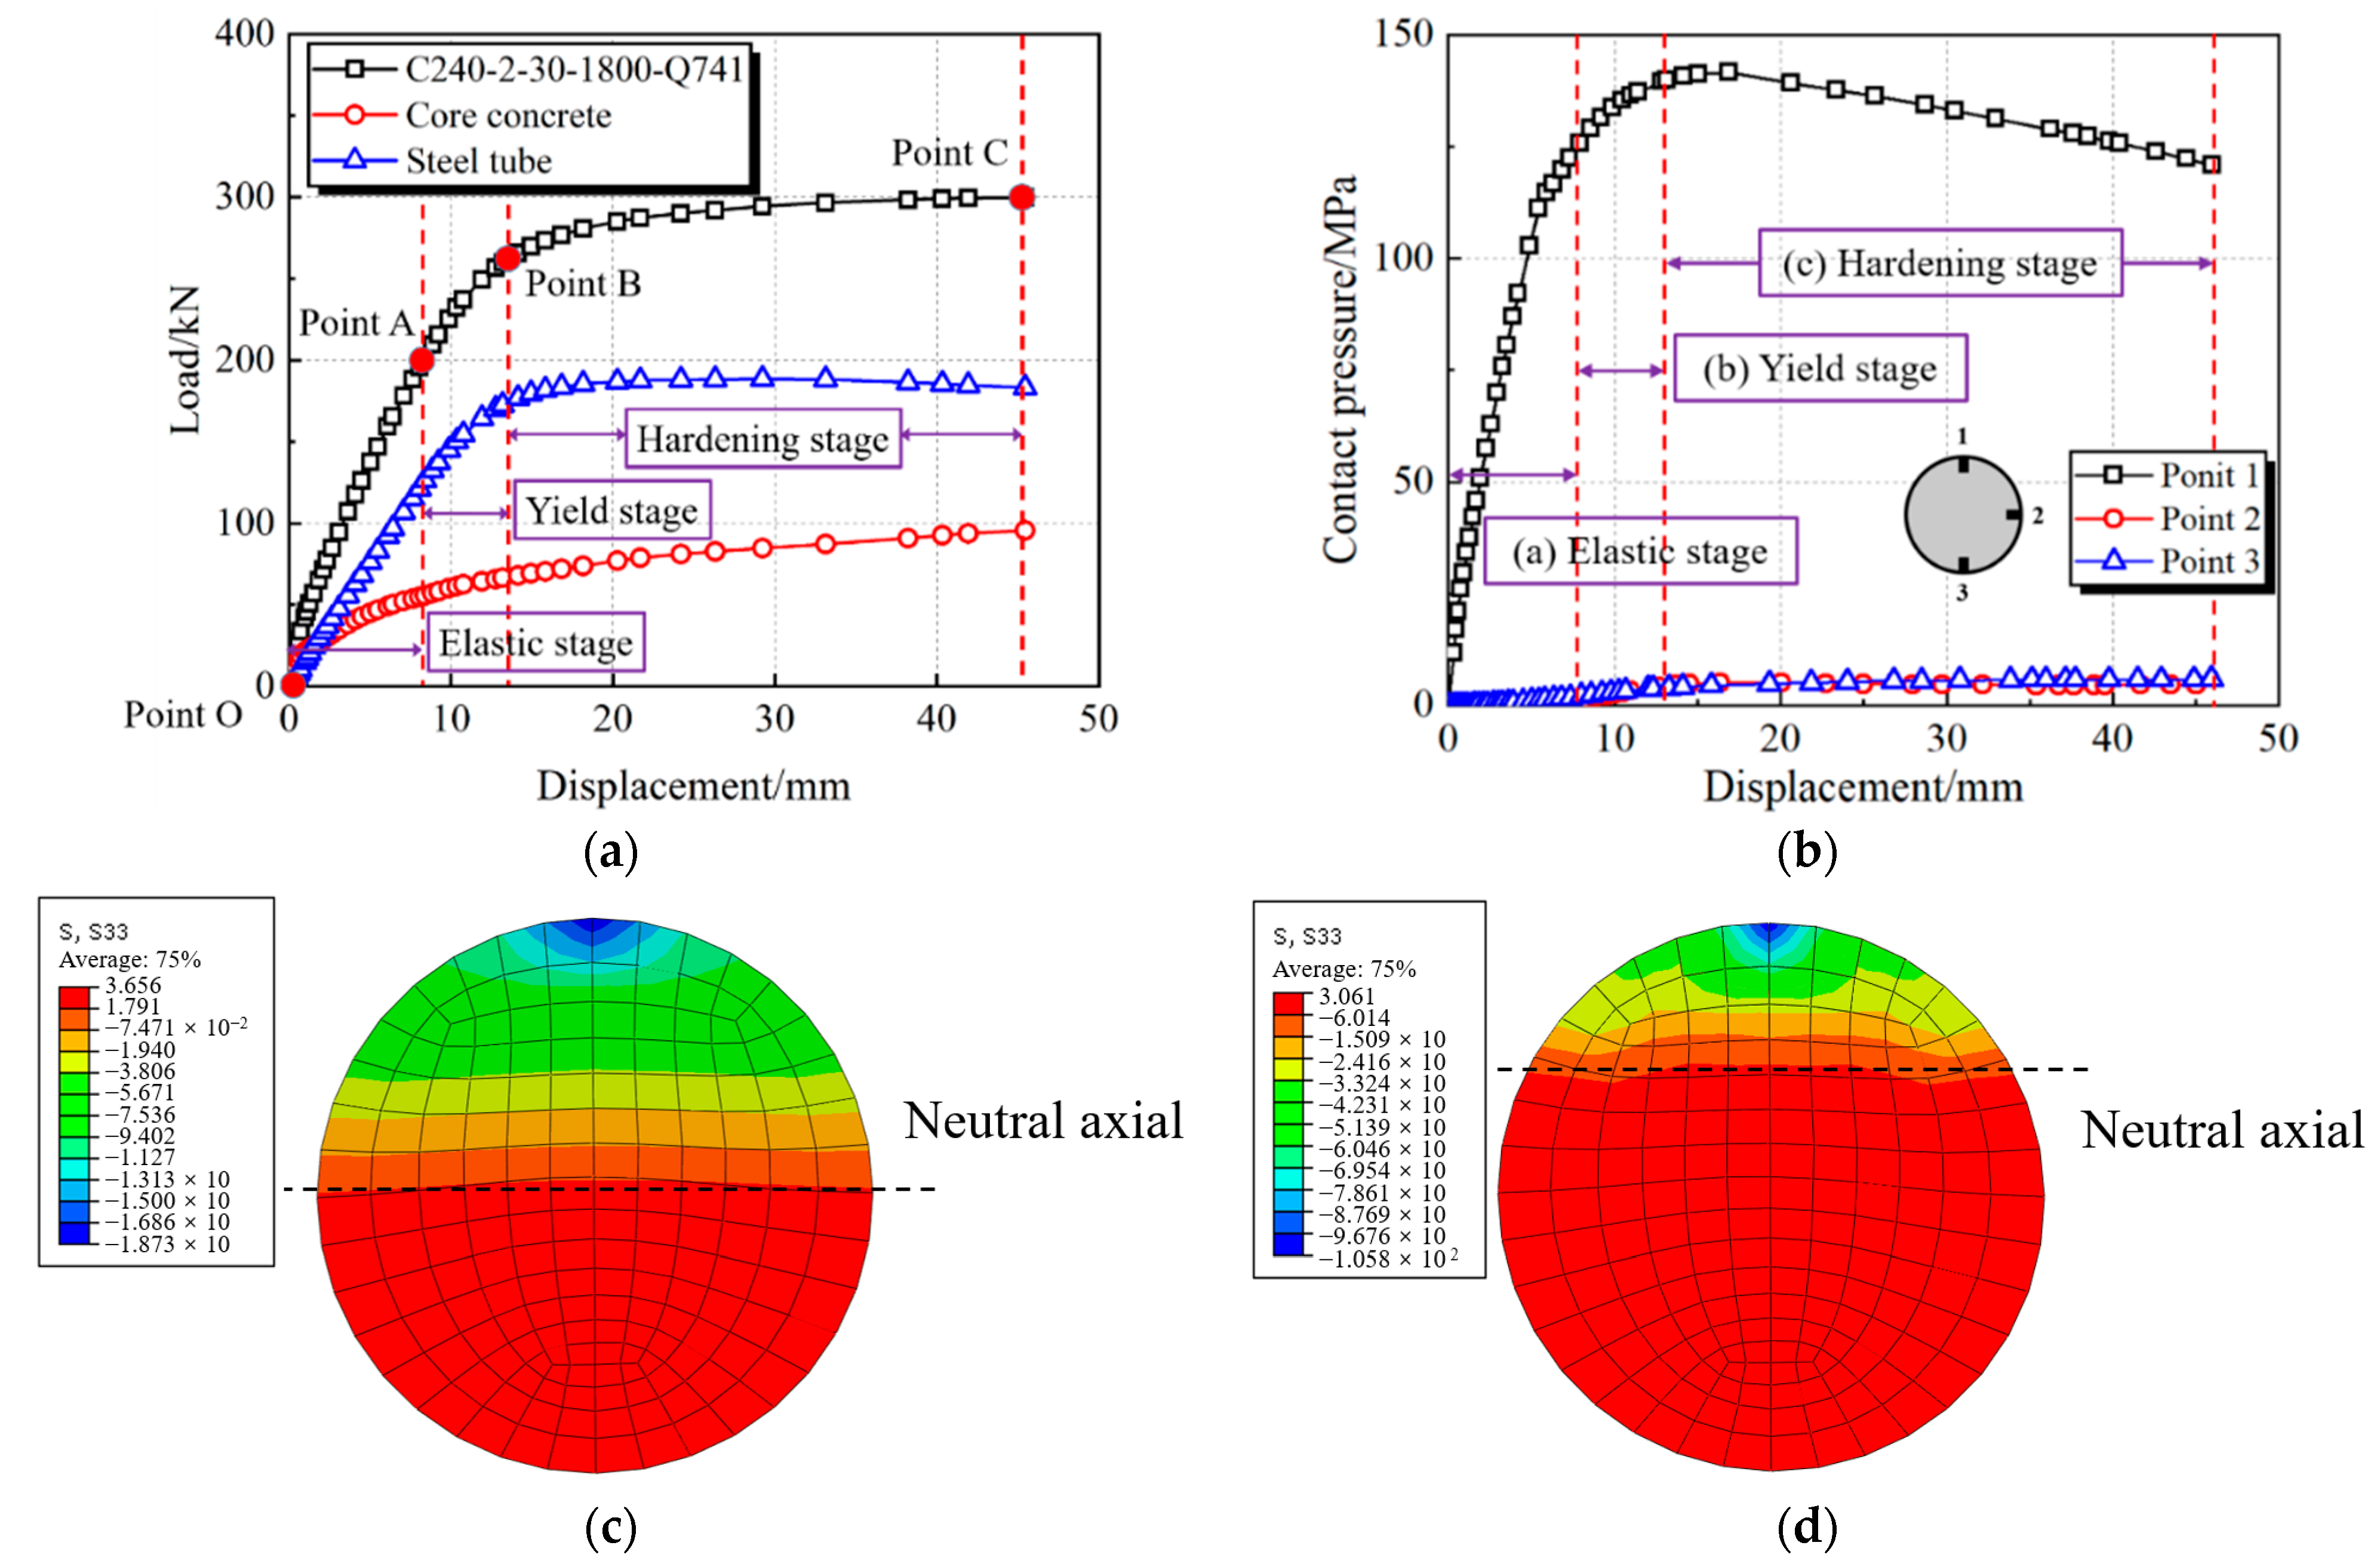
- Stage 1: Elastic stage (Points O–A). In this stage, the CFHST member retains elastic behavior. The load–displacement curve shows a linear growth relationship, and the HS steel tube and core concrete withstand, respectively, 69% and 31% of the specimen flexural capacity at Point A (Figure 12a). In Figure 12b, the contact pressure between the steel tube and core concrete retains a small pressure at Points 2 and 3, since the Poisson ratio of the core concrete is smaller than that of the steel tube, and it can be considered that they work independently. Meanwhile, in Figure 12c, the height of the neutral axis is nearly located at the center line of the cross-section.
- (2)
- Stage 2: Yield stage (Points A–B). The load–displacement curve enters the yield stage, and the loading-carrying proportions of the HS steel tube and core concrete are, respectively, 72% and 28% at Point B. The local buckling of the steel tube in the compressive zone causes the contact pressure to increase slowly at Point 1, and the contact pressures at Points 2 and 3 gradually increase due to the significant expansion deformation of the confined concrete. At the same time, an obvious stress-redistribution phenomenon exists in the compression zone, and the neutral axis increasingly moves upward, owing to the concrete failure in tensile zone, as shown in Figure 12d. During this stage, the steel tube exceeds its corresponding yield strength fy, and the stress of the core concrete is higher than its cylinder strength fc due to the confinement effect provided by steel tube.
- (3)
- Stage 3: Hardening stage (Points B–C). The plastic deformation occupies a major part, and the contribution of the steel tube to the flexural capacity generally retains a higher percentage, for which the vertical bearing capacity proportions of the HS steel tube and core concrete are, respectively, 66% and 34% at Point C. A large value of 5.89 MPa can be reached for contact pressure at Point 3 compared to the lower value at Point 2, reflecting a compact interaction between the steel tube and concrete. Although the core concrete suffers from severe damage during this period, the damaged concrete can still effectively resist the ovalization and buckling of the steel tube.
4.4. Load-Transfer Mechanism in CFHST Beams
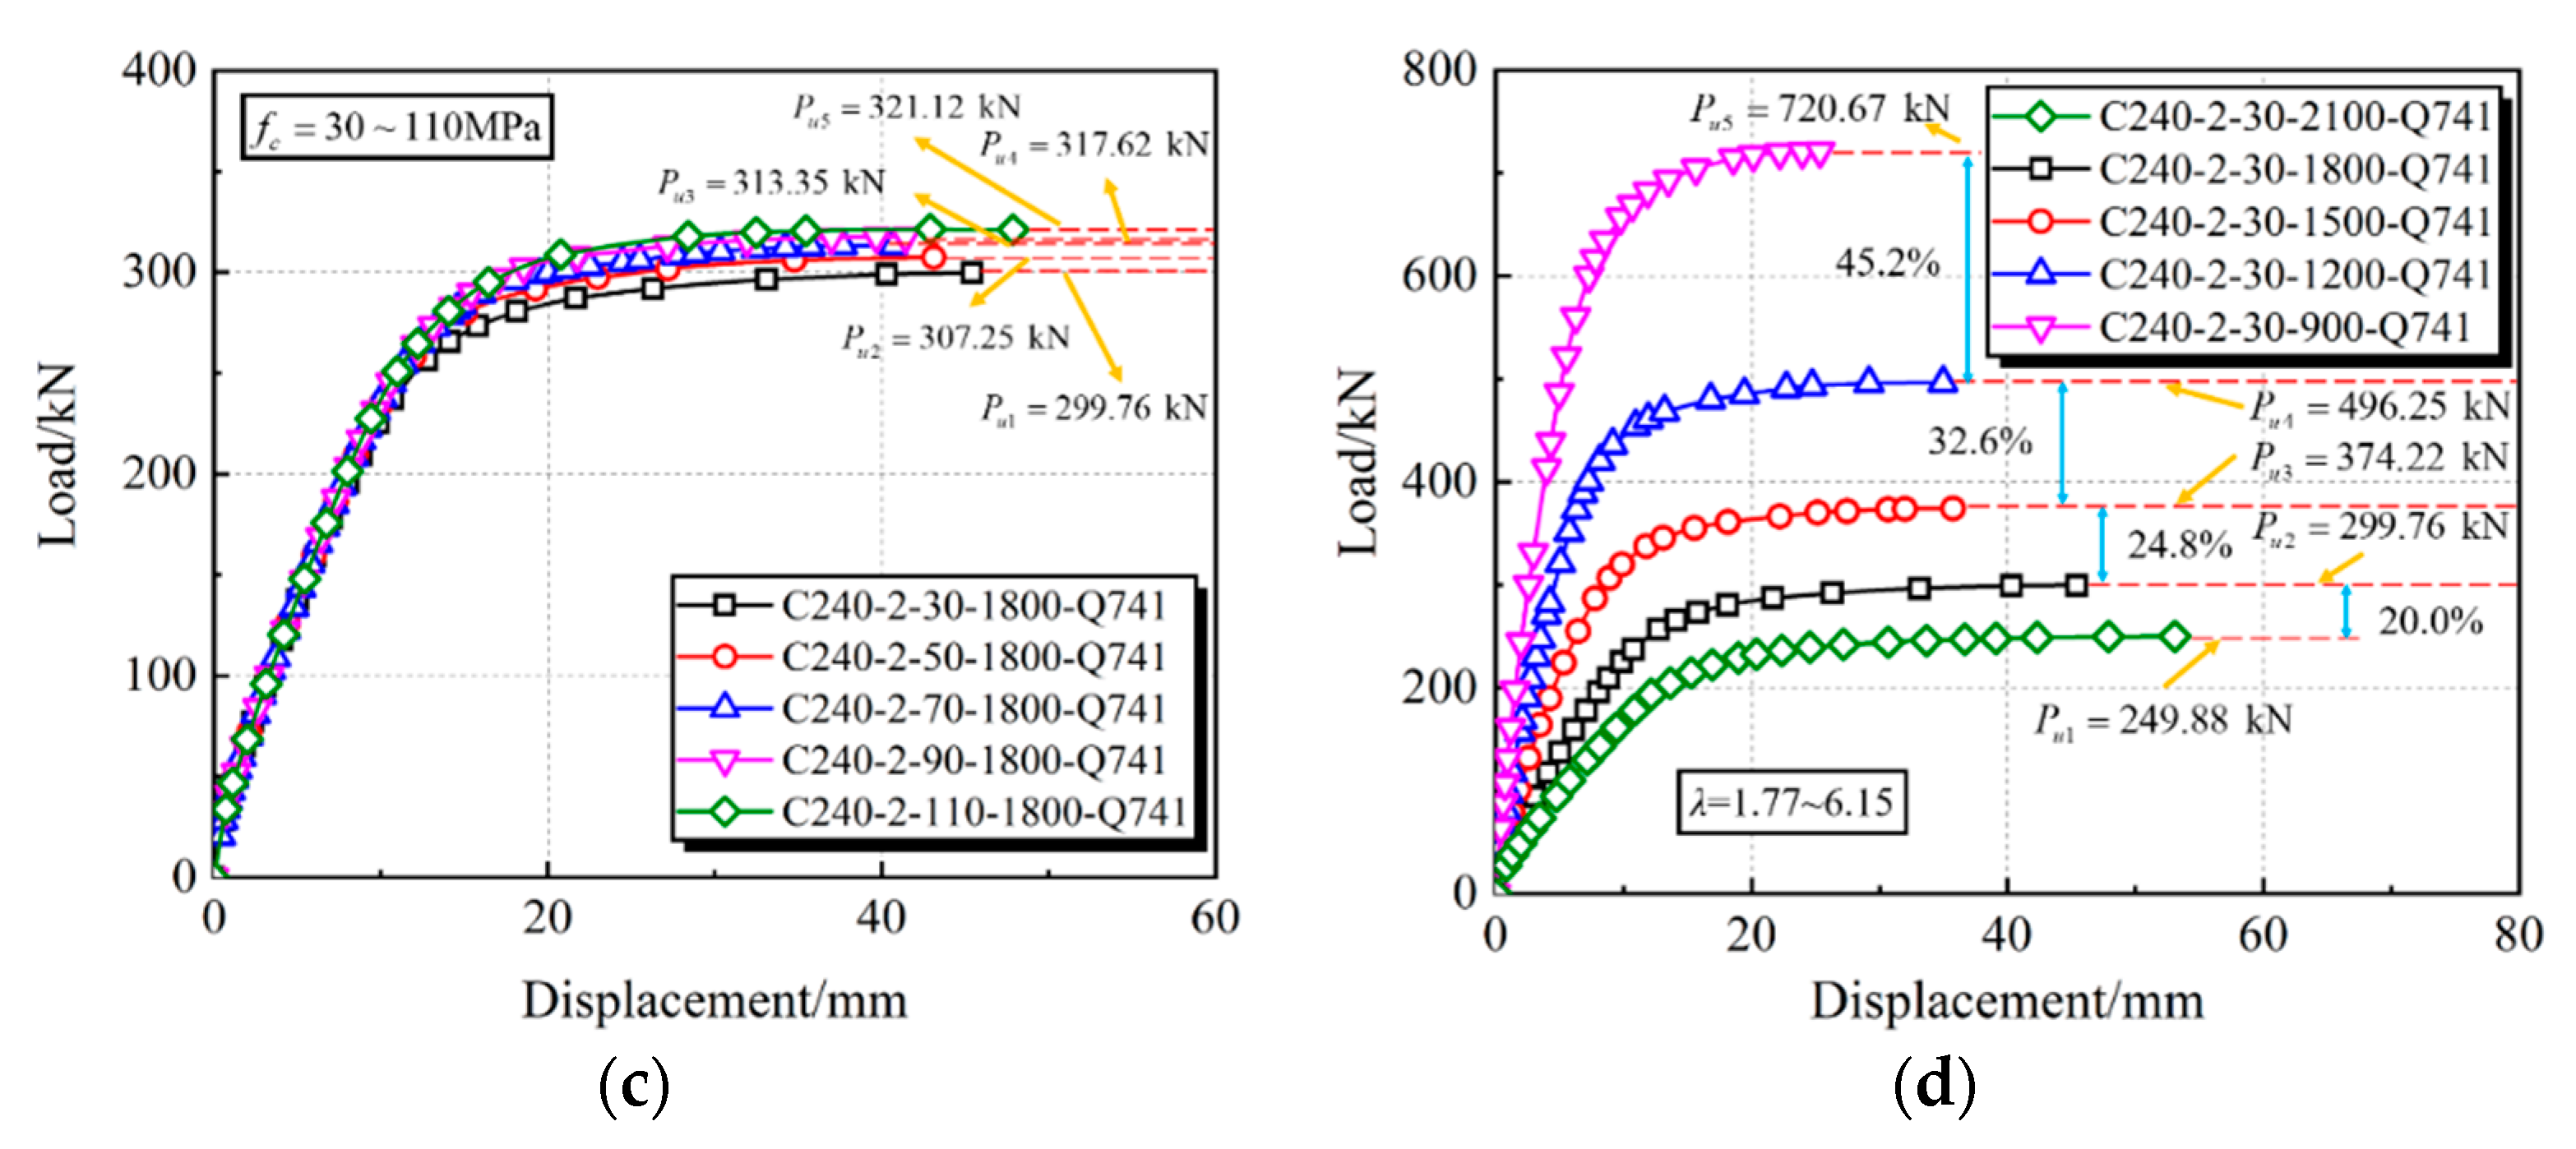
4.5. Parametric Study
5. Calculation Method on Flexural Bearing Capacity
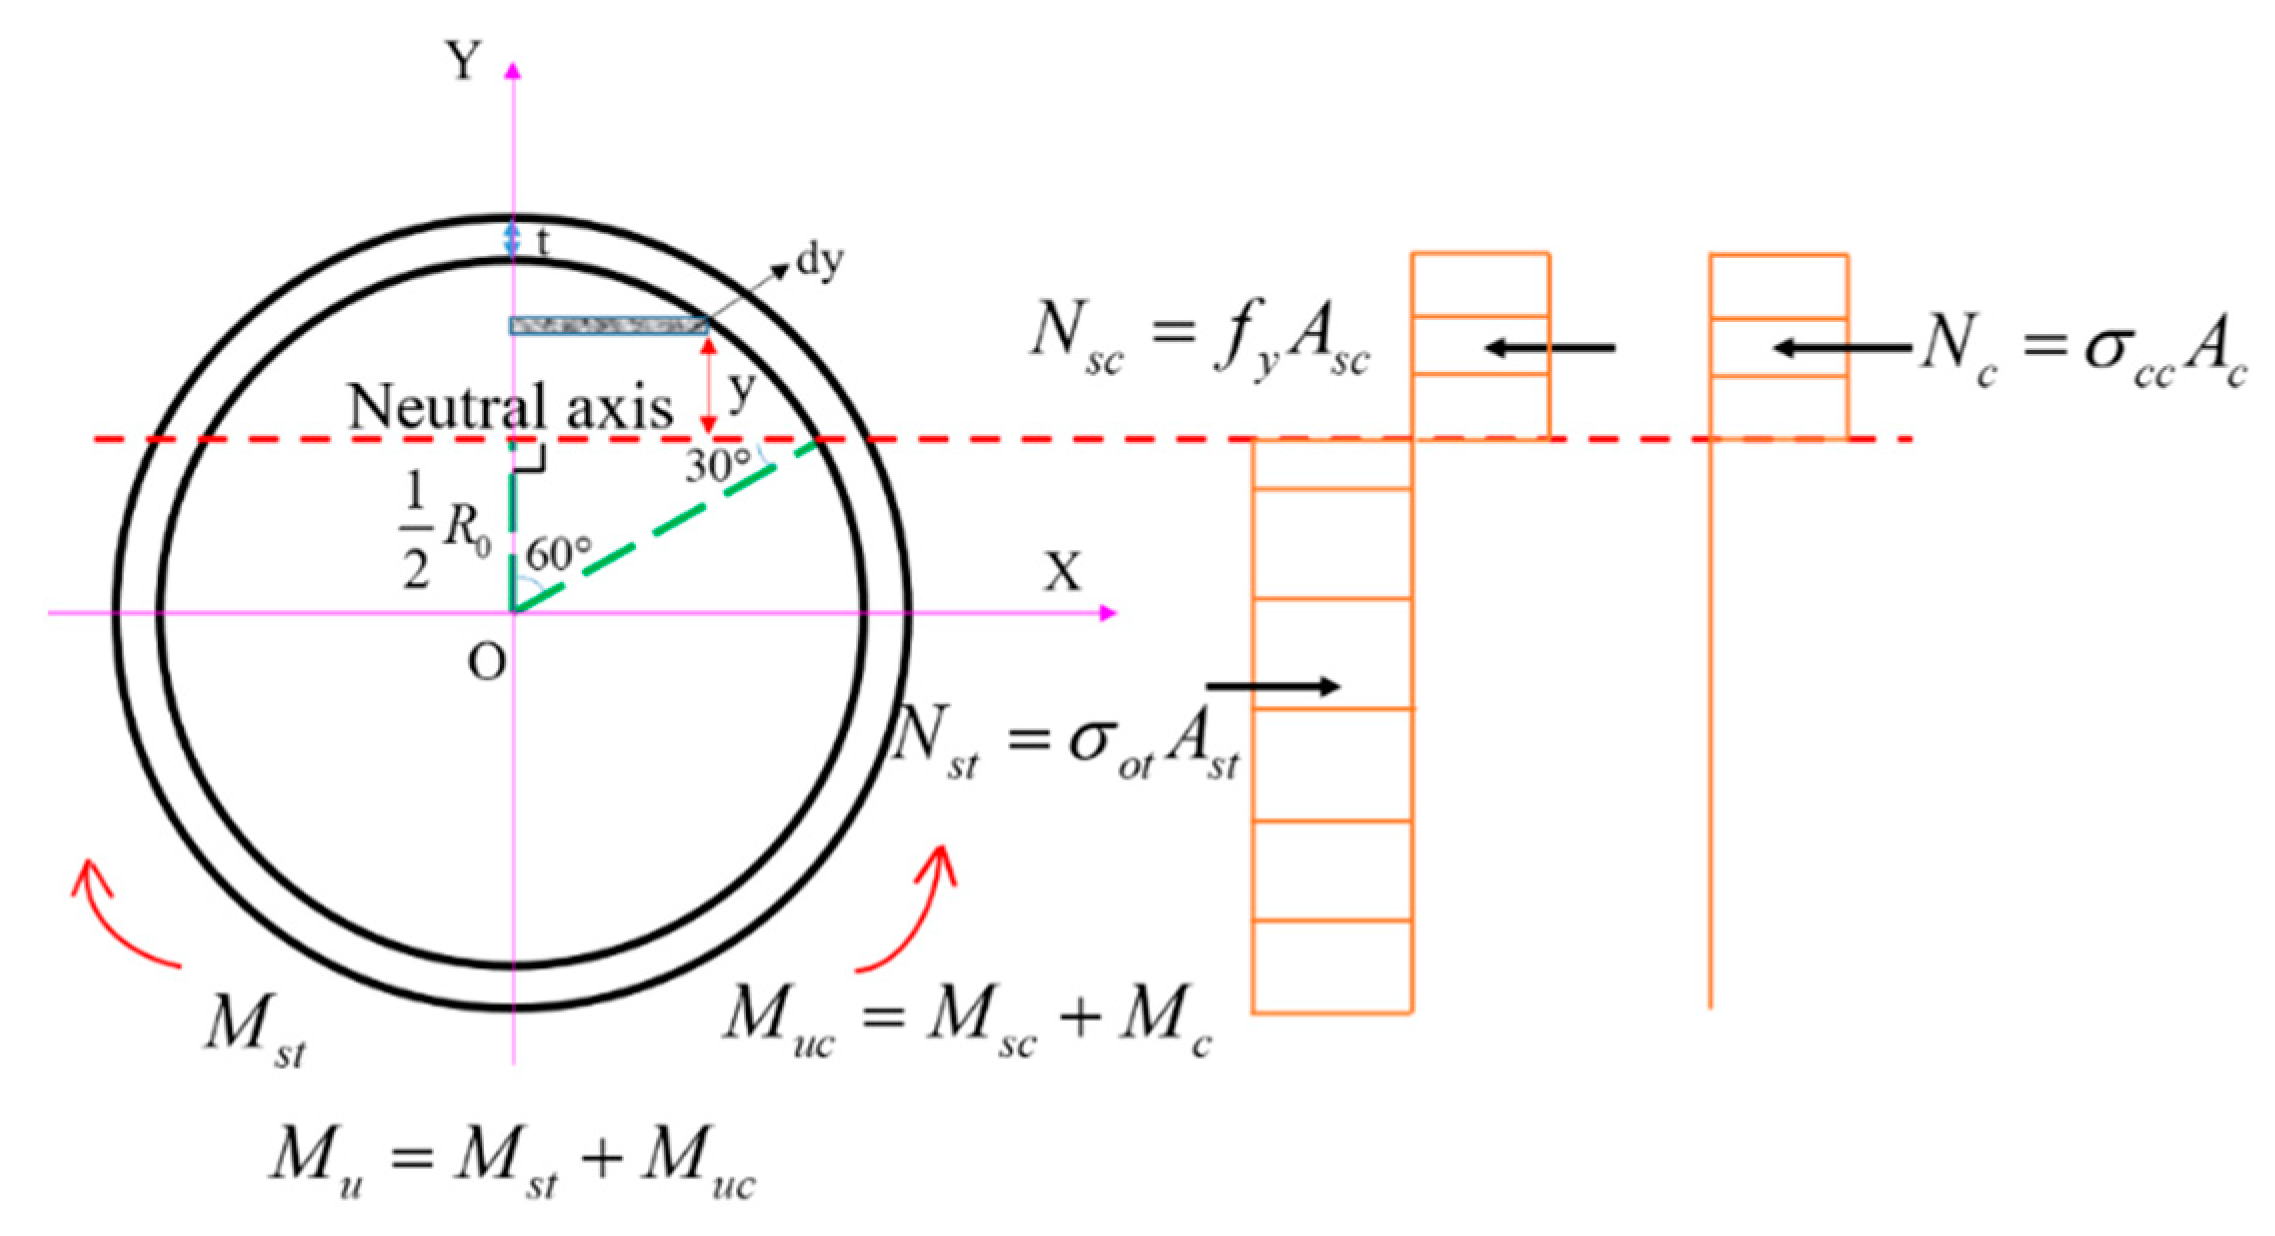
5.1. Establishment of Calculation Method
- (1)
- The cross-section remains plane after deformation;
- (2)
- The concrete in the tension zone is neglected for calculating the flexural capacity;
- (3)
- The steel tube in the compression zone enters the yielding stage.
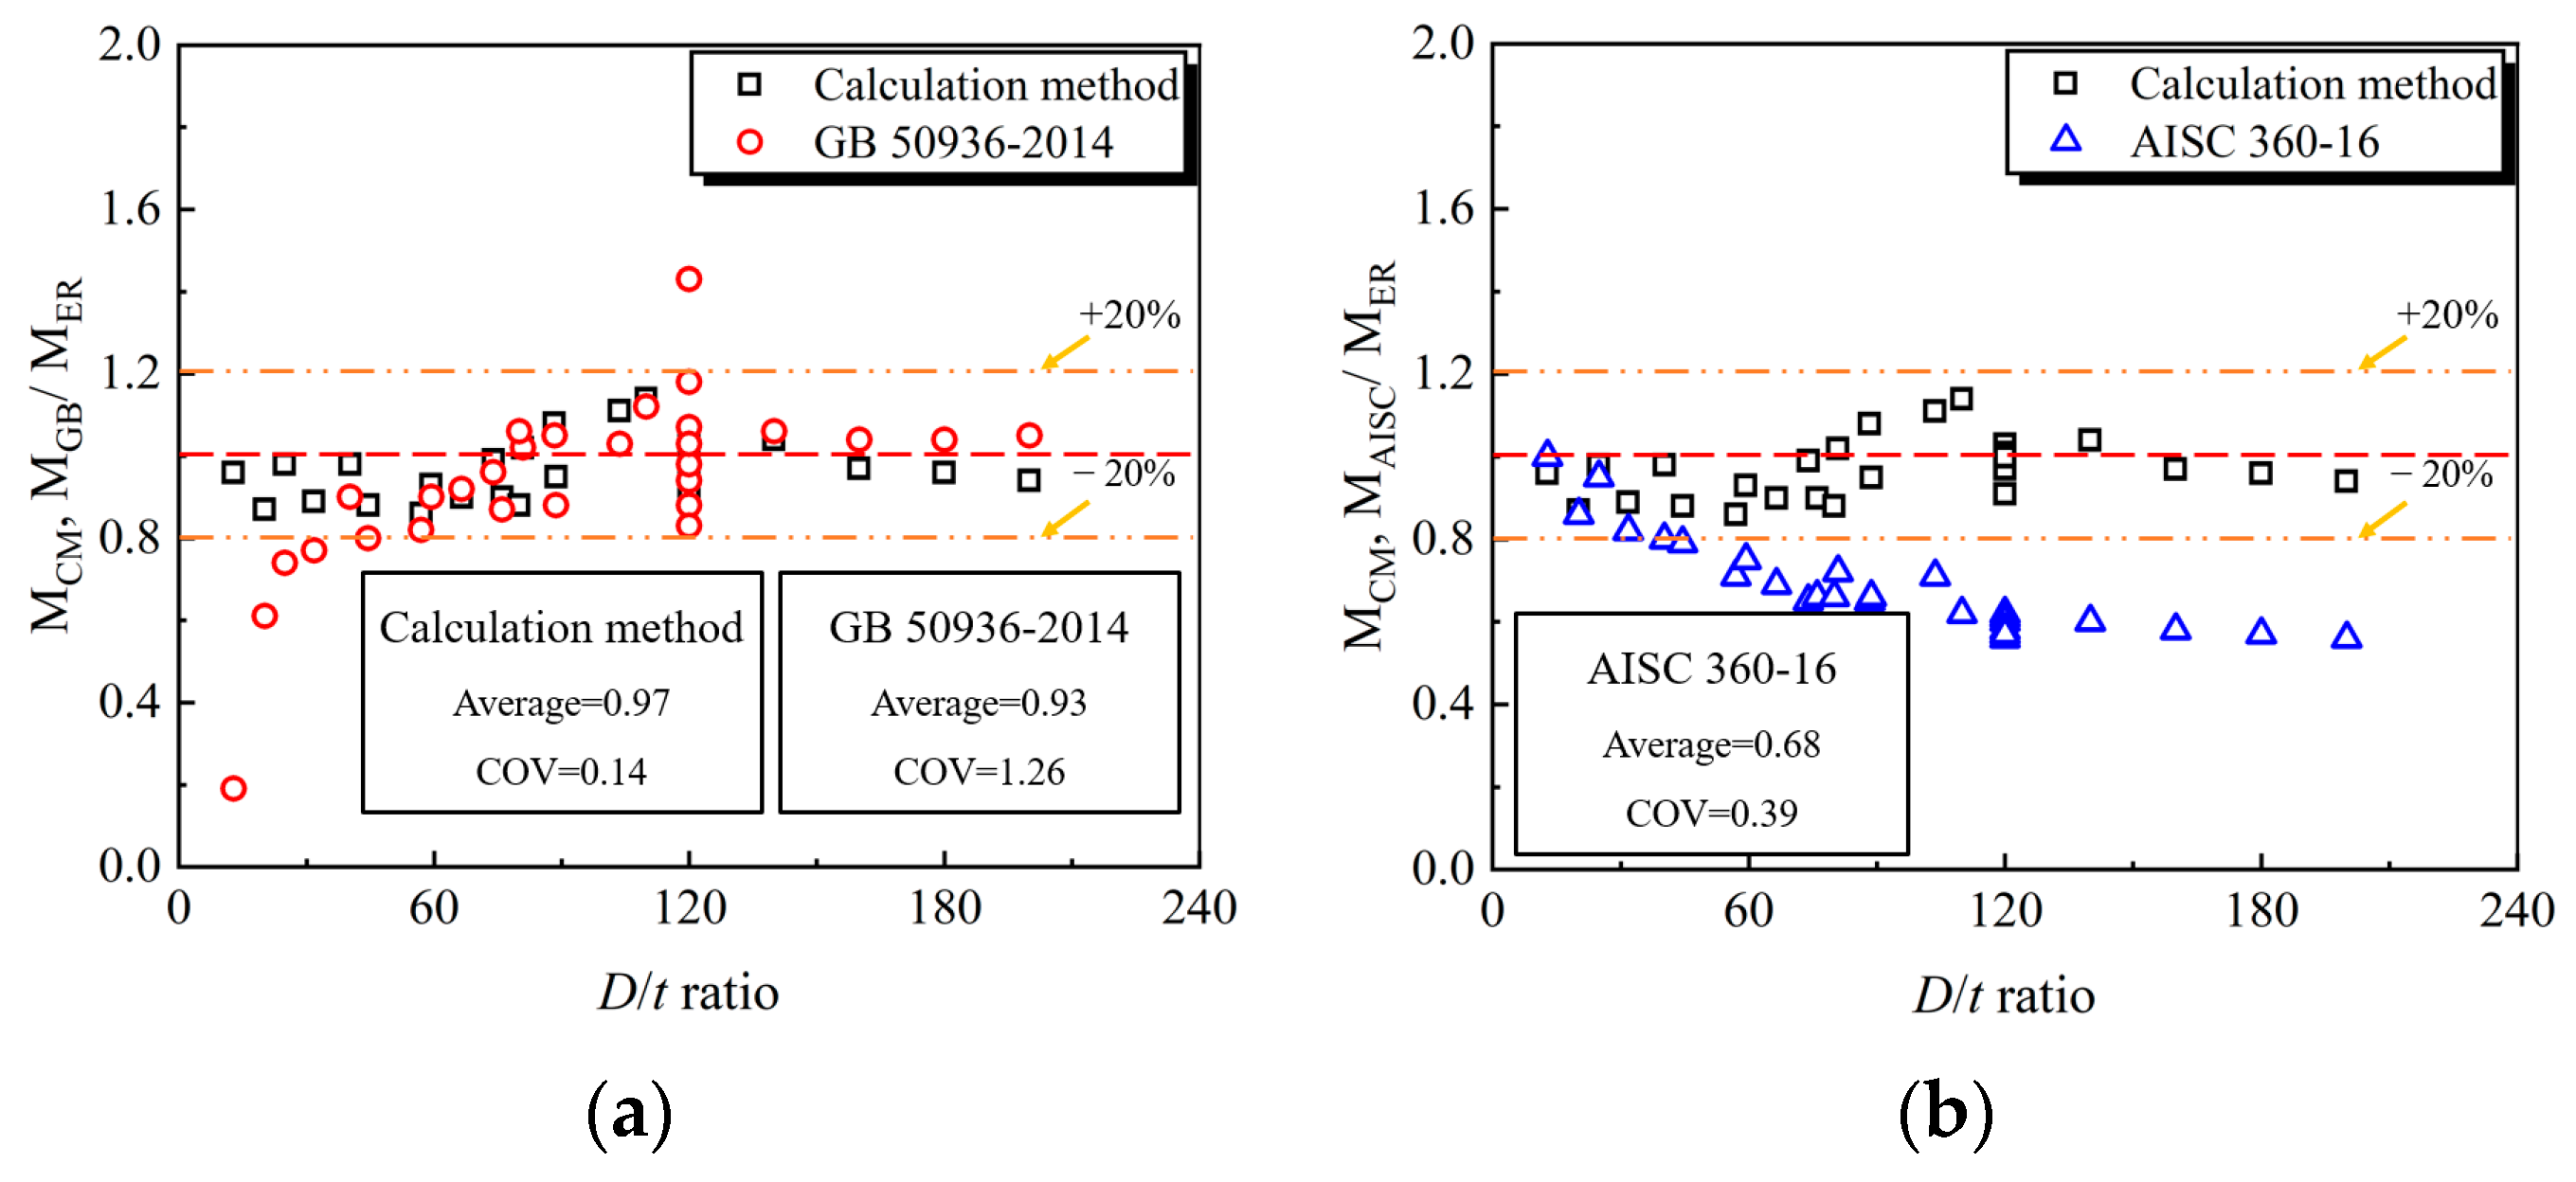
5.2. Verification of Accuracy of Calculation Method
6. Conclusions
- The tested CFHST members fail in a mode of steel fracture and concrete cracks in the tension zone, as well as local buckling in the compression zone, to form a plastic hinge with ductile behavior. Due to the higher confinement effect of HS steel, the strain distribution along the section height approximately adopts a linear trend, revealing that the plane cross-section assumption is still justified for CFHST members with out-of-code D/t ratios.
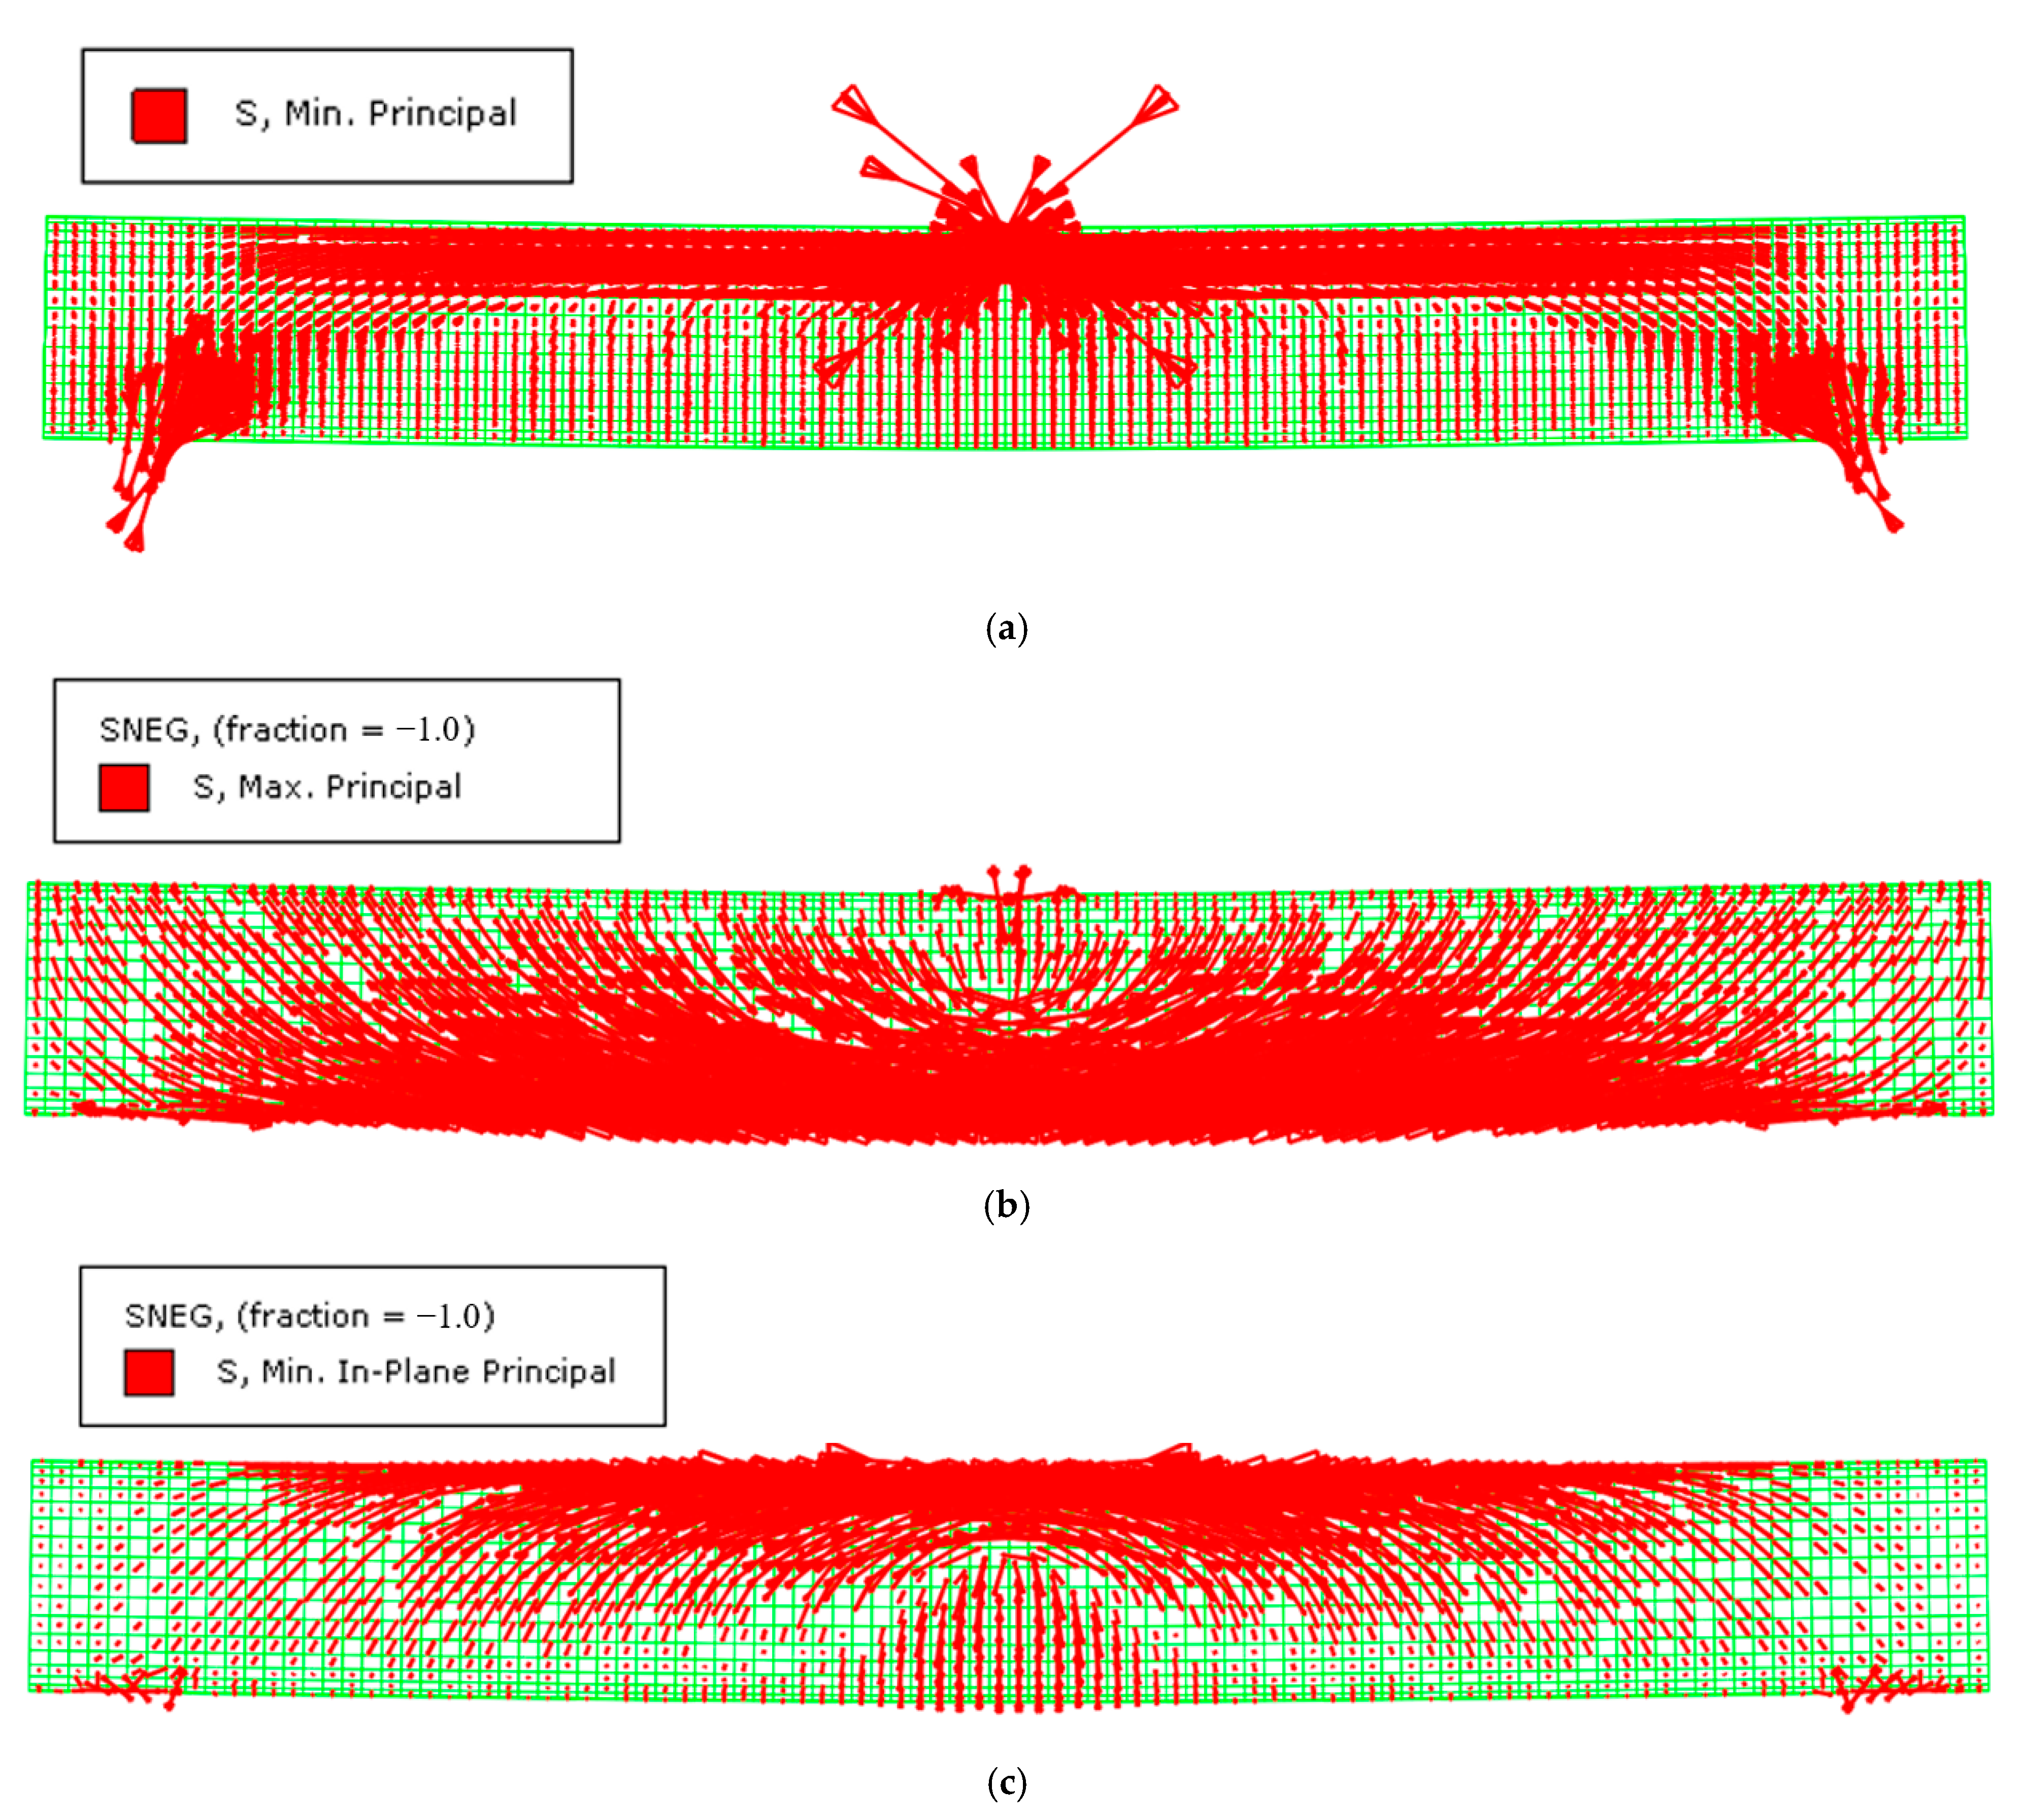
- The FE model was developed and verified for the analysis of full-range composite behavior; meanwhile, the load–displacement curves can be divided into three various working stages. The HS thin-walled steel tube experiences an arch mechanism similar to the core concrete, where the maximum tensile stress approximately transmits in an angle of 45° and vice versa.
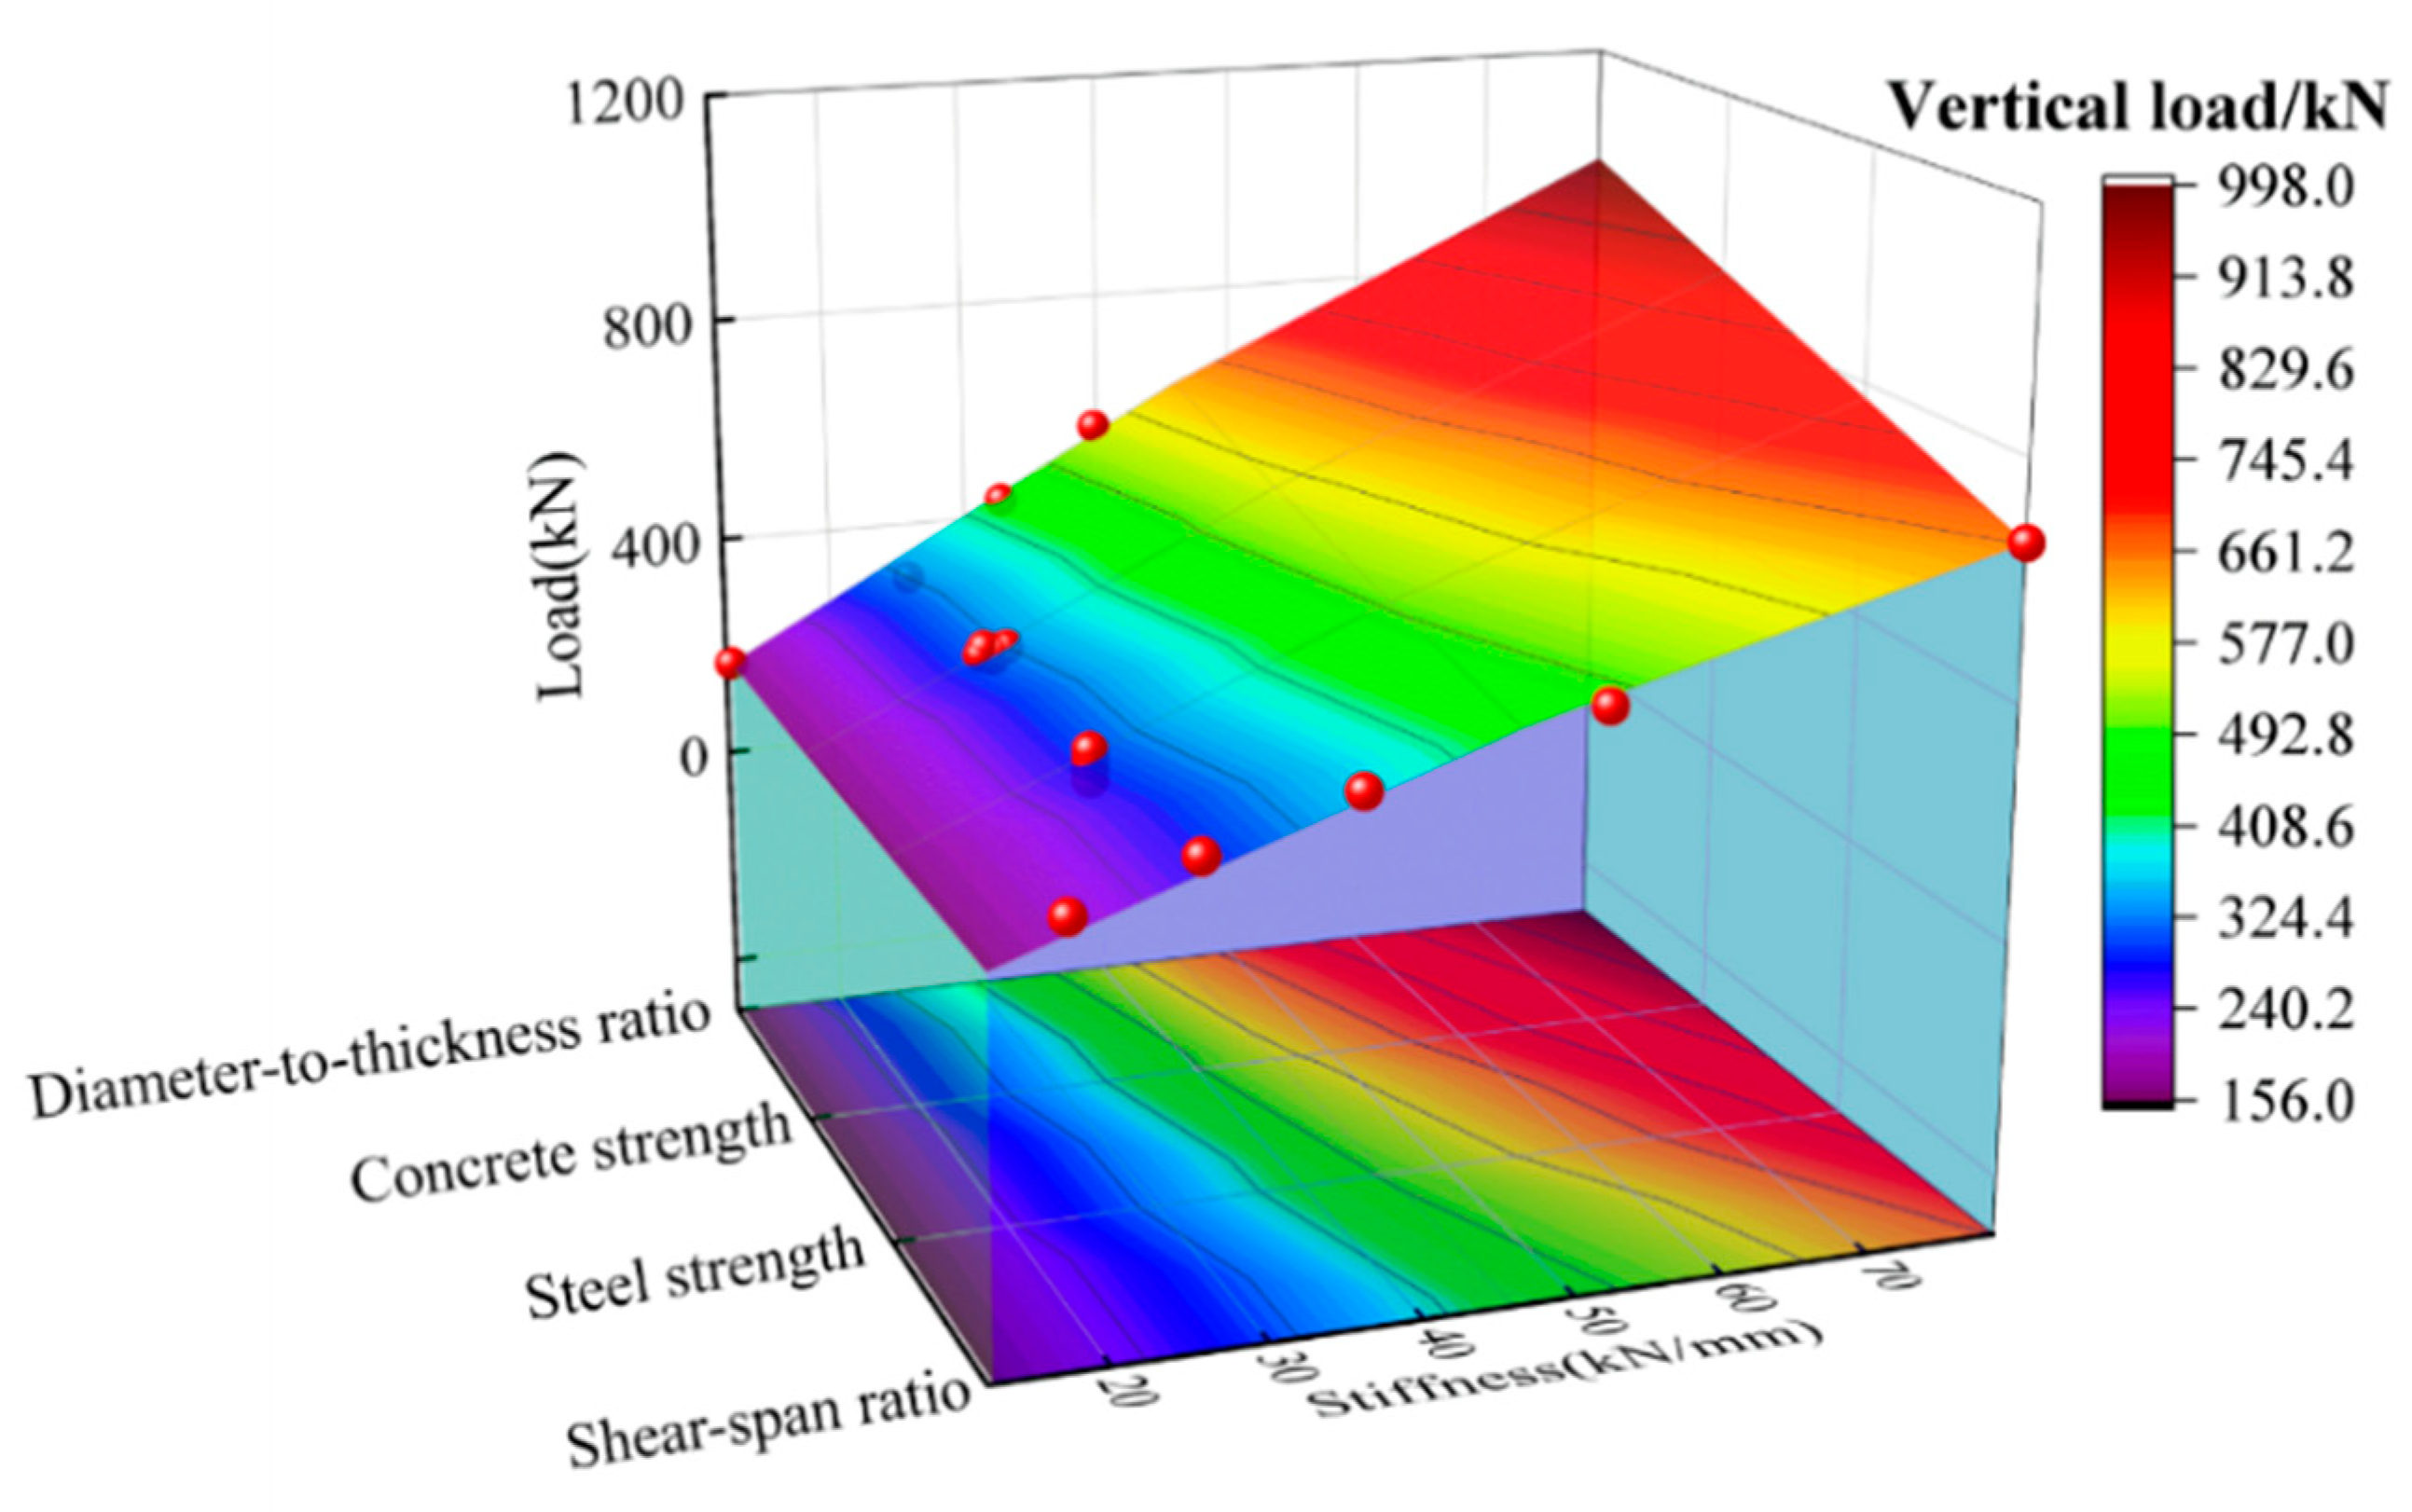
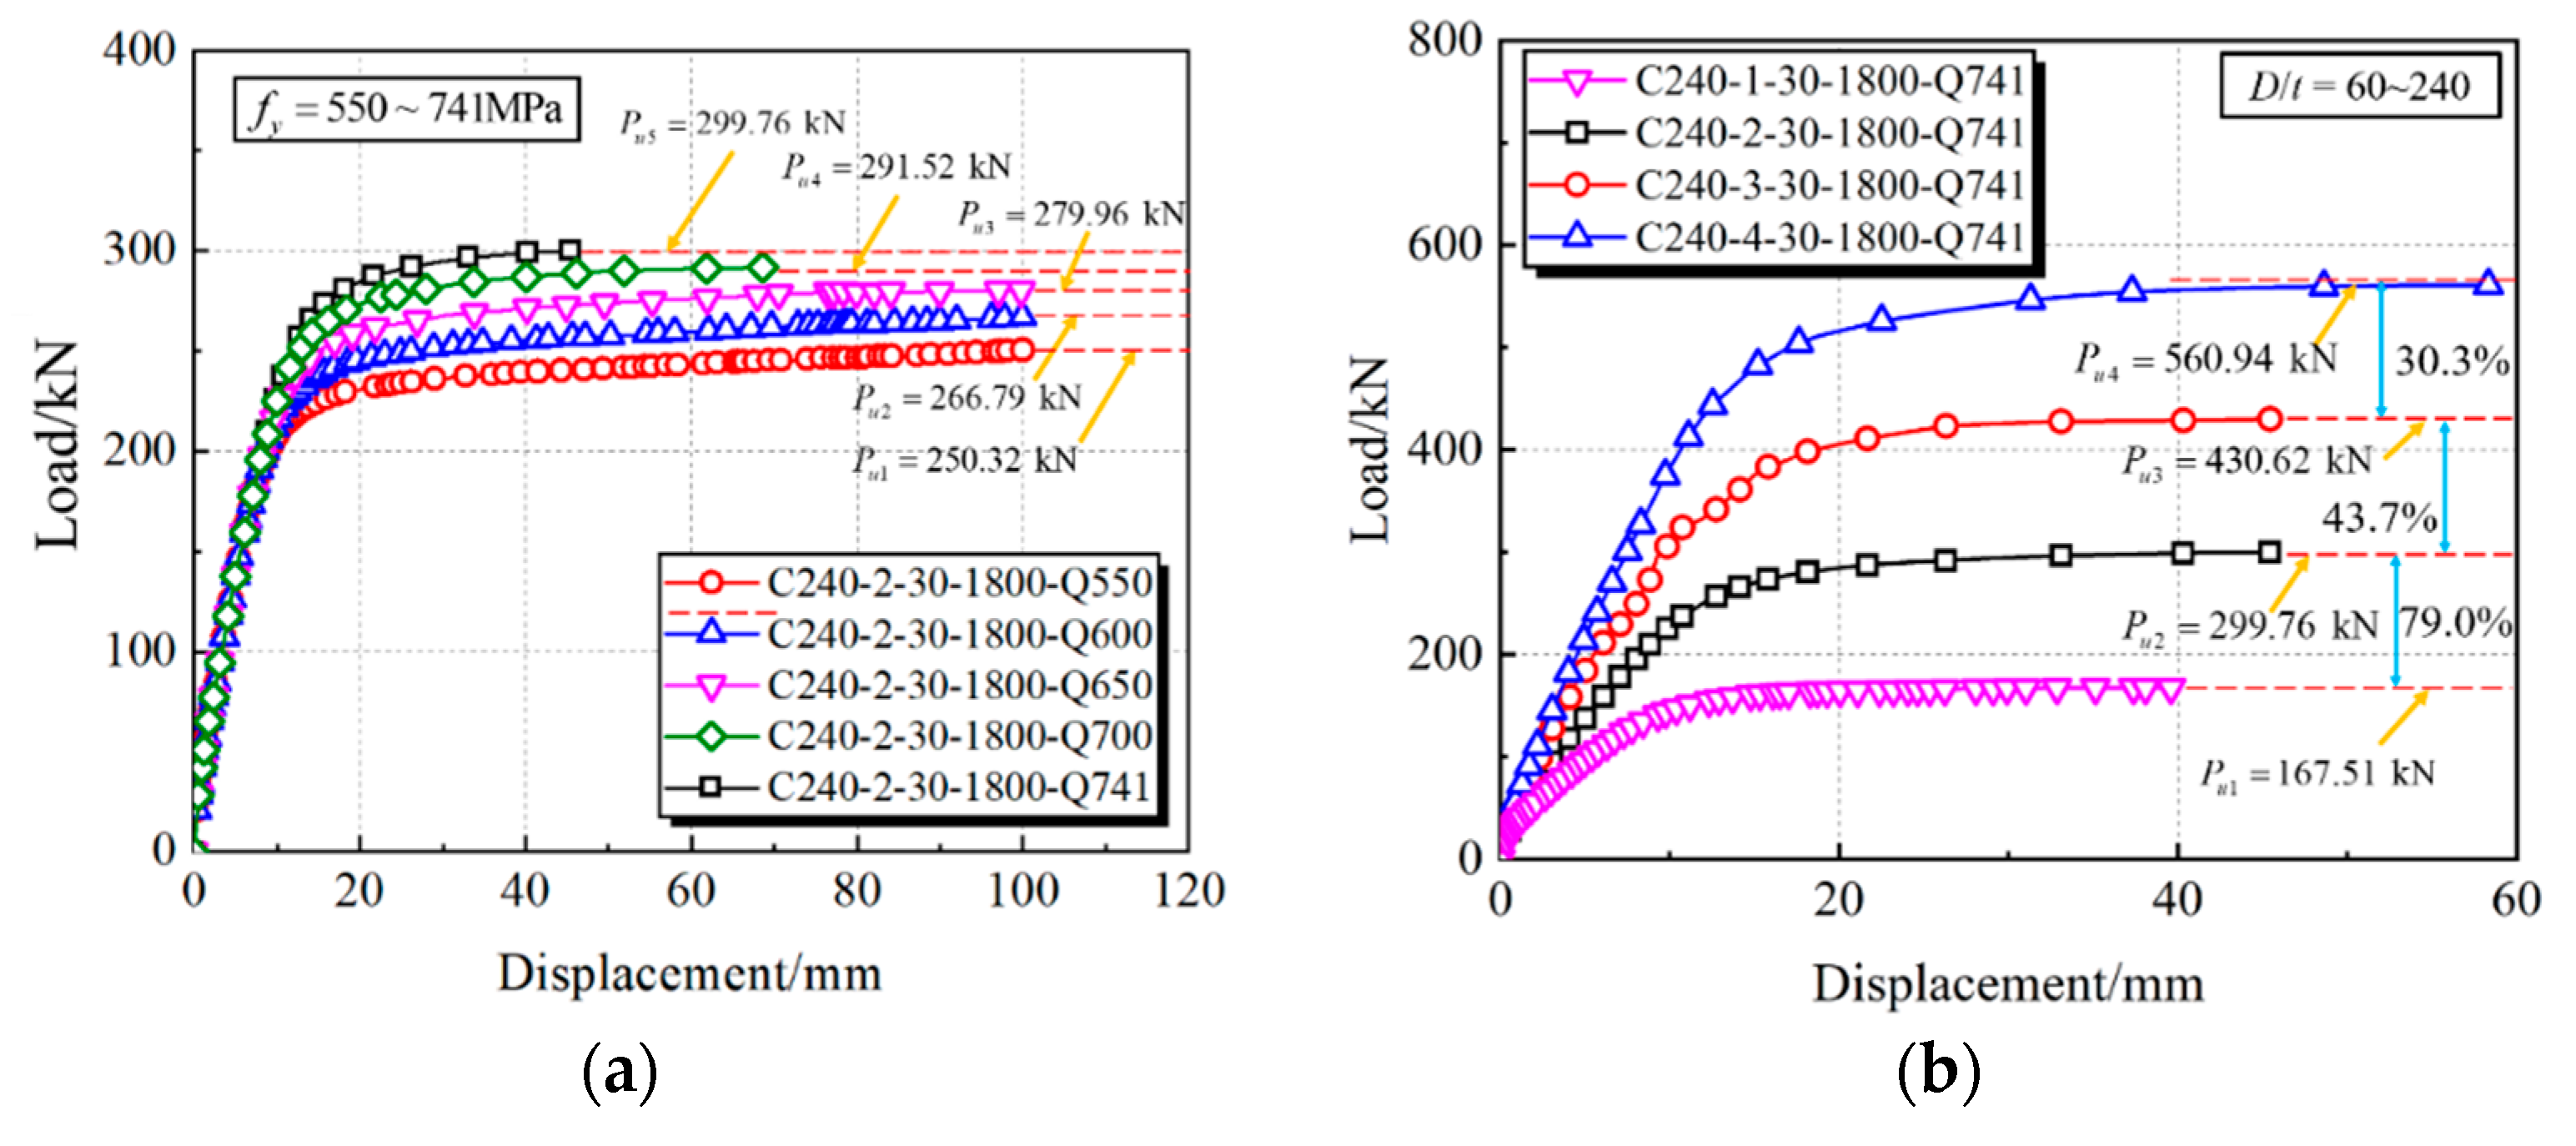
- A detailed parametric study was conducted to examine the influences of key parameters (e.g., the material strength, D/t ratio and shear-span ratio) on the full-range load–displacement curves and interaction behavior, in which the CFHST members with out-of-code D/t ratios (e.g., D/t = 120 and 240) can perform with reasonable composite behavior due to an acceptable contact pressure larger than 2.5 MPa.
- A simplified theoretical model for calculating flexural capacity was derived and established by achieving a MV of 0.97 and a COV of 0.14 compared to the prediction results of existing design codes. Meanwhile, the method specified in AISC 360-16 performs a more conservative prediction trend compared to the counterparts in the codes of GB 50936-2014 and Eurocode 4. Therefore, the simplified method in this paper can be accepted as a primary tool to conduct structural design and performance evaluation.
Author Contributions
Funding
Institutional Review Board Statement
Informed Consent Statement
Data Availability Statement
Conflicts of Interest
References
- Tian, H.; Zhou, Z.; Wei, Y.; Zhang, L. Experimental and numerical investigation on the seismic performance of concrete-filled UHPC tubular columns. J. Build. Eng. 2021, 43, 103118. [Google Scholar] [CrossRef]
- Liu, D.J.; Zuo, J.P.; Wang, J.; Zhang, T.L.; Liu, H.Y. Large deformation mechanism and concrete-filled steel tubular support control technology of soft rock roadway—A case study. Eng. Fail. Anal. 2020, 116, 104721. [Google Scholar] [CrossRef]
- Zhou, S.; Sun, Q.; Wu, X. Impact of D/t ratio on circular concrete-filled high-strength steel tubular stub columns under axial compression. ThinWalled Struct. 2018, 132, 461–474. [Google Scholar] [CrossRef]
- Wang, J.; Sun, Q.; Li, J. Experimental study on seismic behavior of high-strength circular concrete-filled thin-walled steel tubular columns. Eng. Struct. 2019, 182, 403–415. [Google Scholar] [CrossRef]
- Wang, J.; Li, H.-N.; Fu, X.; Li, Q. Geometric imperfections and ultimate capacity analysis of a steel lattice transmission tower. J. Constr. Steel Res. 2021, 183, 106734. [Google Scholar] [CrossRef]
- Ma, L.; Khazaali, M.; Bocchini, P. Component-based fragility analysis of transmission towers subjected to hurricane wind load. Eng. Struct. 2021, 242, 112586. [Google Scholar] [CrossRef]
- Gunawardena, Y.K.R.; Aslani, F.; Brian, U.; Kang, W.H.; Hicks, S. Review of strength behaviour of circular concrete filled steel tubes under monotonic pure bending. J. Constr. Steel Res. 2019, 158, 460–474. [Google Scholar] [CrossRef]
- Oyawa, W.O.; Sugiura, K.; Watanabe, E. Flexural response of polymer concrete filled steel beams. Constr. Build. Mater. 2004, 18, 367–376. [Google Scholar] [CrossRef]
- Chang, X.; Lin, H.X.; Huang, C.K. Experimental study on shear resistance of stressing concrete filled circular steel tubes. J. Constr. Steel Res. 2009, 65, 801–807. [Google Scholar]
- Chen, J.; Chan, T. Experimental assessment of the flexural behaviour of concrete-filled steel tubular beams with octagonal sections. Eng. Struct. 2019, 199, 109604. [Google Scholar] [CrossRef]
- Al-Shaar, A.A.M.; Gogus, M.T. Flexural behavior of lightweight concrete and self-compacting concrete-filled steel tube beams. J. Constr. Steel Res. 2018, 149, 153–164. [Google Scholar] [CrossRef]
- Lu, Y.; Liu, Z.; Li, S.; Li, W. Behavior of steel fibers reinforced self-stressing and self-compacting concrete-filled steel tube subjected to bending. Constr. Build. Mater. 2017, 156, 639–651. [Google Scholar] [CrossRef]
- Han, L.H.; Lu, H.; Yao, G.; Liao, F. Further study on the flexural behaviour of concrete-filled steel tubes. J. Constr. Steel Res. 2006, 62, 554–565. [Google Scholar] [CrossRef]
- Han, L.H. Flexural behaviour of concrete-filled steel tubes. J. Constr. Steel Res. 2004, 60, 313–337. [Google Scholar] [CrossRef]
- Wang, J.; Cheng, X.; Yan, L.; Wu, C. Numerical study on I-section steel-reinforced concrete-filled steel tubes (SRCFST) under bending. Eng. Struct. 2020, 225, 111276. [Google Scholar] [CrossRef]
- Zand, A.W.A.; Badaruzzaman, W.H.W.; Tawfeeq, W.M. New empirical methods for predicting flexural capacity and stiffness of CFST beam. J. Constr. Steel Res. 2020, 164, 105778. [Google Scholar] [CrossRef]
- Wang, W.D.; Xian, W.; Hou, C.; Shi, Y.L. Experimental investigation and FE modelling of the flexural performance of square and rectangular SRCFST members. Structures 2020, 27, 2411–2425. [Google Scholar] [CrossRef]
- Shi, Y.L.; Xian, W.; Wang, W.D.; Li, H.W. Mechanical behaviour of circular steel-reinforced concrete-filled steel tubular members under pure bending loads. Structures 2020, 25, 8–23. [Google Scholar] [CrossRef]
- Zhang, T.; Gong, Y.Z.; Ding, F.X.; Liu, X.M.; Yu, Z.V. Experimental and numerical investigation on the flexural behavior of concrete-filled elliptical steel tube (CFET). J. Build. Eng. 2021, 41, 102412. [Google Scholar] [CrossRef]
- Moon, J.; Roeder, C.W.; Lehman, D.E.; Lee, H.E. Analytical modeling of bending of circular concrete-filled steel tubes. Eng. Struct. 2012, 42, 349–361. [Google Scholar] [CrossRef]
- Chung, K.S.; Kim, J.H.; Yoo, J.H. Experimental and analytical investigation of high-strength concrete-filled steel tube square columns subjected to flexural loading. Steel Compos. Struct. 2013, 14, 133–153. [Google Scholar] [CrossRef]
- Xiong, M.X.; Xiong, D.X.; Liew, J.Y.R. Flexural performance of concrete filled tubes with high tensile steel and ultra-high strength concrete. J. Constr. Steel Res. 2017, 132, 191–202. [Google Scholar] [CrossRef]
- Hanifehzadeh, M.; Aryan, H.; Gencturk, B.; Akyniyazov, D. Structural response of steel jacket-UHPC retrofitted reinforced concrete columns under blast loading. Materials 2021, 14, 1521. [Google Scholar] [CrossRef] [PubMed]
- Zhou, J.; Fang, X.; Jiang, Y. Cyclic behavior of concrete-encased high-strength concrete-filled steel tube composite walls: An experiment. Struct. Concr. 2021, 22, 691–708. [Google Scholar] [CrossRef]
- GB 50936-2014; Technical Code for Concrete Filled Steel Tubular Structures. China Building Industry Press: Beijing, China, 2014. (In Chinese)
- Eurocode 4; Design of Composite Steel and Concrete Structures-Part 1-1: General Rules and Rules for Buildings. European Committee for Standardization: Brussels, Belgium, 2004.
- ACI 318-05; Building Code Requirements for Structural Concrete and Commentary. American Concrete Institute: Farmington Hills, MI, USA, 2005.
- AISC 360-16; Specification for Structural Steel Buildings. American Institute of Steel Construction: Chicago, IL, USA, 2016.
- GB/T 50081-2002; Standard Test Method for Mechanical Properties of Ordinary Concrete. China Standard Press: Beijing, China, 2002. (In Chinese)
- GB/T 4623-2006; Circular Concrete Pole. China Standard Press: Beijing, China, 2006. (In Chinese)
- Cui, Y.; Fang, X. Shear strength tests of concrete filled steel tube columns. China Civ. Eng. J. 2007, 5, 1–9. (In Chinese) [Google Scholar] [CrossRef]
- Yao, G.H.; Han, L.H. Study on practical calculation method of load-deformation relationship curve of concrete-filled steel tube under axial compression and pure bending. China J. Highw. Transp. 2004, 4, 53–57. (In Chinese) [Google Scholar]
- Dawn, L.; Charles, R.; Ashley, H.; Yoo, J.H. Shear response of concrete filled tubes part II: Analytical study. J. Constr. Steel Res. 2019, 153, 169–178. [Google Scholar] [CrossRef]
- Han, L. Concrete Filled Steel Tubular Structures-Theory and Practice, 3rd ed.; Science Press: Beijing, China, 2016. (In Chinese) [Google Scholar]
- GB 50010-2010; Code for Design of Concrete Structures. China Building Industry Press: Beijing, China, 2010. (In Chinese)
- Lu, H.; Han, L.; Zhao, X. Analytical behavior of circular concrete-filled thin-walled steel tubes subjected to bending. Thin Walled Struct. 2009, 47, 346–358. [Google Scholar] [CrossRef]
- Zakir, M.; Sofi, F.A.; Naqash, J.A. Compressive testing and finite element analysis-based confined concrete model for stiffened square FRP-concrete-steel double-skin tubular columns. J. Build. Eng. 2021, 44, 103267. [Google Scholar] [CrossRef]
- Sakino, K.; Hayashi, H. Behavior of Concrete-Filled Steel Tubular Stub Columns under Concentric Loading. In Proceedings of the Third International Conference on Steel-Concrete Composite Structures, Manchester, UK, 30 July–1 August 2007. [Google Scholar]
- Elchalakani, M.; Zhao, X.; Grzebieta, R.H. Concrete-filled circular steel tubes subjected to pure bending. J. Constr. Steel Res. 2001, 57, 1141–1168. [Google Scholar] [CrossRef]
- Chen, Y.; Wang, K.; Feng, R.; He, K.; Wang, L. Flexural behaviour of concrete-filled stainless steel CHS subjected to static loading. J. Constr. Steel Res. 2017, 139, 30–43. [Google Scholar] [CrossRef]


| Group | Specimens | D/mm | t/mm | L/mm | D/t Ratios | Steel Grade | Concrete Grade |
|---|---|---|---|---|---|---|---|
| C240 | C240-1 | 240.8 | 1.98 | 1800 | 121.62 | Q690 | C50 |
| C240-2 | 241.24 | 2.15 | 1800 | 112.2 | |||
| C240-3 | 241.4 | 1.97 | 1800 | 122.54 | |||
| C280 | C280-1 | 281.39 | 2.05 | 1800 | 137.26 | Q690 | C50 |
| C280-2 | 280.83 | 2.06 | 1800 | 136.33 | |||
| C280-3 | 281.74 | 2.1 | 1800 | 134.16 | |||
| C320 | C320-1 | 320.52 | 2.08 | 1800 | 154.1 | Q690 | C50 |
| C320-2 | 320.91 | 2.03 | 1800 | 158.08 | |||
| C320-3 | 320.3 | 2.04 | 1800 | 157.01 | |||
| C360 | C360-1 | 360.33 | 2.03 | 1800 | 177.5 | Q690 | C50 |
| C360-2 | 360.88 | 2.01 | 1800 | 179.54 | |||
| C360-3 | 360.34 | 1.96 | 1800 | 183.85 | |||
| C400 | C400-1 | 400.51 | 2.19 | 1800 | 182.88 | Q690 | C50 |
| C400-2 | 400.85 | 2.29 | 1800 | 175.04 | |||
| C400-3 | 400.22 | 1.99 | 1800 | 201.12 |
| Concrete Grade | Weight/[kg/m3] | |||||
|---|---|---|---|---|---|---|
| Fly Ash | Water | Cement | Sand | Gravel | Water Reducer | |
| C50/60 | 80 | 170 | 360 | 693 | 1084 | 13.2 |
| No. | Specimen | fy/MPa | D/t | Test/FE Results (kN·m) | Proposed Method | GB 50936-2014 | AISC 360-16 | Eurocode 4 | Ref. | ||||
|---|---|---|---|---|---|---|---|---|---|---|---|---|---|
| Results (kN·m) | C/R | Results (kN·m) | G/R | Results (kN·m) | A/R | Results (kN·m) | E/R | ||||||
| 1 | CBC0-C | 400 | 109.9 | 7.6 | 8.65 | 1.14 | 8.48 | 1.12 | 4.74 | 0.62 | 8.11 | 1.07 | [39] |
| 2 | CBC0-B | 400 | 88.32 | 9.1 | 9.82 | 1.08 | 9.51 | 1.05 | 5.96 | 0.65 | 10.03 | 1.10 | |
| 3 | CBC0-A | 400 | 73.93 | 11 | 10.84 | 0.99 | 10.53 | 0.96 | 7.18 | 0.65 | 11.95 | 1.09 | |
| 4 | CBC1 | 365 | 40.25 | 11.33 | 11.13 | 0.98 | 10.19 | 0.90 | 9.11 | 0.80 | 14.66 | 1.29 | |
| 5 | CBC2 | 432 | 31.77 | 10.86 | 9.66 | 0.89 | 8.32 | 0.77 | 8.89 | 0.82 | 14.03 | 1.29 | |
| 6 | CBC5 | 433 | 24.86 | 3.78 | 3.70 | 0.98 | 2.81 | 0.74 | 3.58 | 0.95 | 5.59 | 1.48 | |
| 7 | CBC7 | 408 | 20.16 | 4.75 | 4.13 | 0.87 | 2.90 | 0.61 | 4.09 | 0.86 | 6.33 | 1.33 | |
| 8 | CBC9 | 460 | 12.84 | 1.17 | 1.13 | 0.96 | 0.23 | 0.19 | 1.18 | 1.00 | 1.79 | 1.53 | |
| 9 | C133X1.5C30 | 465 | 88.67 | 18.12 | 17.14 | 0.95 | 15.87 | 0.88 | 11.98 | 0.66 | 19.87 | 1.10 | [40] |
| 10 | C133X2.0C30 | 436 | 66.5 | 21.54 | 19.45 | 0.90 | 19.76 | 0.92 | 14.97 | 0.69 | 24.45 | 1.13 | |
| 11 | C114X1.1C30 | 448 | 103.6 | 8.85 | 9.81 | 1.11 | 9.13 | 1.03 | 6.28 | 0.71 | 10.54 | 1.19 | |
| 12 | C114X1.5C30 | 444 | 76 | 12.69 | 11.48 | 0.90 | 11.04 | 0.87 | 8.43 | 0.66 | 13.87 | 1.09 | |
| 13 | C114X2.0C30 | 458 | 57 | 16.17 | 13.88 | 0.86 | 13.34 | 0.82 | 11.49 | 0.71 | 18.56 | 1.15 | |
| 14 | C89X1.1C30 | 434 | 80.90 | 5.11 | 5.21 | 1.02 | 5.24 | 1.02 | 3.69 | 0.72 | 6.10 | 1.19 | |
| 15 | C89X1.5C30 | 447 | 59.33 | 6.85 | 6.34 | 0.93 | 6.14 | 0.90 | 5.13 | 0.75 | 8.32 | 1.21 | |
| 16 | C89X2.0C30 | 474 | 44.5 | 9.07 | 7.97 | 0.88 | 7.25 | 0.80 | 7.18 | 0.79 | 11.42 | 1.26 | |
| 17 | C240-2-30-1800 | 741 | 120 | 134.89 | 136.20 | 1.00 | 123.96 | 1.07 | 83.95 | 0.62 | 141.38 | 1.05 | [–] |
| 18 | C280-2-30-1800 | 741 | 140 | 189.72 | 197.77 | 1.04 | 183.31 | 1.06 | 114.54 | 0.60 | 194.87 | 1.03 | |
| 19 | C320-2-30-1800 | 741 | 160 | 259.91 | 253.12 | 0.97 | 258.08 | 1.04 | 149.87 | 0.58 | 257.26 | 0.99 | |
| 20 | C360-2-30-1800 | 741 | 180 | 335.66 | 320.58 | 0.96 | 349.92 | 1.04 | 189.94 | 0.57 | 328.67 | 0.98 | |
| 21 | C400-2-30-1800 | 741 | 200 | 421.48 | 395.99 | 0.94 | 460.48 | 1.05 | 234.76 | 0.56 | 409.18 | 0.97 | |
| 22 | C240-3-30-1800 | 741 | 80 | 193.78 | 169.63 | 0.88 | 154.87 | 1.06 | 126.99 | 0.66 | 208.58 | 1.08 | |
| 23 | C240-2-50-1800 | 741 | 120 | 138.26 | 142.09 | 1.03 | 162.94 | 1.18 | 83.95 | 0.61 | 145.54 | 1.05 | |
| 24 | C240-2-70-1800 | 741 | 120 | 141 | 142.09 | 1.01 | 202.20 | 1.43 | 83.95 | 0.60 | 148.40 | 1.05 | |
| 25 | C240-2-30-1500 | 741 | 120 | 140.33 | 136.20 | 0.97 | 123.96 | 0.88 | 83.95 | 0.60 | 141.38 | 1.01 | |
| 26 | C240-2-30-2100 | 741 | 120 | 149.93 | 136.20 | 0.91 | 123.96 | 0.83 | 83.95 | 0.56 | 141.38 | 0.94 | |
| 27 | C240-2-30-1200 | 741 | 120 | 148.88 | 136.20 | 0.91 | 123.96 | 0.83 | 83.95 | 0.56 | 141.38 | 0.95 | |
| 28 | C240-2-30-1800-Q700 | 700 | 120 | 131.18 | 131.55 | 1.00 | 123.96 | 0.94 | 79.30 | 0.60 | 133.99 | 1.02 | |
| 29 | C240-2-30-1800-Q650 | 650 | 120 | 125.98 | 125.87 | 1.00 | 123.96 | 0.98 | 73.64 | 0.58 | 124.94 | 0.99 | |
| 30 | C240-2-30-1800-Q600 | 600 | 120 | 120.06 | 120.20 | 1.00 | 123.96 | 1.03 | 67.97 | 0.57 | 115.85 | 0.96 | |
| MV | 0.97 | 0.93 | 0.68 | 1.12 | |||||||||
| COV | 0.14 | 1.26 | 0.39 | 0.65 | |||||||||
Publisher’s Note: MDPI stays neutral with regard to jurisdictional claims in published maps and institutional affiliations. |
© 2022 by the authors. Licensee MDPI, Basel, Switzerland. This article is an open access article distributed under the terms and conditions of the Creative Commons Attribution (CC BY) license (https://creativecommons.org/licenses/by/4.0/).
Share and Cite
Zhang, Z.-Y.; Sun, Q.; Wang, J.-Q.; Zhao, C.; Zhao, B.-Z.; Wang, J.-T. Experimental and Analytical Research on Flexural Behavior of Concrete-Filled High-Strength Steel Tubular Members. Materials 2022, 15, 3790. https://doi.org/10.3390/ma15113790
Zhang Z-Y, Sun Q, Wang J-Q, Zhao C, Zhao B-Z, Wang J-T. Experimental and Analytical Research on Flexural Behavior of Concrete-Filled High-Strength Steel Tubular Members. Materials. 2022; 15(11):3790. https://doi.org/10.3390/ma15113790
Chicago/Turabian StyleZhang, Zai-Yu, Qing Sun, Jia-Qi Wang, Chao Zhao, Bing-Zhen Zhao, and Jian-Tao Wang. 2022. "Experimental and Analytical Research on Flexural Behavior of Concrete-Filled High-Strength Steel Tubular Members" Materials 15, no. 11: 3790. https://doi.org/10.3390/ma15113790