Ciprofloxacin and Graphene Oxide Combination—New Face of a Known Drug

 , , , and
Abstract
:
1. Introduction
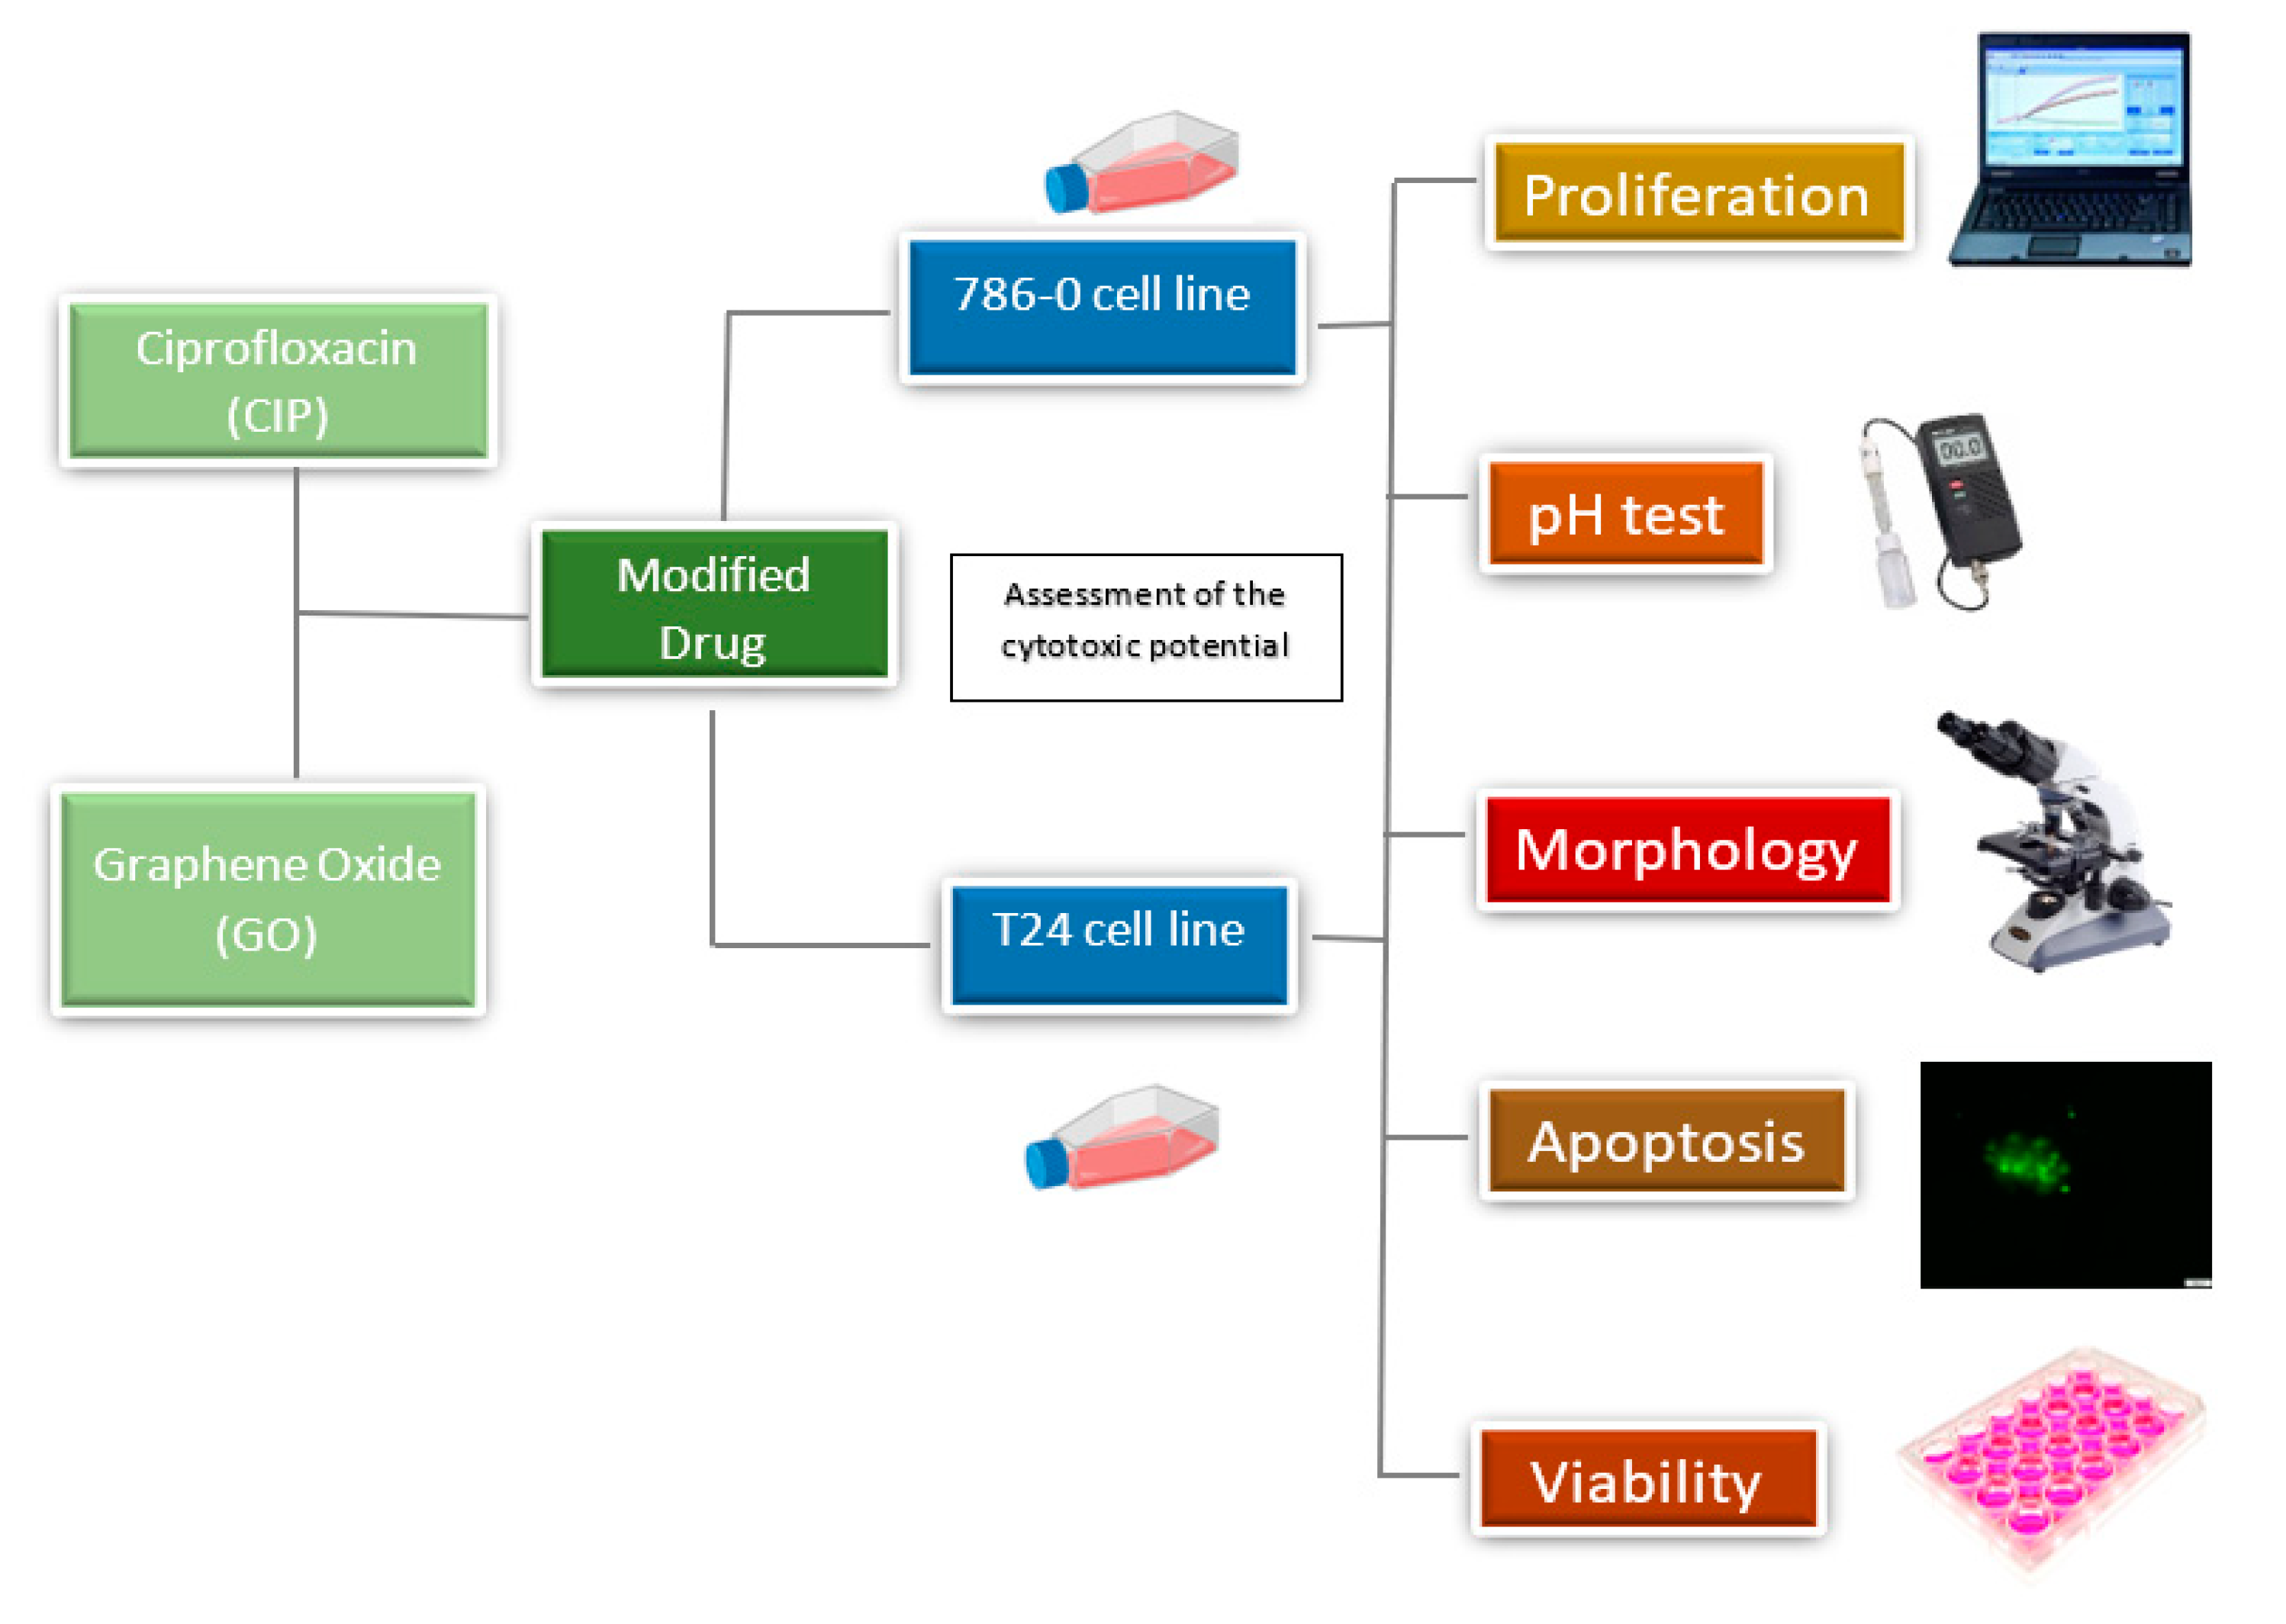
2. Materials and Methods
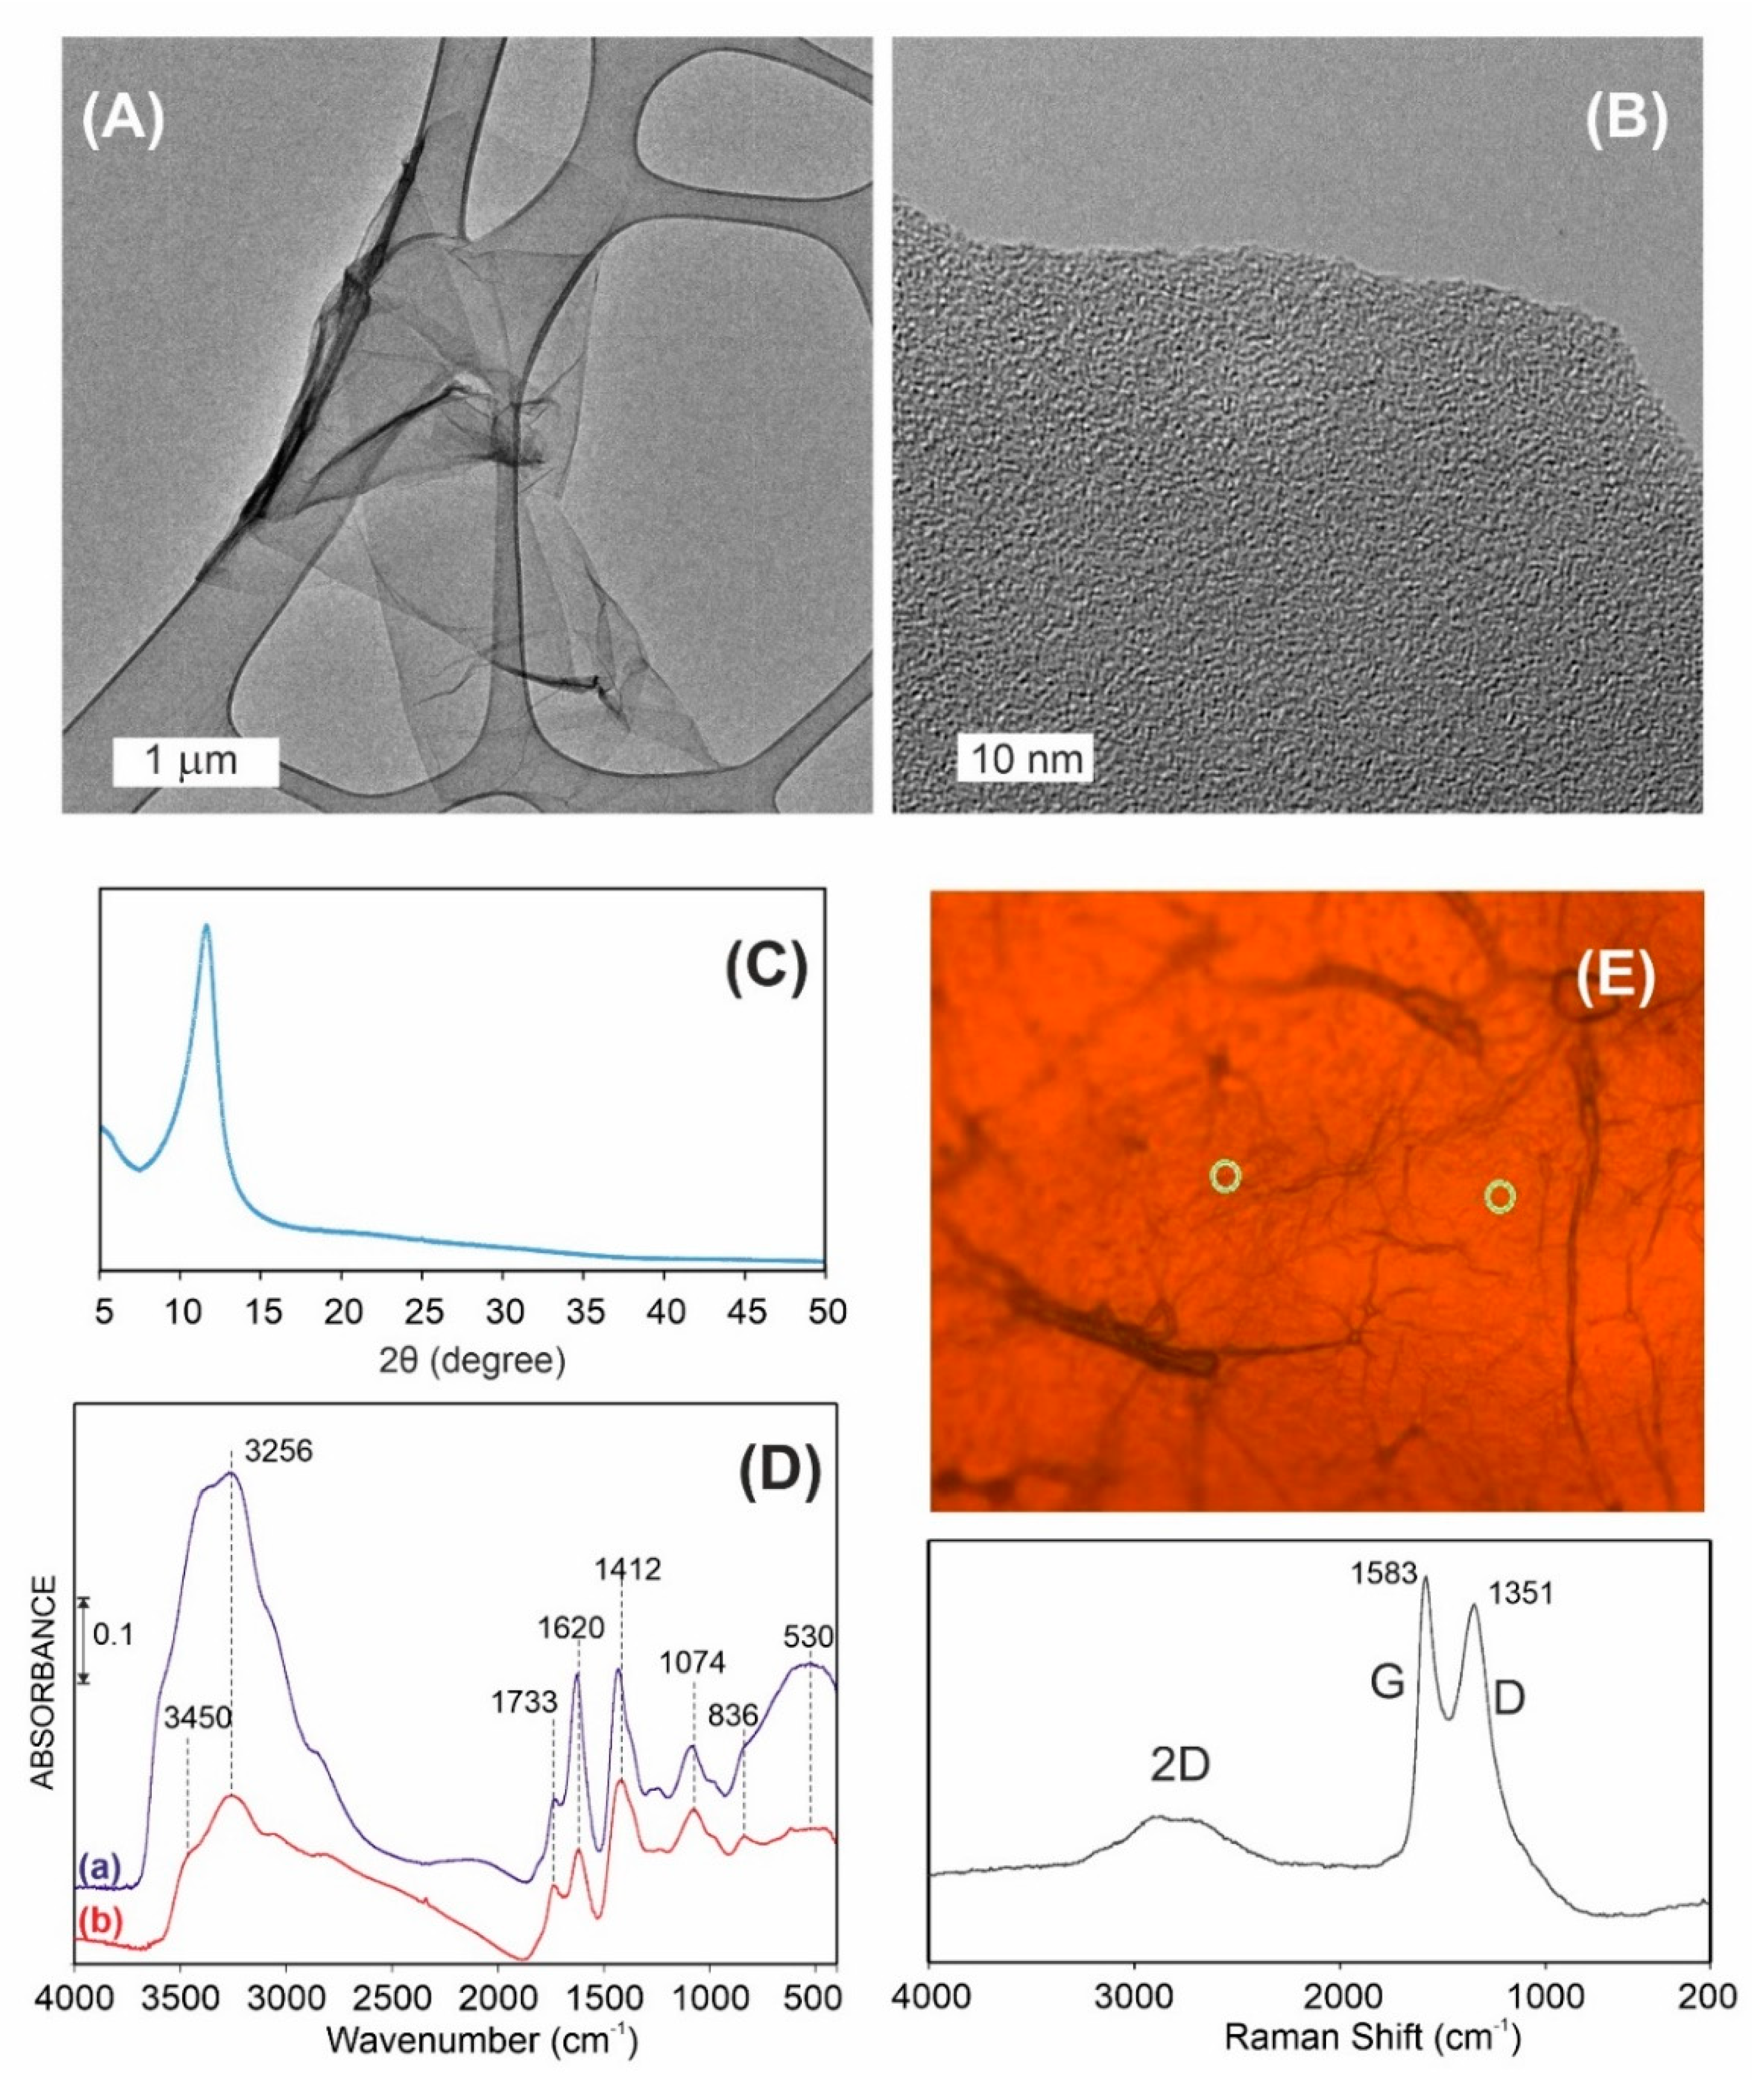
2.1. Graphene Oxide Characterization
2.2. Preparation of Ciprofloxacin Solution
2.3. Preparation of Graphene Oxide
2.4. Preparation of Ciprofloxacin and Graphene Combination
2.5. pH Test of Cell Culture Medium
2.6. Cell Culture
2.7. Morphological Assessment
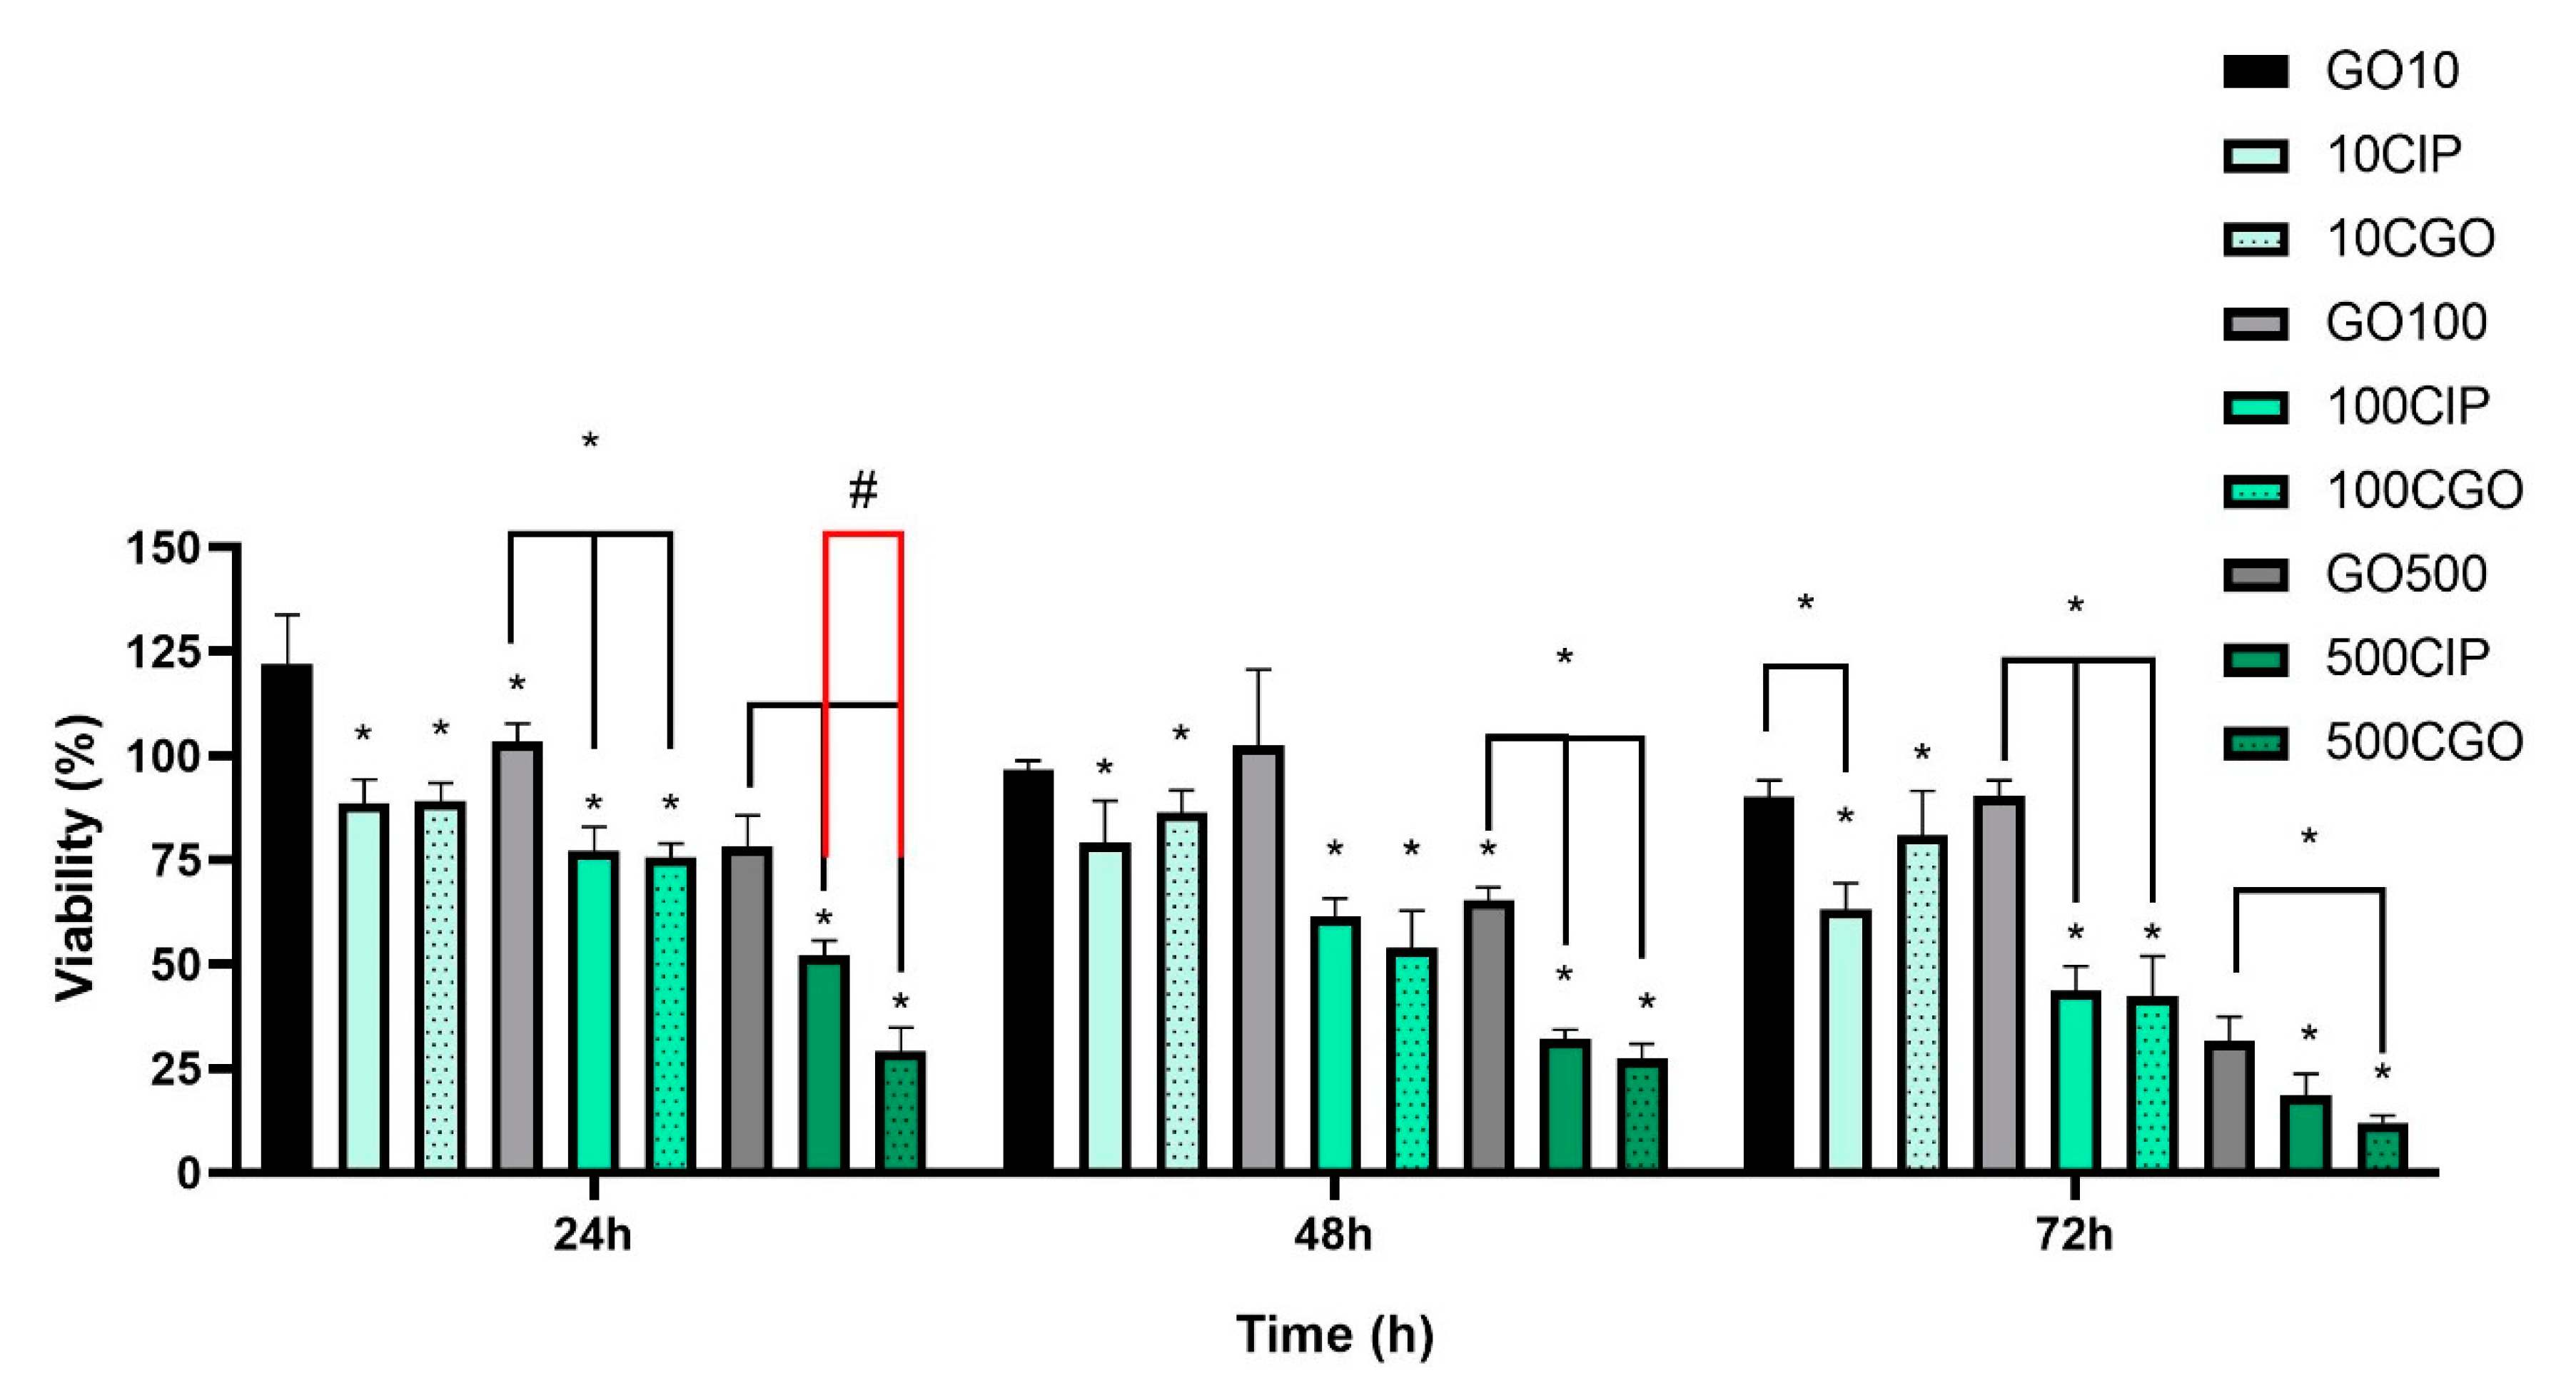
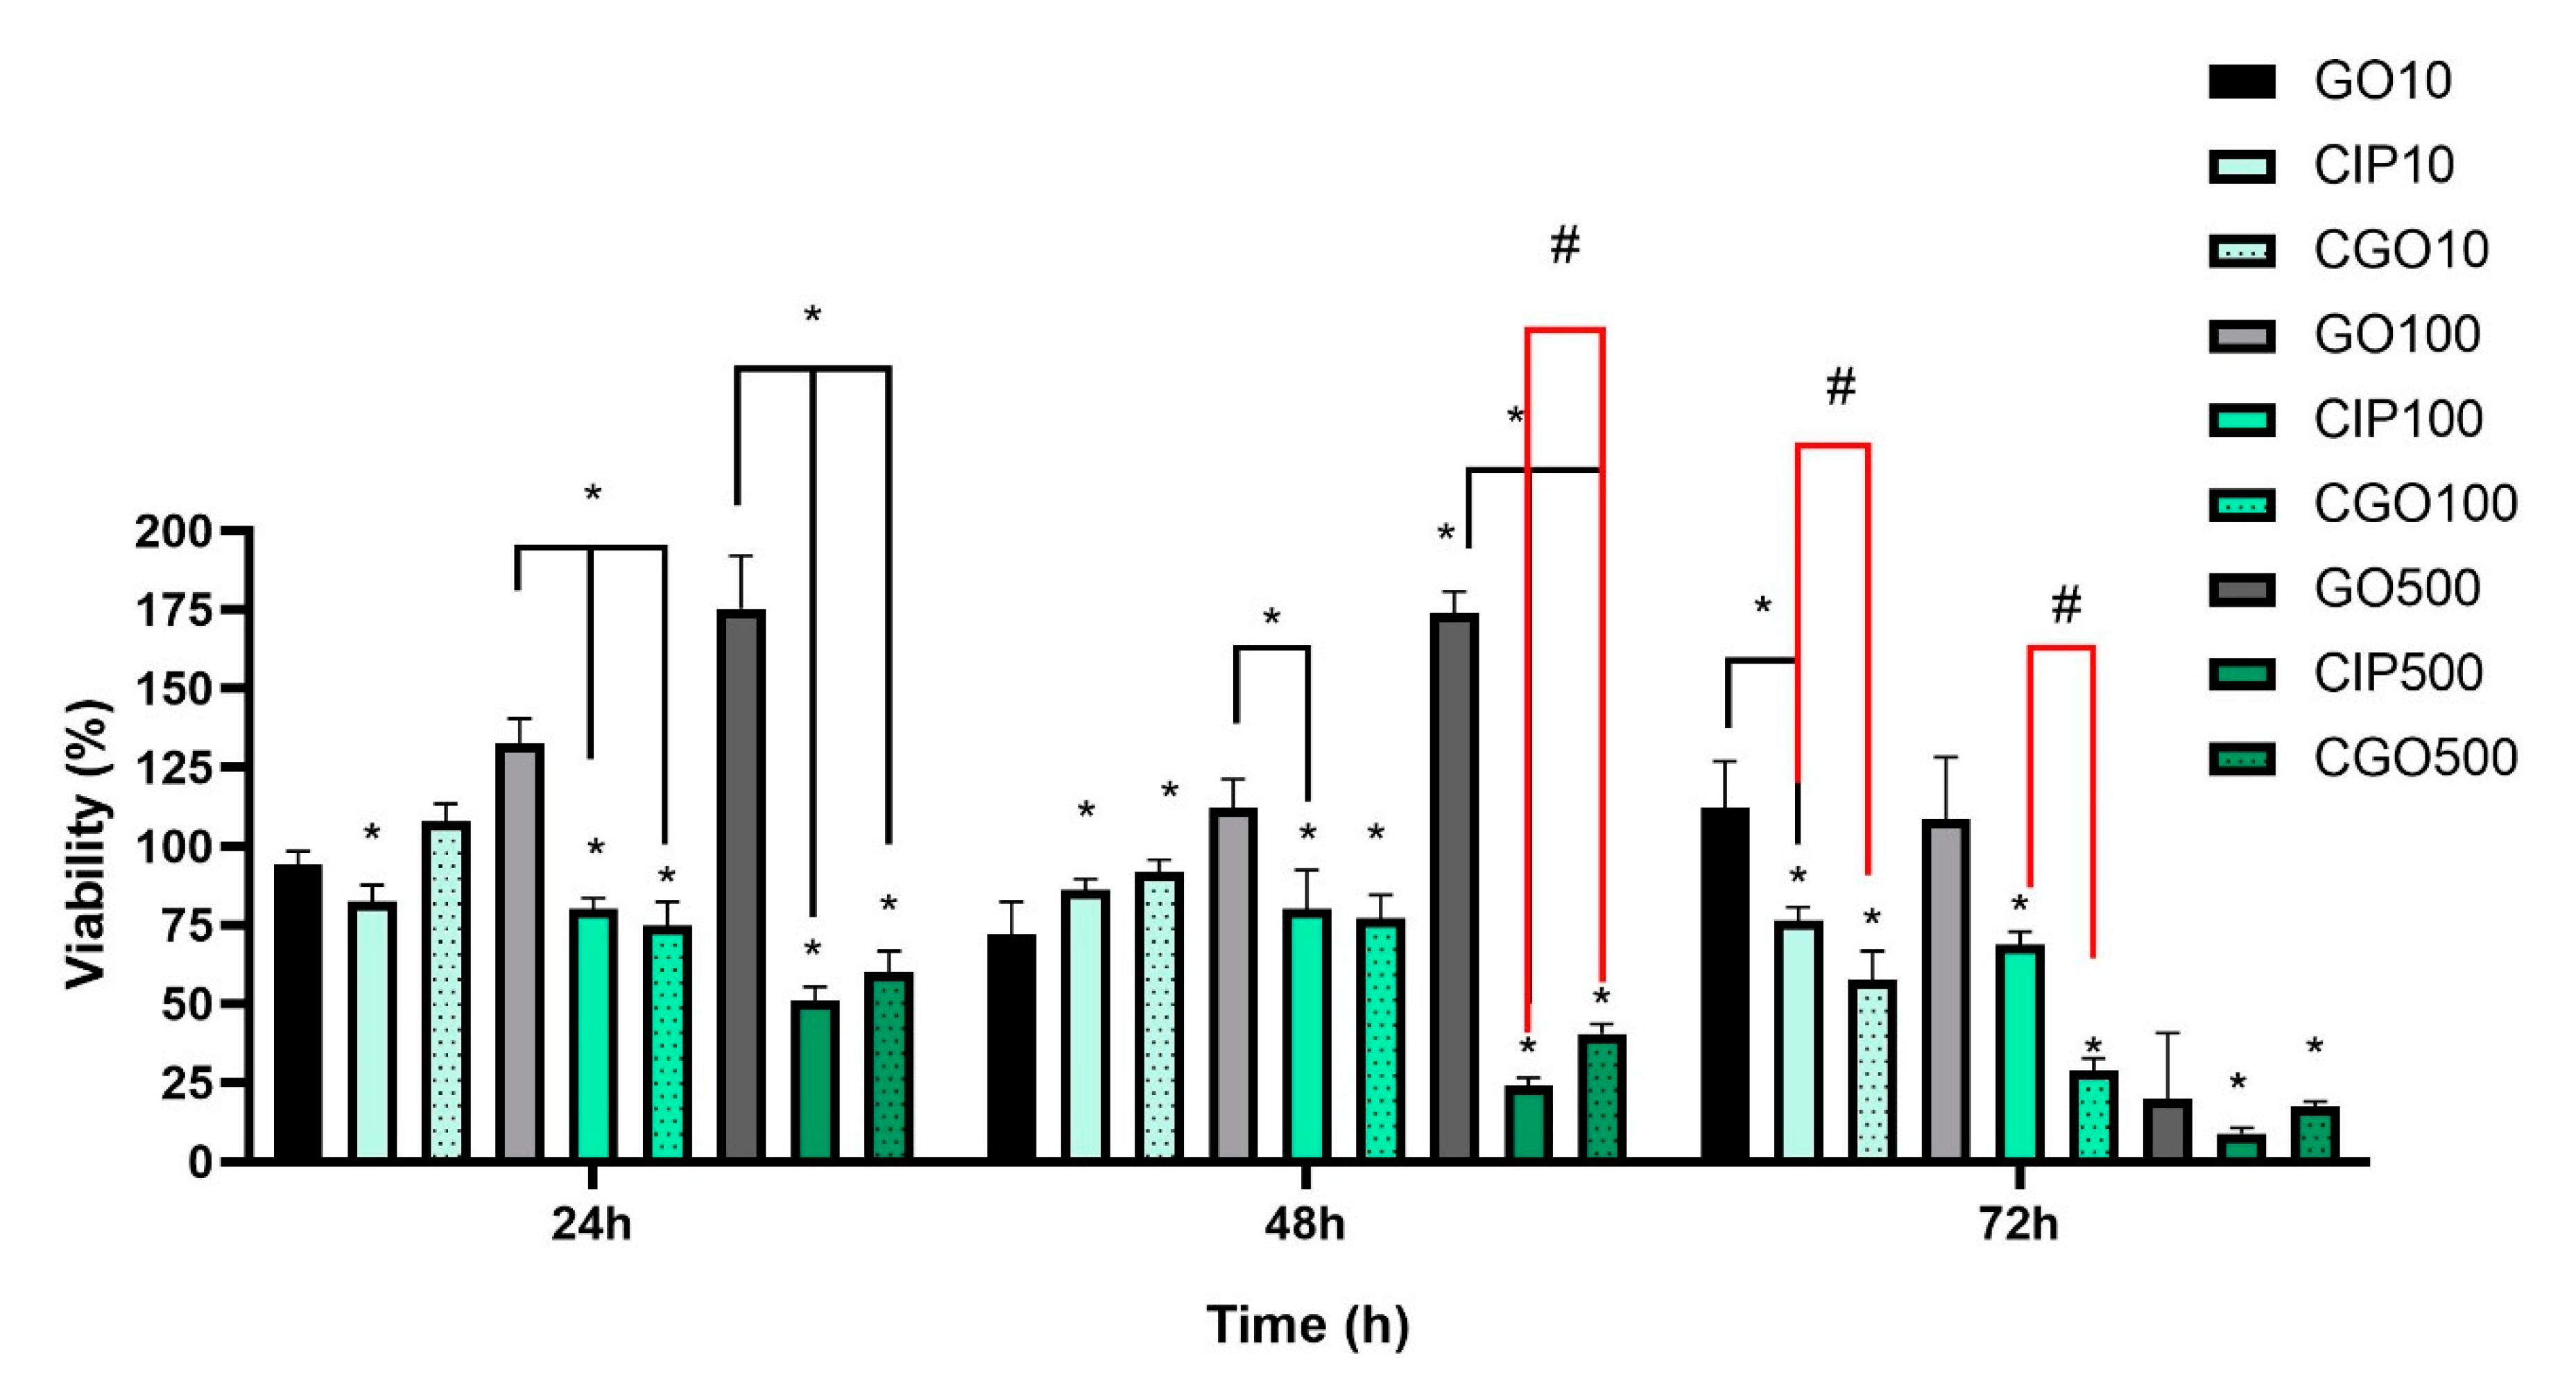
2.8. Viability
2.9. Apoptosis
2.10. Proliferation
2.11. Statistical Analysis
3. Results
3.1. Graphene Oxide Characterization
3.2. Ciprofloxacin and Graphene Oxide Combination Characterization
3.3. Viability
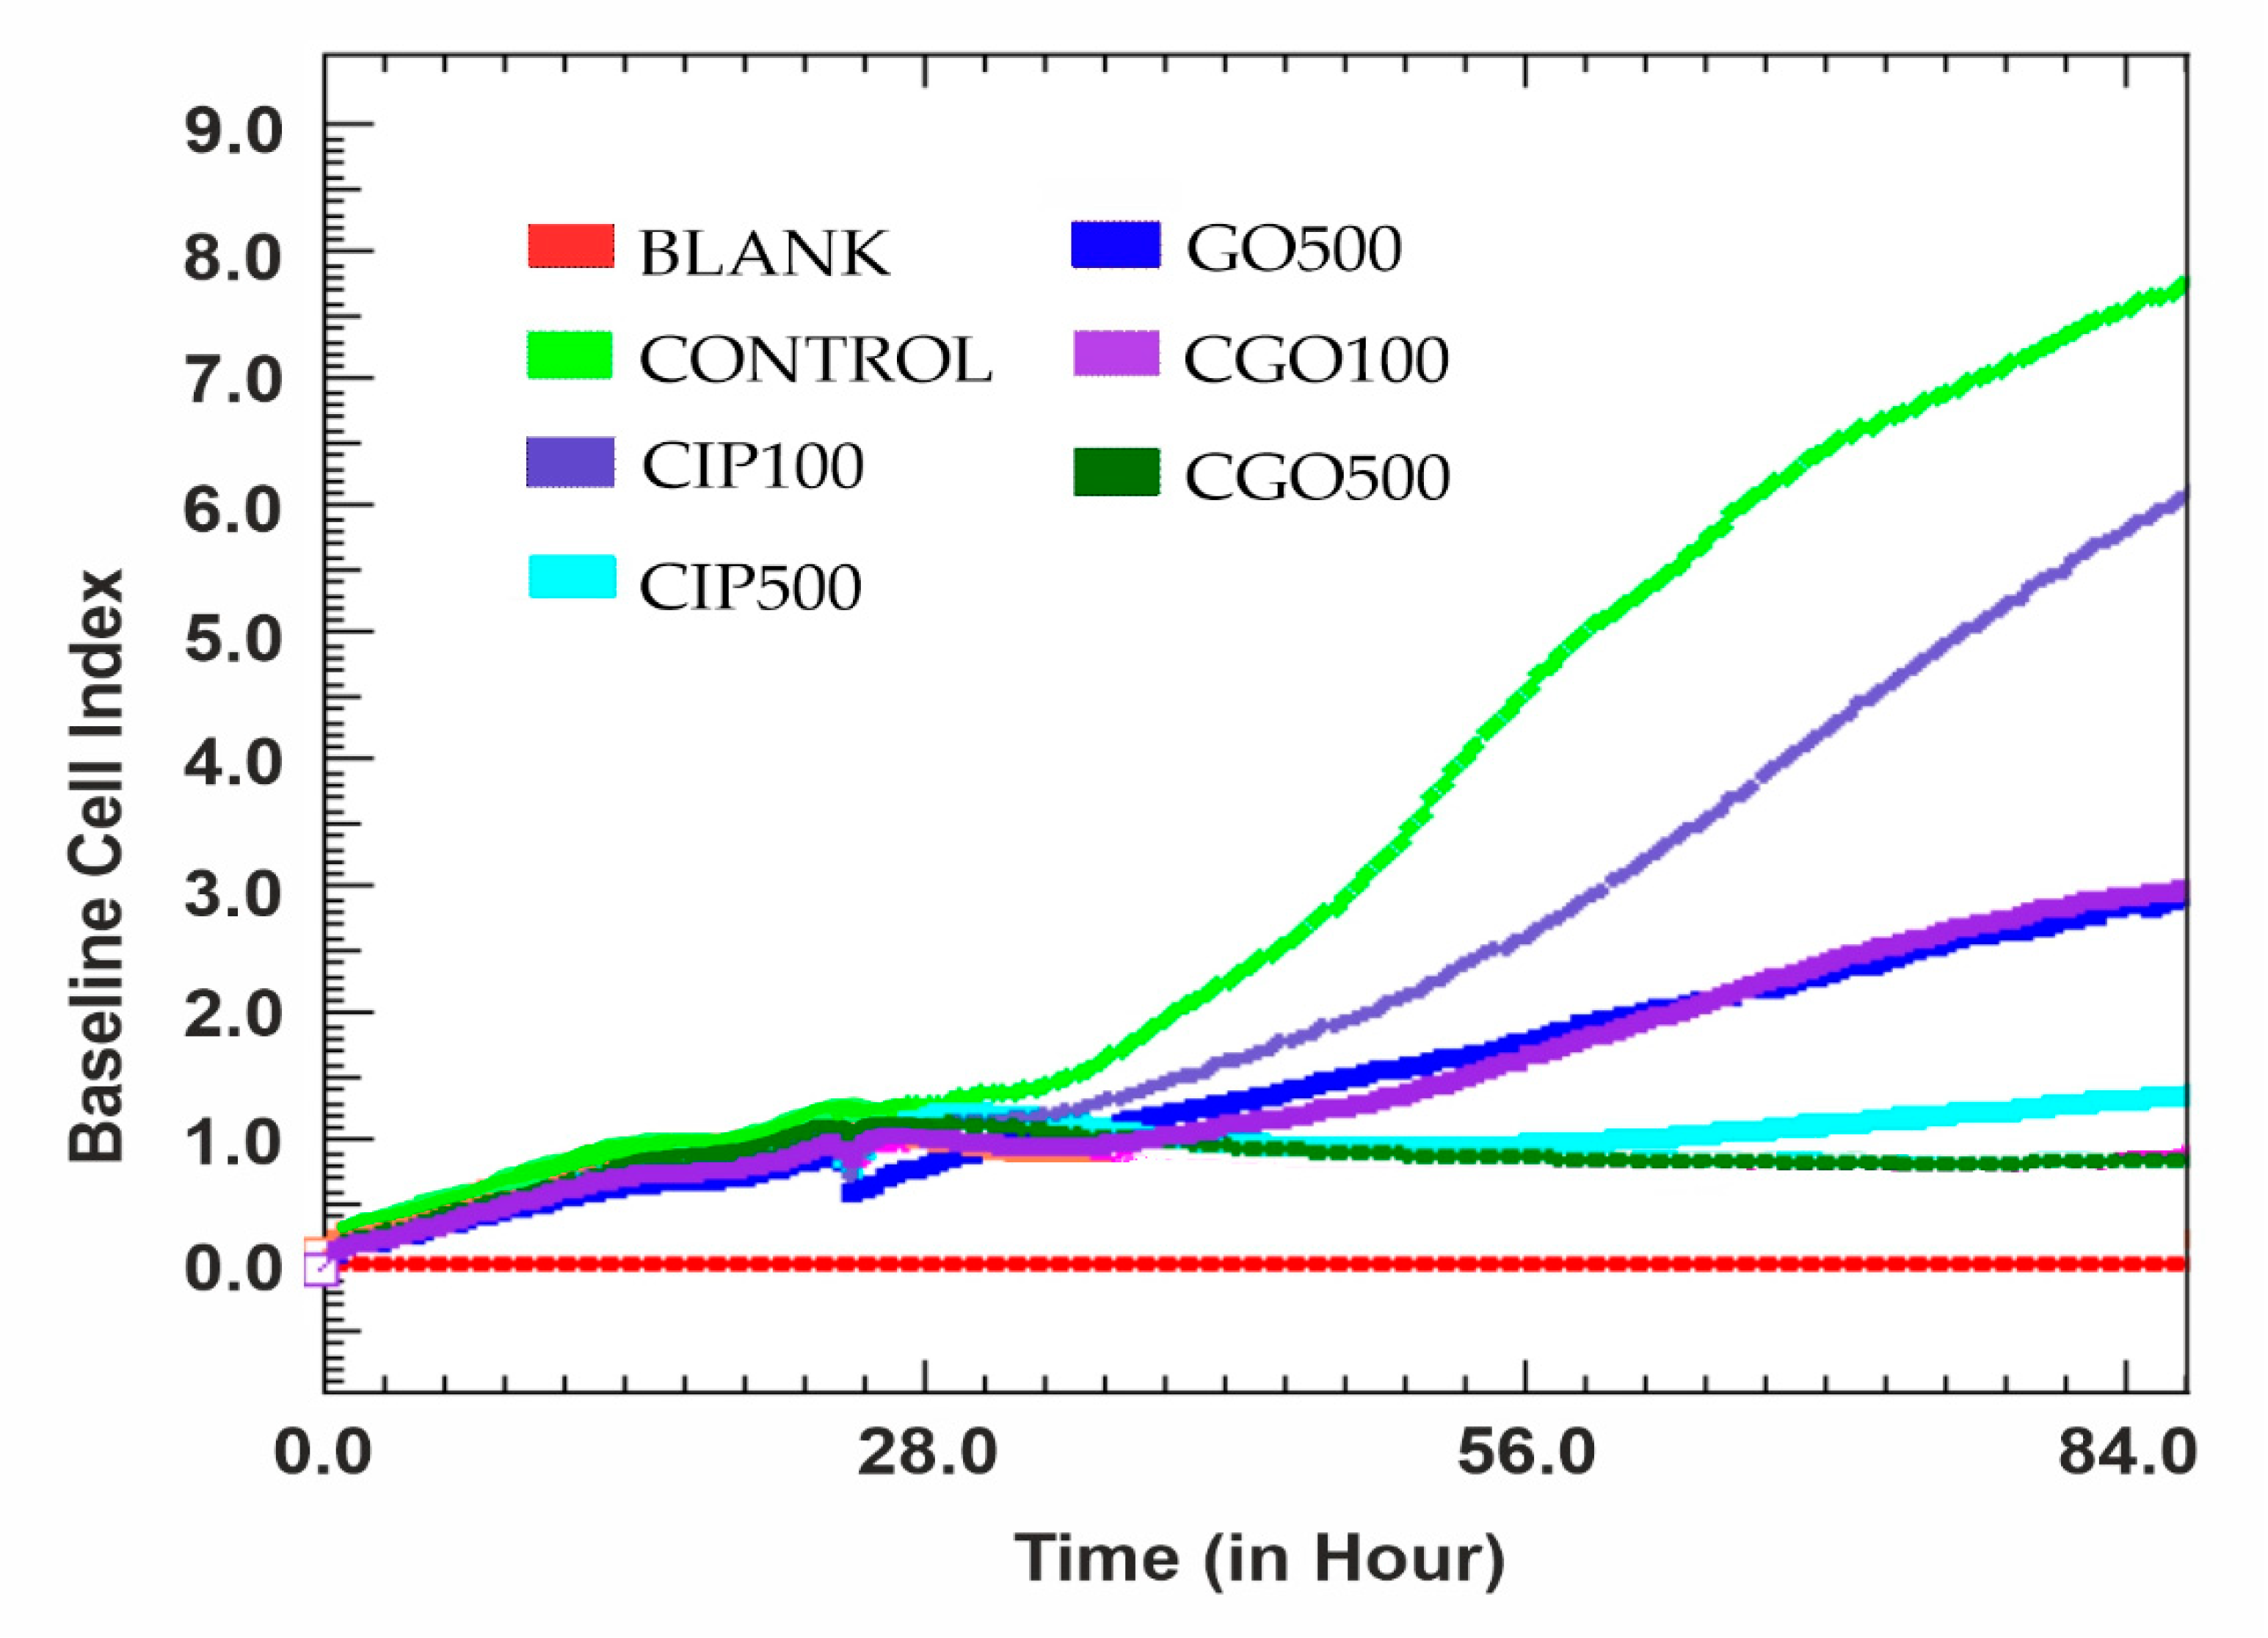
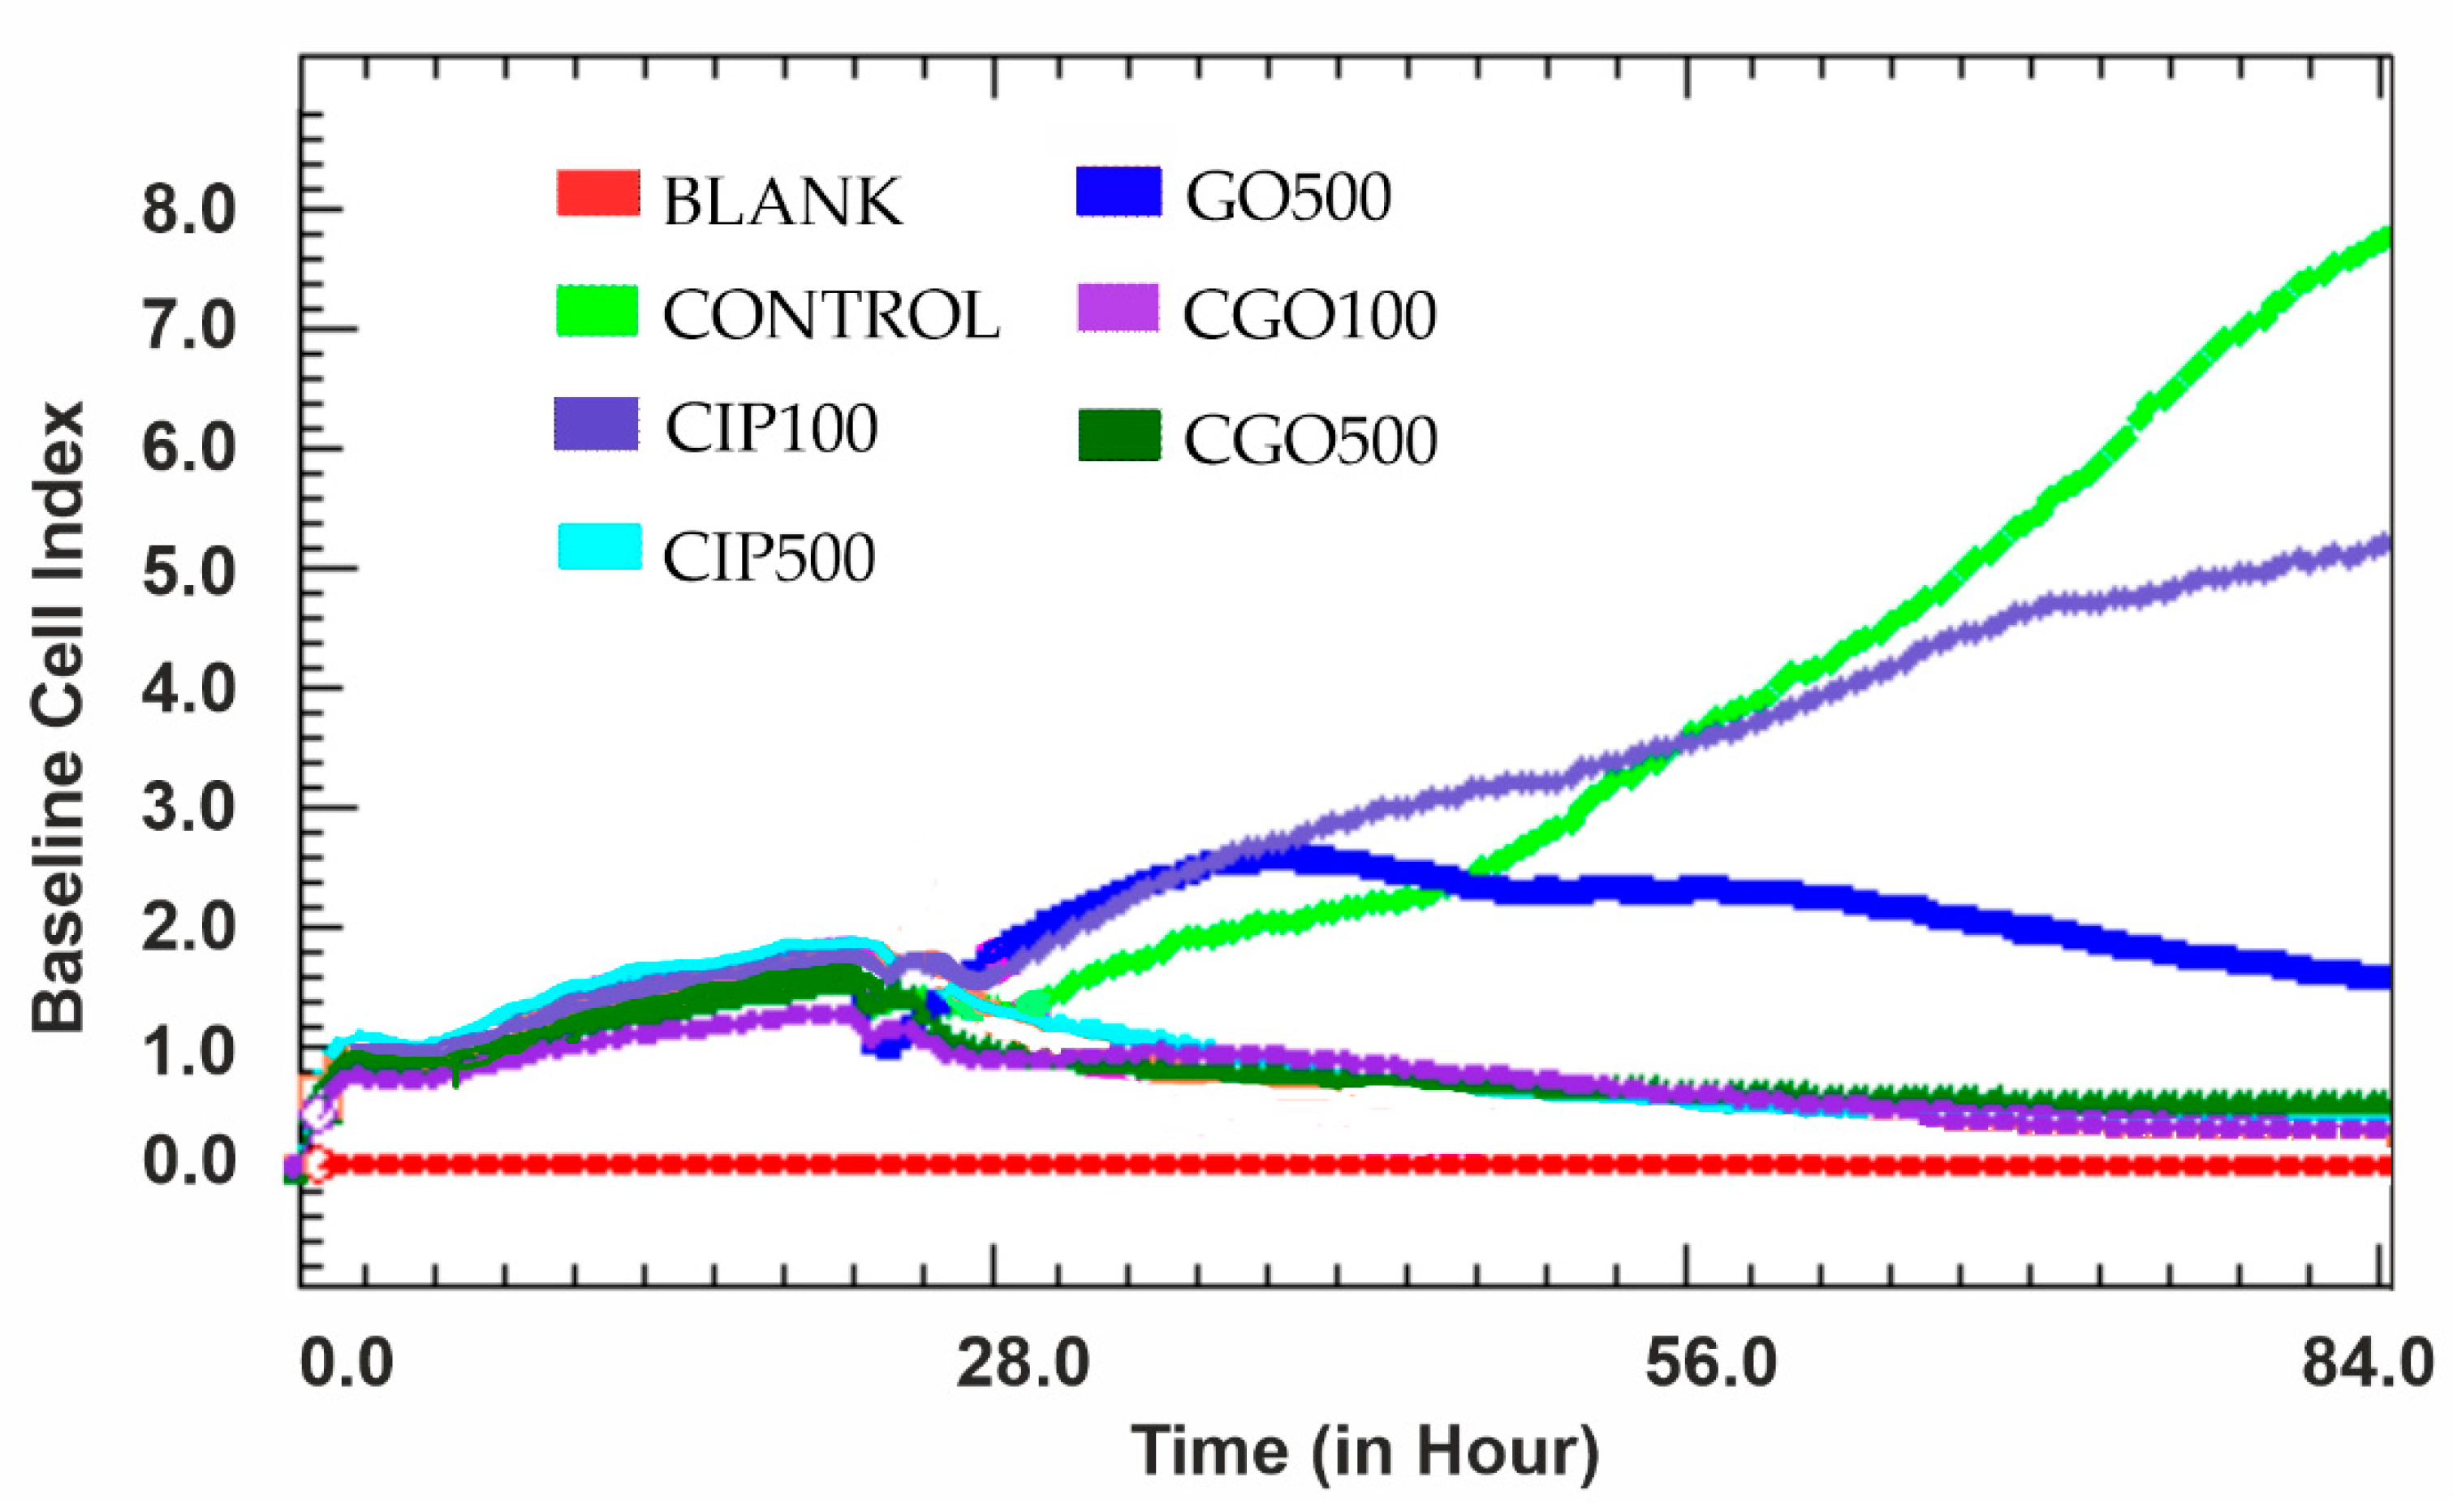
3.4. Proliferation
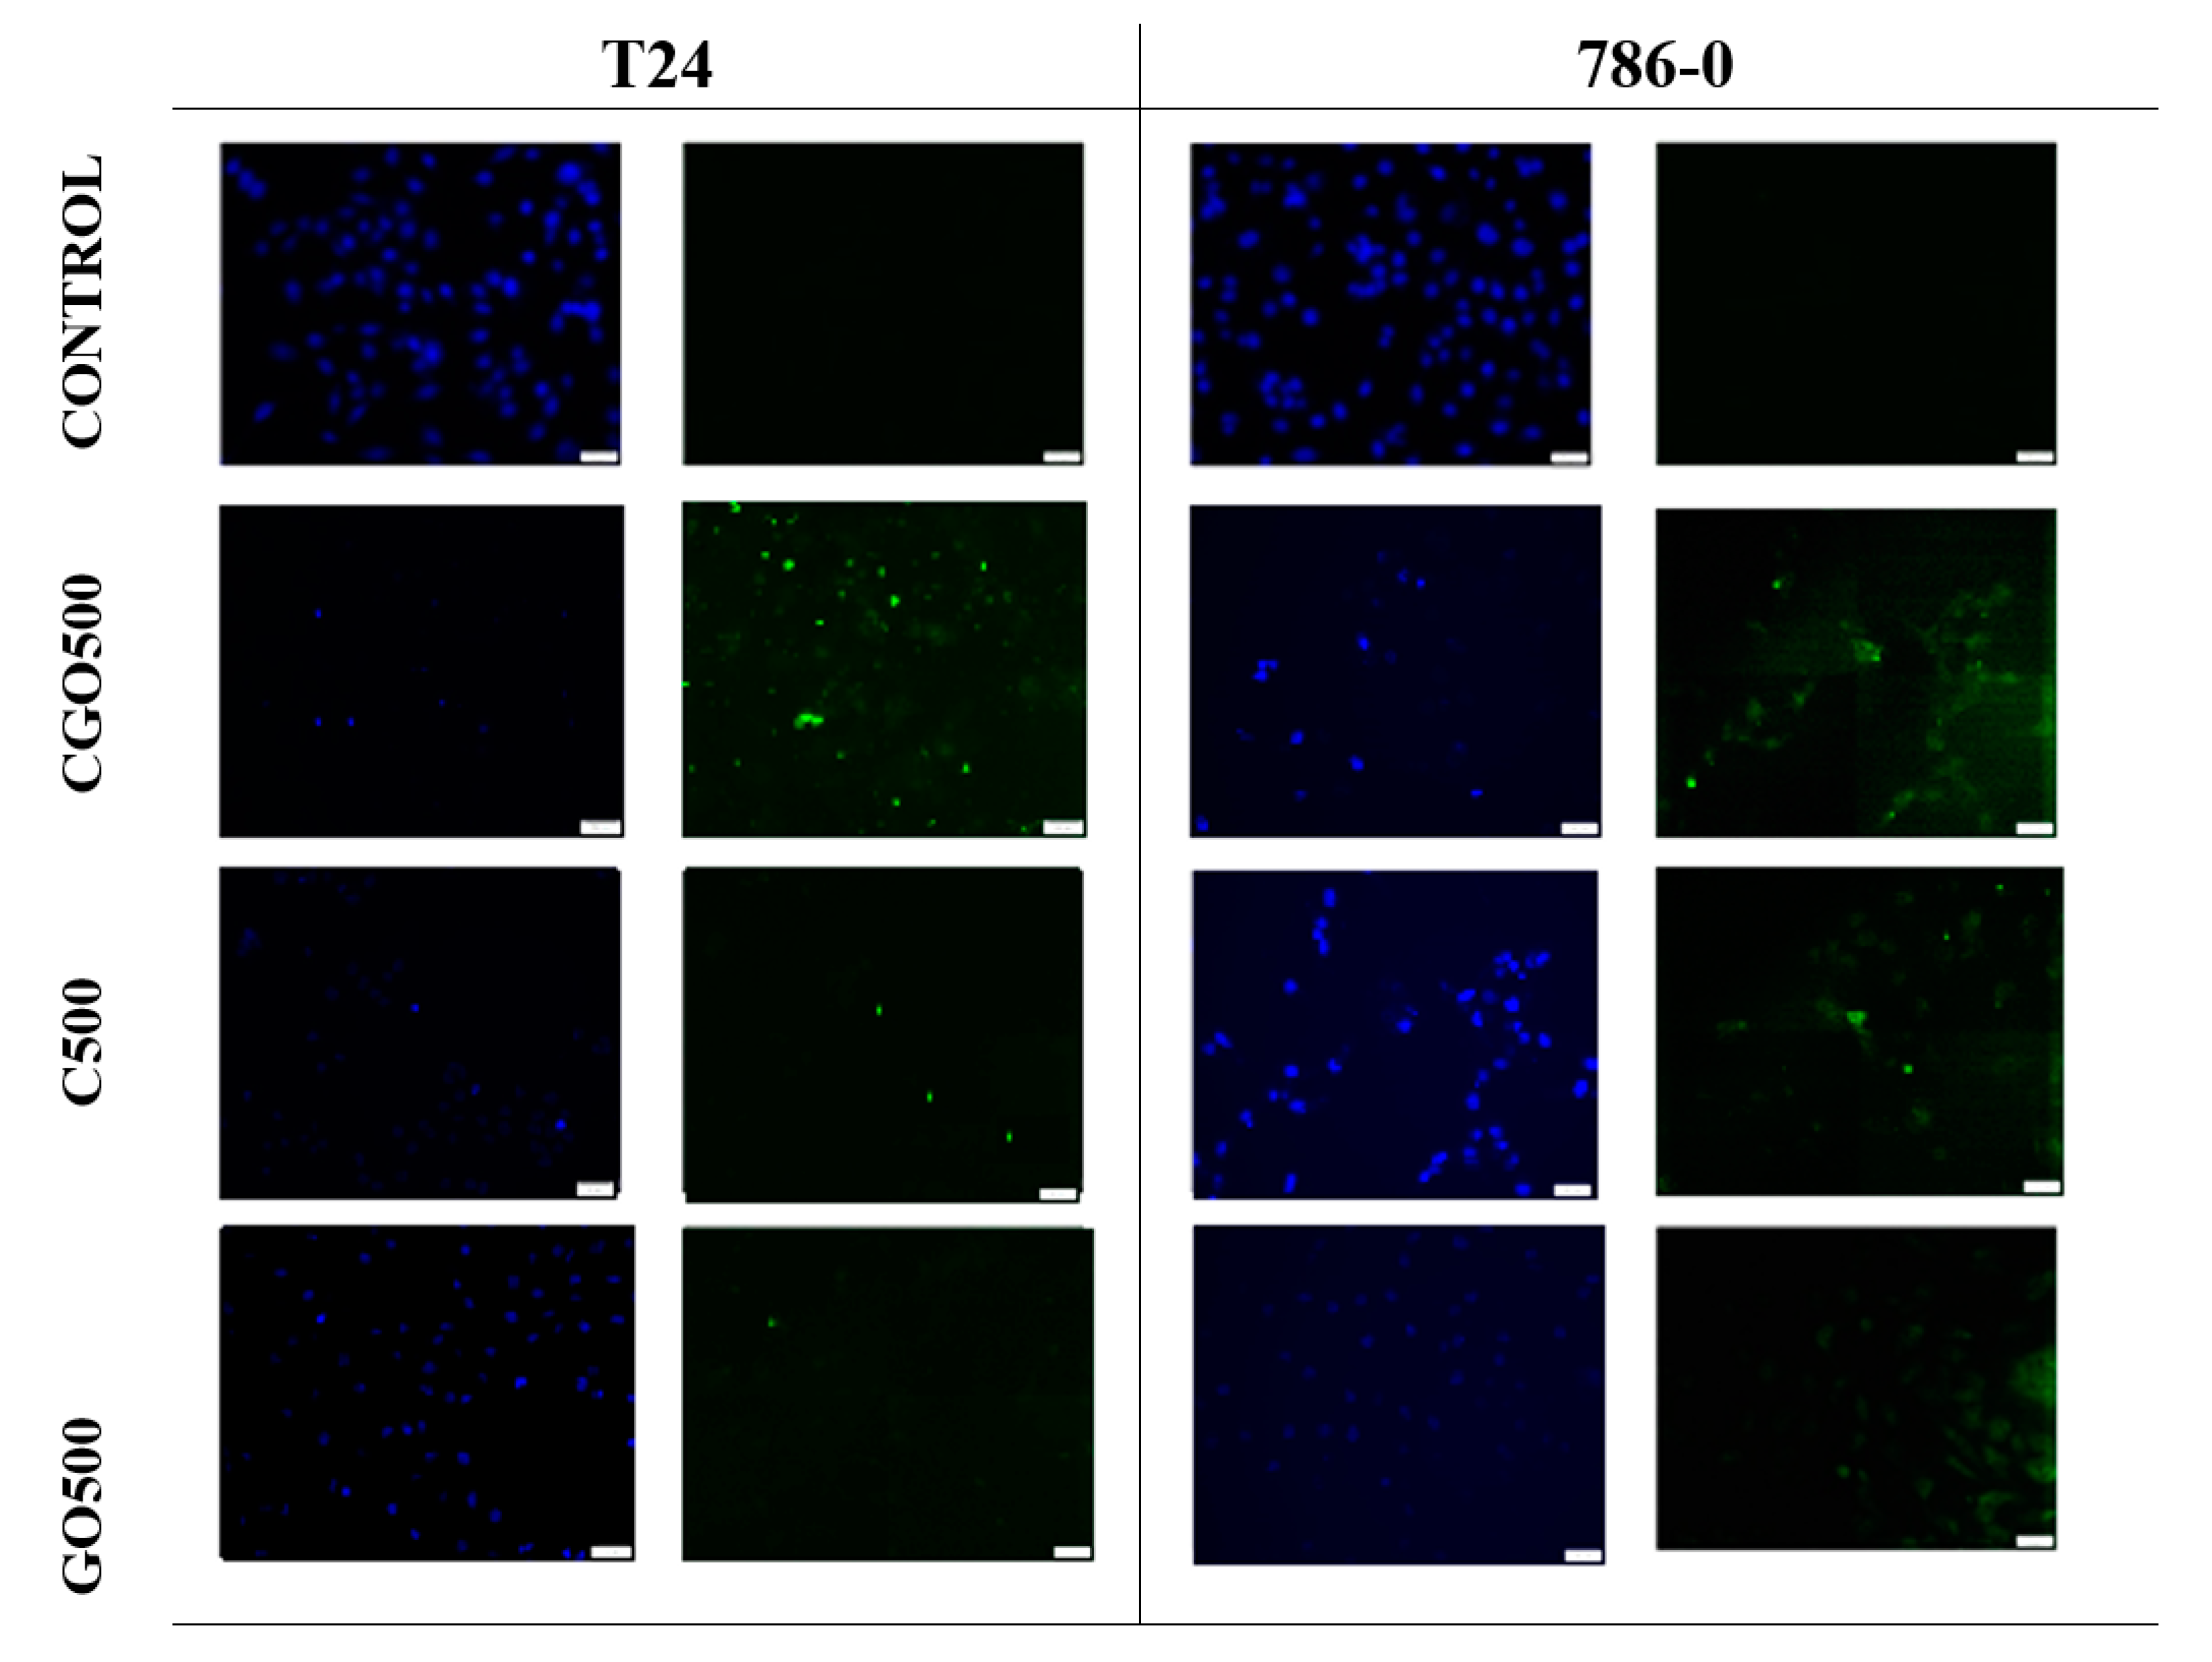
3.5. Apoptosis
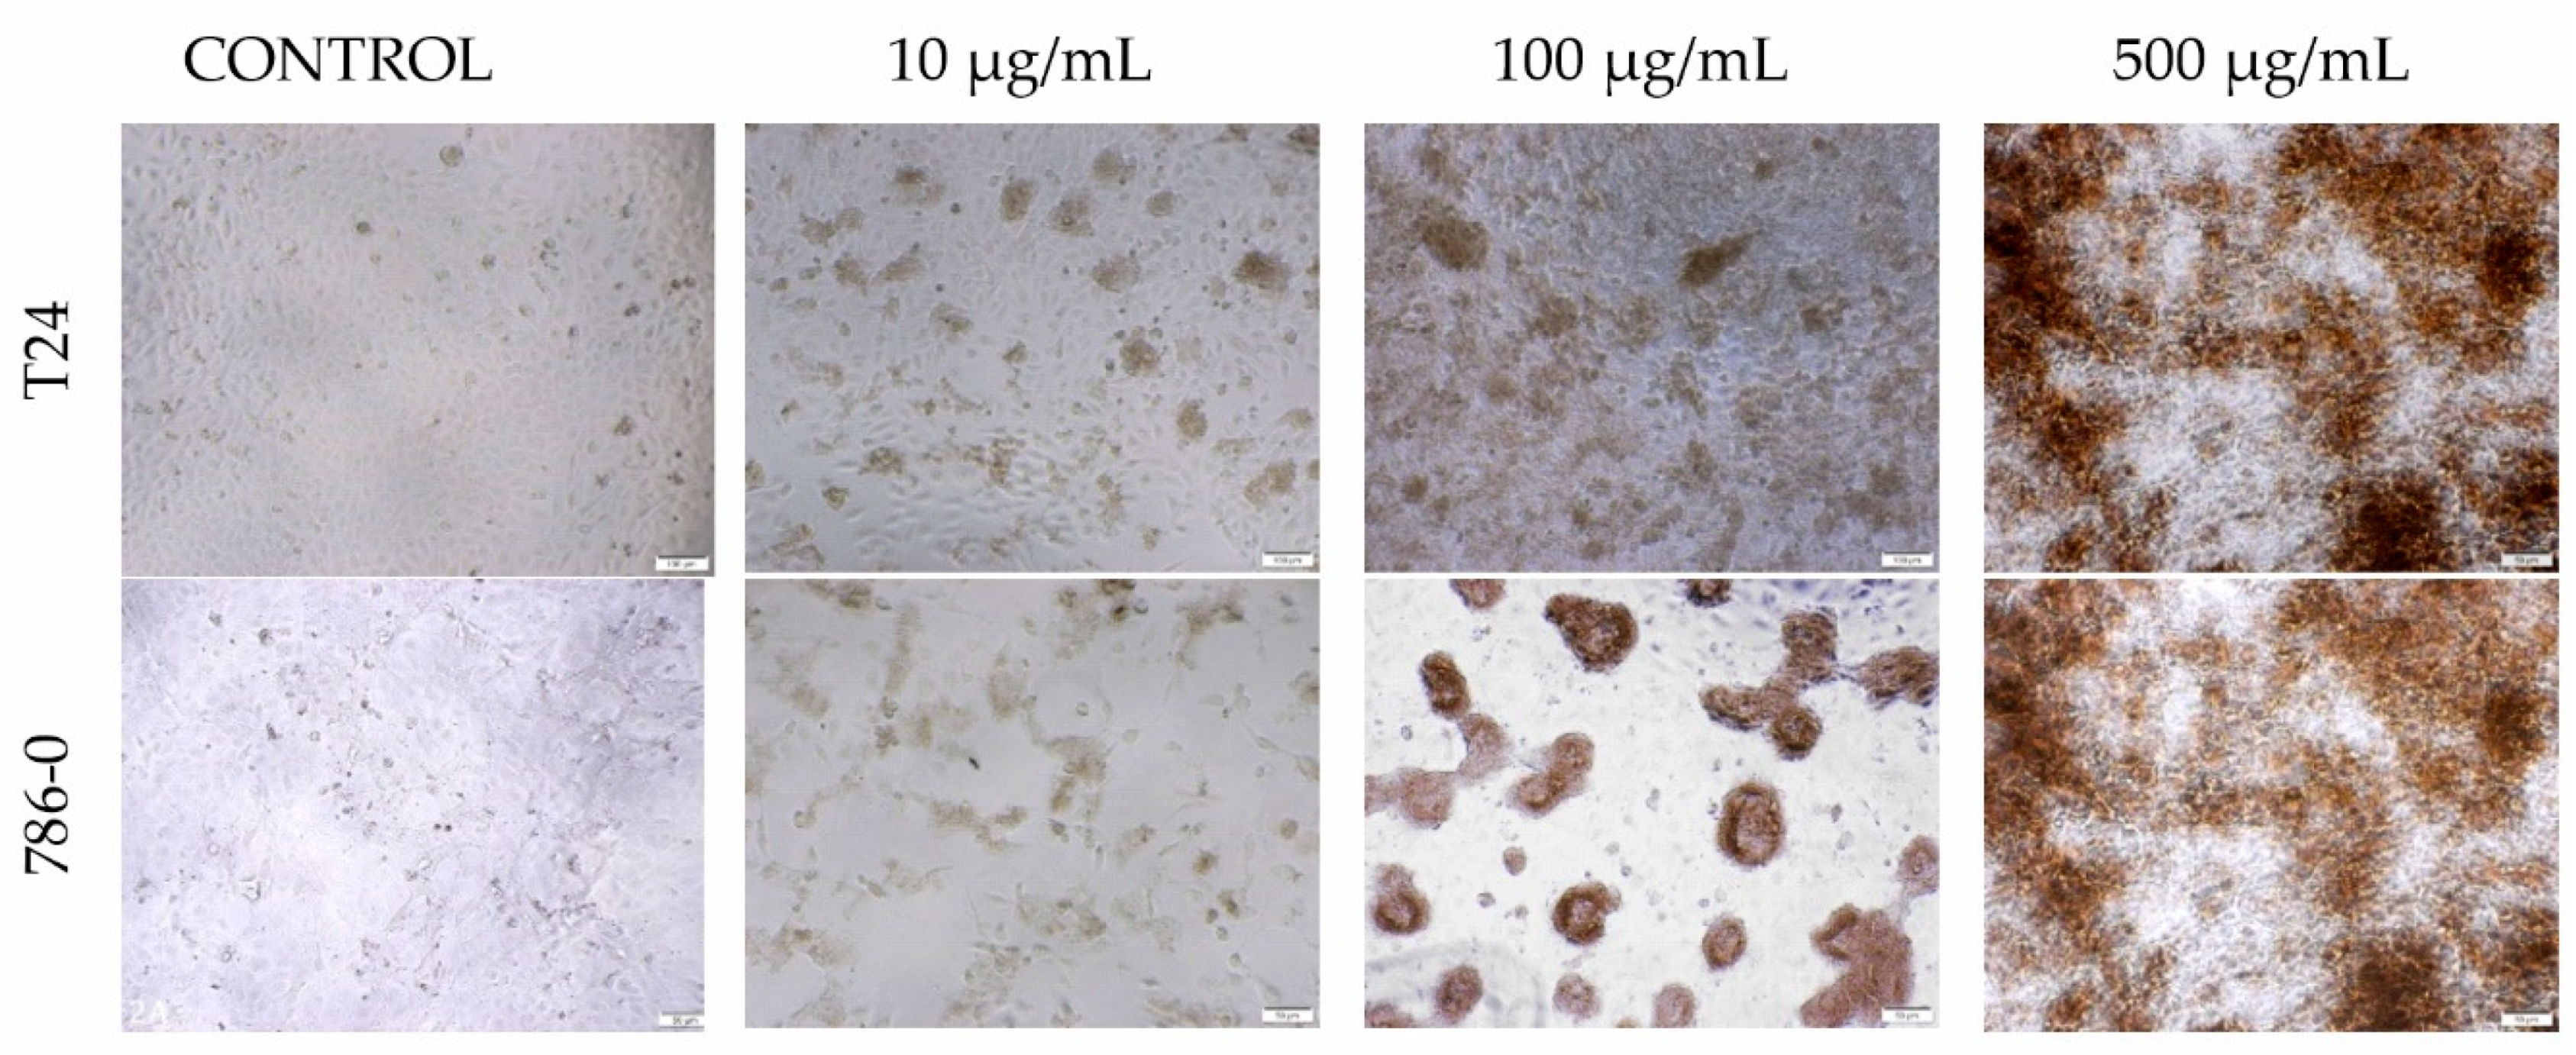
3.6. Morphology
3.7. Medium pH Analysis
4. Discussion
5. Conclusions
Author Contributions
Funding
Acknowledgments
Conflicts of Interest
References
- Siegel, R.L.; Miller, K.D.; Jemal, A. Cancer statistics, 2019. CA Cancer J. Clin. 2019, 69, 7–34. [Google Scholar] [CrossRef] [Green Version]
- Siegel, R.L.; Miller, K.D.; Jemal, A. Cancer statistics, 2016. CA Cancer J. Clin. 2016, 66, 7–30. [Google Scholar] [CrossRef] [PubMed] [Green Version]
- Bray, F.; Ferlay, J.; Soerjomataram, I.; Siegel, R.L.; Torre, L.A.; Jemal, A. Global cancer statistics 2018: GLOBOCAN estimates of incidence and mortality worldwide for 36 cancers in 185 countries. CA Cancer J. Clin. 2018, 68, 394–424. [Google Scholar] [CrossRef] [PubMed] [Green Version]
- Assaraf, Y.G.; Brozovi, A.; Gonçalves, A.C.; Jurkovicova, D.; Linē, A.; Machuqueiro, M.; Saponara, S.; Sarmento-Ribeiro, A.B.; Xavier, C.P.; Vasconcelos, M.H. The multi-factorial nature of clinical multidrug resistance in cancer. Drug Resist. Updates 2019, 46, 100645. [Google Scholar] [CrossRef] [PubMed]
- Singhvi, G.; Rapalli, V.K.; Nagpal, S.; Dubey, S.K.; Saha, R.N. Nanocarriers as Potential Targeted Drug Delivery for Cancer Therapy. In Nanoscience in Medicine; Daima, H., Navya, P.N., Ranjan, S., Dasgupta, N., Lichtfouse, E., Eds.; Springer: Cham, Switzerland, 2020; Volume 1. [Google Scholar]
- Su, H.; Jiang, H.; Tao, T.; Kang, X.; Zhang, X.; Kang, D.; Li, S.; Li, C.; Wang, H.; Yang, Z.; et al. Hope and challenge: Precision medicine in bladder cancer. Cancer Med. 2019, 8, 1806–1816. [Google Scholar] [CrossRef] [Green Version]
- Krukiewicz, K.; Zak, J.K. Biomaterial-based regional chemotherapy: Local anticancer drug delivery to enhance chemotherapy and minimize its side-effects. Mat. Sci. Eng. C Mater. 2016, 62, 927–942. [Google Scholar] [CrossRef]
- Sinha, R.; Kim, G.J.; Nie, S.; Shin, D.M. Nanotechnology in cancer therapeutics: Bioconjugated nanoparticles for drug delivery. Mol. Cancer Ther. 2006, 5, 1909–1917. [Google Scholar] [CrossRef] [Green Version]
- Yu, X.; Cheng, H.; Zhang, M.; Zhao, Y.; Qu, L.; Shi, G. Graphene-based smart materials. Nat. Rev. Mater. 2017, 2, 17046. [Google Scholar] [CrossRef]
- Zhang, G.F.; Liu, X.; Zhang, S.; Pan, B.; Liu, M.L. Ciprofloxacin derivatives and their antibacterial activities. Eur. J. Med. Chem. 2018, 146, 599–612. [Google Scholar] [CrossRef]
- Gurtowska, N.; Kloskowski, T.; Drewa, T. Ciprofloxacin criteria in antimicrobial prophylaxis and bladder cancer recurrence. Med. Sci. Monit. 2010, 16, 218–223. [Google Scholar]
- Pham, T.D.M.; Ziorab, Z.M.; Blaskovich, M.A.T. Quinolone antibiotics. Med. Chem. Commun. 2019, 10, 1719–1739. [Google Scholar] [CrossRef]
- Kloskowski, T.; Gurtowska, N.; Drewa, T. Does ciprofloxacin have an obverse and a reverse? Pulm. Pharmacol. Ther. 2010, 23, 373–375. [Google Scholar] [CrossRef] [PubMed]
- Jaber, D.F.; Jallad, M.A.N.; Abdelnoor, A.M. The effect of ciprofloxacin on the growth of B16F10 melanoma cells. J. Cancer Res Ther. 2017, 13, 956–960. [Google Scholar] [PubMed]
- Kloskowski, T.; Gurtowska, N.; Nowak, M.; Joachimiak, R.; Bajek, A.; Olkowska, J.; Drewa, T. The influence of ciprofloxacin on viability of A549, HEPG2, A375.S2, B16 and C6 cell lines in vitro. Acta Pol. Pharm. 2010, 67, 345–349. [Google Scholar] [PubMed]
- Miaoa, W.; Shima, G.; Leeb, S.; Leea, S.; Choec, Y.S.; Oh, Y.K. Safety and tumor tissue accumulation of pegylated graphene oxidenanosheets for co-delivery of anticancer drug and photosensitizer. Biomaterials 2013, 34, 3402–3410. [Google Scholar] [CrossRef]
- Yang, K.; Wan, J.; Zhang, S.; Zhang, Y.; Lee, S.T.; Liu, Z. In Vivo Pharmacokinetics, Long-Term Biodistribution, and Toxicology of PEGylated Graphene in Mice. ACS Nano 2011, 1, 516–522. [Google Scholar] [CrossRef]
- Shih, C.J.; Lin, S.; Sharma, R.; Strano, M.S.; Blankschtein, V.D. Understanding the pH-Dependent Behavior of Graphene OxideAqueous Solutions: A Comparative Experimental and MolecularDynamics Simulation Study. Langmuir 2011, 28, 235–241. [Google Scholar] [CrossRef]
- Hetmann, A.; Wujak, M.; Bolibok, P.; Zięba, W.; Wiśniewski, M.; Roszek, K. Novel Biocatalytic Systems for Maintaining the Nucleotide Balance Based on Adenylate Kinase Immobilized on Carbon Nanostructures. Mat. Sci. Eng. C Mater. 2018, 88, 130–139. [Google Scholar] [CrossRef]
- Bolibok, P.; Roszek, K.; Wiśniewski, M. Graphene Oxide-Mediated Protection from Photodamage. J. Phys. Chem. Lett. 2018, 9, 3241–3244. [Google Scholar] [CrossRef]
- Aunkor, M.T.H.; Mahbubul, I.M.; Saidurb, R.; Metselaar, H.S.C. The green reduction of graphene oxide. RSC Adv. 2016, 6, 27807–27828. [Google Scholar] [CrossRef]
- Bolibok, P.; Wiśniewski, M.; Roszek, K.; Terzyk, A.P. Controlling of Enzymatic Activity by Immobilization on Graphene Oxide. Sci. Nat. 2017, 104, 36. [Google Scholar] [CrossRef] [PubMed] [Green Version]
- Gunasekaran, S.; Seshadri, S.; Muthu, S. Vibrational spectra and normal coordinate analysis of flucytosine. Indian J. Pure Appl. Phys. 2006, 44, 581–586. [Google Scholar]
- Kloskowski, T.; Maj, M.; Pokrywczyńska, M.; Bajek, A.; Nowacki, A.; Drewa, T. C153: Ciprofloxacin action against genitourinary cancer cell lines. Eur. Urol. Suppl. 2014, 13, 1336. [Google Scholar] [CrossRef]
- Thai, T.; Zito, P.M. Ciprofloxacin; StatPearls: Treasure Island, FL, USA, 2020. [Google Scholar]
- Bayer Pharmaceuticals Corporation. The Medication Guide Ciprofloxacin Hydrochlorid; FDA: Whippany, NJ, USA, 2004; Revised: 2020. [Google Scholar]
- Yang, X.; Wang, Y.; Huang, X.; Ma, Y.; Huang, Y.; Yang, R.; Duana, H.; Chen, Y. Multi-functionalized graphene oxide based anticancer drug-carrier with dual-targeting function and pH-sensitivity. J. Mater. Chem. 2011, 10, 3253–3496. [Google Scholar] [CrossRef]
- Bai, H.; Li, C.; Wangb, X.; Shi, G. A pH-sensitive graphene oxide composite hydrogel. Chem. Commun. 2010, 14, 2376–2378. [Google Scholar] [CrossRef] [PubMed]
- Huang, T.; Zhang, L.; Chen, H.; Gao, C. A cross-linking graphene oxide–polyethyleneimine hybrid film containing ciprofloxacin: One-step preparation, controlled drug release and antibacterial performance. J. Mater. Chem. B 2015, 8, 1605–1611. [Google Scholar] [CrossRef]
- Tyagia, N.; Attiaac, N.F.; Geckeler, K.E. Exfoliated graphene nanosheets: pH-sensitive drug carrier and anti-cancer activity. J. Colloid Interface Sci. 2017, 498, 364–377. [Google Scholar] [CrossRef]
- Changa, Y.; Yanga, S.T.; Liu, J.H.; Donga, E.; Wanga, Y.; Caoa, A.; Liu, Y.; Wang, H. In vitro toxicity evaluation of graphene oxide on A549 cells. Toxicol. Lett. 2011, 200, 201–210. [Google Scholar] [CrossRef]
- Seabra, A.B.; Paula, A.J.; de Lima, R.; Alves, O.L.; Durán, N. Nanotoxicity of graphene and graphene oxide. Chem. Res. Toxicol. 2014, 27, 159–168. [Google Scholar] [CrossRef]
- Wu, X.; Lu, Z.H. Nanoparticle–Tissue Interaction. In Nanomaterials in Pharmacology; Sakuma, S., Lu, Z.-R., Eds.; Humana Press: New York, NY, USA, 2016; Volume 10, pp. 201–218. [Google Scholar]
- Su, H.; Wang, Y.; Gu, Y.; Bowman, L.; Zhao, J.; Ding, M. Potential applications and human biosafety of nanomaterials used in nanomedicine. J. Appl. Toxicol. 2018, 38, 3–24. [Google Scholar] [CrossRef]
- Qua, Y.; He, F.; Yu, C.; Lianga, X.; Liang, D.; Ma, L.; Zhang, Q.; Lv, J.; Wu, J. Advances on graphene-based nanomaterials for biomedical applications. Mat. Sci. Eng. C Mater. 2018, 10, 764–780. [Google Scholar] [CrossRef] [PubMed]
- Liu, J.H.; Yang, S.T.; Wang, H.; Chang, Y.; Cao, A.; Liu, Y. Effect of size and dose on the biodistribution of graphene oxide in mice. Nanomedicine 2012, 7, 1801–1812. [Google Scholar] [CrossRef] [PubMed]
- Jasim, D.A.; Ménard-Moyon, C.; Bégin, D.; Bianco, D.; Kostarelos, K. Tissue distribution and urinary excretion of intravenously administered chemically functionalized graphene oxide sheets. Chem. Sci. 2015, 6, 3952–3964. [Google Scholar] [CrossRef] [PubMed] [Green Version]
- Wen, K.P.; Chen, Y.C.; Chuang, C.H.; Chang, H.Y.; Lee, C.Y.; Tai, N.Y. Accumulation and toxicity of intravenously-injected functionalized graphene oxide in mice. J. Appl. Toxicol. 2015, 35, 1211–1218. [Google Scholar] [CrossRef]
- Jarosz, A.; Skoda, M.; Dudek, I.; Szukiewicz, D. Oxidative Stress and Mitochondrial Activation as the Main Mechanisms Underlying Graphene Toxicity against Human Cancer Cells. Oxidative Med. Cell. Longev. 2016, 2016, 5851035. [Google Scholar] [CrossRef] [Green Version]
- Mu, Q.; Su, G.; Li, L.; Gilbertson, B.O.; Yu, L.H.; Zhang, Q.; Sun, Y.P.; Yan, B. Size-dependent cell uptake of protein-coated graphene oxide nanosheets. ACS Appl. Mater. Interfaces 2012, 4, 2259–2266. [Google Scholar] [CrossRef]
- Jaworski, S.; Sawosz, E.; Kutwin, M.; Wierzbicki, M.; Hinzmann, M.; Grodzik, M.; Winnicka, A.; Lipińska, L.; Włodyga, K.; Chwalibog, A. In vitro and in vivo effects of graphene oxide and reduced graphene oxide on glioblastoma. Int. J. Nanomed. 2015, 10, 1585–1596. [Google Scholar]
- Matesanz, M.C.; Vila, M.; Feito, M.J.; Linares, J.; Gonçalves, G.; Vallet-Regi, M.; Marques, P.A.; Portolés, M.T. The effects of graphene oxide nanosheets localized on F-actin filaments on cell-cycle alterations. Biomaterials 2013, 34, 1562–1569. [Google Scholar] [CrossRef]
- Tang, Z.; Zhao, L.; Yang, Z.; Liu, Z.; Gu, J.; Bai, B.; Liu, J.; Xu, J.; Yang, H. Mechanisms of oxidative stress, apoptosis, and autophagy involved in graphene oxide nanomaterial anti-osteosarcoma effect. Int. J. Nanomed. 2018, 13, 2907–2919. [Google Scholar] [CrossRef] [Green Version]
- De, L.M.; Ottaviano, L.; Perrozzi, F.; Nardone, M.; Santucci, S.; De, J.L.; Borras, M.; Treossi, E.; Palermo, V.; Poma, A. Flake size-dependent cyto and genotoxic evaluation of graphene oxide on in vitro A549, CaCo2 and vero cell lines. J. Biol. Regul. Homeost. Agents 2014, 28, 281–289. [Google Scholar]
- Eroğlu, I.; İbrahim, M. Liposome–ligand conjugates: A review on the current state of art. J. Drug Target 2020, 28, 225–244. [Google Scholar] [CrossRef] [PubMed]
- Gabizon, A.A.; Shmeeda, H.; Zalipsky, S. Corporation Pros and Cons of the Liposome Platform in Cancer Drug Targeting. J. Liposome Res. 2006, 16, 175–183. [Google Scholar] [CrossRef] [PubMed]
- Barenholz, Y. Liposome application: Problems and prospects. Curr. Opin. Colloid Interface Sci. 2001, 6, 66–77. [Google Scholar] [CrossRef]
- Prasad, R.; Yadav, A.S.; Gorain, M.; Chauhan, D.S.; Kundu, G.C.; Srivastava, R.; Selvaraj, K. Graphene Oxide Supported Liposomes as Red Emissive Theranostics for Phototriggered Tissue Visualization and Tumor Regression. ACS Appl. Bio Mater. 2019, 2, 3312–3320. [Google Scholar] [CrossRef]
- Frost, R.; Jönsson, G.E.; Chakarov, D.; Svedhem, S.; Kasemo, B. Graphene Oxide and Lipid Membranes: Interactions and Nanocomposite Structures. Nano Lett. 2012, 12, 3356–3362. [Google Scholar] [CrossRef]


| 786-0 | T24 | |||
|---|---|---|---|---|
| 24 h | 72 h | 24 h | 72 h | |
| Control | 7.80 ± 0.01 | 7.53 ± 0.01 | 7.90 ±0.05 | 7.94 ± 0.01 |
| GO 100 μg/mL | 7.91 ± 0.01 | 7.50 ± 0.01 | 8.00 ± 0.02 | 8.10 ± 0.01 |
| GO 500 μg/mL | 7.90 ± 0.01 | 7.59 ± 0.01 | 7.95 ± 0.03 | 8.09 ± 0.01 |
| CGO 10 μM | 7.87 ± 0.02 | 7.45 ± 0.01 | 7.96 ± 0.01 | 8.01 ± 0.01 |
| CGO 100 μM | 7.90 ± 0.01 | 7.51 ± 0.01 | 7.95 ± 0.02 | 8.11 ± 0.01 |
| CGO 500 μM | 7.77 ± 0.01 | 7.56 ± 0.02 | 7.88 ± 0.01 | 8.23 ± 0.02 |
| CIP 10 μM | 7.87 ± 0.01 | 7.38 ± 0.01 | 7.98 ± 0.03 | 7.95 ± 0.01 |
| CIP 100 μM | 7.81 ± 0.01 | 7.52 ± 0.01 | 8.01 ± 0.01 | 8.12 ± 0.02 |
| CIP 500 μM | 7.91 ± 0.01 | 7.70 ± 0.01 | 7.99 ± 0.01 | 8.46 ± 0.03 |
© 2020 by the authors. Licensee MDPI, Basel, Switzerland. This article is an open access article distributed under the terms and conditions of the Creative Commons Attribution (CC BY) license (http://creativecommons.org/licenses/by/4.0/).
Share and Cite
Matulewicz, K.; Kaźmierski, Ł.; Wiśniewski, M.; Roszkowski, S.; Roszkowski, K.; Kowalczyk, O.; Roy, A.; Tylkowski, B.; Bajek, A. Ciprofloxacin and Graphene Oxide Combination—New Face of a Known Drug. Materials 2020, 13, 4224. https://doi.org/10.3390/ma13194224
Matulewicz K, Kaźmierski Ł, Wiśniewski M, Roszkowski S, Roszkowski K, Kowalczyk O, Roy A, Tylkowski B, Bajek A. Ciprofloxacin and Graphene Oxide Combination—New Face of a Known Drug. Materials. 2020; 13(19):4224. https://doi.org/10.3390/ma13194224
Chicago/Turabian StyleMatulewicz, Karolina, Łukasz Kaźmierski, Marek Wiśniewski, Szymon Roszkowski, Krzysztof Roszkowski, Oliwia Kowalczyk, Archi Roy, Bartosz Tylkowski, and Anna Bajek. 2020. "Ciprofloxacin and Graphene Oxide Combination—New Face of a Known Drug" Materials 13, no. 19: 4224. https://doi.org/10.3390/ma13194224