3.1. Production of PHBV and Properties of PHB, PHBV-1, and PHBV-2 Scaffolds
PHB was obtained as a commercial product, and PHBV was produced by biosynthesis in a laboratory 2-L bioreactor. Two kinds of PHBV were prepared: (1) PHBV-1 was produced by the cultivation of
C. necator on fructose and valeric acid, and (2) PHBV-2 was obtained by using grape sugar extract and valeric acid as carbon sources. Grape pomace is a cheap and abundant by-product of wine production. It is a lignocellulosic material with a high content of residual sugars, in particular glucose and fructose. In this work, we prepared grape sugar extract from grape pomace by enzymatic hydrolysis and used it as a carbon source for the cultivation of
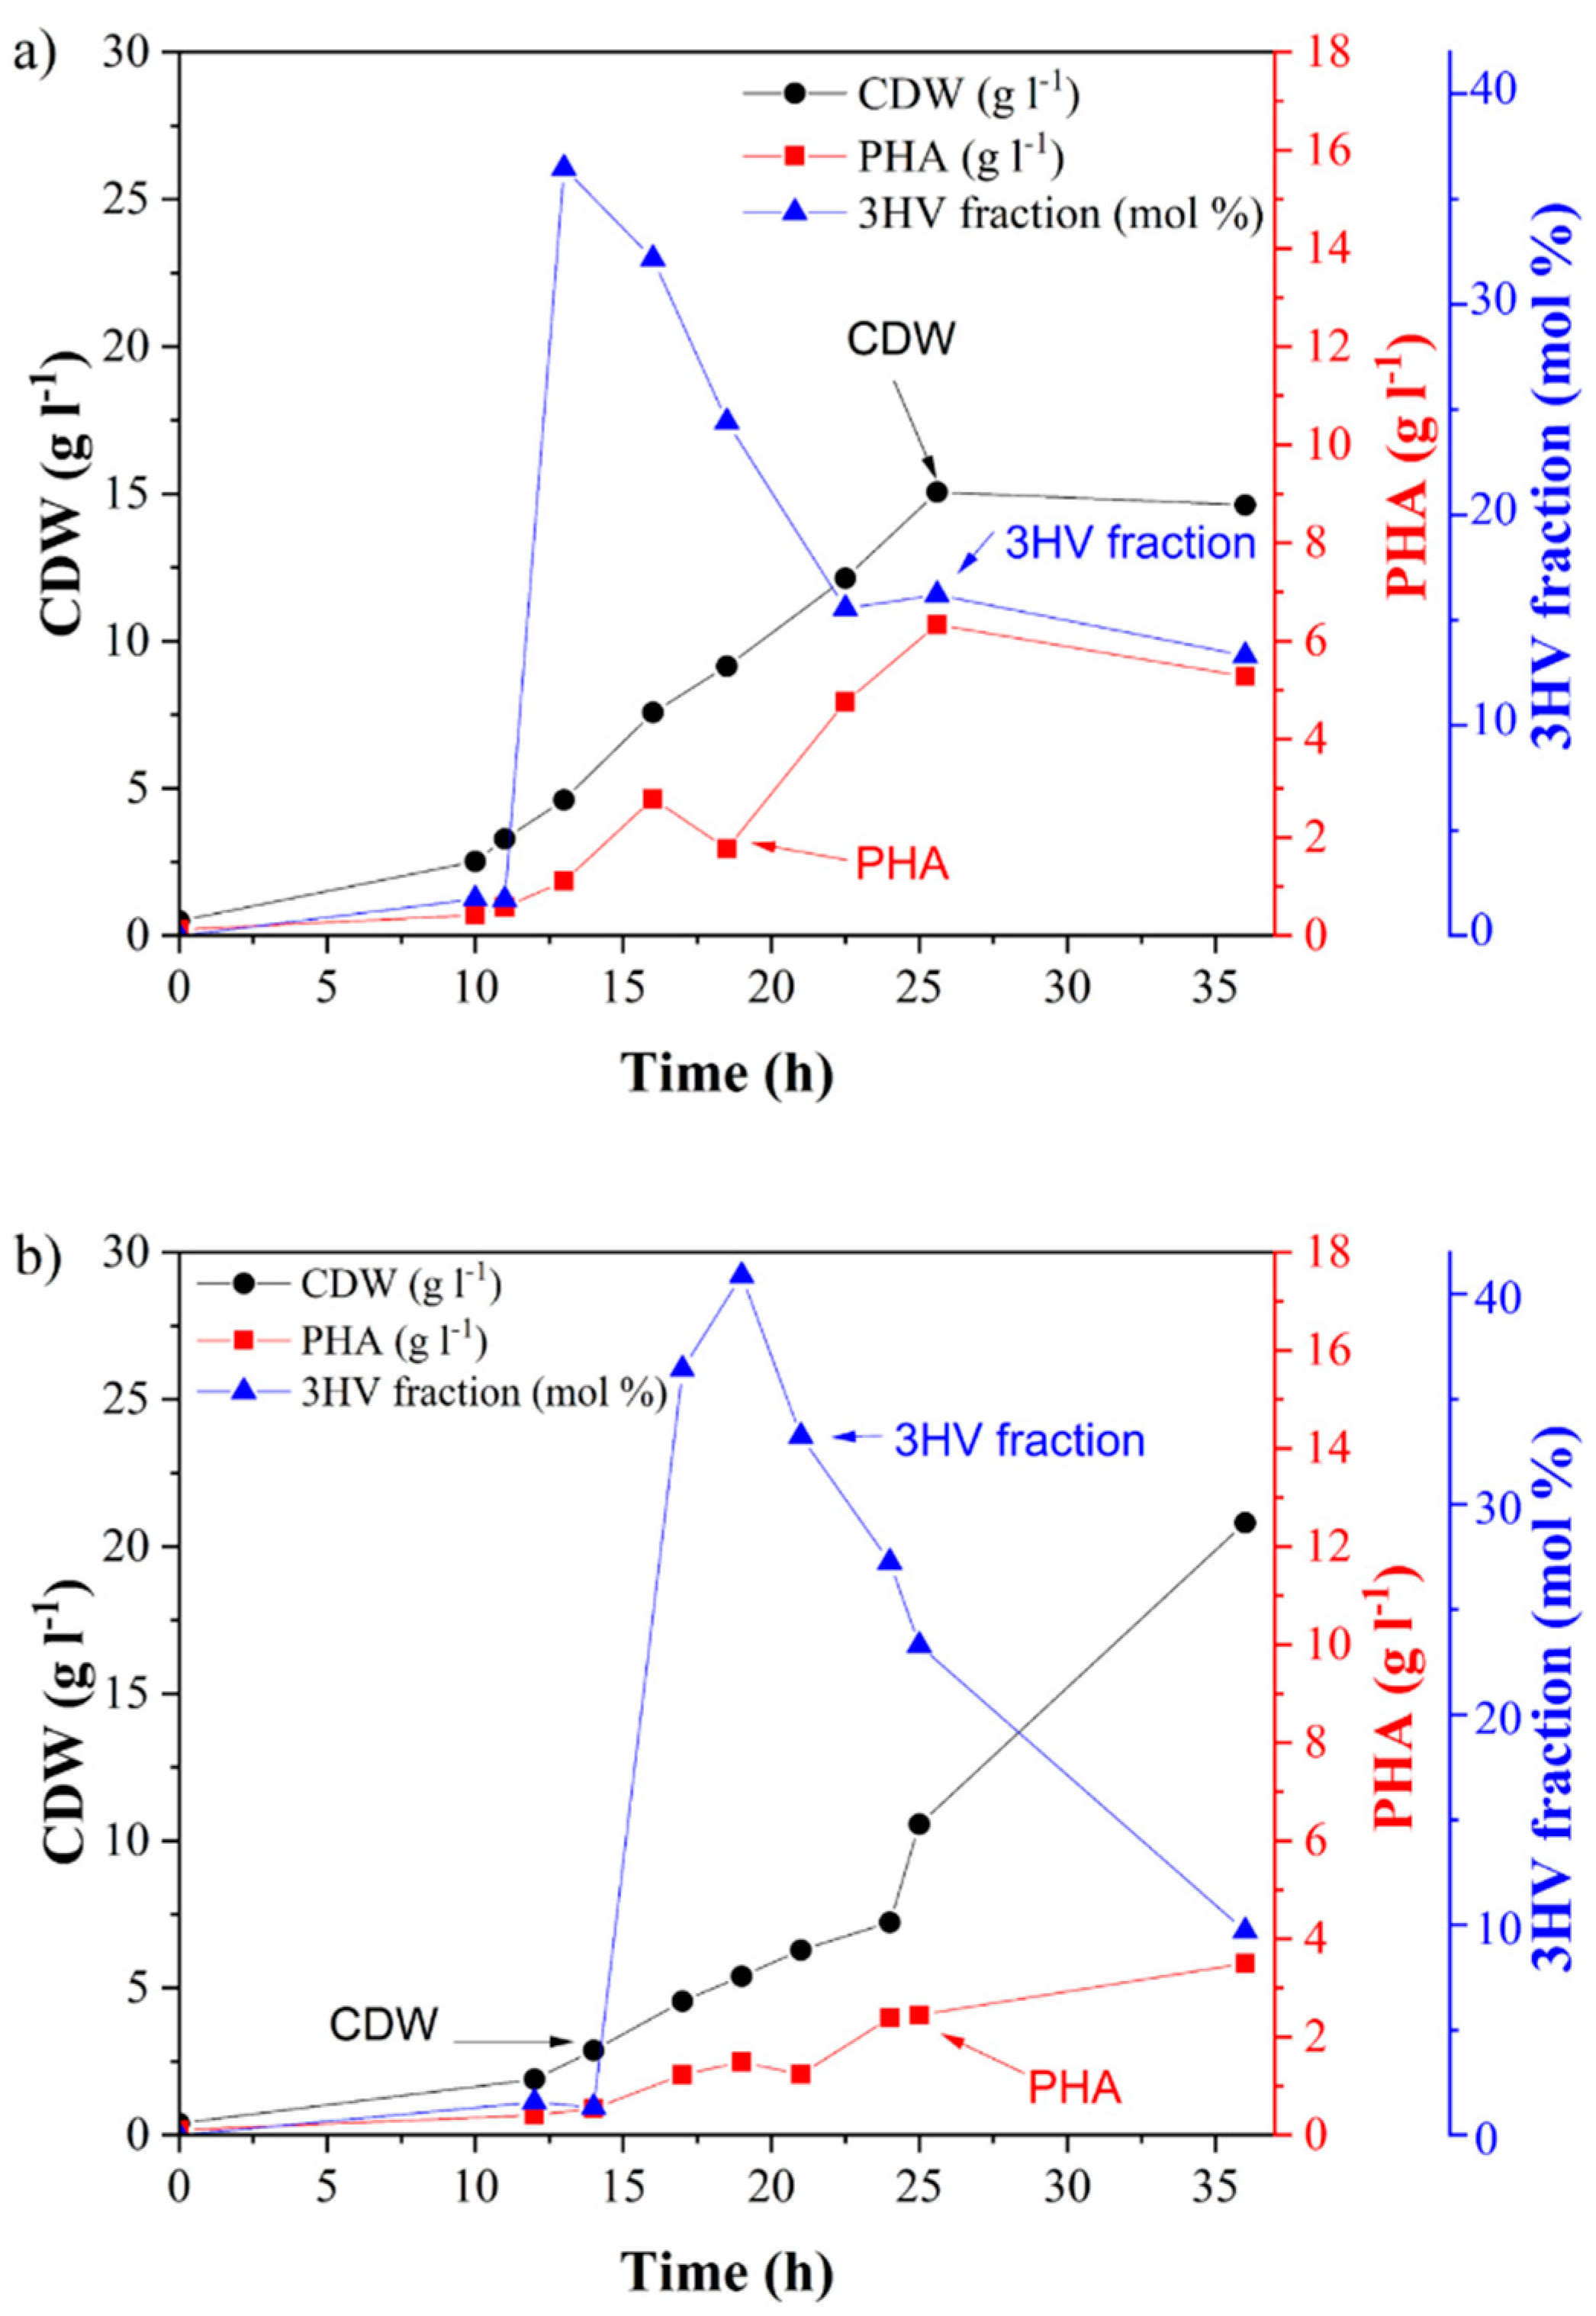
C. necator. PHBV synthesis was supported by the addition of valeric acid as a precursor. The courses of both fermentations are shown in
Figure 1. In both cases, PHBV was accumulated in the biomass. The obtained biomass and PHBV-1 titers were 14.6 and 5.3 g L
−1, respectively, when pure fructose was used as a substrate. The content of the 3-hydroxyvalerate fraction (3HV) in PHBV-1 was 13.3 mol %. Interestingly, when the using grape sugar extract, the concentration of biomass yields markedly increased. Still, the accumulated PHA content was substantially lower than in the case of using fructose as the substrate (
Table 1). The final PHA concentration in PHBV-2 was 3.5 g L
−1 with a 9.7 mol % 3HV fraction. This indicates that grape pomace contained substances that supported the growth of the bacterium’s growth without the necessity to accumulate PHAs. It is likely that some nitrogen-rich compounds (such as proteins or peptides) present in the grape pomace extract supported biomass growth but suppressed PHA biosynthesis since it is well known that PHA synthesis is stimulated by nitrogen limitation in
C. necator [
31]. It should be pointed out that the final molar fraction of 3HV was comparable in both copolymers: 13.3% in PHBV-1 and 9.7% in PHBV-2.
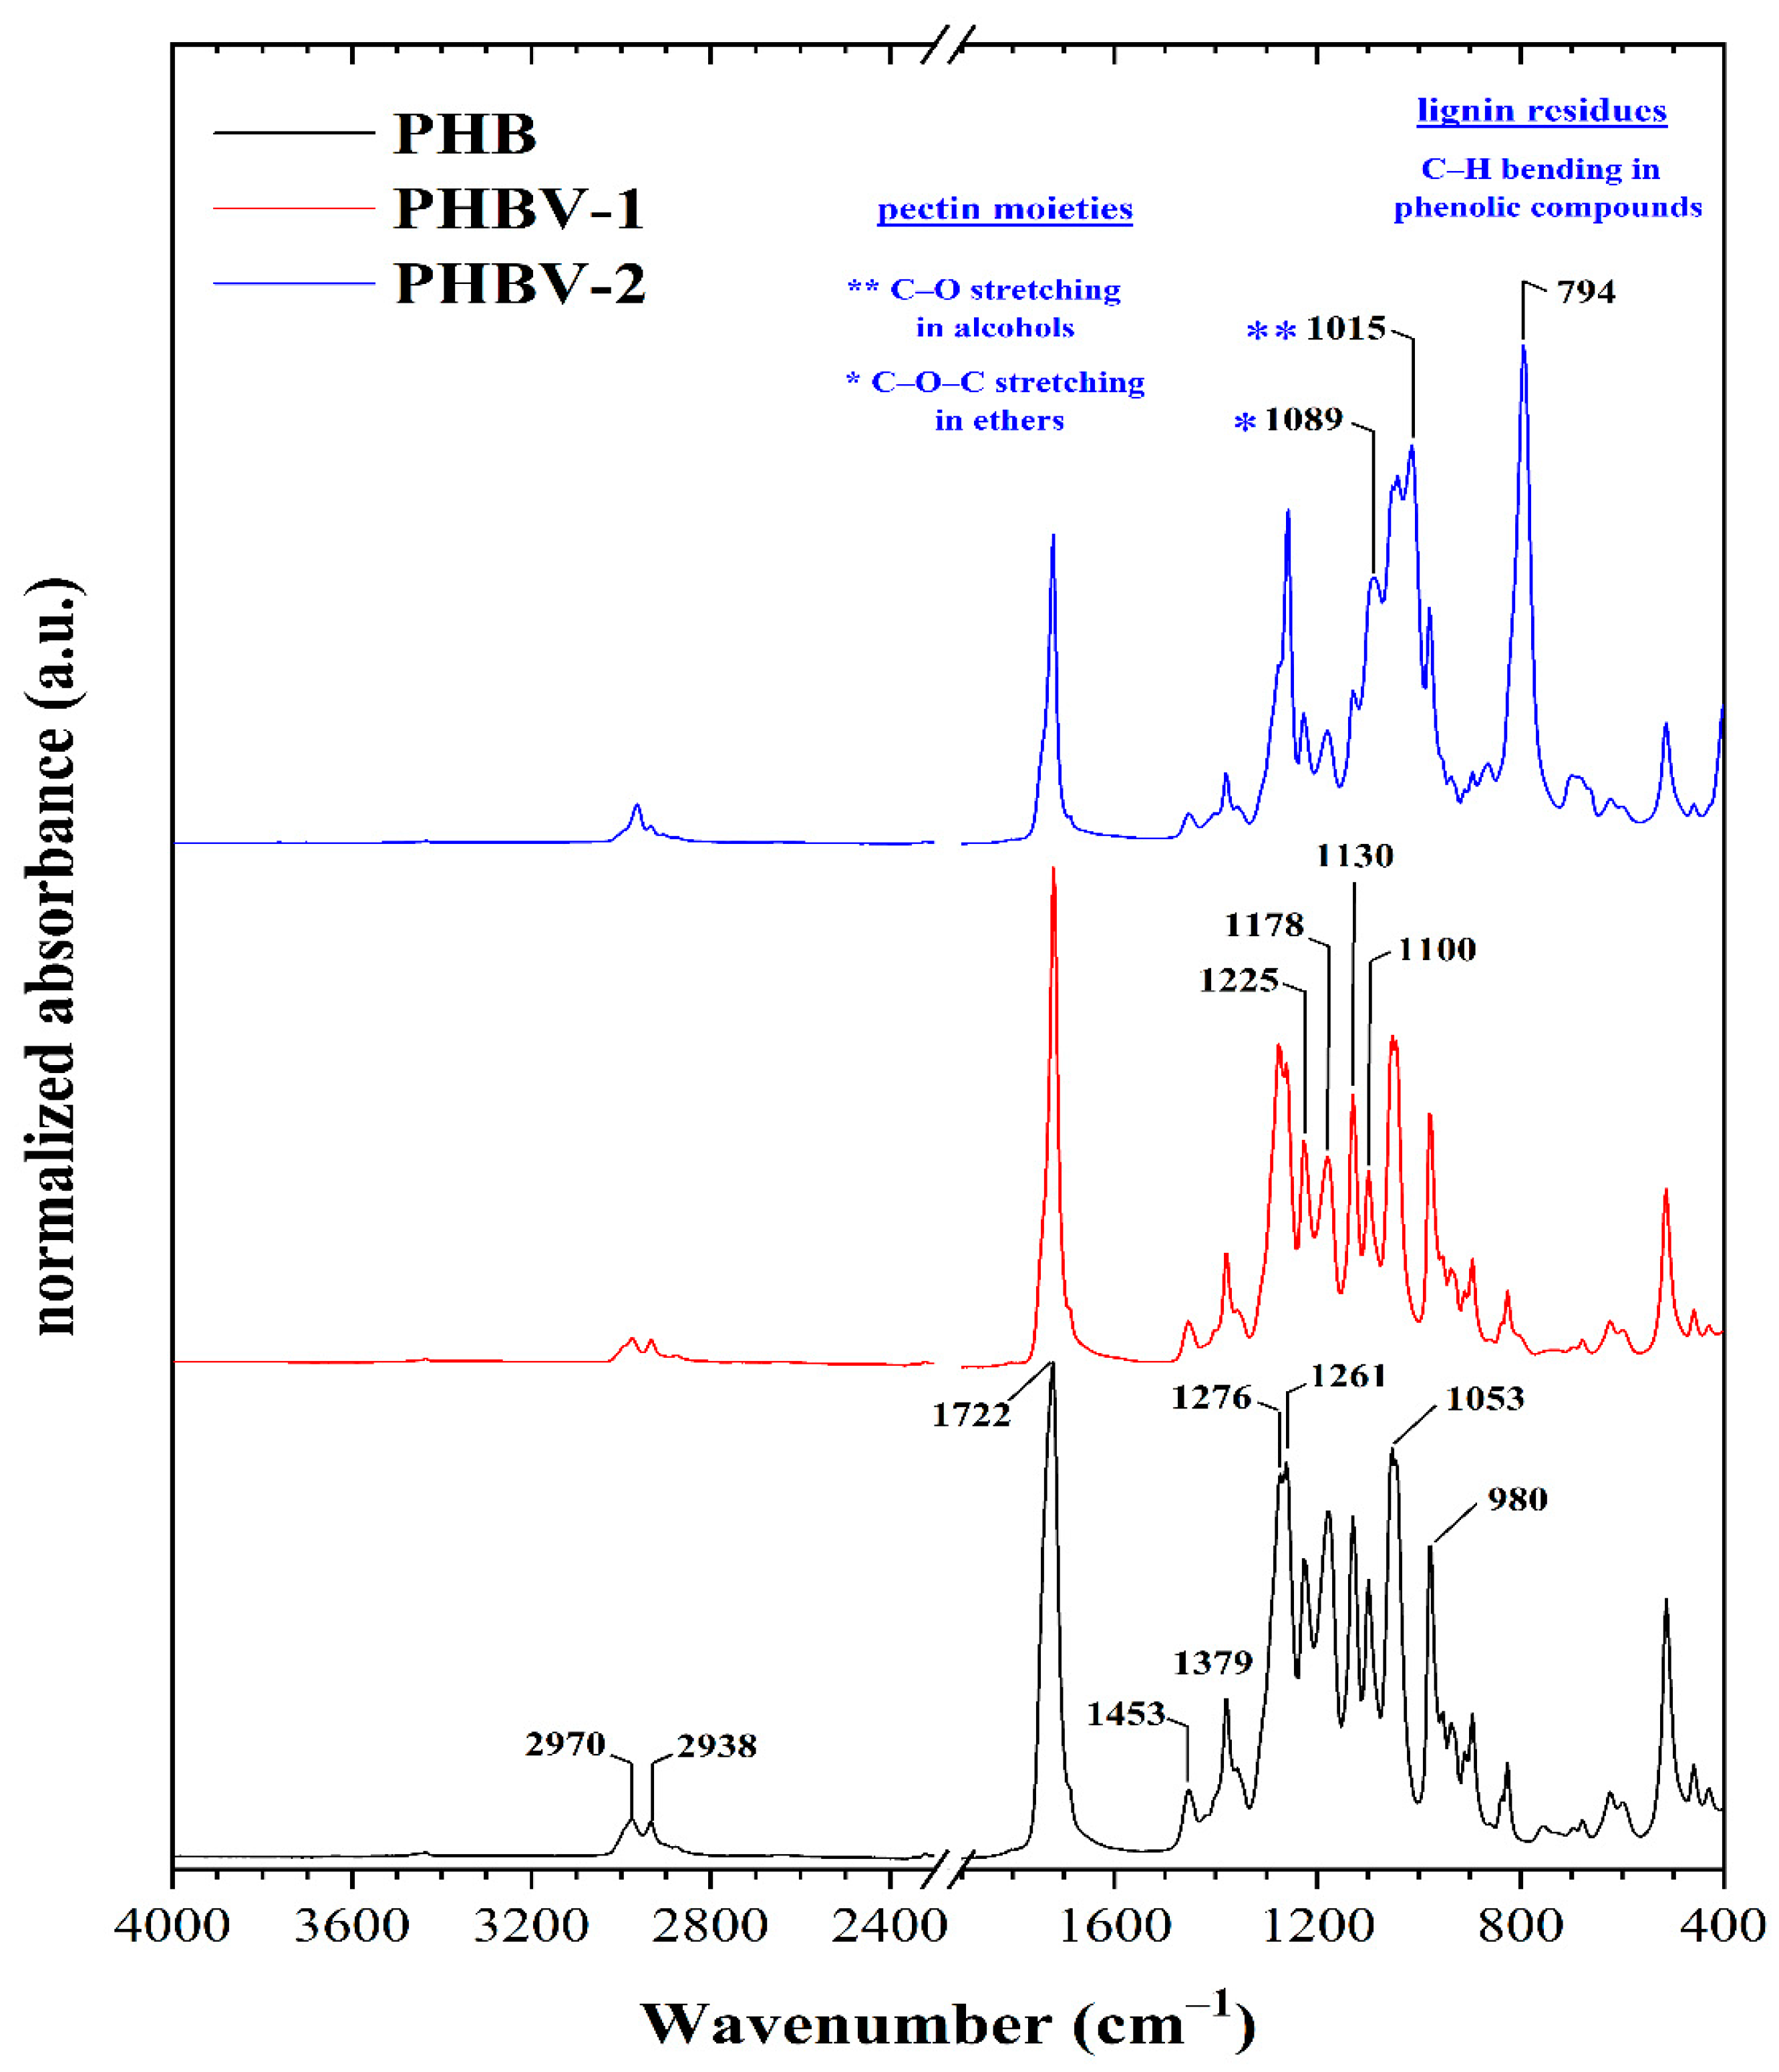
Both materials, PHBV-1 and PHBV-2, were extracted from biomass and, along with commercial PHB, further characterized, and used for scaffold preparation. The ATR-FTIR technique was used for a more profound structural characterization of the synthesized PHB and PHBV copolymers. The ATR-FTIR spectra of the PHB and PHBV copolymers are presented in
Figure 2, and the interpretation of their absorption bands was conducted according to literature data [
32,
33,
34,
35,
36,
37]. The attribution of the significant infrared peaks of the PHB and its copolymers (i.e., PHBV-1 and PHBV-2) that were observed in the ATR spectra are presented in
Table 2.
The spectra of all samples showed several standard spectral features. One of these was represented by a sharp absorption band with variable intensity at around ~1722 cm
−1, attributed to symmetric C=O stretching in aliphatic esters. The presence of aliphatic ester groups were usually also manifested by sharp and intensive bands centered at about ~1261 cm
−1 and ~1053 cm
−1 that resulted from C–O and C–C–O stretching vibrations mode. Moreover, the presence of these functional groups was revealed by a sharp band at 1178 cm
−1 ascribed to the C–O–C stretching of saturated alkyl-esters. A band at about 1225 cm
−1, preferentially attributed to the C–O stretching of the aliphatic ester was more apparent in the PHB sample. Furthermore, the absorption band located at 1100 cm
−1 was attributed to the stretching vibration of the O–C–C moieties [
33]. The presence of the esters’ functional groups was confirmed by the bands at 980 cm
−1 that could be assigned to the stretching C–O–C groups.
The absorption bands at about 1722, 1276, 1225, and 980 cm
−1 were assigned to the stretching vibration of the crystalline phase of PHB and its copolymers. On the other hand, the amorphous phase in the samples was indicated by the bands centered at about 1178 and 1130 cm
−1 resulting from the asymmetric and symmetric stretching vibrations of the C–O–C groups [
33]. The degree of the crystalline phase that is known as the crystallinity index was determined using the
IC–O/
I–CH2– ratio (the ratio of the intensity at 1225 cm
−1 to the intensity at 1453 cm
−1). The value of this ratio (
Table 3) was lowest for the PHBV-2 copolymer. The intensity ratio showed that the relative content of the amorphous phase’s relevant content was highest for PHBV-2 (i.e., most moderate content of crystalline phase), whereas that of the PHB sample was the lowest. In other words, the PHB sample was characterized by a higher crystallinity of the scaffold. Furthermore, this calculated index suggested that PHBV-1 was characterized by a slightly higher content of the crystalline phase compared to the second copolymer.
Both PHB and PHBV-1 showed the presence of aliphatic hydrocarbons in the range of 3000–2800 cm−1 and 1480 –1300 cm−1. The intense band at 2970 cm−1 and the weak band at 2938 cm−1 indicate asymmetric and symmetric C–H stretching of the methyl groups. Two C–H deformation bands were found in the second region. Similarly, the bands at 1453 cm−1 and 1379 cm−1 belong to the asymmetric and symmetric stretching of the –CH2– and –CH3 groups. The relative content of aliphatic hydrocarbons was similar in all the samples.
The spectra confirmed that PHBV copolymers were produced. However, the composition of PHBV-2 differed slightly from PHBV-1. These differences were mainly visible in the fingerprint region in the range of 1100–700 cm
−1. Aside from the already discussed ester groups, the presence of additional oxygen-containing functional groups could also be derived from the ATR spectra. In addition to the characteristic PHBV absorption bands, it seems that pectin and phenolics residues absorption bands appeared. The bands at 1089 and 1015 cm
−1 indicated pectin moieties. These were attributed to the C–O–C stretching in ethers and to the C–O stretching of primary alcohols. Furthermore, the spectrum of PHBV-2 contained a sharp and intensive absorption band at 794 cm
−1 corresponding to the C–H bending in phenolic compounds [
38]. Therefore, it can be concluded that the composition of PHBV-2 was modified by these substances from grape pomace co-isolated from the biomass.
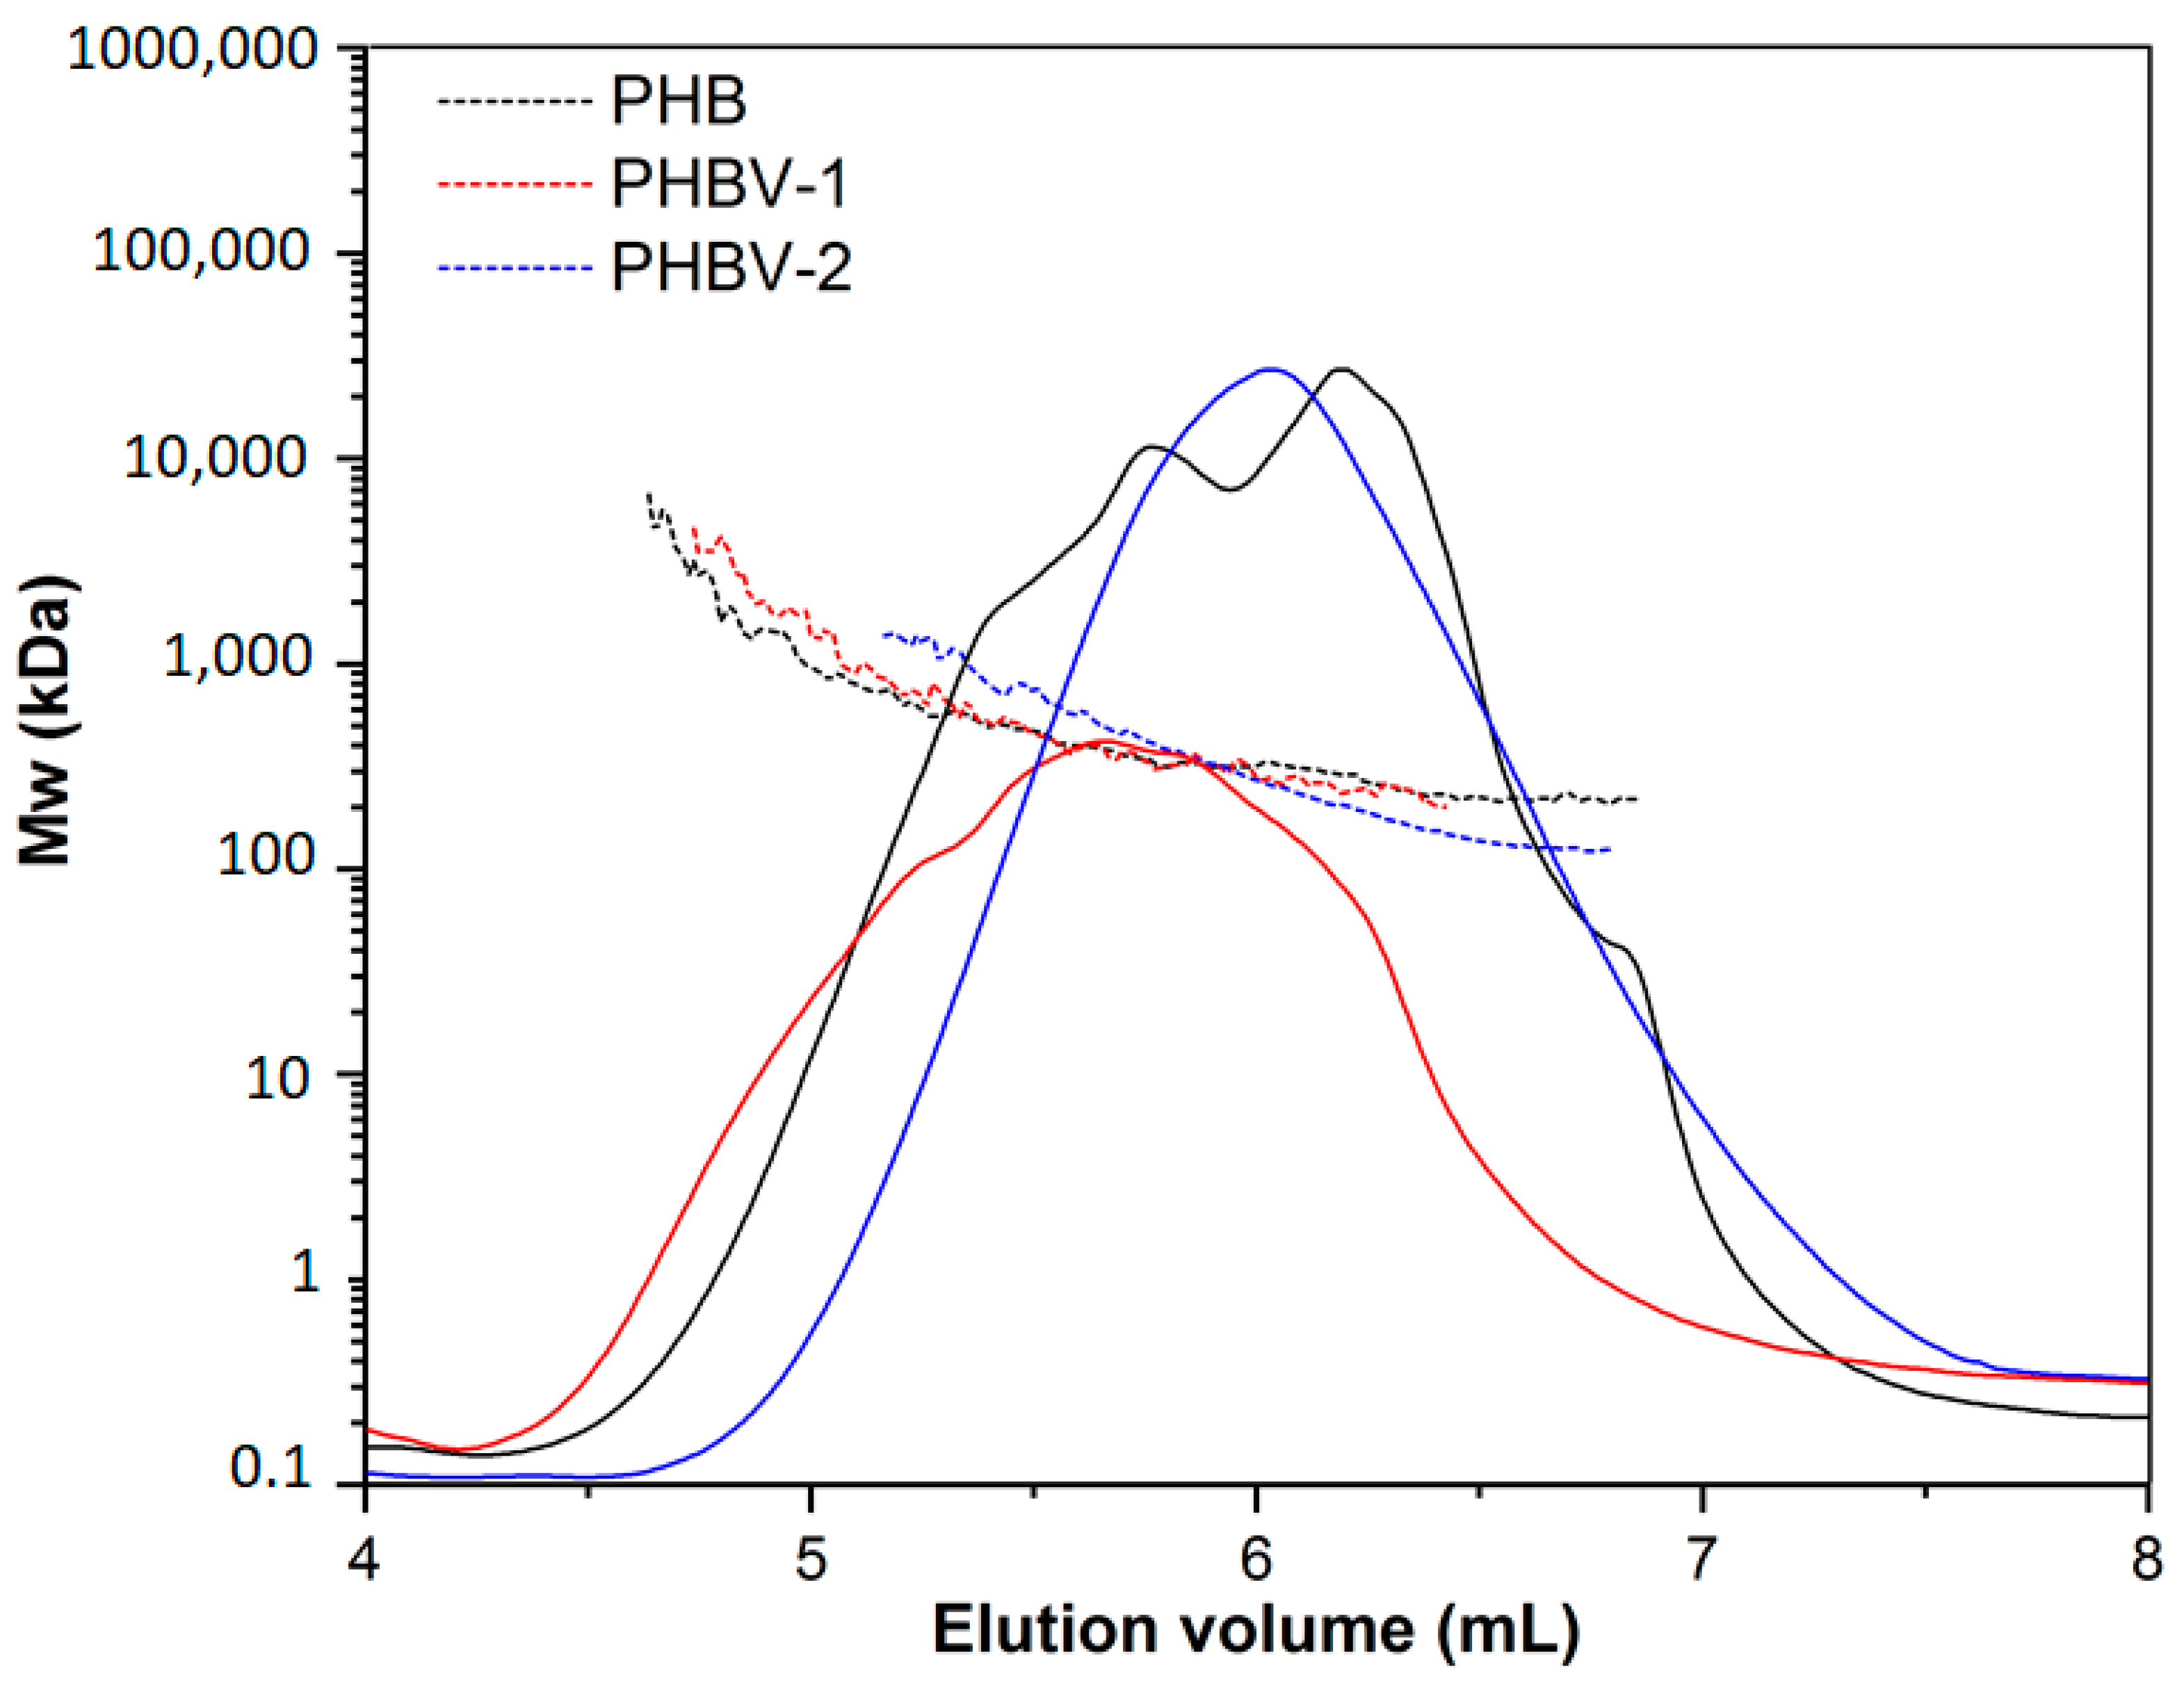
SEC-MALLS was used as a general technique for the routine characterization of molecular weight, molecular size, and polydispersity of the used PHA. SEC-MALLS chromatograms are shown in
Figure 3. The molecular weight values of the tested polymers were in the following order: PHBV-1 (Mw = 517 ± 11.08,
Đ = 1.1) > PHB (Mw = 480 ± 4.22,
Đ = 1.5) > PHBV-2 (Mw = 235 ± 5.33,
Đ = 1.3). Small differences in the molecular weights of PHB and PHBV-1 did not indicate any particular differences in the degradation of these two polymers. However, the molecular weight of PHV-2 was much lower than that of PHB and PHBV-1. Therefore, the degradation of PHBV-2 in model fluids could be expected to proceed differently.
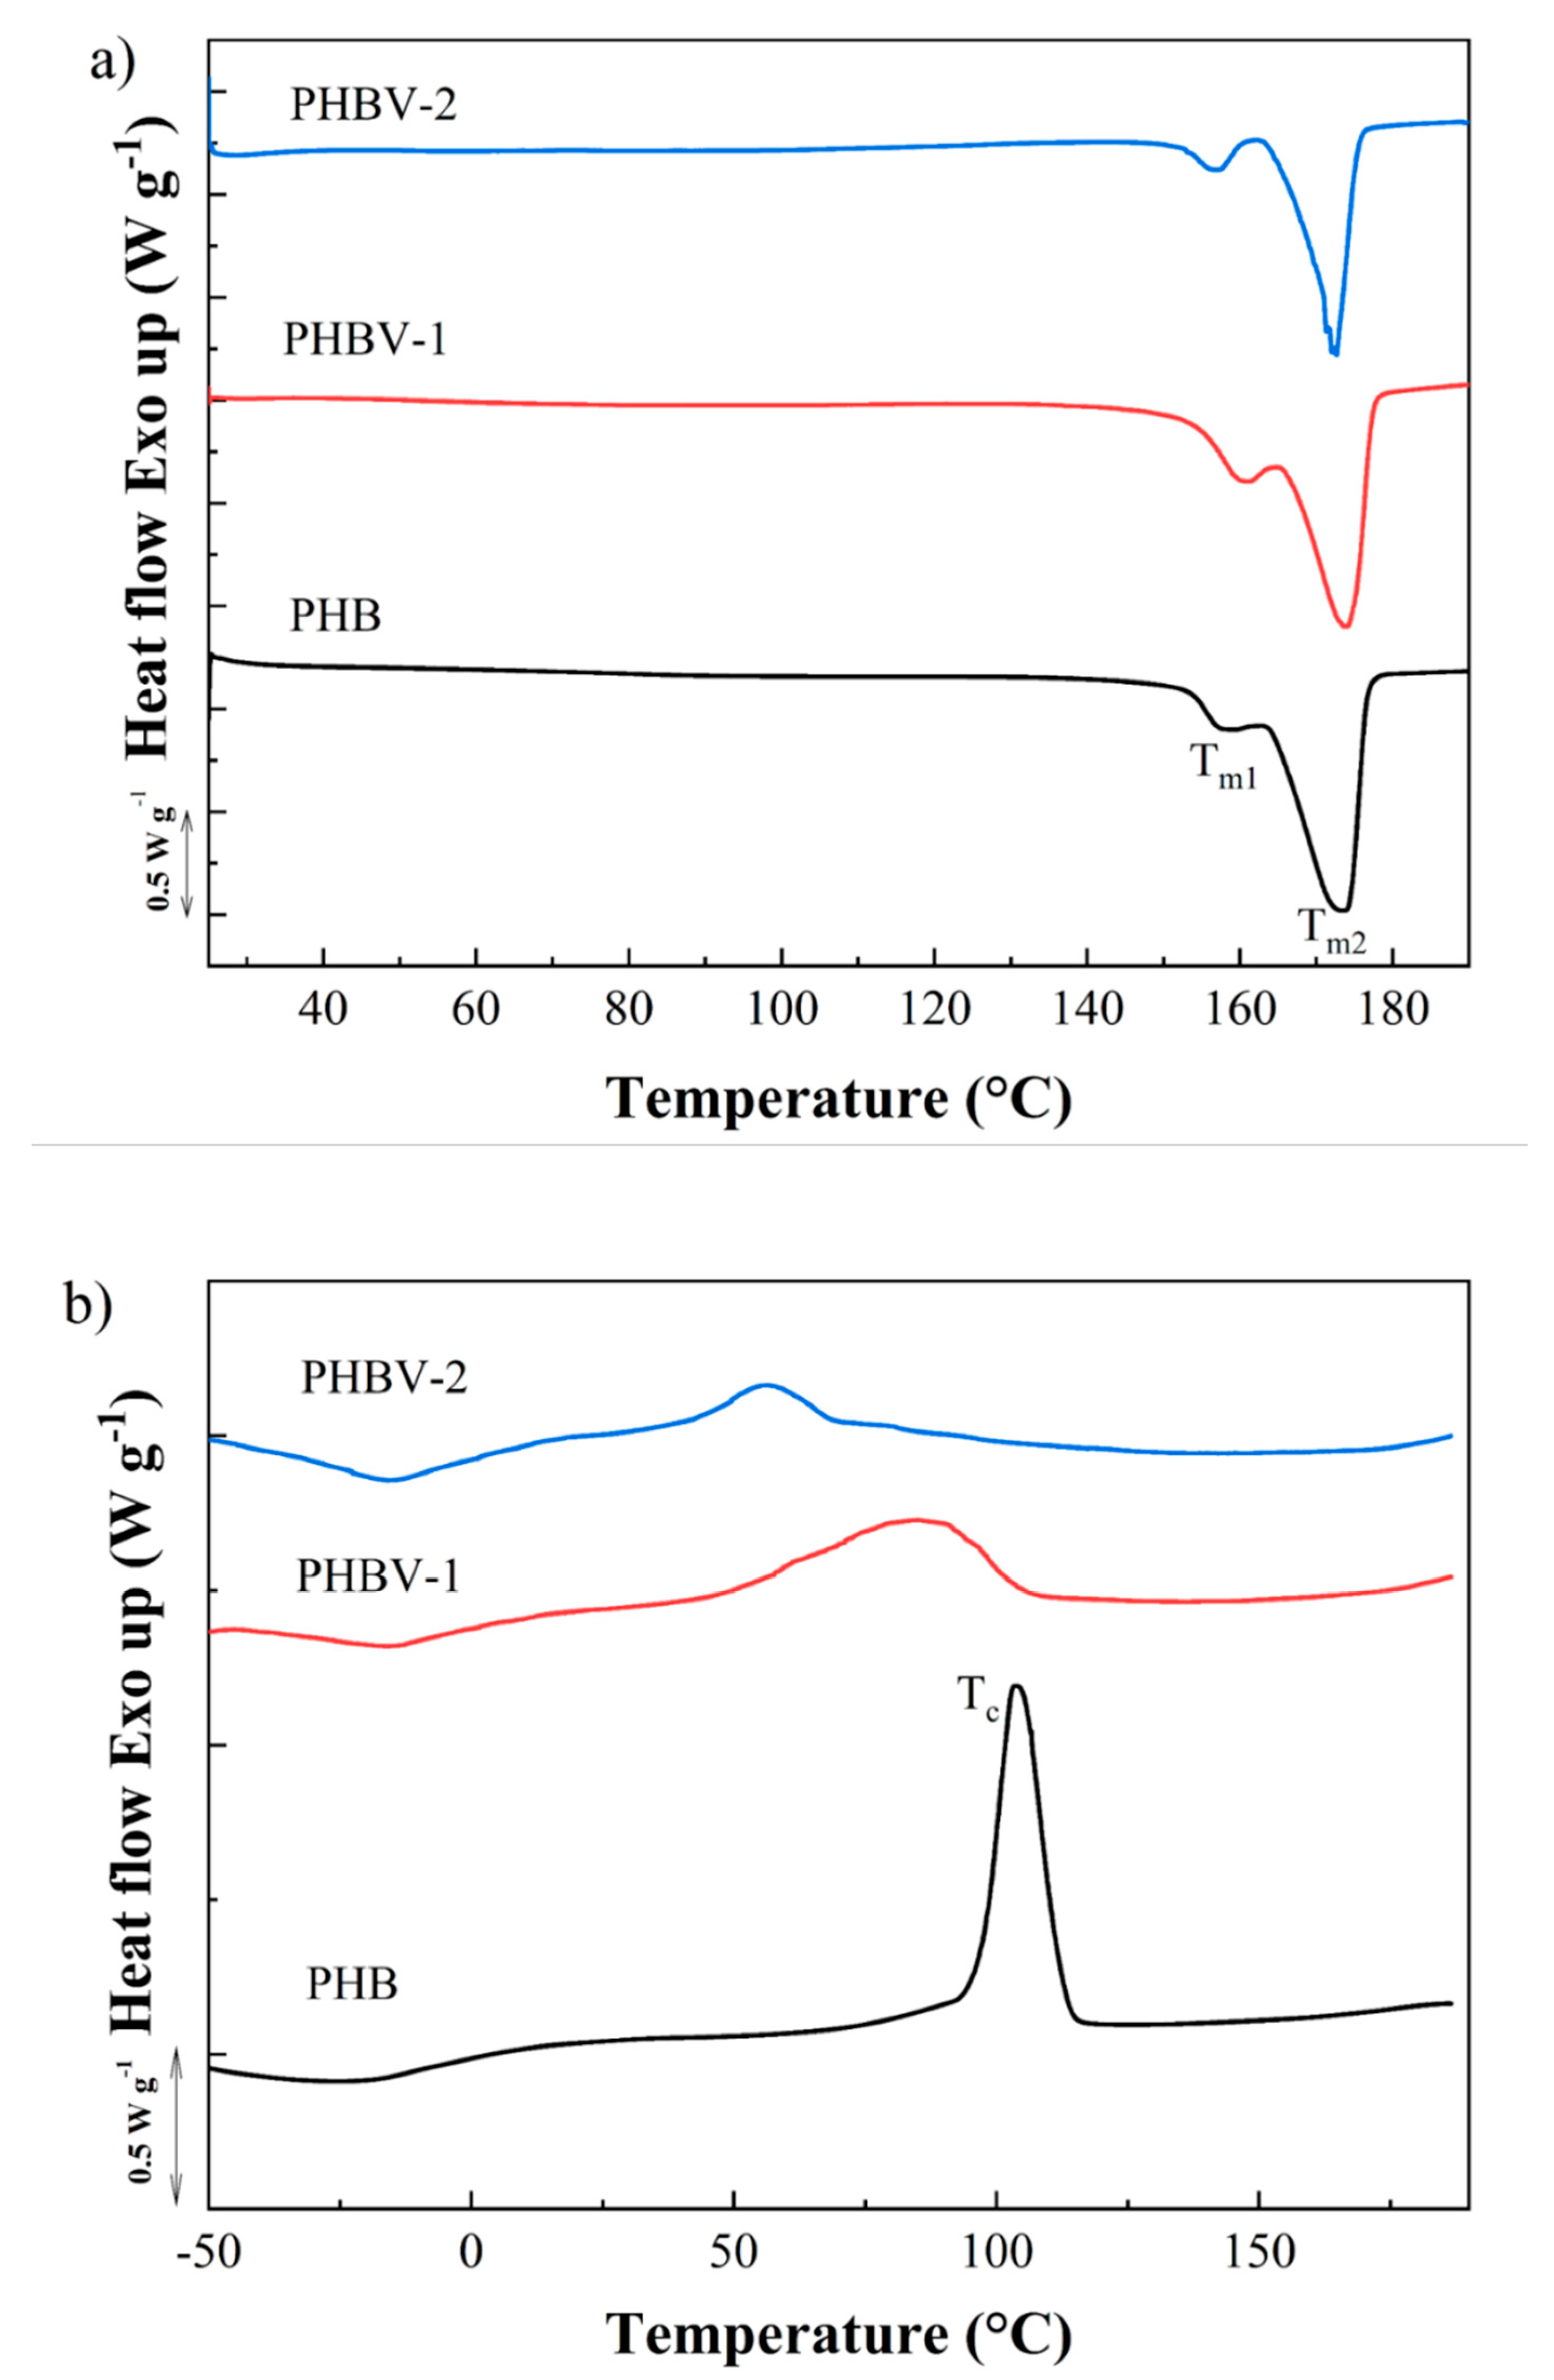
The melting and crystallization behavior of PHB, PHBV-1, andPHBV-2, were studied by DSC (
Figure 4). First, heating scans obtained at the rate of 10 °C min
−1 showed double melting behavior for all tested PHAs (
Figure 4a). Two melting peaks at approximately 163 and 173 °C indicated the presence of crystals with different temperature stabilities, the form of which may be explained by the double lamellar thickness population model [
39]. The values of melting enthalpy were detected as follows: PHBV-1 (ΔH
m = 81.7 J g
−1) > PHB (ΔH
m = 76.3 J g
−1) > PHBV-2 (ΔH
m = 45.6 J g
−1). The crystallinity degree presented by PHBV-2 was about 40.2–44.2% lower compared to those detected for PHB and PHBV-2. These results indicated that impurities co-isolated with the PHBV-2 copolymer decreased the crystallinity of the materials. The crystallization kinetics of PHBV-1 and PHBV-2 after melting for both copolymers differed in comparison to the PHB polymer. The crystallization peak for PHB was clearly detected at 103.7 °C with ΔH
c = 74.7 J g
−1. PHBV-1 displayed the crystallization peak at a much lower temperature compared to PHB. Moreover, the large peak indicated slower crystallization kinetics (T
c = 85.0 °C and ΔH
c = 57.4 J g
−1). The crystallization of PHBV-2 was even more delayed, showing the crystallization peak at 56.4 °C with ΔH
c = 46.5 J g
−1.
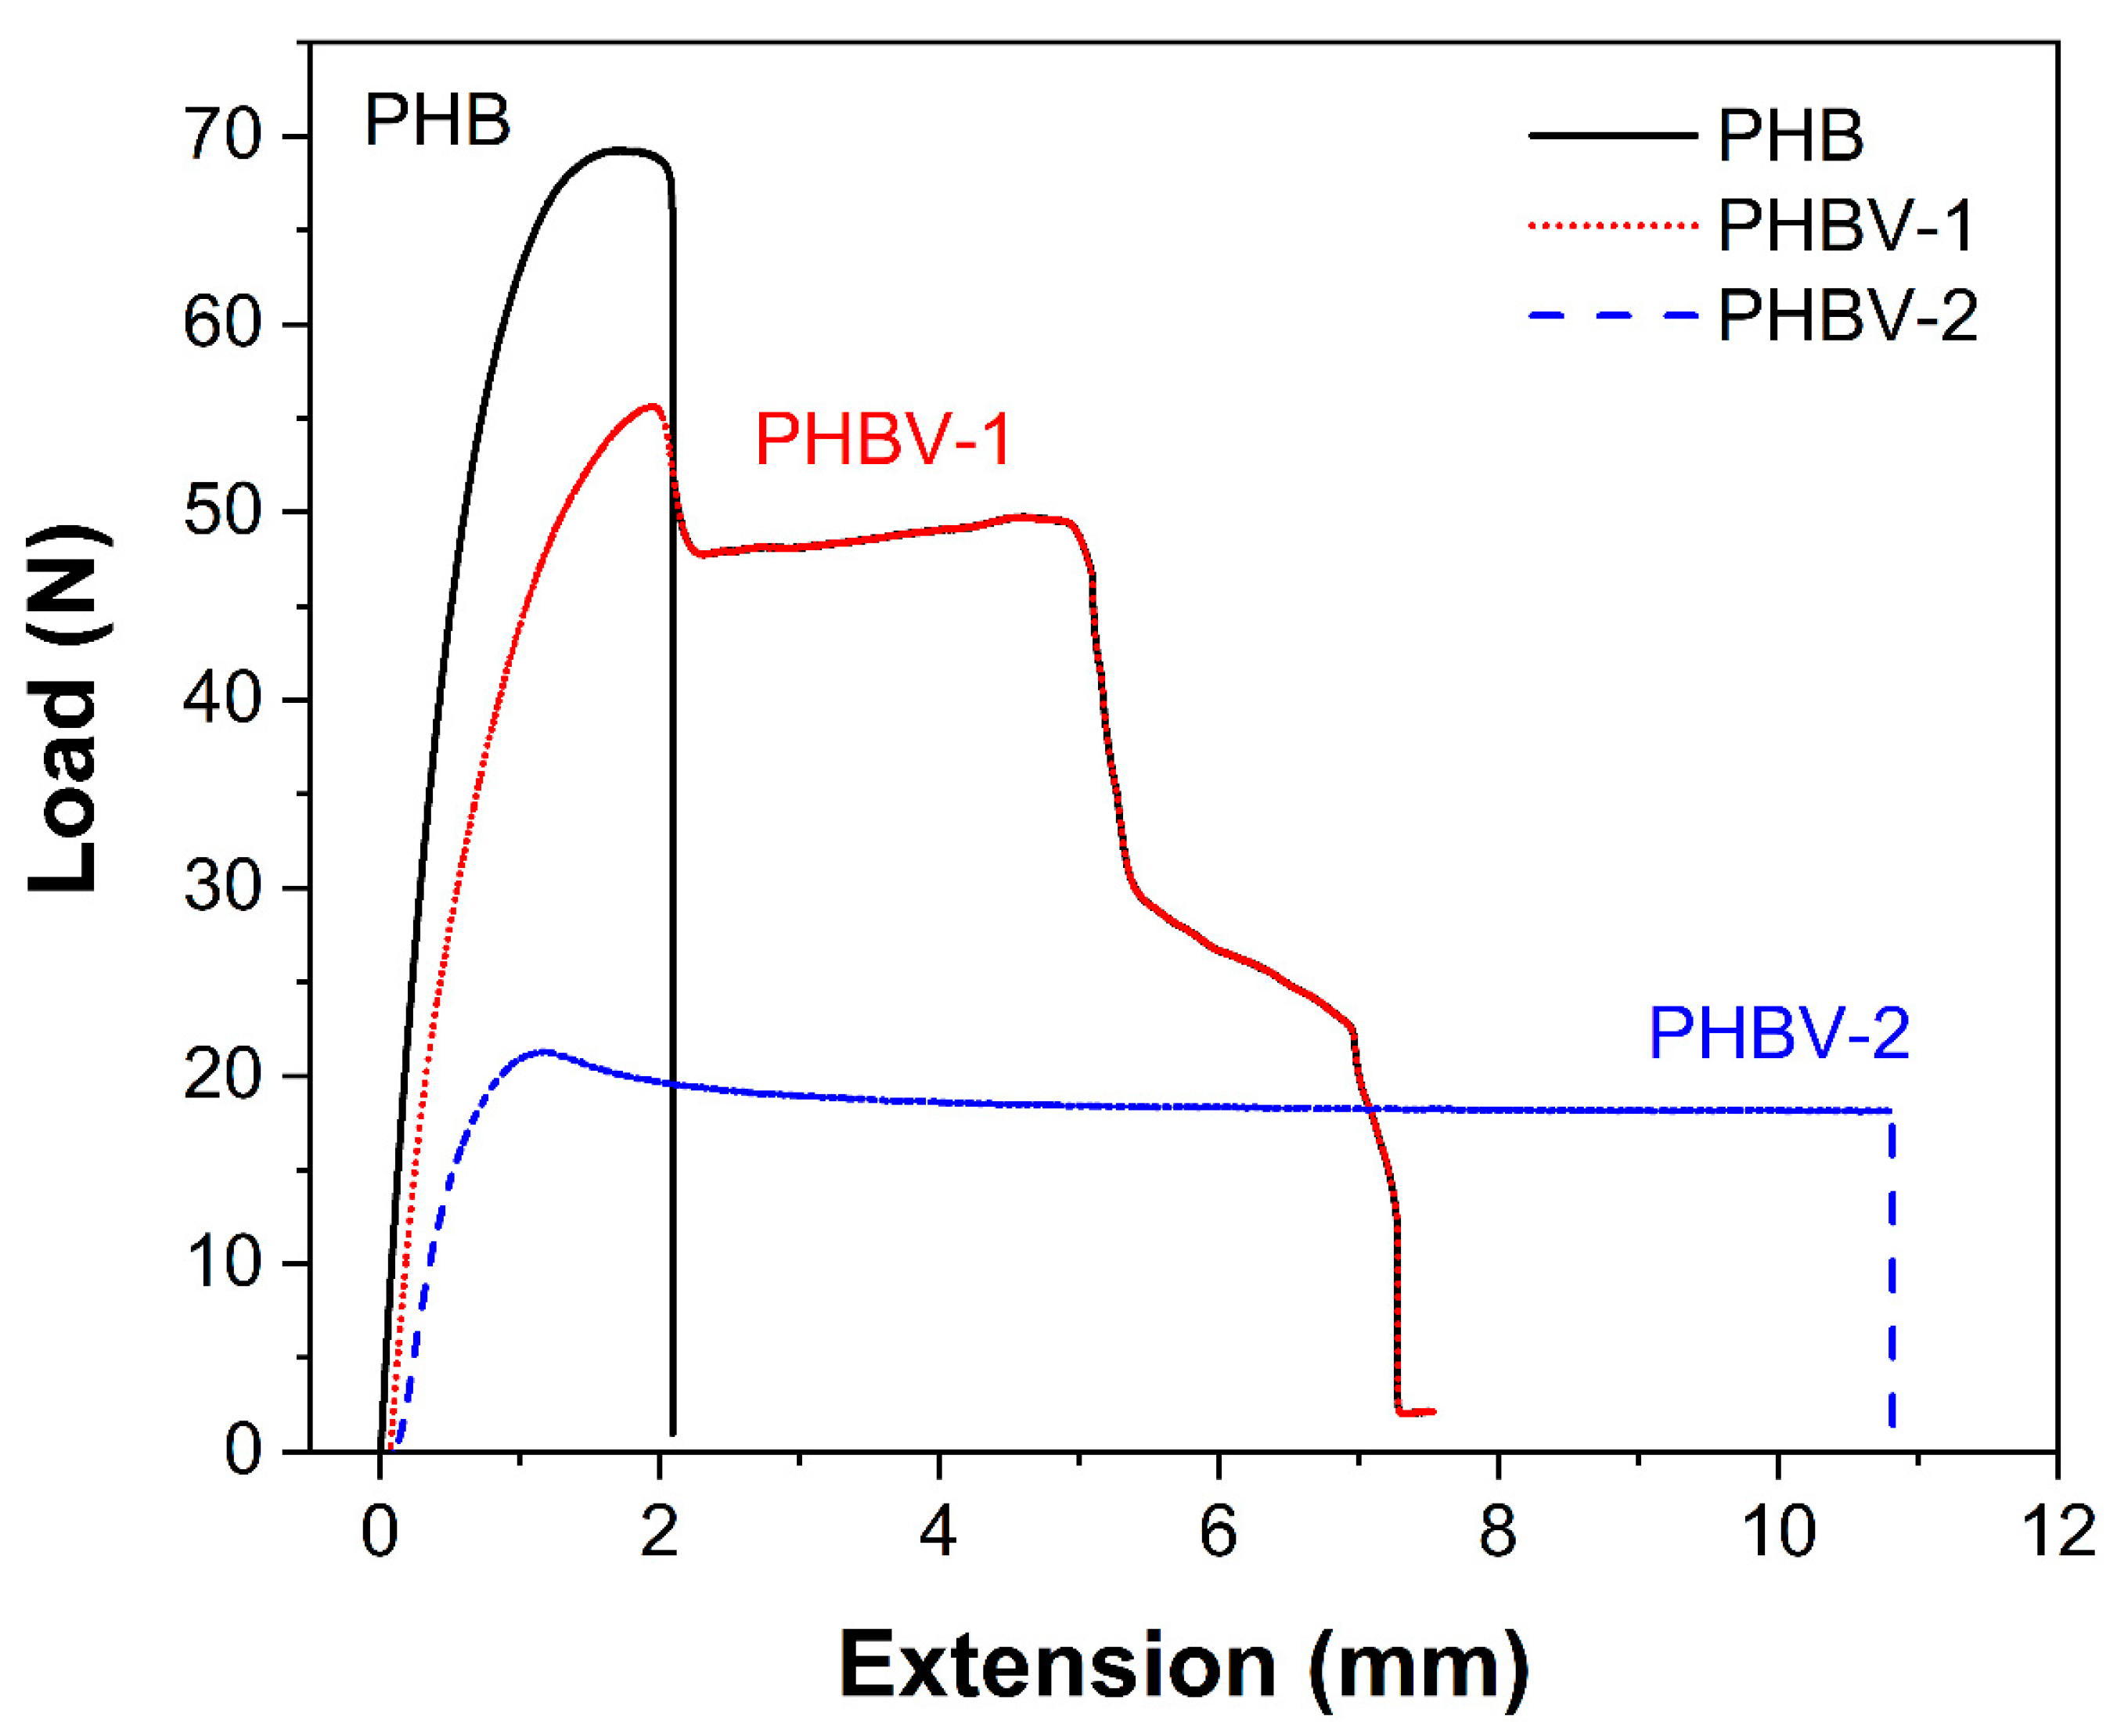
Figure 5 and
Table 3 show the mechanical properties of the PHB, PHBV-1, and PHBV-2 scaffolds. The high crystalline PHB films displayed a much higher tensile strength and E-modulus than the PHBV films. These results were in relation to the semi-crystalline nature of PHBV samples. PHBV-2 films were more ductile and elastic compared to PHBV-1 films, thus correlating with lower crystallinity.
3.2. Degradation of PHB and PHBV Scaffolds in Model Fluids
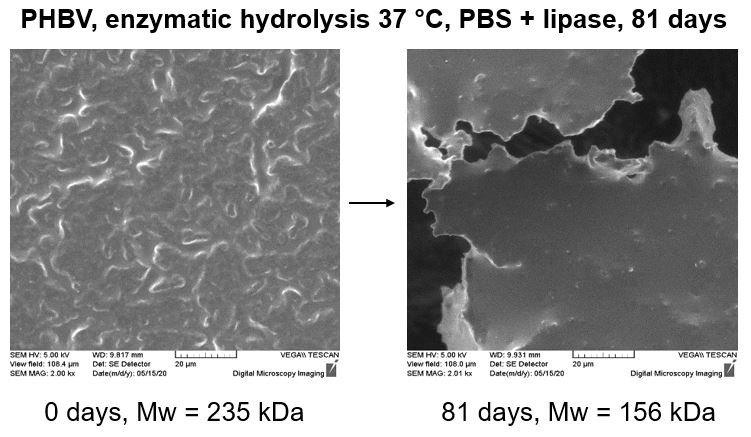
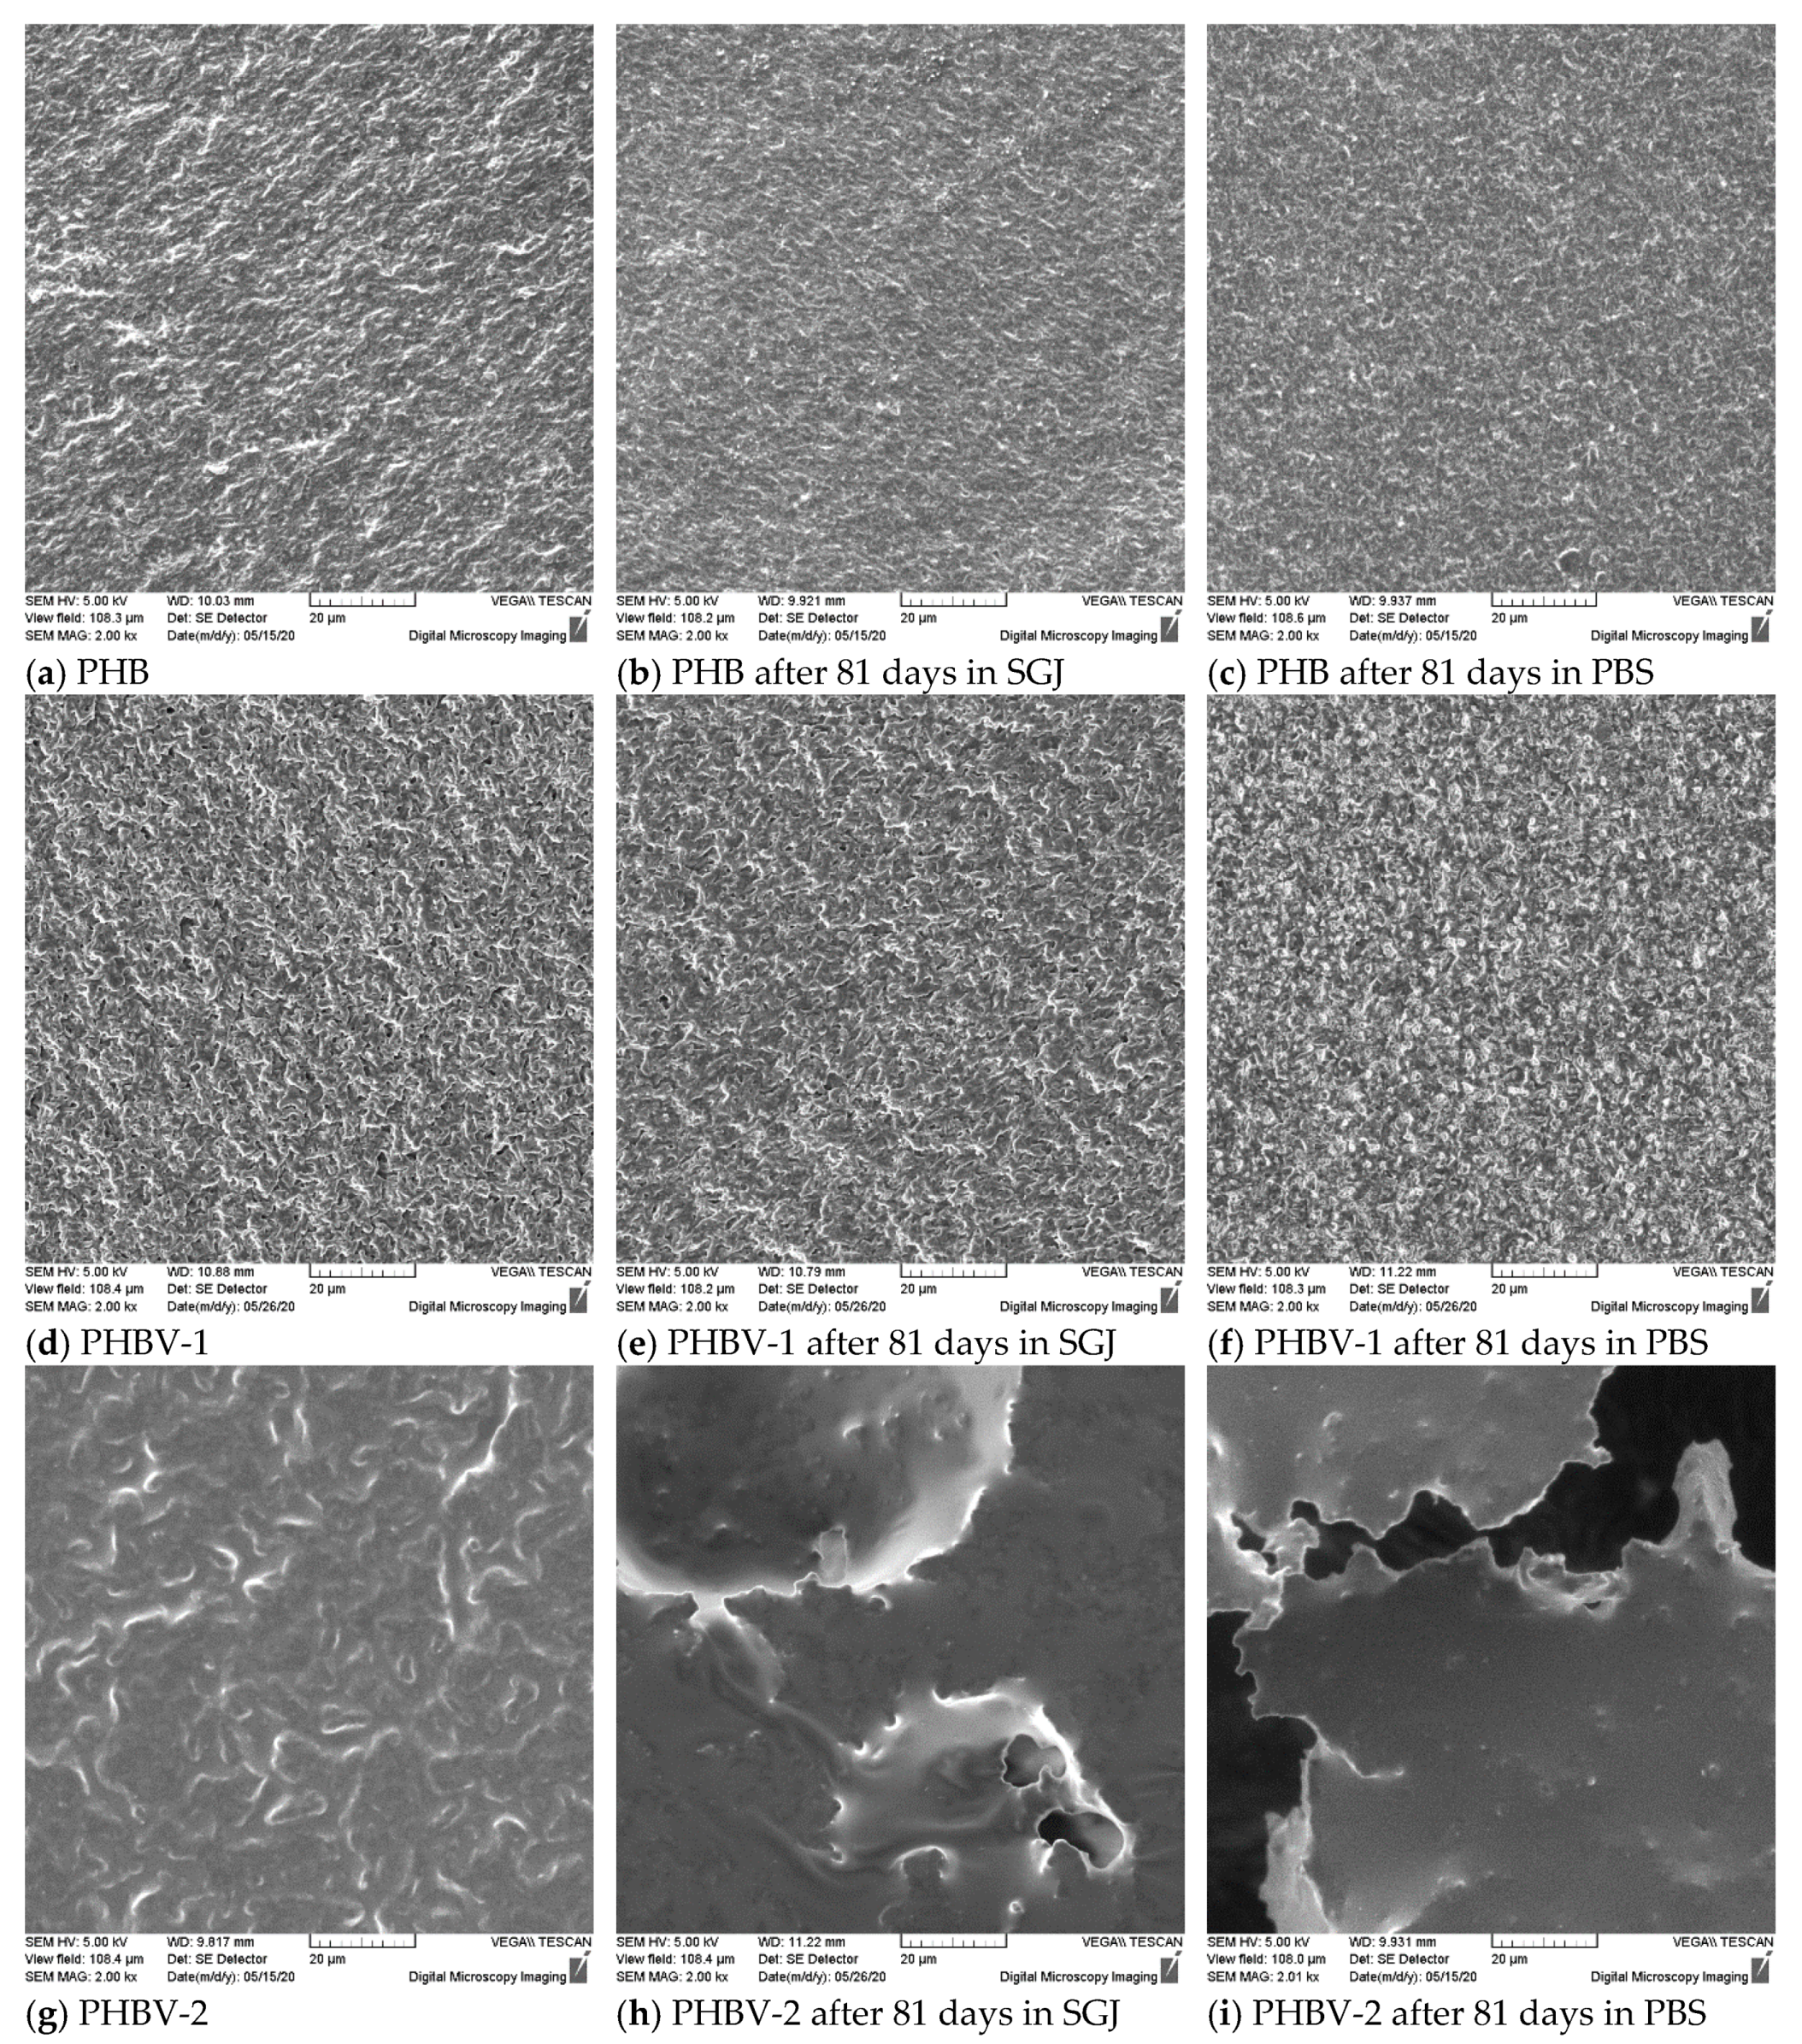
The deterioration of scaffolds began on the surface and was closely related to the morphology of the samples.
Figure 6 shows the morphology of the PHB, PHBV-1, and PHBV-2 scaffolds before and after 81 days of degradation in model fluids. The surface morphologies of the PHB (
Figure 6a) and PHBV-1 (
Figure 6d) scaffolds before degradation were very similar and could be described as a slightly grainy surface that is typical for highly crystalline polymers. In contrast, the surface of the PHBV-2 (
Figure 6g) scaffolds was more plastic than the surfaces of the PHB and PHBV-1 scaffolds. This implies a significantly lower degree of crystallinity for the PHBV-2 sample that can be ascribed to the fact that PHBV-2 was not a pure copolymer but contained residual phenolics and polysaccharides of the grape sugar extract co-extracted from the biomass along with the PHA polymer. The effect of crystallinity on the visual appearance of the samples was much pronounced after degradation in model fluids. The morphology of the PHB and PHBV-1 scaffolds after 81 days of exposure in model fluids changed moderately; the surface morphology became only more structured. In contrast, the PHBV-2 scaffold’s morphology changed significantly, showing huge pits and craters (SGJ,
Figure 6h) and torn structure (PBS,
Figure 6i). Additionally, the surface became even smoother, which is typical for amorphous polymers (
Figure 6h,i). Long-term exposure resulted in the “etching” of the outer thin layer, which was partially crystalline due to the boundary confinement leaving smooth amorphous phase exposed.
All tested samples displayed in
Table 4 presented the thermal properties of scaffolds detected before and after degradation in model fluids. All samples before degradation displayed complex melting behavior with a first asymmetric small peak at 156.8−160.8 °C (T
m1) and a secondary asymmetric peak at 172.7−173.8 °C (T
m2). The double melting behavior in PHA may have indicated different physical characteristics of crystals, polymorphism, or the occurrence of a melting–recrystallization–remelting event [
40]. The double melting behavior of the PHA scaffolds was also recorded after degradation in model fluids. After degradation in model fluids, the semi-crystalline character of the PHA scaffold was slightly modified. Some reorganization of the semi-crystalline nature could be seen from the slight changes in the values of melting temperatures and melting enthalpies.
The degree of crystallinity played an essential role in the PHA hydrolysis course. PHB and PHBV-1 had comparable values of melting enthalpies of 76.3 and 81.7 J g−1, respectively. PHBV-2 possessed a much lower melting enthalpy of 45.6 J g−1. The high degree of crystallinity of the samples caused a high inertness of the surfaces of the PHB and PHBV-1 scaffolds. In synthetic gastric juice, only PHBV-2 displayed a small decrease in the degree of crystallinity (the value of melting enthalpy decreased by about 11.4%). The values of melting enthalpies of PHB and PHBV-1 slightly increased, thus resulting in the recrystallization of amorphous parts. The degradation of the PHA scaffolds in PBS with lipase was more progressive and effective than synthetic gastric juice. Both scaffolds prepared from PHBV showed lower values of melting enthalpies after enzymatic degradation compared to values before degradation. PHBV-2 showed the most considerable decrease in melting enthalpy (about 29.6%) due to its much lower degree of crystallinity compared to PHB and PHBV-1. The results indicated that the extent of PHA surface degradation in the model fluids corresponded with the primary semi-crystalline character of the samples and the presence of an active enzyme.
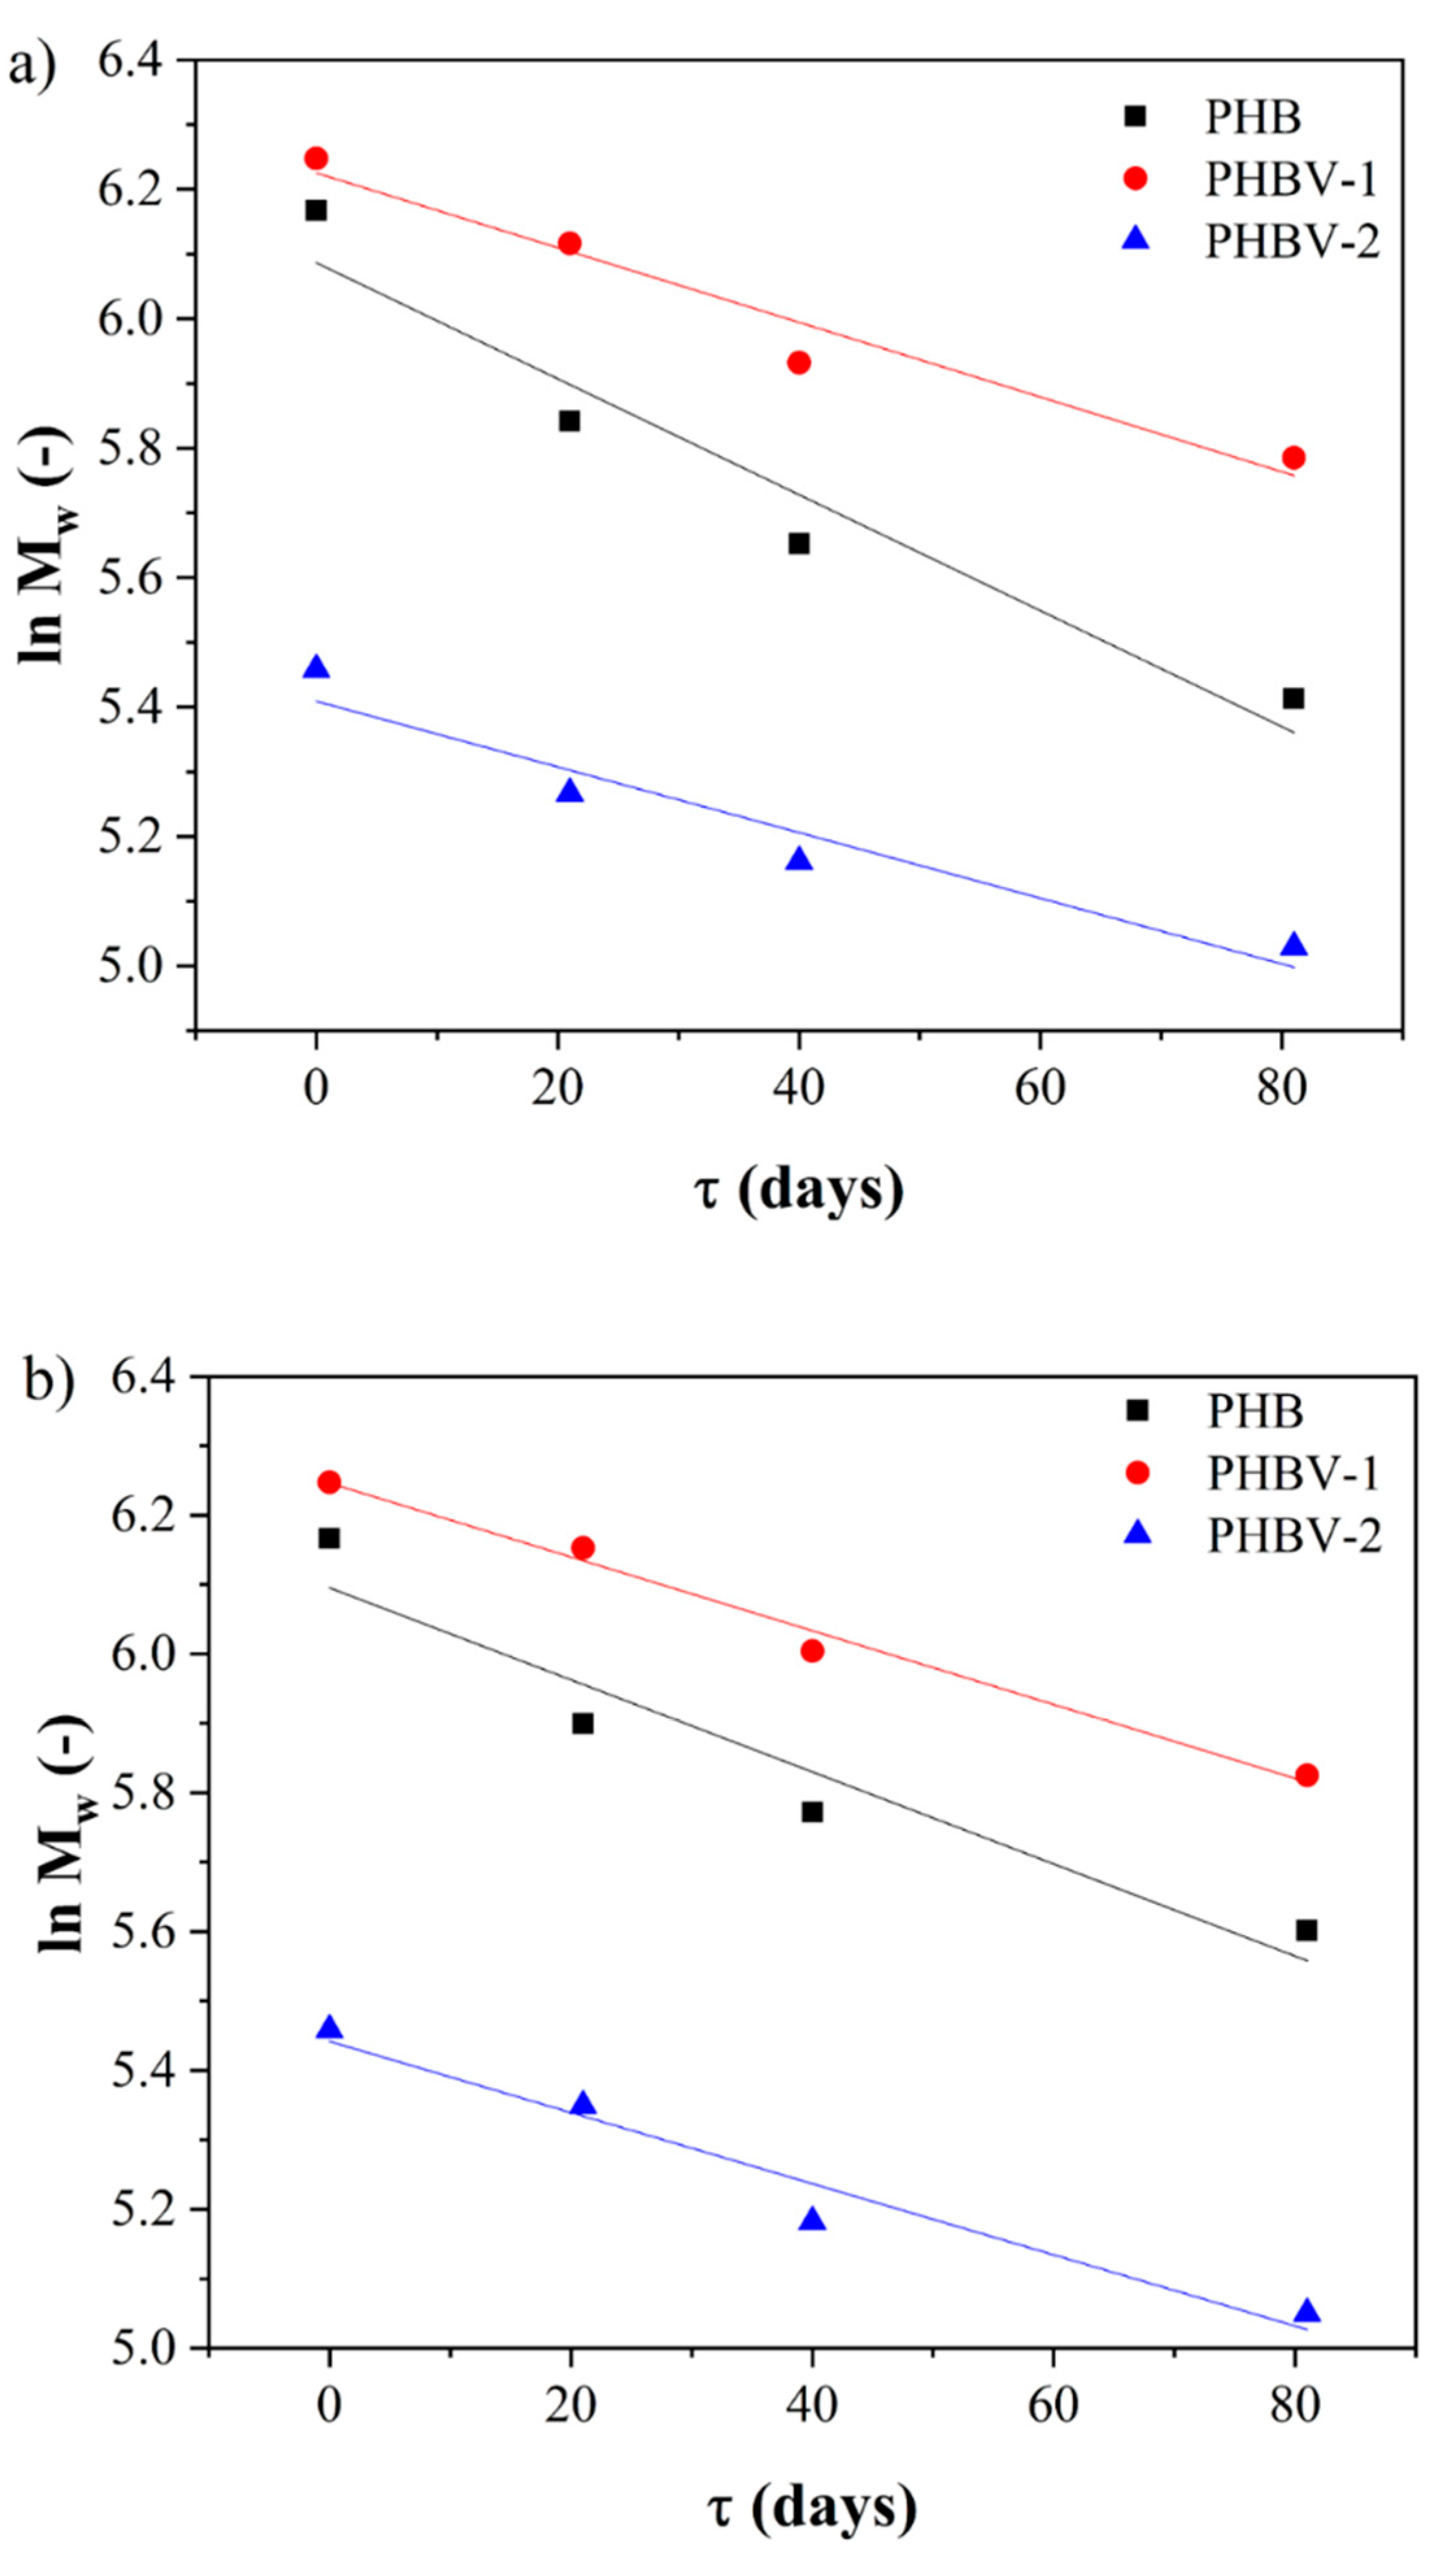
The main principle of PHA degradation in fluids with or without enzymes is hydrolysis. The carboxylic esters start to decompose, resulting in a decrease in the polymer’s measured molecular weight. The variations in the molecular weight of PHAs during degradation were monitored using the SEC-MALLS technique (
Table 5 and
Table 6). SEC-MALLS chromatograms are shown in the
Supporting Information (see
Figures S1–S3). The values of weight-average molecular weight decreased the most in the case of PHB hydrolysis, showing around 51.7% and 43.7% losses in SGJ and PBS, respectively. The values of the average molecular weights of PHBV-1 and PHBV-2 after degradation were comparable, reaching a relative decrease in the range of about 33.6–37.1%.
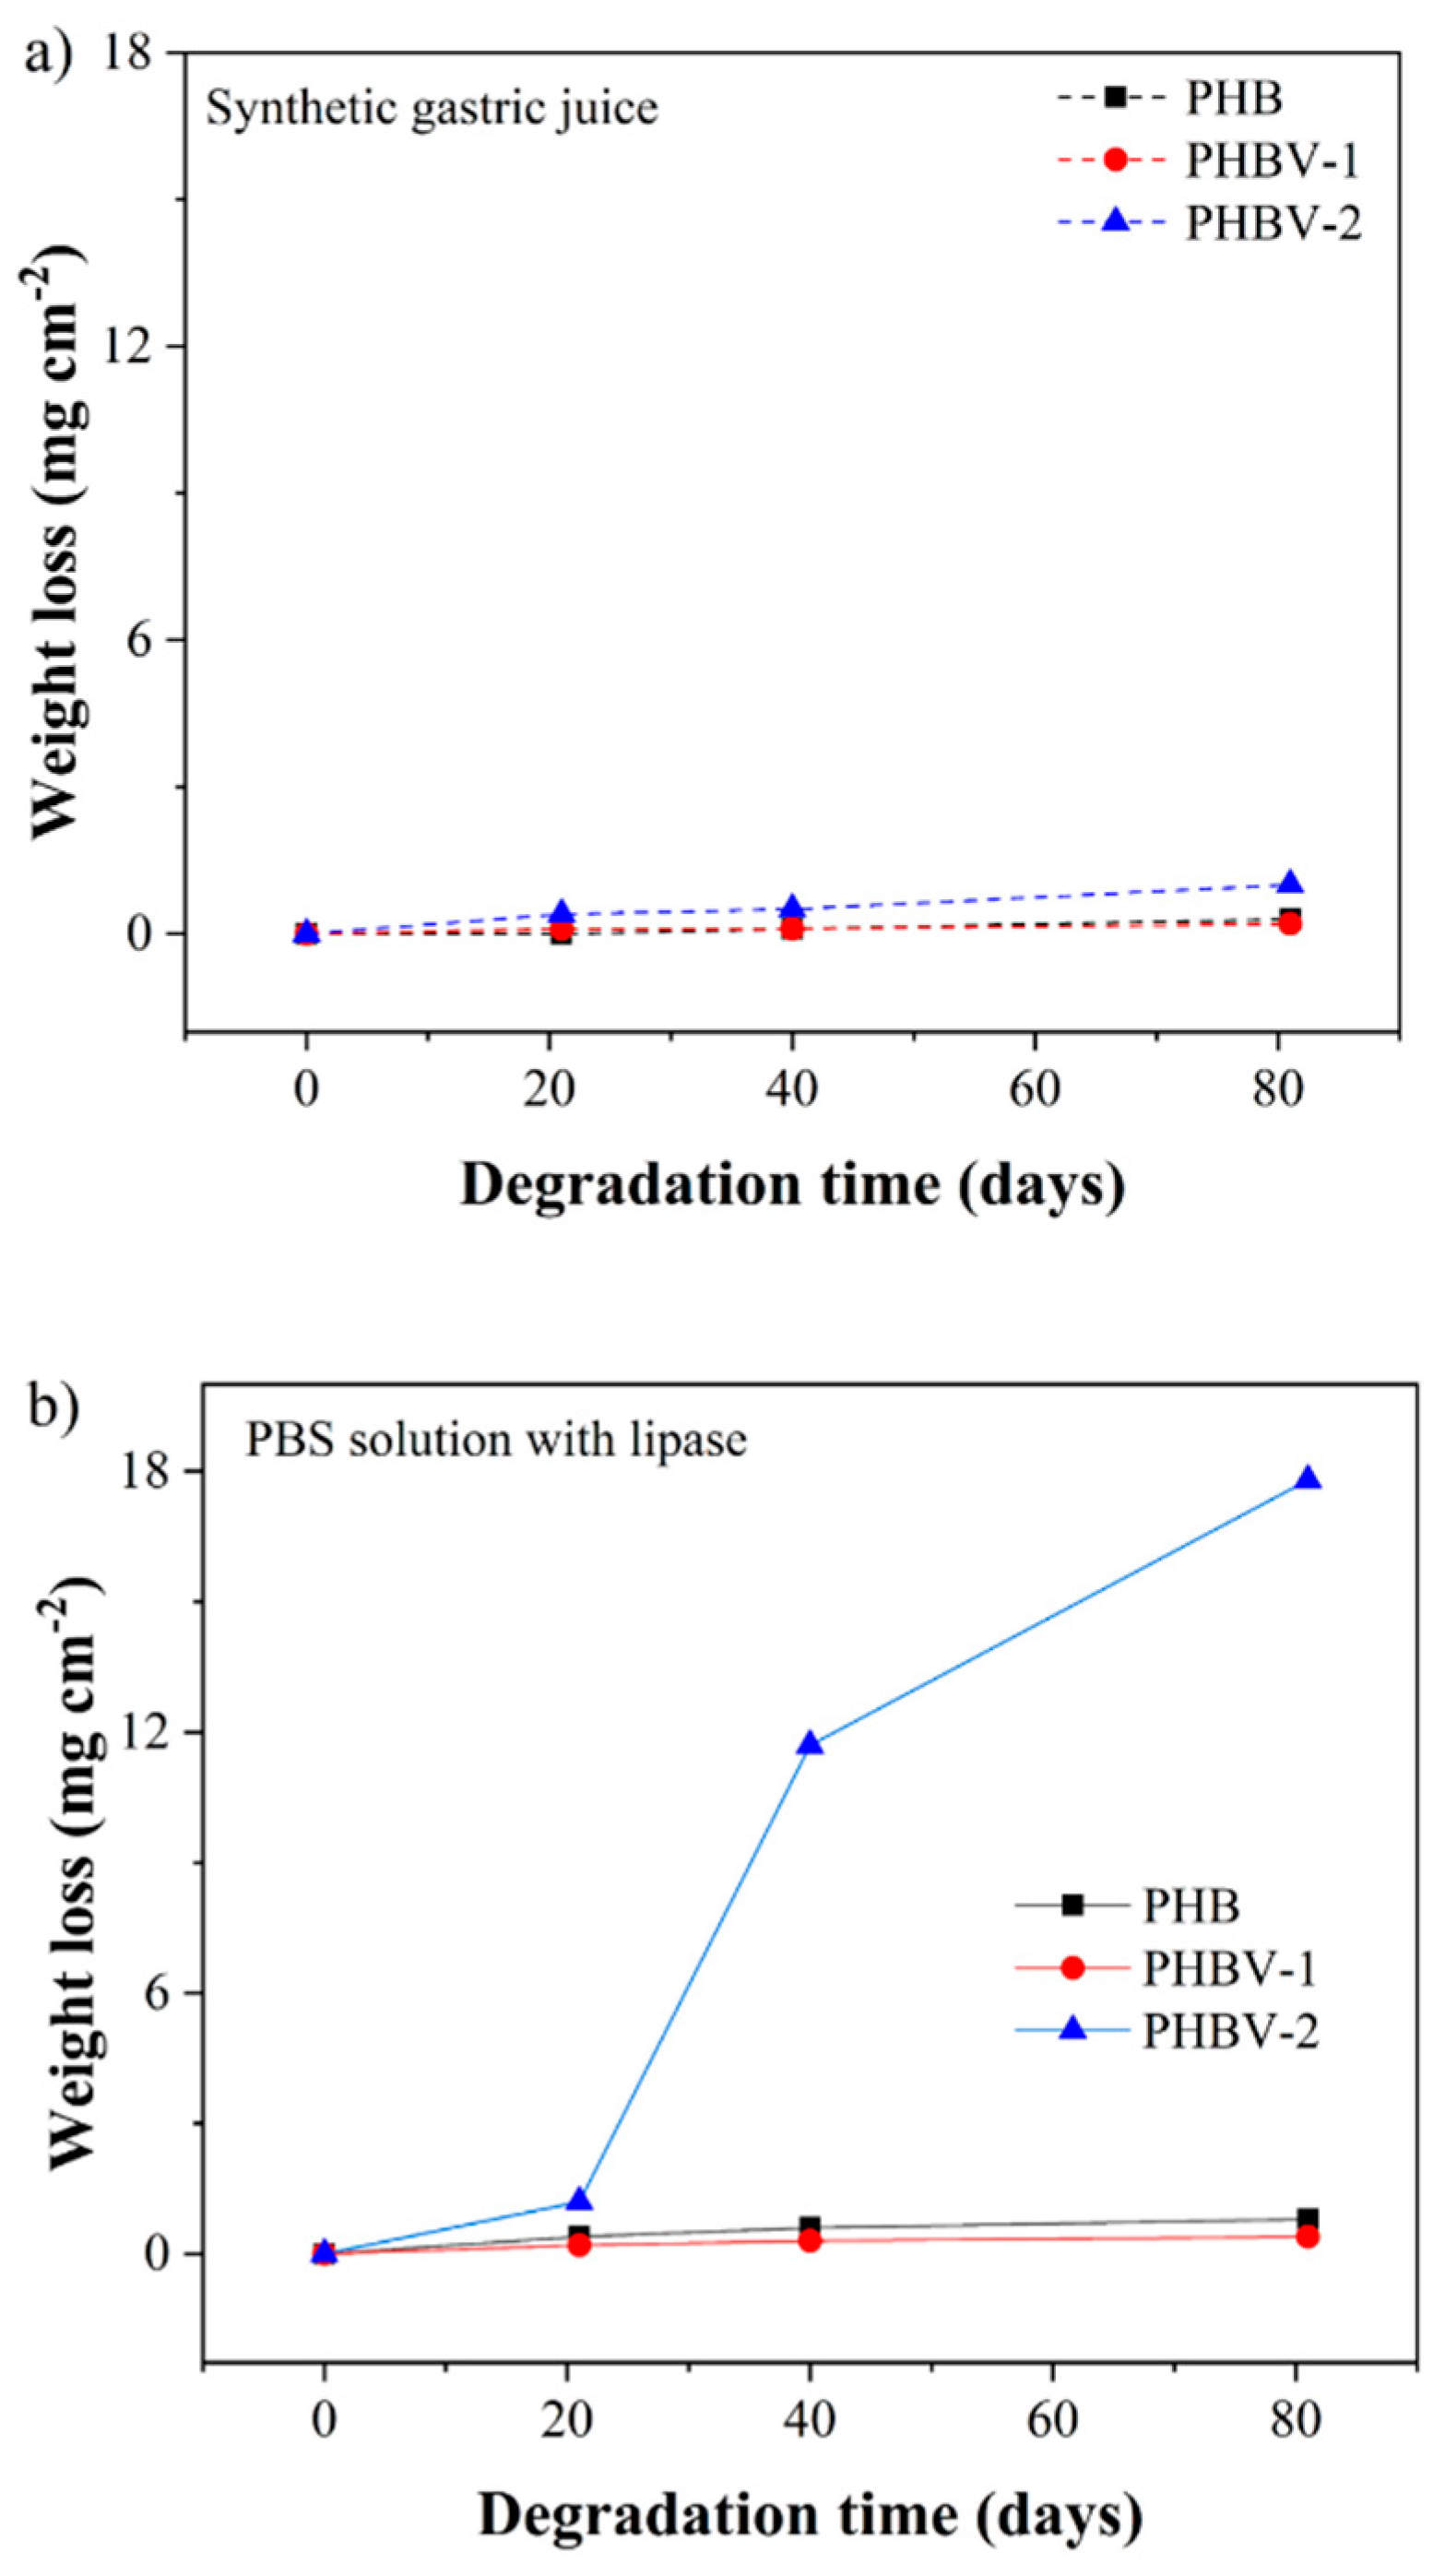
The changes that occurred in the scaffolds after 81 days in model fluids were assessed gravimetrically (
Figure 7). The weight changes in all samples were only minor except for the PHBV-2 scaffold degraded in PBS buffer with lipase. The weight loss of PHBV-2 after 81 days in PBS buffer with lipase reached up to 85%.

 ,
, 


