Ag2S Quantum Dots Based on Flower-like SnS2 as Matrix and Enhanced Photocatalytic Degradation

1
State Key Laboratory of Advanced Processing and Recycling Nonferrous Metals, Lanzhou University of Technology, Lanzhou 730050, China
2
School of Science, Lanzhou University of Technology, Lanzhou 730050, China
*
Author to whom correspondence should be addressed.
Materials 2019, 12(4), 582; https://doi.org/10.3390/ma12040582
Submission received: 10 January 2019
/
Revised: 10 February 2019
/
Accepted: 11 February 2019
/
Published: 15 February 2019
(This article belongs to the Special Issue Smart Nanomaterials for Environmental Remediation)
Abstract
:Ag2S quantum dots were dispersed on the surface of SnS2 nanoflowers forming a heterojunction via in-situ ion exchange to improve photocatalytic degradation of RhB. All samples exhibit the hexagonal wurtzite structure. The size of Ag2S@SnS2 composites are ~ 1.5 μm flower-like with good crystallinity. Meanwhile, the Eg of 3% Ag2S@SnS2 is close to that of pure SnS2. Consequently, the 3% Ag2S@SnS2 composite displays the excellent photocatalytic performance under simulated sunlight irradiation with good cycling stability, compared to the pure SnS2 and other composites. Due to the blue and yellow luminescence quenching, the photogenerated electrons and holes is effectively separated in the 3% Ag2S@SnS2 sample. Especially, the hydroxyl radicals and photogenerated holes are main active species.
1. Introduction
Recently, photocatalytic technology is considered as a promising and effective way to dye degradation and water splitting hydrogen/oxygen evolution with the help of semiconductor catalysts [1].
Among various semiconductor photocatalysts, SnS2 is an emerging two-dimensional layered material with narrow band gap (2.2 eV), low cost, non-toxic, and excellent thermal stability [2]. However, the photogenerated electrons and holes of SnS2 composites can severely limit the photocatalytic performance because the recombination of photogenerated electrons and holes exists in the surface and interior of SnS2 photocatalysts [3,4]. Consequently, many researchers have been devoted to improve the separation of photogenerated charges of SnS2-layered material by forming heterojunctions with other semiconductor photocatalysts, such as g-C3N4 [5], ZnS [6], Bi2S3 [7], SnS [8], CdS [9], Al2O3 [10], SnO2 [11], MgFe2O4 [12], LaTi2O7 [13], BiOBr [14], and BiOCl [15].
Ag2S quantum dots have a narrow band gap (0.96 eV), which is used as an efficient co-photocatalyst material to combine with other wide bandgap semiconductor photocatalysts [16]. Compared with the state of the art [17], Rhodamine B aqueous solution is chosed to be dye in this paper due to no degradation by itself, reflecting the authenticity of the photocatalytic experiment. Also, the flower-like tin disulfide composites possess a smaller grain size with a higher specific surface area, so it exhibits superior photocatalytic performance.
Herein, the heterogeneous combination of SnS2 composites and the appropriate amounts of Ag2S quantum dots can availably enhance the separation of photogenerated electrons and holes, exhibiting the higher photocatalytic performance.
In this work, Ag2S quantum dots@SnS2 composites were prepared by in-situ ion exchange method. The crystallinity, morphology, element content, optical and photocatalytic properties of the samples were characterized by X-ray diffraction (XRD), scanning electron microscopy (SEM), transmission electron microscopy (TEM), energy dispersive spectrometry (EDS), Ultraviolet–visible spectroscopy (UV–vis), X-ray photoelectron spectroscopy (XPS) and photoluminescence spectra (PL) to reveal the mechanism of the photocatalytic degradation.
2. Experimental Procedure
2.1. Preparation of the Ag2S@SnS2 Composites
The prepared 0.1 g pure SnS2 powders [18] were dissolved and dispersed in 40 ml of distilled water. Then, the 0.1 mol/L AgNO3 solution was added relaxedly in the SnS2 mixture with a burette, stirred for 1 hour. The resulting yellow products were collected by centrifugation, washed repeatedly with deionized water and absolute ethanol, and dried at 60 °C for 12 h. The composite samples based on different volume percentages were marked as 0.5% Ag2S@SnS2, 1% Ag2S@SnS2, 3% Ag2S@SnS2, and 5% Ag2S@SnS2, respectively.
2.2. Characterization
The phase and structural analysis of as-synthesized samples was examined by a powder X-ray diffractometer (Rigaku, D/Max-2400, Tokyo, Japan) with CuKa radiation at λ = 1.54056 Å. The scanning electron microscope (SEM, 200FEG, FEI Company, Hillsboro, OR, USA) operating at 50 kV and high-resolution transmission electron microscopy (TEM-2010, JEOL Ltd., Tokyo, Japan) operating at 200 kV were used to test the morphology and the crystallinity of the Ag2S@SnS2 composites. The optical property was analyzed by ultraviolet-visible (TU-1901, Beijing general instrument co. Ltd., Beijing, China) spectrophotometer. X-ray photoelectron spectroscopy measurement was performed to analyze the chemical states of the elements. The fluorescence photometer (PerkinElmer, Bridgeport, CT, USA) was used to measure the photoluminescence (PL) at an excitation wavelength of 300 nm.
2.3. Measurement of Photocatalytic Activity
In a typical process, 50 mg Ag2S@SnS2 catalyst was added to 100 mL RhB aqueous solution (C0 = 10 mg/L). Firstly, the mixture was in the dark for 30 minutes. A 300W Xe lamp with a cut-off filter was served as the visible light source. Then, the solution was carried out for 2 hours under visible light irradiation. A 2.5 mL solution of the sample was taken out every 0.5 hour to calculate the corresponding degradation rate. The typical absorption peak of RhB at 554 nm was a reference point in absorption spectra to assess the degradation of organic pollutant directly.
The photocatalytic degradation efficiency is defined as the following equation:
where C0 is the initial concentration of RhB and Ct means the concentration of RhB after light irradiation.
η = (C0−Ct)/C0 × 100%
3. Results and Discussion
3.1. Structure Analysis
The XRD pattern of pure SnS2 and Ag2S@SnS2 composites is shown in Figure 1. The locations and relative intensities of the diffraction peaks at 15.03°, 28.20°, 30.53°, 32.12°, 41.89°, 52.45°, and 54.96° are basically the same as those of the SnS2 standard card JCPDS (23-0677). The preparation of Ag2S@SnS2 composite did not change, significantly, the hexagonal wurtzite crystal structure. In addition, it is noted that the diffraction peak of Ag2S did not appear in the diffraction pattern of the Ag2S@SnS2 composites, which may be attributed to the following reasons: (i) To some extent, the periodic arrangement is destroyed in the process of in-situ ion exchange, weakening the crystallinity of Ag2S. (ii) The Ag2S diffraction peak at 31.52° is close to the diffraction peak of the SnS2 (101) crystal plane. At the same time, it is difficult to be distinguished the (003) crystal plane of the SnS2 and the 46.21° peak of Ag2S. (iii) It is exceeded the range of XRD detection due to the little amount of Ag2S in the composites.
3.2. Morphology Analysis
It can be seen from Figure 2a that the 3% Ag2S@SnS2 composite exhibits a three-dimensional flower-like structure, composed of hexagonal sheets. The calculated weight and atomic percentage of Ag in the 3% Ag2S@SnS2 composite sample are almost equal to the nominal stoichiometry in Figure 2b.
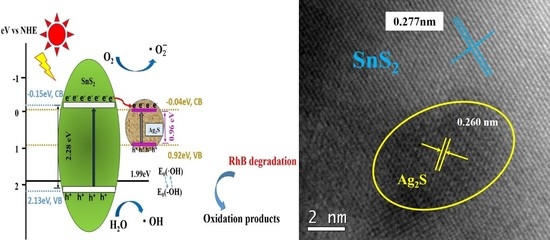
In order to futher investigate the morphology and lattice of samples, the transmission electron micrograph of 3% Ag2S@SnS2 sample is performed. Figure 2c demonstrates the morphology is also flower-like with uniform distribution and clear edges, which is consistent with the SEM image. The interplanar spacing d(101) = 0.277 nm of SnS2 demonstrates that flower-like SnS2 grows along the (101) axis. It is worth noting in Figure 2d that a 5 nm particle is clearly on the flower-like SnS2. The interplanar spacing of the particle was 0.260 nm corresponding to the (−121) crystal plane of a typical Ag2S (PDF 14-0072), confirming that the nanoparticle is Ag2S quantum dot. The selected area electron diffraction (SAED) pattern of 3% Ag2S@SnS2 composite performs a single crystal with a good crystallinity, which reveals that the samples are consistent with the hexagonal wurtzite (SnS2 PDF#23-0677) structure.
3.3. UV-vis Analysis
The effect of pure SnS2 and Ag2S@SnS2 composites on the optical characteristics is depicted in Figure 3a. The absorption coefficient (α) of the samples are different, which obeys the Kubelka–Munk function. For direct band gap, the Eg is obtained by extending the linear portion of the [hυ]2 and hυ curves to the intercept at (hυ)2 = 0. It can be seen from Figure 3b that the optical band gaps of pure SnS2, 0.5% Ag2S@SnS2, 1% Ag2S@SnS2, 3% Ag2S@SnS2, and 5% Ag2S@SnS2 samples are 2.278 eV, 2.35 eV, 2.30 eV, 2.27 eV, and 2.18 eV, respectively. With the increase of Ag2S, the optical band gap of Ag2S@SnS2 composite becomes narrower than that of pure SnS2. Notably, the optical band gap of 3% Ag2S@SnS2 is close to that of pure SnS2.
3.4. XPS Analysis
The elemental compositions and surface valence states of the 3% Ag2S@SnS2 catalysts are estimated from XPS. There is no interference originated from other impurity elements in the XPS full spectrum. Figure 4b–d exhibits the high resolution spectra of Sn 3d, S 2p, and Ag 3d, respectively. From Figure 4b, the peaks of the Sn2d5/2 and Sn2d3/2 are located at the 486.5 and 494.8 eV peak positions, respectively. The XPS spectrum of the S 2p is fitted to two different peaks corresponding to S 2p1/2 and S 2p3/2 at 161.4 eV and 162.5 eV in Figure 4c, which indicates the presence of S2− in the composite. Similarly, two peaks located at 367.8 eV and 373.7 eV can be assigned to Ag 3d5/2 and Ag 3d3/2, respectively [19], confirming the existence of Ag+ in the composite. Subsequently, this result further verifys the existence of Ag2S quantum dots in the 3% Ag2S@SnS2 composite.
3.5. PL Analysis
The photoluminescence spectrum of pure SnS2 and 3% Ag2S@SnS2 nanoflowers at an excitation wavelength of 300 nm is performed to investigate defects, vacancies and gaps inside the semiconductor.
It is mention that pure SnS2 nanoflowers mainly have four luminescence peaks in Figure 5a. The peaks are violet (390 nm), blue (471 nm), yellow (589 nm) and red (688 nm), respectivly.
Since the ultraviolet luminescence peak centered at 390 nm is asymmetrical, the PL curve of pure SnS2 sample is fitted for 380 nm, 385 nm, 395 nm, and 411 nm in Figure 5b. Notably, 380 nm, 385 nm, and 395 nm peaks are the three ultraviolet luminescence, which originates from the exciton recombination corresponding to the near-band emission (NBE) of the SnS2 wide band gap caused by the quantum confinement effect. However, the purple light emitting band at 411 nm is due to surface defects, interstitial sulfur vacancies and SnS2 lattice gap defect of shallow deep and deep traps [20]. The well-crystallinity of pure SnS2 and 3% Ag2S@SnS2 nanoflowers is confirmed by the appearance of the near-edge purple peak. Meanwhile, the blue light at the center of 471 nm can be attributed to the self-activation center formed by the tin vacancies in the lattice or the energy transfer between the sulfur vacancies and the sulfur gap [21]. Due to oxygen-related defects (O+N) at low formation energies, defect-related luminescence is mainly yellow light at 589 nm [22]. A weak red luminescence peak at 688 nm might at a result of impurities and primary defects, such as tin atoms of interstitial atoms in SnS2 [23].
Owing to reduce the recombination efficiency of the photogenerated electron-hole pairs, the peak intensity of 3% Ag2S@SnS2 composite is significantly lower than that of pure SnS2. The quenching phenomenon of blue light and yellow light occur with the composites of Ag2S quantum dots, which is attributed that some electrons of SnS2 are transferred to Ag2S quantum dots to form non-radiative capture centers.
3.6. The Commission International DeI’Eclairage (CIE) Chromaticity Diagram Analysis
Figure 6 shows the CIE (Commission International DeI’Eclairage) chromaticity diagram of pure SnS2 and Ag2S@SnS2 composites excited by 300 nm laser. The CIE color coordinates (x, y) of Ag2S@SnS2 nanoflowers are calculated using fluorescence spectra, as shown in Table 1. Among them, under the excitation of a 300 nm laser, the chromaticity coordinates (x,y)of pure SnS2 were 0.3593 and 0.3670, respectively. In summary, different concentrations of Ag2S@SnS2 nanoflowers were prepared, which significantly affected the phase purity, particle size, and optical and fluorescent properties of the final sample. The fluorescence mechanism of Ag2S@SnS2 phosphor was discussed based on the experimental results. The CIE coordinates (x, y) of pure SnS2 and Ag2S@SnS2 composites are (0.395, 0.415), (0.374, 0.397), (0.326, 0.333) and (0.313, 0.322), respectively. It tend to violet luminescence with the increase of Ag2S. Especially, the intensity of 3% Ag2S@SnS2 is the weakest of all, which agrees with the PL result.
3.7. Photocatalytic Analysis
The photocatalytic degradation of RhB for pure SnS2 nanoflowers and Ag2S@SnS2 samples under the simulated sunlight irradiation is shown in Figure 7a simultaneously. The Ag2S@SnS2 composites have a significant increase in photocatalytic activity compared to the pure SnS2. It can be seen that the degradation rate of RhB in 3% Ag2S@SnS2 samples can reach 96.6 % after 120 min of reaction, while the pure SnS2 is only 72.4%. Figure 7b is a first-order kinetic curve corresponding Figure 7a, displaying the relationship between Ln (Ct/C0) and reaction time (t) of degradation of RhB by pure SnS2 and Ag2S@SnS2 composites. It indicates that the photocatalytic degradation of RhB in all samples is consistent with the first-order kinetic equation: Ln(Ct/C0) = −kappt [24], kapp is a first order kinetic constant. Compared to the pure SnS2, the Ag2S@SnS2 composites are obviously enhanced the photocatalytic activity. Especially, the kinetic constant kapp of the 3% Ag2S@SnS2 sample (2.90872 min−1) is 4.1 times than that of pure SnS2, which manifests the excellent photocatalytic activity. Figure 8 presents that the 3% Ag2S@SnS2 composite of degrading RhB is tested repeatedly to further analyze the photocatalytic stability. The photocatalytic degradation rate of RhB is still maintained above 90% after 5 cycles. Hence, it indicates that the 3% Ag2S@SnS2 composite photocatalyst have excellent photocatalytic cycle stability. It is generally believed that •OH, •O2−, and h+ are the main active species for the degradation of organic matter in photocatalytic reaction [25,26]. Therefore, the effects of the active species on the degradation of rhodamine B are investigated via adding isopropanol (IPA), benzoquinone (BQ) and triethanolamine (TEOA) used as the scavenger for •OH, •O2− and h+, respectively. The addition of BQ have little effect on dye degradation compared with the no scavenger in Figure 9, demonstrating that •O2− is not the active species. It is noteworthy that the degradation rate of RhB decreases from 90% to 27.9% with the addition of IPA effectively. Meanwhile, the degradation rate of the dye is 62.11% by adding the TEOA. It manifests that •OH and h+ are the main active species of the 3% Ag2S@SnS2 composite.
3.8. The Probable Photocatalytic Mechanism
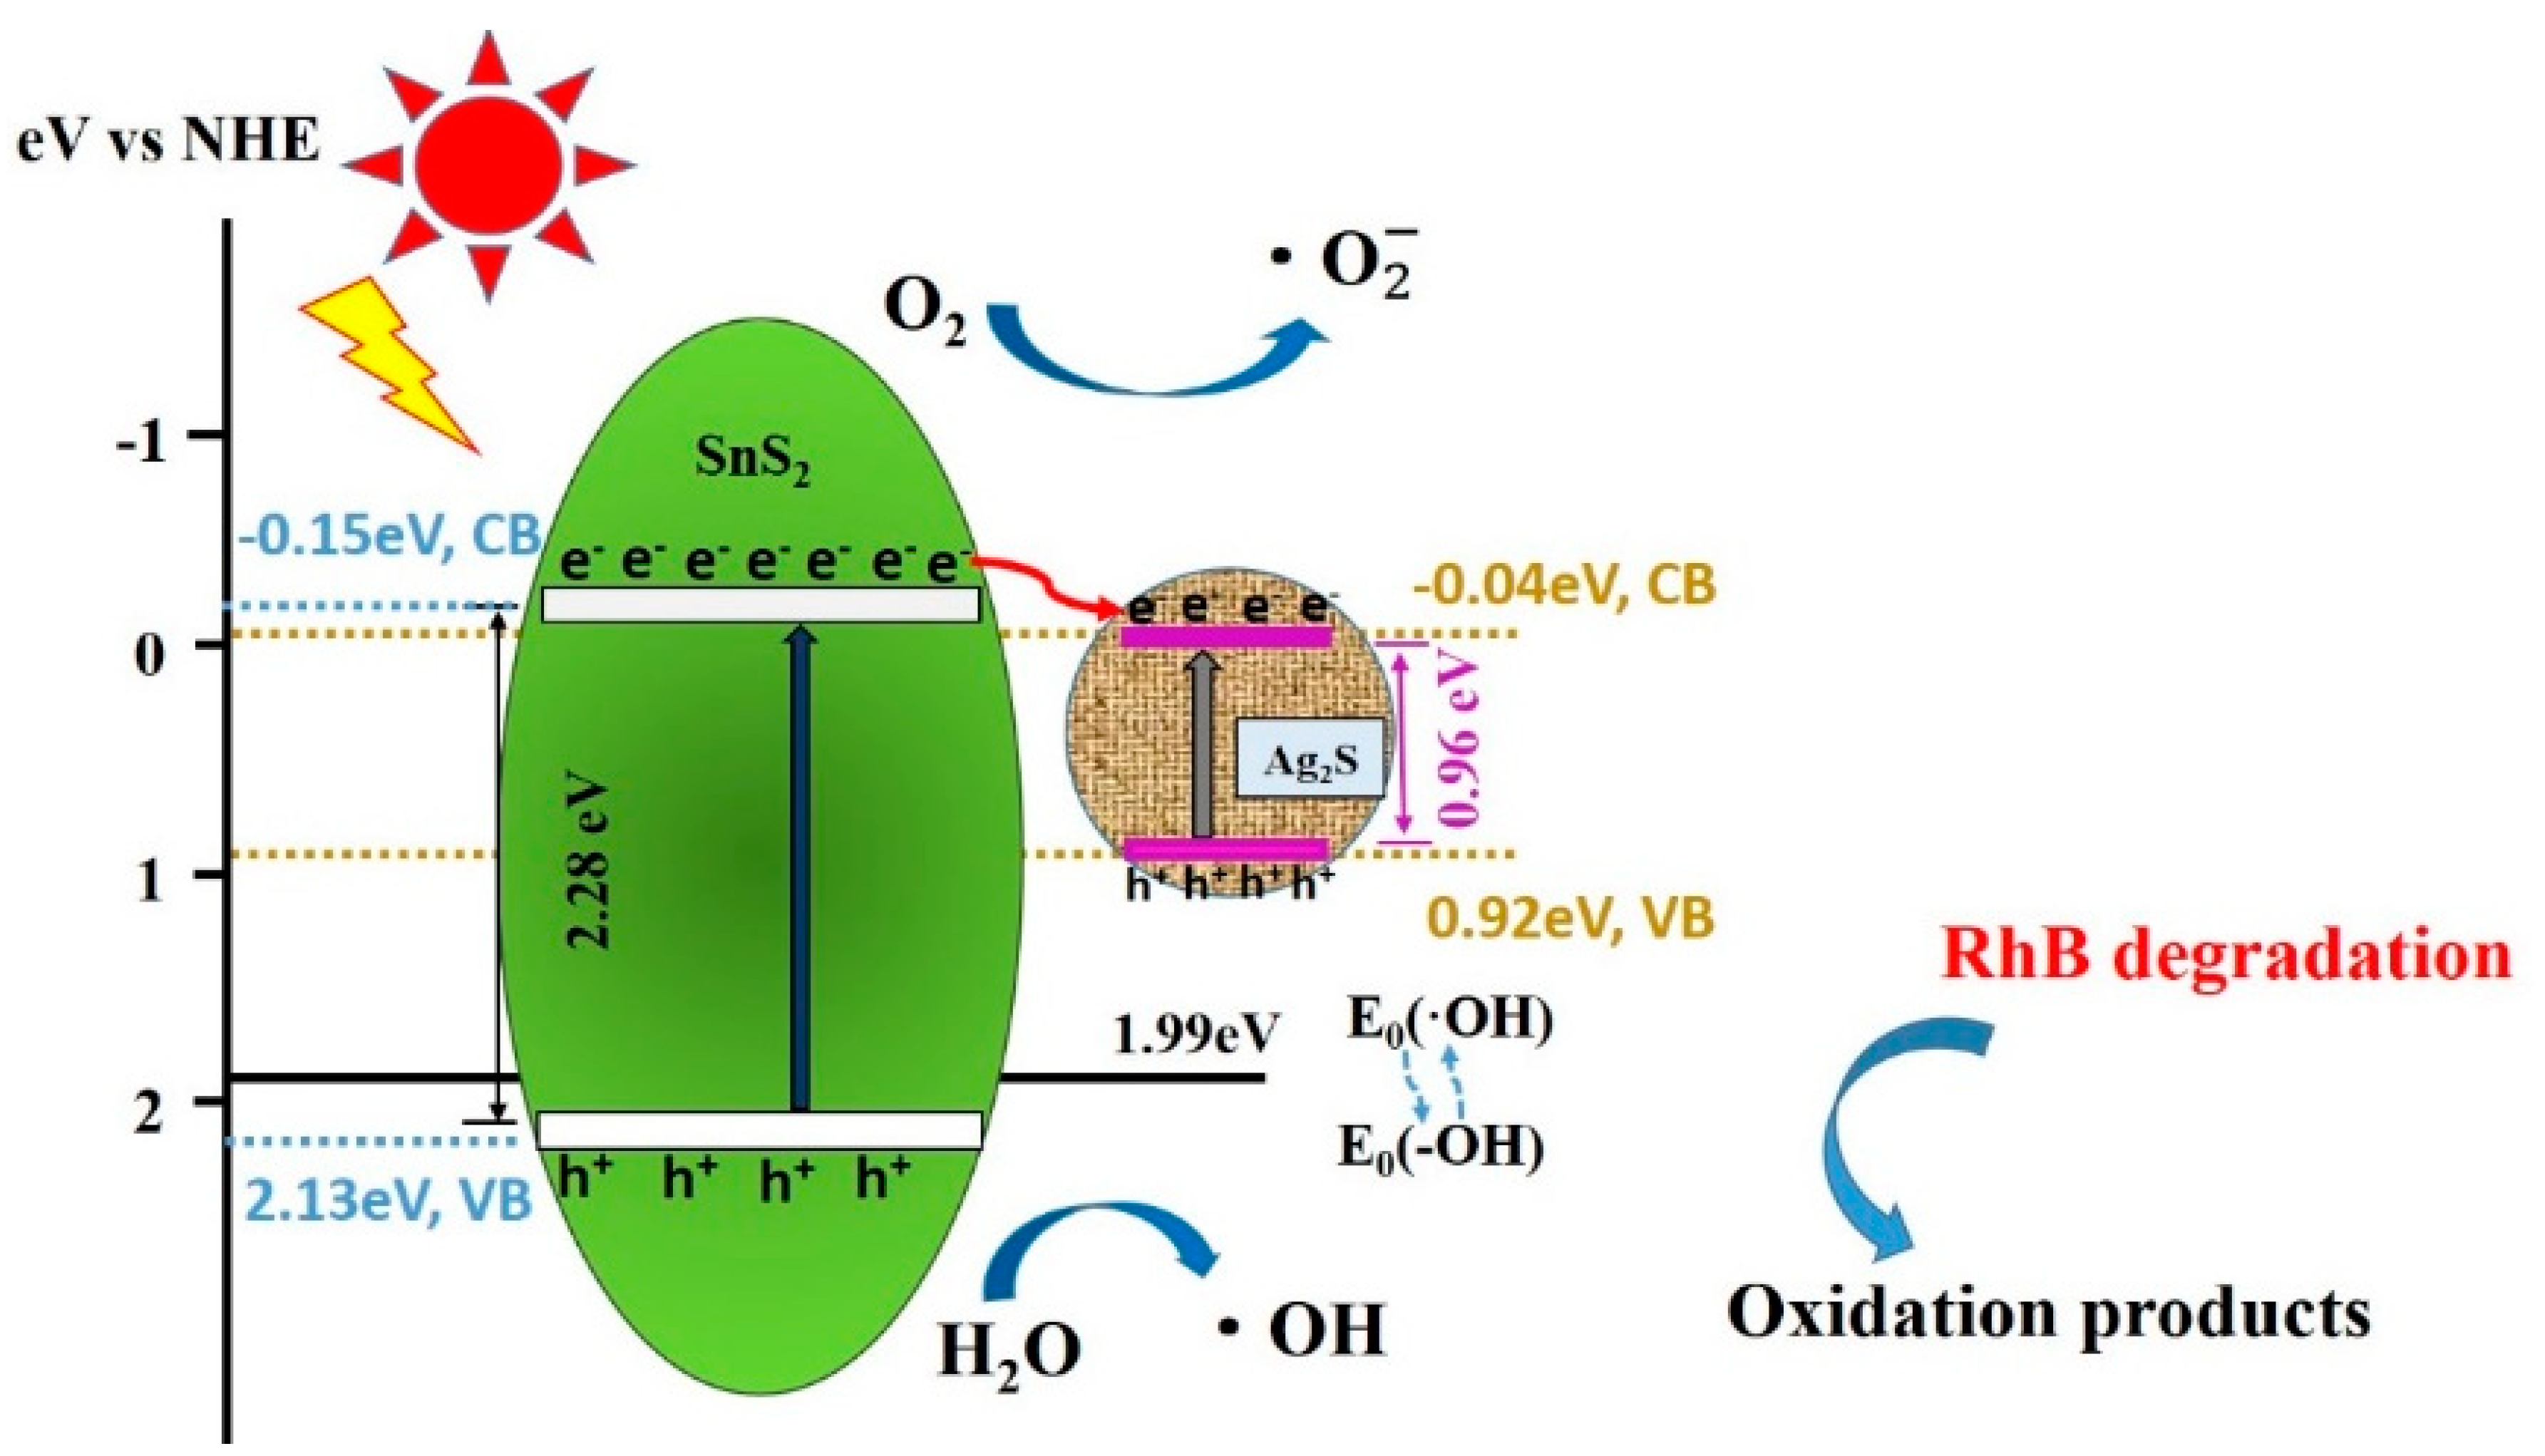
A possible mechanism of photocatalytic degradation is proposed to elucidate the enhanced catalytic activity of the Ag2S/SnS2 heterojunction composites for the dye degradation, as shown in Figure 10. The Eg of SnS2 and Ag2S is 2.28 eV and 0.96 eV, respectively.
The energy band edge position of conduction band and valence band of samples are determined by the following equation:
where, EVB and ECB are the valence band and conduction band energy, X is the electronegativity of the semiconductor, Ee is the free electron energy (4.5 eV, NHE),Eg is the sample band gap. The valence band and conduction band potentials of SnS2 and Ag2S are obtained as +2.13 /0.92 eV and −0.15/−0.04 eV vs NHE, respectively [27].
EVB = X − Ee+ 0.5Eg, ECB = EVB − Eg,
For the SnS2, most of the photogenerated electron-hole pairs rapidly recombine, and only a small number of carriers migrate to the surface of the catalyst to participate in the reaction. Under irradiation of simulated sunlight, the photogenerated electrons in the conduction band of SnS2 are excited to transfer to Ag2S, which is also conducive to recombine with the photogenerated holes in the valence band of Ag2S. Holes are generated and accumulated on the VB of SnS2, especially some of the holes directly react with dyes or organic contaminants. Since the valence band potential (2.09 eV) is higher than E0 (•OH/–OH) = 1.99 eV (vs. NHE), other holes react with the hydroxyl group (–OH) to form •OH. The free •OH oxidize and decompose organic dyes and contaminants, which is attributed to its strong oxidizing properties. Moreover, the internal electric field at the interface of the Ag2S/SnS2 heterojunction act as the driving force for the Z-scheme electron transfer. Therefore, the efficient separation and migration of electrons and holes in the Ag2S/SnS2 heterojunction complex greatly enhance the photocatalytic activity.
4. Conclusions
Ag2S quantum dots @SnS2 composites are successfully synthesised by in-situ ion exchange. The samples possess a hexagonal wurtzite structure with three-dimensional flower-like, presenting clear edges and uniform dispersion. The optical band gap of 3% Ag2S@SnS2 (2.27 eV) is most similar to that of the pure SnS2 sample (2.278 eV). Ag, Sn, and S are present in the compound at +1, +4, and −2. The PL intensity of 3% Ag2S@SnS2 shows the lowest luminescence, indicating that the heterojunction effectively promotes separation of SnS2 electron-hole pairs. The 3% Ag2S@SnS2 synthesis demonstrates the best photocatalytic activity with good cycling stability under the simulated sunlight irradiation, and the degradation rate of RhB is 96.6%. Moreover, the kapp of the 3% Ag2S@SnS2 was 4.1-times than that of the SnS2. Accordingly, the main active species are •OH and h+.
Author Contributions
W.Z. and Z.W. conceived and designed the experiments; W.Z. and J.L. performed the experiments; L.M. and X.Z. analyzed the data; W.Z. wrote the paper.
Funding
This research was supported by the National Natural Science Foundation of China (No. 51261015).
Conflicts of Interest
The authors declare no conflicts of interest.
References
- Rodriguez-Narvaez, O.M.; Peralta-Hernandez, J.M.; Goonetilleke, A.; Bandala, E.R. Treatment technologies for emerging contaminants in water: A review. Chem. Eng. J. 2017, 323, 361–380. [Google Scholar] [CrossRef]
- Zhang, X.; Zhang, P.; Wang, L.; Gao, H.; Zhao, J.; Liang, C.; Hu, J.; Shao, G. Template-oriented synthesis of monodispersed SnS2 @SnO2 hetero-nanoflowers for Cr (VI) photoreduction. Appl. Catal. B 2016, 192, 17–25. [Google Scholar] [CrossRef]
- Lei, Y.; Song, S.; Fan, W.; Xing, Y.; Zhang, H. Facile Synthesis and Assemblies of Flowerlike SnS2 and In3+ -Doped SnS2: Hierarchical Structures and Their Enhanced Photocatalytic Property. J. Phys. Chem. C 2009, 113, 1280–1285. [Google Scholar] [CrossRef]
- Shown, I.; Samireddi, S.; Chang, Y.-C.; Putikam, R.; Chang, P.-H.; Sabbah, A.; Fu, F.-Y.; Chen, W.-F.; Wu, C.-I.; Yu, T.-Y.; et al. Carbon-doped SnS2 nanostructure as a high-efficiency solar fuel catalyst under visible light. Nat. Commun. 2018, 9. [Google Scholar] [CrossRef] [PubMed]
- Chen, L.; Chen, M.; Jiang, D.; Xie, J. A facile strategy for SnS2 /g-C3N4 heterojunction composite and the mechanism in photocatalytic degradation of MO. J. Mol. Catal. A Chem. 2016, 425, 174–182. [Google Scholar] [CrossRef]
- Derikvandi, H.; Nezamzadeh-Ejhieh, A. A comprehensive study on enhancement and optimization of photocatalytic activity of ZnS and SnS2: Response Surface Methodology (RSM), n-n heterojunction, supporting and nanoparticles study. J. Photochem. Photobiol. A 2017, 348, 68–78. [Google Scholar] [CrossRef]
- Gao, X.; Huang, G.; Gao, H.; Pan, C.; Wang, H.; Yan, J.; Liu, Y.; Qiu, H.; Ma, N.; Gao, J. Facile fabrication of Bi2S3/SnS2 heterojunction photocatalysts with efficient photocatalytic activity under visible light. J. Alloys Compd. 2016, 674, 98–108. [Google Scholar] [CrossRef]
- Shen, S.; Yao, Y.; Wang, B.; Chang, Y.; Zhi, L. Synthesis of SnS2 /SnS Heterojunction and Their Enhanced Photocatalytic Properties Under Visible Light. Sci. Adv. Mater. 2015, 7, 1071–1075. [Google Scholar] [CrossRef]
- Amroun, M.N.; Khadraoui, M.; Miloua, R.; Kebbab, Z.; Sahraoui, K. Investigation on the structural, optical and electrical properties of mixed SnS2-CdS thin films. Optik 2017, 131, 152–164. [Google Scholar] [CrossRef]
- Mu, J.; Miao, H.; Liu, E.; Chen, L.; Feng, J.; Han, T.; Gao, Y.; Fan, J.; Hu, X. Using Al2O3 defect levels to enhance the photoelectrocatalytic activity of SnS 2 nanosheets. Ceram. Int. 2017, 43, 4992–5001. [Google Scholar] [CrossRef]
- Zhang, Y.C.; Yao, L.; Zhang, G.; Dionysiou, D.D.; Li, J.; Du, X. One-step hydrothermal synthesis of high-performance visible-light-driven SnS2/SnO2 nanoheterojunction photocatalyst for the reduction of aqueous Cr(VI). Appl. Catal. B 2014, 144, 730–738. [Google Scholar] [CrossRef]
- Yuan, X.; Wang, H.; Wu, Y.; Chen, X.; Zeng, G.; Leng, L.; Zhang, C. A novel SnS2–MgFe2O4/reduced graphene oxide flower-like photocatalyst: Solvothermal synthesis, characterization and improved visible-light photocatalytic activity. Catal. Commun. 2015, 61, 62–66. [Google Scholar] [CrossRef]
- Chen, J.; Liu, S.; Zhang, L.; Chen, N. New SnS2/La2Ti2O7 heterojunction photocatalyst with enhanced visible-light activity. Mater. Lett. 2015, 150, 44–47. [Google Scholar] [CrossRef]
- Qiu, F.; Li, W.; Wang, F.; Li, H.; Liu, X.; Sun, J. In-situ synthesis of novel Z-scheme SnS2 /BiOBr photocatalysts with superior photocatalytic efficiency under visible light. J. Colloid Interface Sci. 2017, 493, 1–9. [Google Scholar] [CrossRef] [PubMed]
- Meng, H.; Wang, T.; Chen, H.; Liu, Y.; Yu, X.; Zhu, Y.; Zhang, Y. BiOCl/SnS2 Core-Shell Photocatalyst for the Degradation of Organic Pollutants. Nano 2016, 11, 1650087. [Google Scholar] [CrossRef]
- Zhang, Y.; Zhao, N.; Qin, Y.; Wu, F.; Xu, Z.; Lan, T.; Cheng, Z.; Zhao, P.; Liu, H. Affibody-functionalized Ag2S quantum dots for photoacoustic imaging of epidermal growth factor receptor overexpressed tumors. Nanoscale 2018, 10, 16581–16590. [Google Scholar] [CrossRef]
- Jing, L.; Xu, Y.; Zhang, M.; Xie, M.; Xu, H.; He, M.; Liu, J.; Huang, S.; Li, H. Novel Ag2S quantum dot modified 3D flower-like SnS 2 composites for photocatalytic and photoelectrochemical applications. Inorg. Chem. Front. 2018, 5, 63–72. [Google Scholar] [CrossRef]
- Zhao, W.; Wei, Z.; Zhang, L.; Wu, X.; Wang, X. Cr doped SnS2 nanoflowers: Preparation, characterization and photocatalytic decolorization. Mater. Sci. Semicond. Process. 2018, 88, 173–180. [Google Scholar] [CrossRef]
- Liu, Y.; Geng, P.; Wang, J.; Yang, Z.; Lu, H.; Hai, J.; Lu, Z.; Fan, D.; Li, M. In-situ ion-exchange synthesis Ag2S modified SnS2 nanosheets toward highly photocurrent response and photocatalytic activity. J. Colloid Interface Sci. 2018, 512, 784–791. [Google Scholar] [CrossRef]
- Kar, S.; Chaudhuri, S. Synthesis and optical properties of single and bicrystalline ZnS nanoribbons. Chem. Phys. Lett. 2005, 414, 40–46. [Google Scholar] [CrossRef]
- Biswas, S.; Kar, S.; Chaudhuri, S. Optical and Magnetic Properties of Manganese-Incorporated Zinc Sulfide Nanorods Synthesized by a Solvothermal Process. J. Phys. Chem. B 2005, 109, 17526–17530. [Google Scholar] [CrossRef] [PubMed]
- Khan, W.S.; Cao, C.; Ali, Z.; Butt, F.K.; Ahmad Niaz, N.; Baig, A.; ud Din, R.; Farooq, M.H.; Wang, F.; ul Ain, Q. Solvo-solid preparation of Zn3N2 hollow structures; their PL yellow emission and hydrogen absorption characteristics. Mater. Lett. 2011, 65, 2127–2129. [Google Scholar] [CrossRef]
- Deshpande, N.G.; Sagade, A.A.; Gudage, Y.G.; Lokhande, C.D.; Sharma, R. Growth and characterization of tin disulfide (SnS2) thin film deposited by successive ionic layer adsorption and reaction (SILAR) technique. J. Alloys Compd. 2007, 436, 421–426. [Google Scholar] [CrossRef]
- Ye, Y.; Yang, H.; Wang, X.; Feng, W. Photocatalytic, Fenton and photo-Fenton degradation of RhB over Z-scheme g-C3 N 4 /LaFeO 3 heterojunction photocatalysts. Mater. Sci. Semicond. Process. 2018, 82, 14–24. [Google Scholar] [CrossRef]
- Nosaka, Y.; Nosaka, A.Y. Generation and Detection of Reactive Oxygen Species in Photocatalysis. Chem. Rev. 2017, 117, 11302–11336. [Google Scholar] [CrossRef] [PubMed]
- Di Credico, B.; Bellobono, I.R.; D’Arienzo, M.; Fumagalli, D.; Redaelli, M.; Scotti, R.; Morazzoni, F. Efficacy of the Reactive Oxygen Species Generated by Immobilized TiO2 in the Photocatalytic Degradation of Diclofenac. Int. J. Photoenergy 2015, 2015, 1–13. [Google Scholar] [CrossRef]
- Di Credico, B.; Redaelli, M.; Bellardita, M.; Calamante, M.; Cepek, C.; Cobani, E.; D’Arienzo, M.; Evangelisti, C.; Marelli, M.; Moret, M.; et al. Step-by-Step Growth of HKUST-1 on Functionalized TiO2 Surface: An Efficient Material for CO2 Capture and Solar Photoreduction. Catalysts 2018, 8, 353. [Google Scholar] [CrossRef]
Figure 1.
X-ray diffraction pattern of pure SnS2 and Ag2S@SnS2 composites.
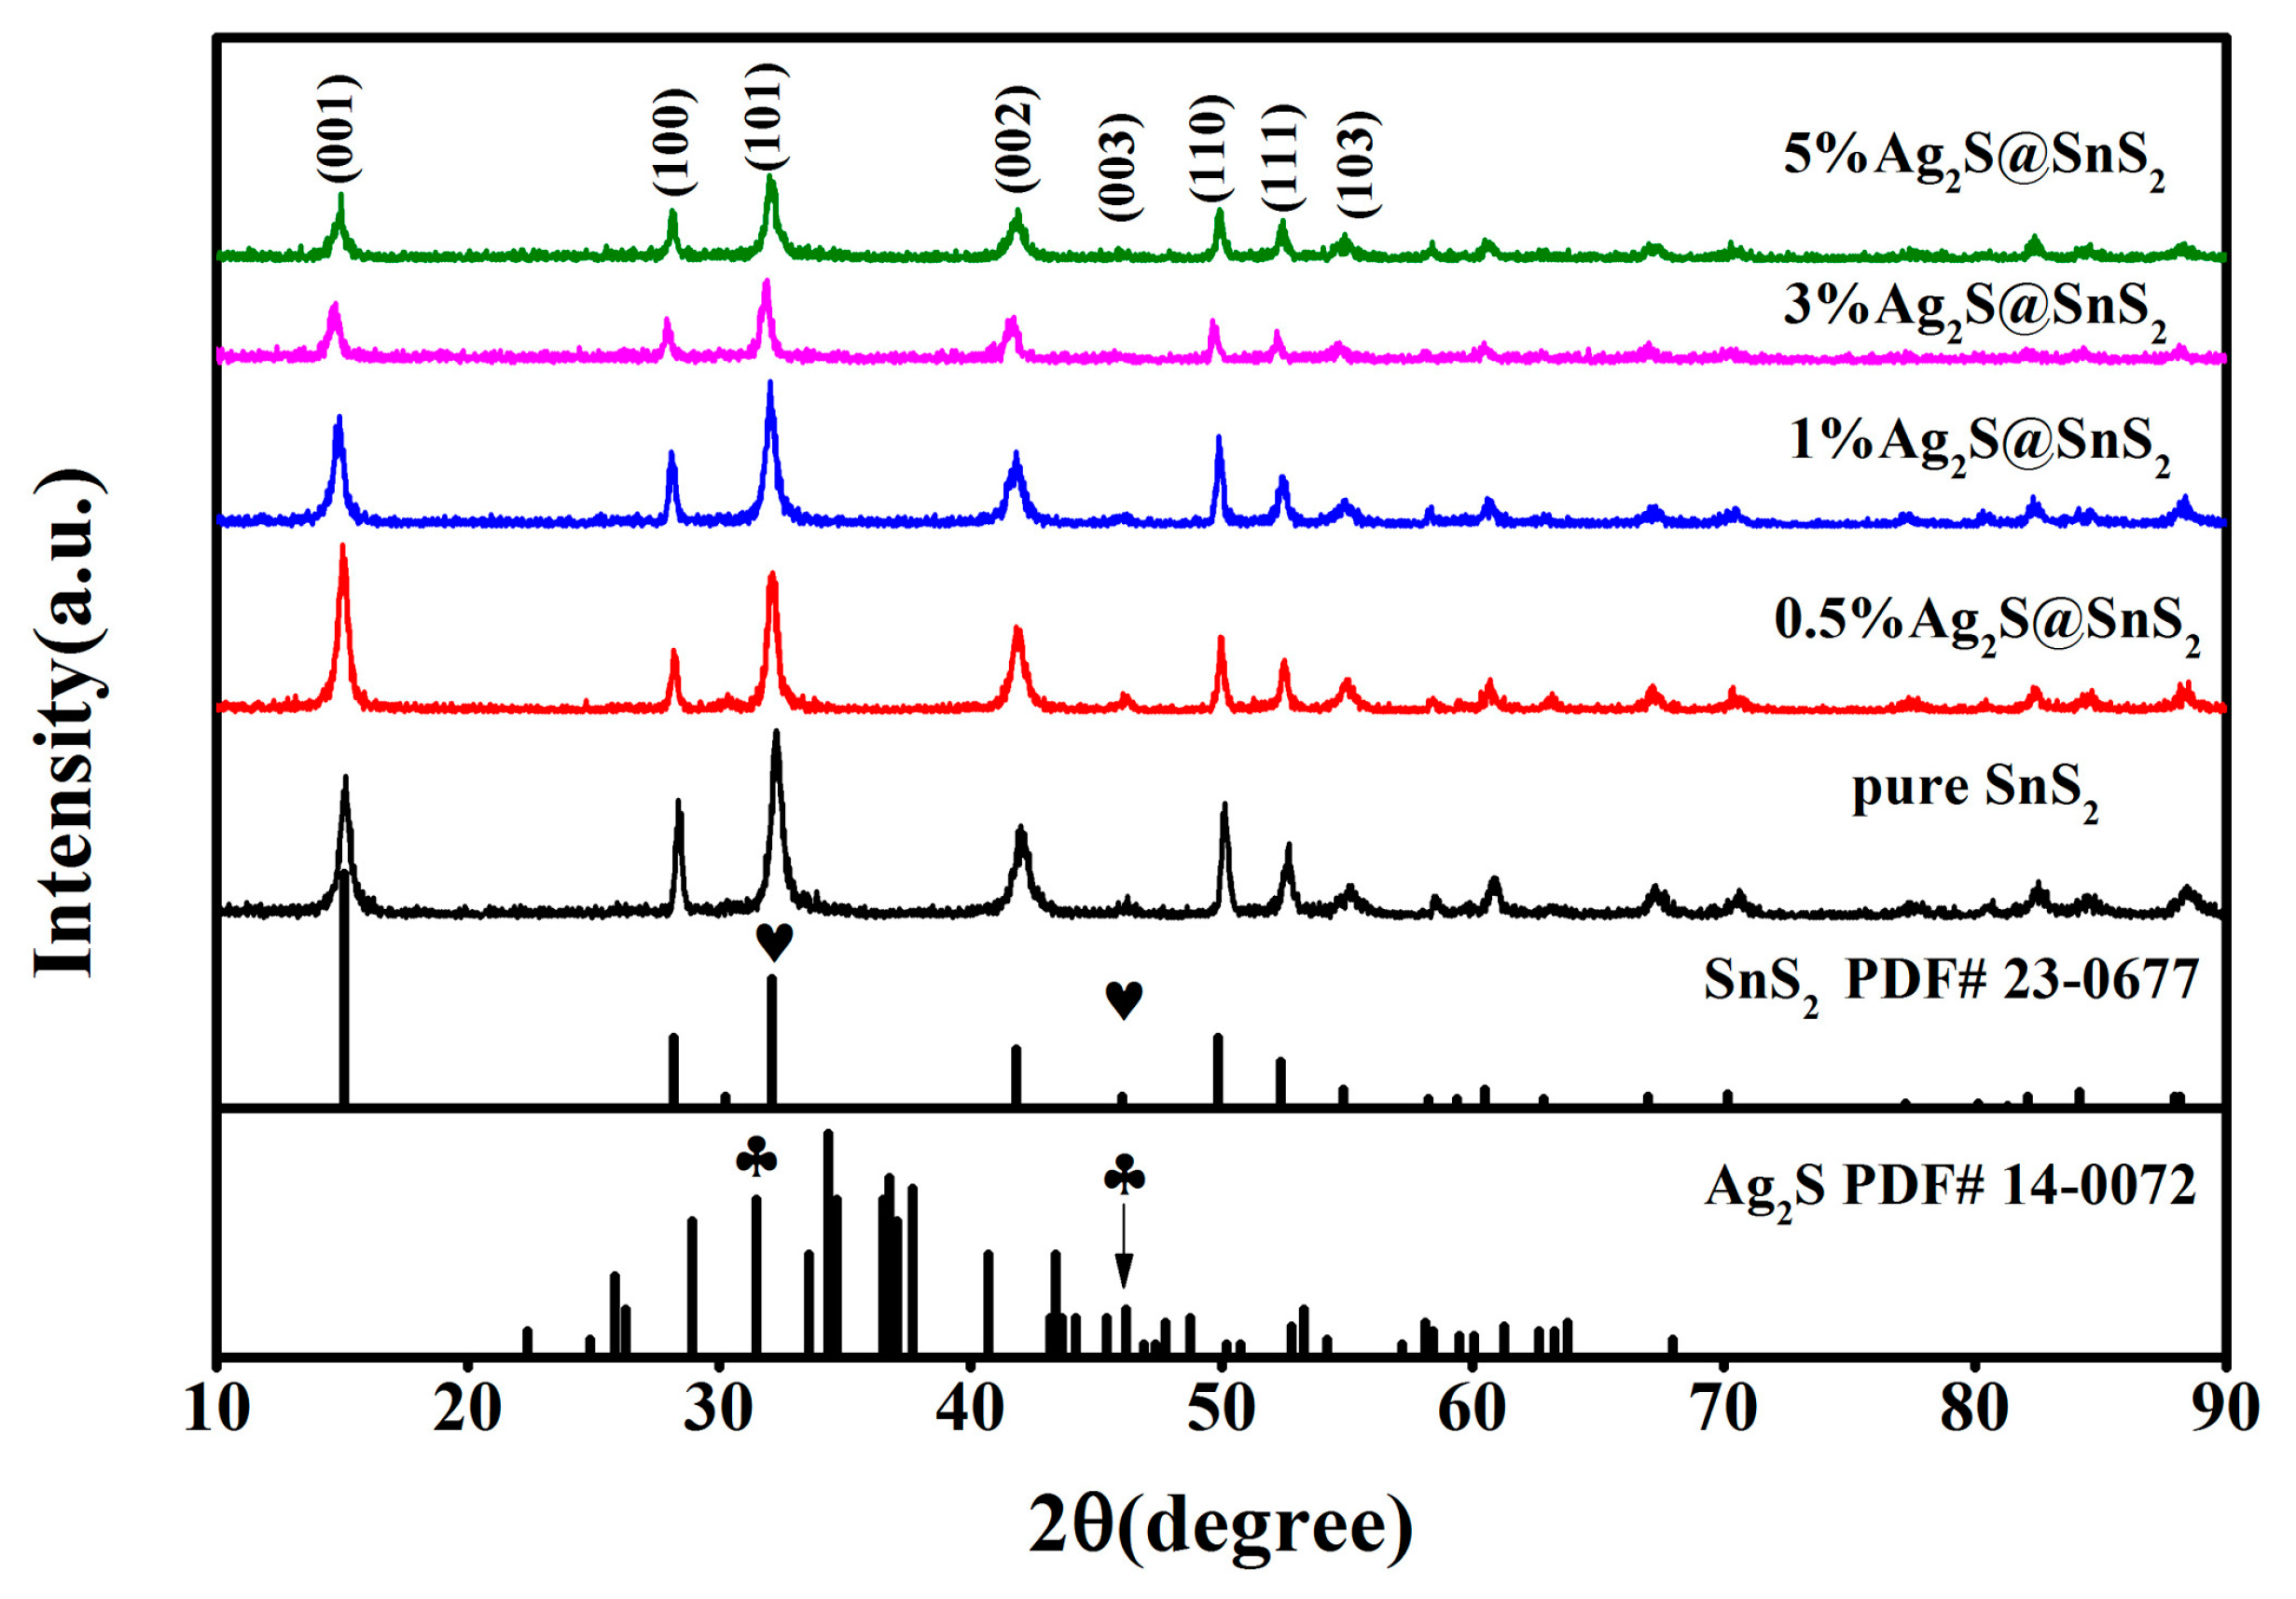
Figure 2.
The scanning electron microscope images (a), X-ray energy dispersive spectrum (b), high resolution transmission electron microscope and selected electron diffraction pattern (c–e) of 3% Ag2S@SnS2 composite.
Figure 2.
The scanning electron microscope images (a), X-ray energy dispersive spectrum (b), high resolution transmission electron microscope and selected electron diffraction pattern (c–e) of 3% Ag2S@SnS2 composite.

Figure 3.
The UV-Vis absorption spectrum (a), [αhυ]2-hυ curve (b) of pure SnS2 and Ag2S@SnS2 composites.
Figure 3.
The UV-Vis absorption spectrum (a), [αhυ]2-hυ curve (b) of pure SnS2 and Ag2S@SnS2 composites.
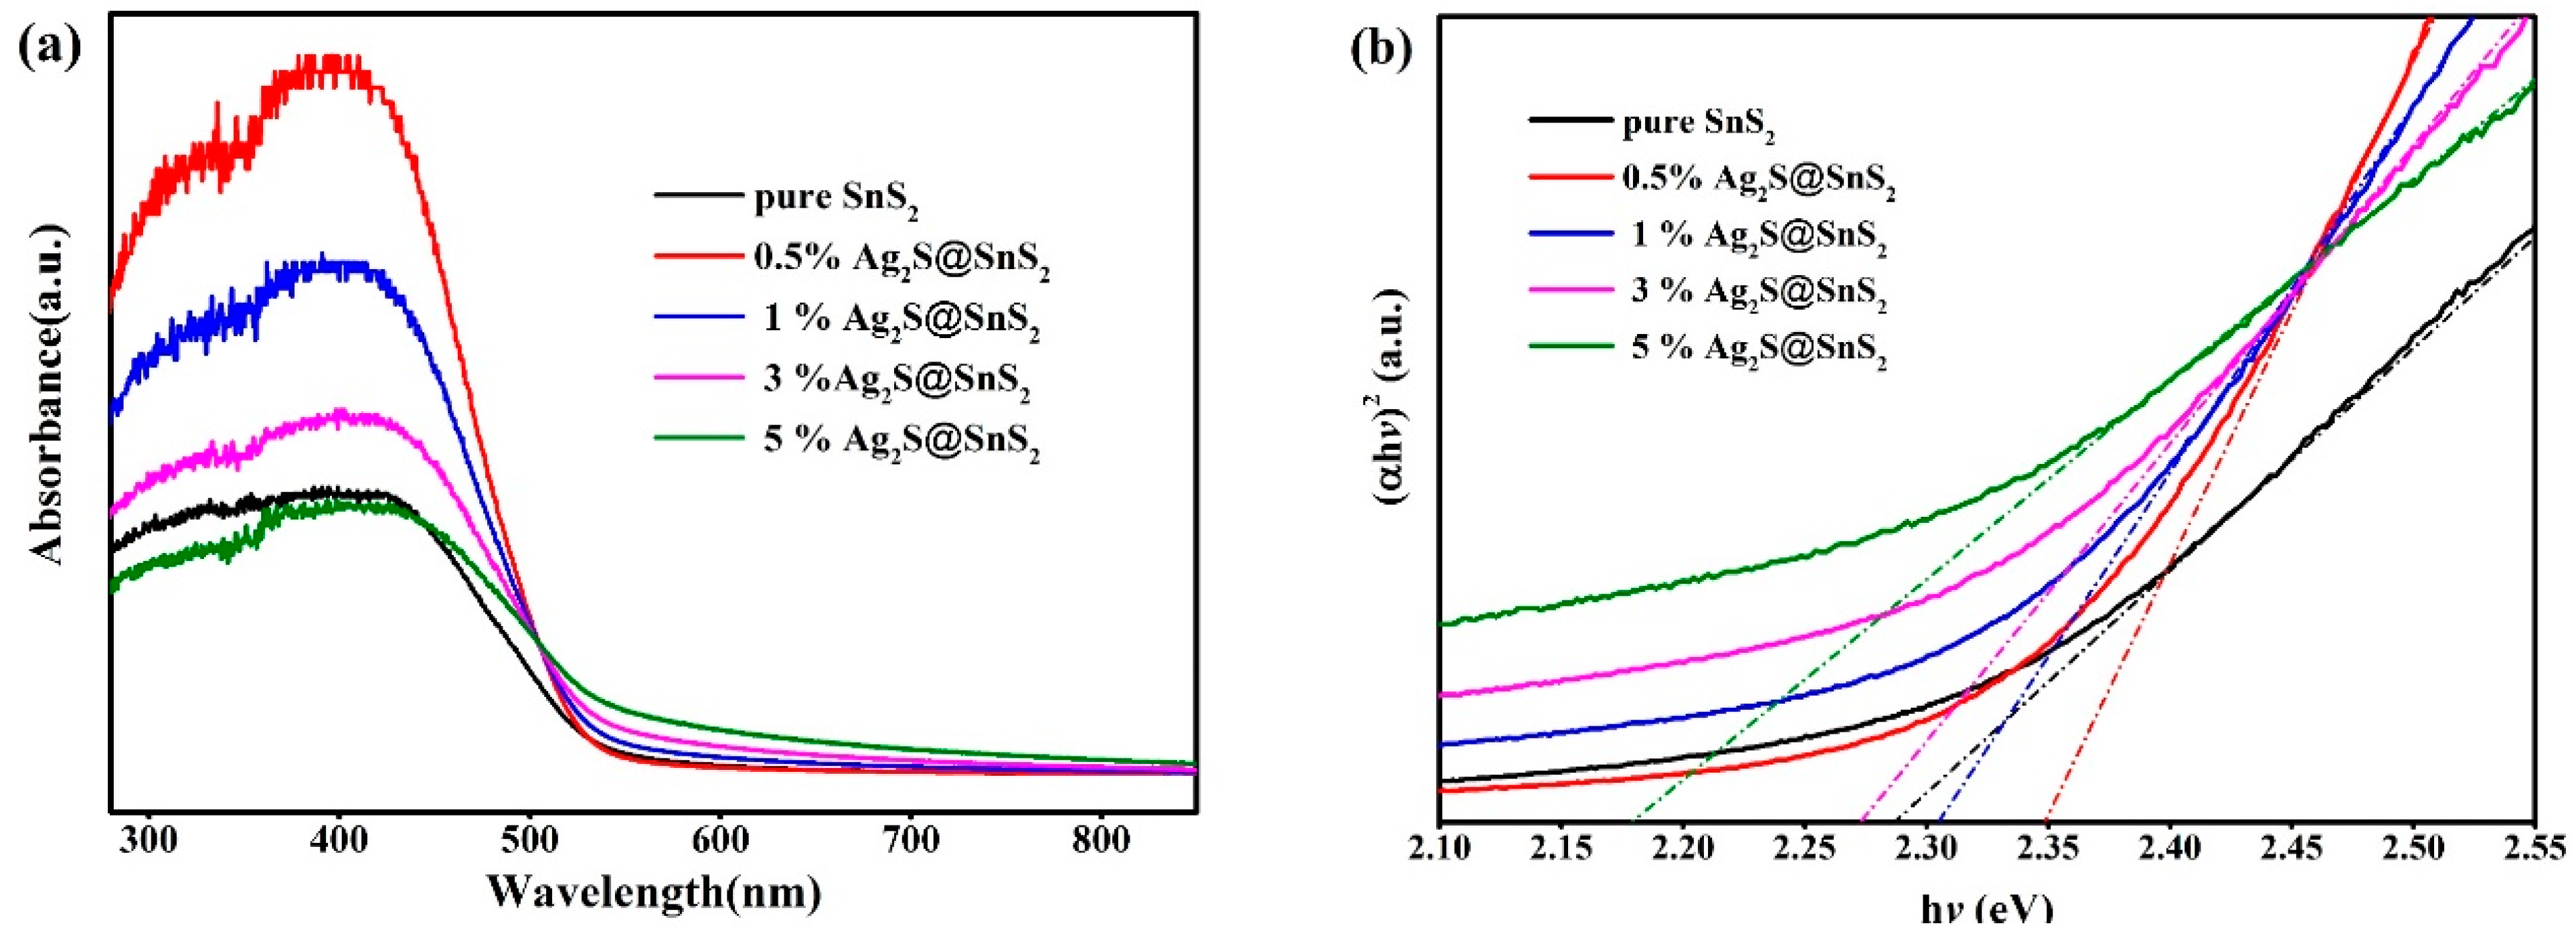
Figure 4.
The X-ray photoelectron spectroscopy of 3% Ag2S@SnS2 composite.
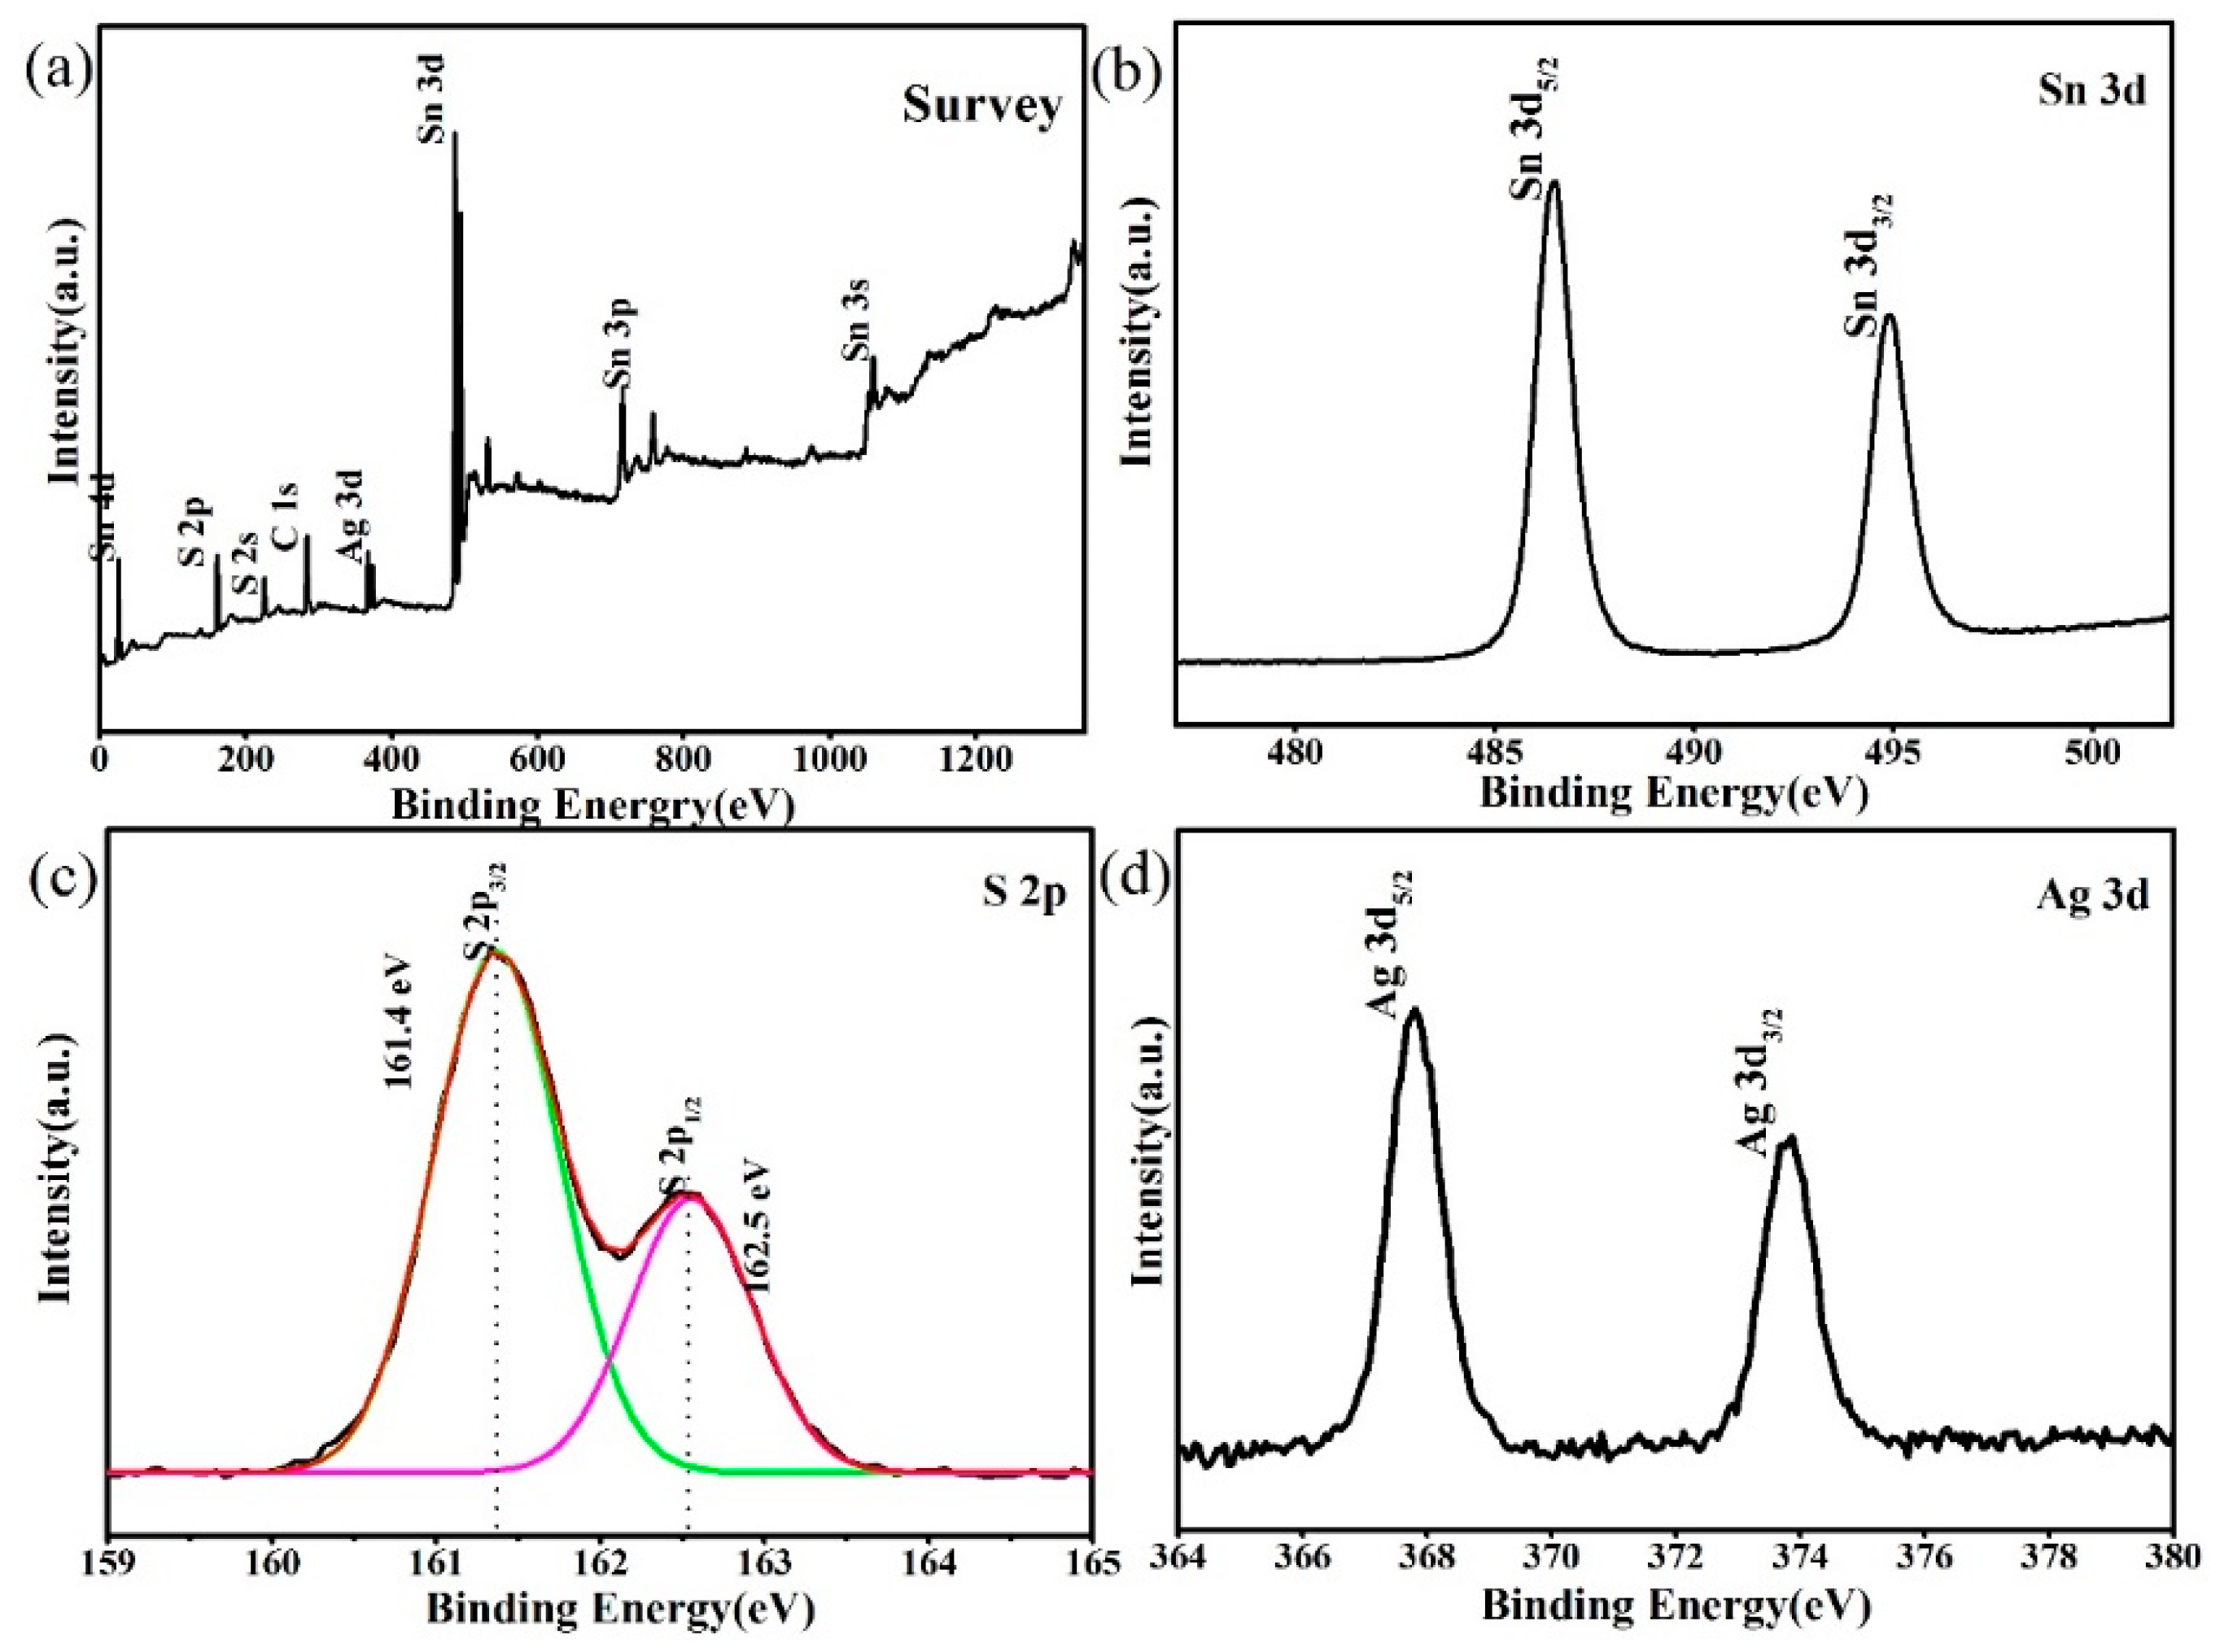
Figure 5.
The photoluminescence spectrum of pure SnS2 and 3% Ag2S@SnS2 composite (a), Locally fitted spectrum of pure SnS2 nanoflowers (b).
Figure 5.
The photoluminescence spectrum of pure SnS2 and 3% Ag2S@SnS2 composite (a), Locally fitted spectrum of pure SnS2 nanoflowers (b).
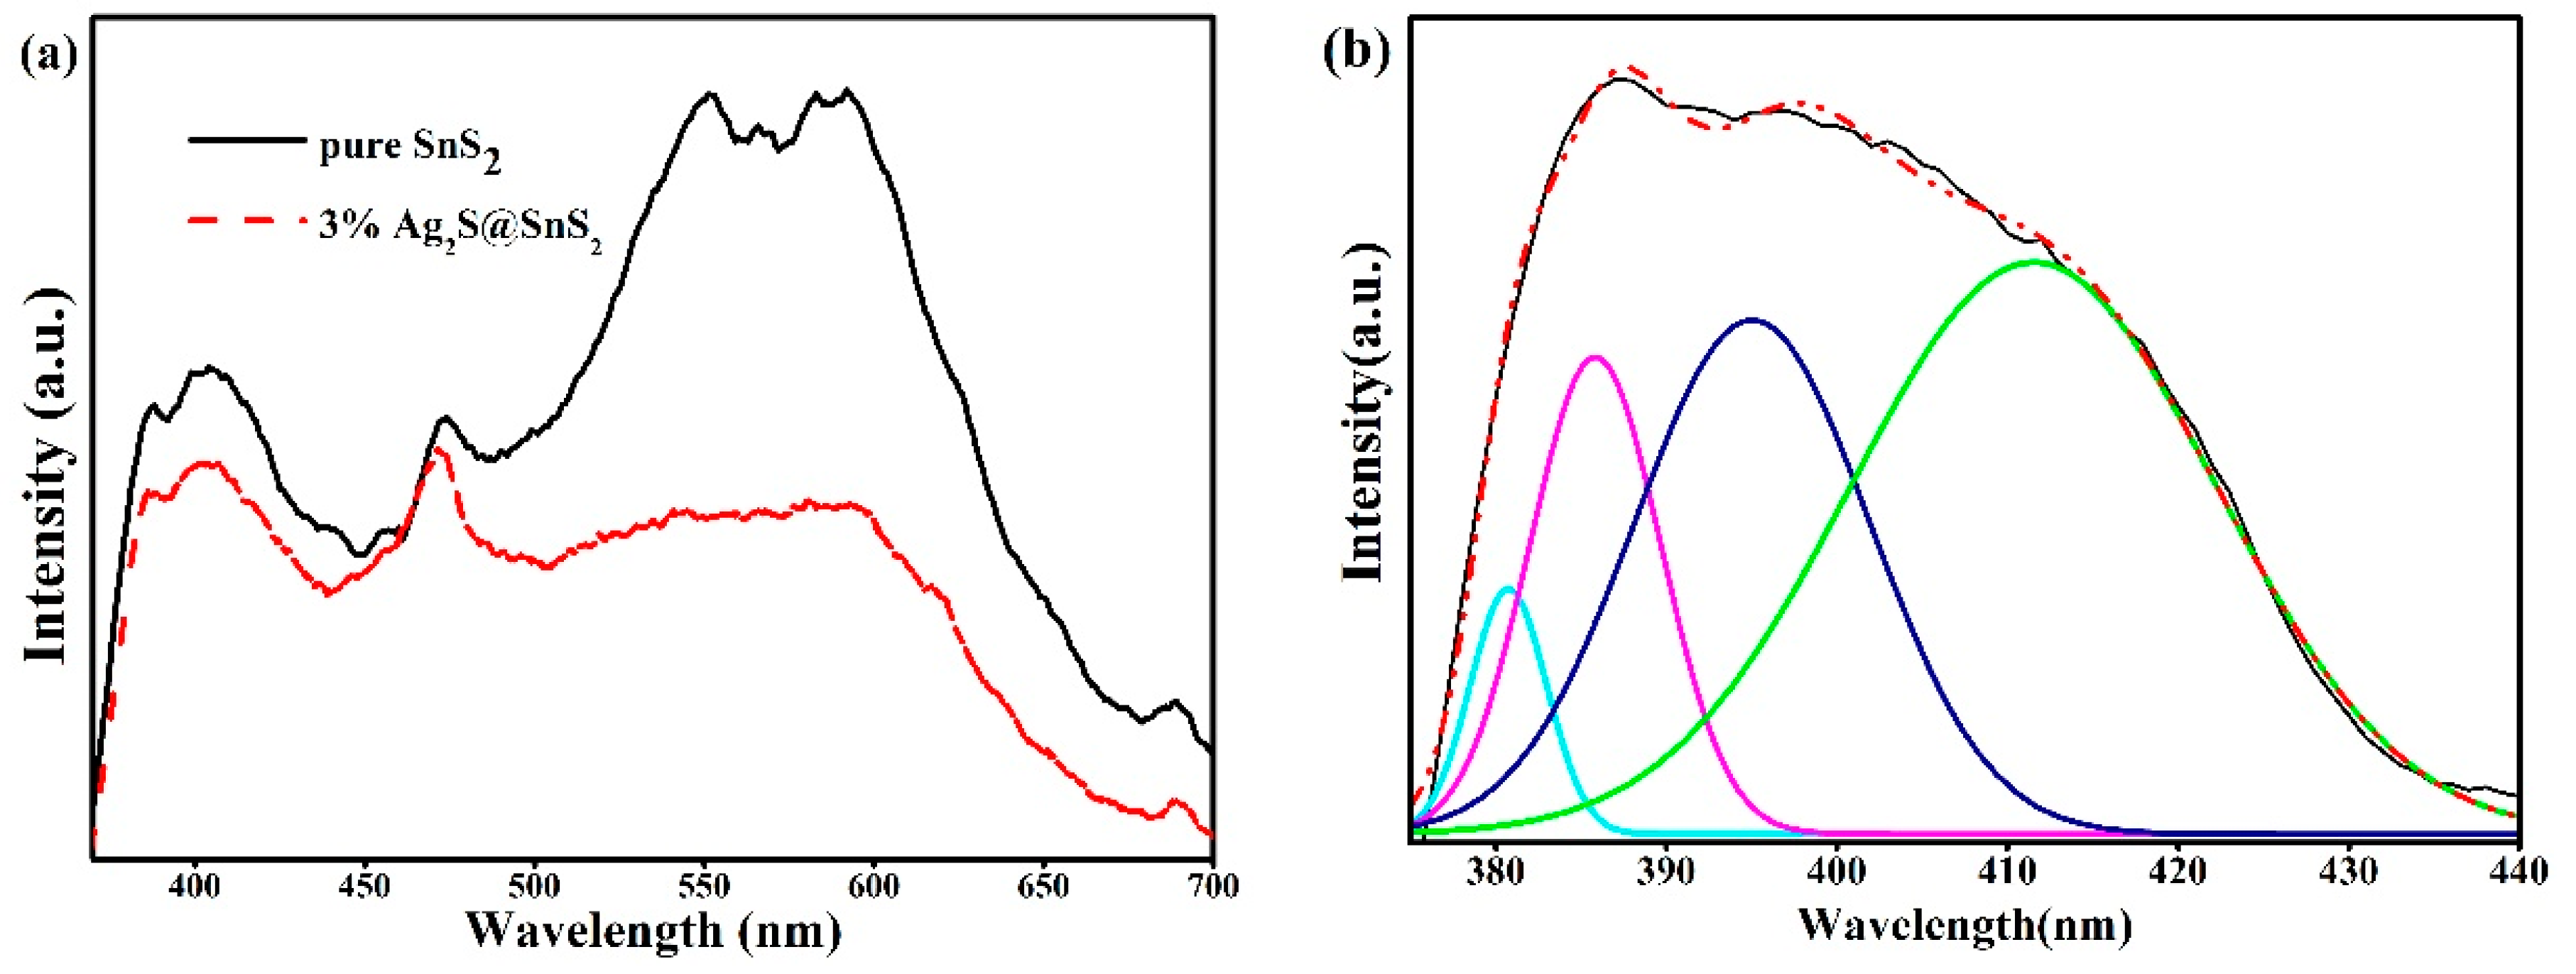
Figure 6.
The Commission International DeI’Eclairage(CIE) chromaticity diagram of pure SnS2 and Ag2S@SnS2 composites.
Figure 6.
The Commission International DeI’Eclairage(CIE) chromaticity diagram of pure SnS2 and Ag2S@SnS2 composites.
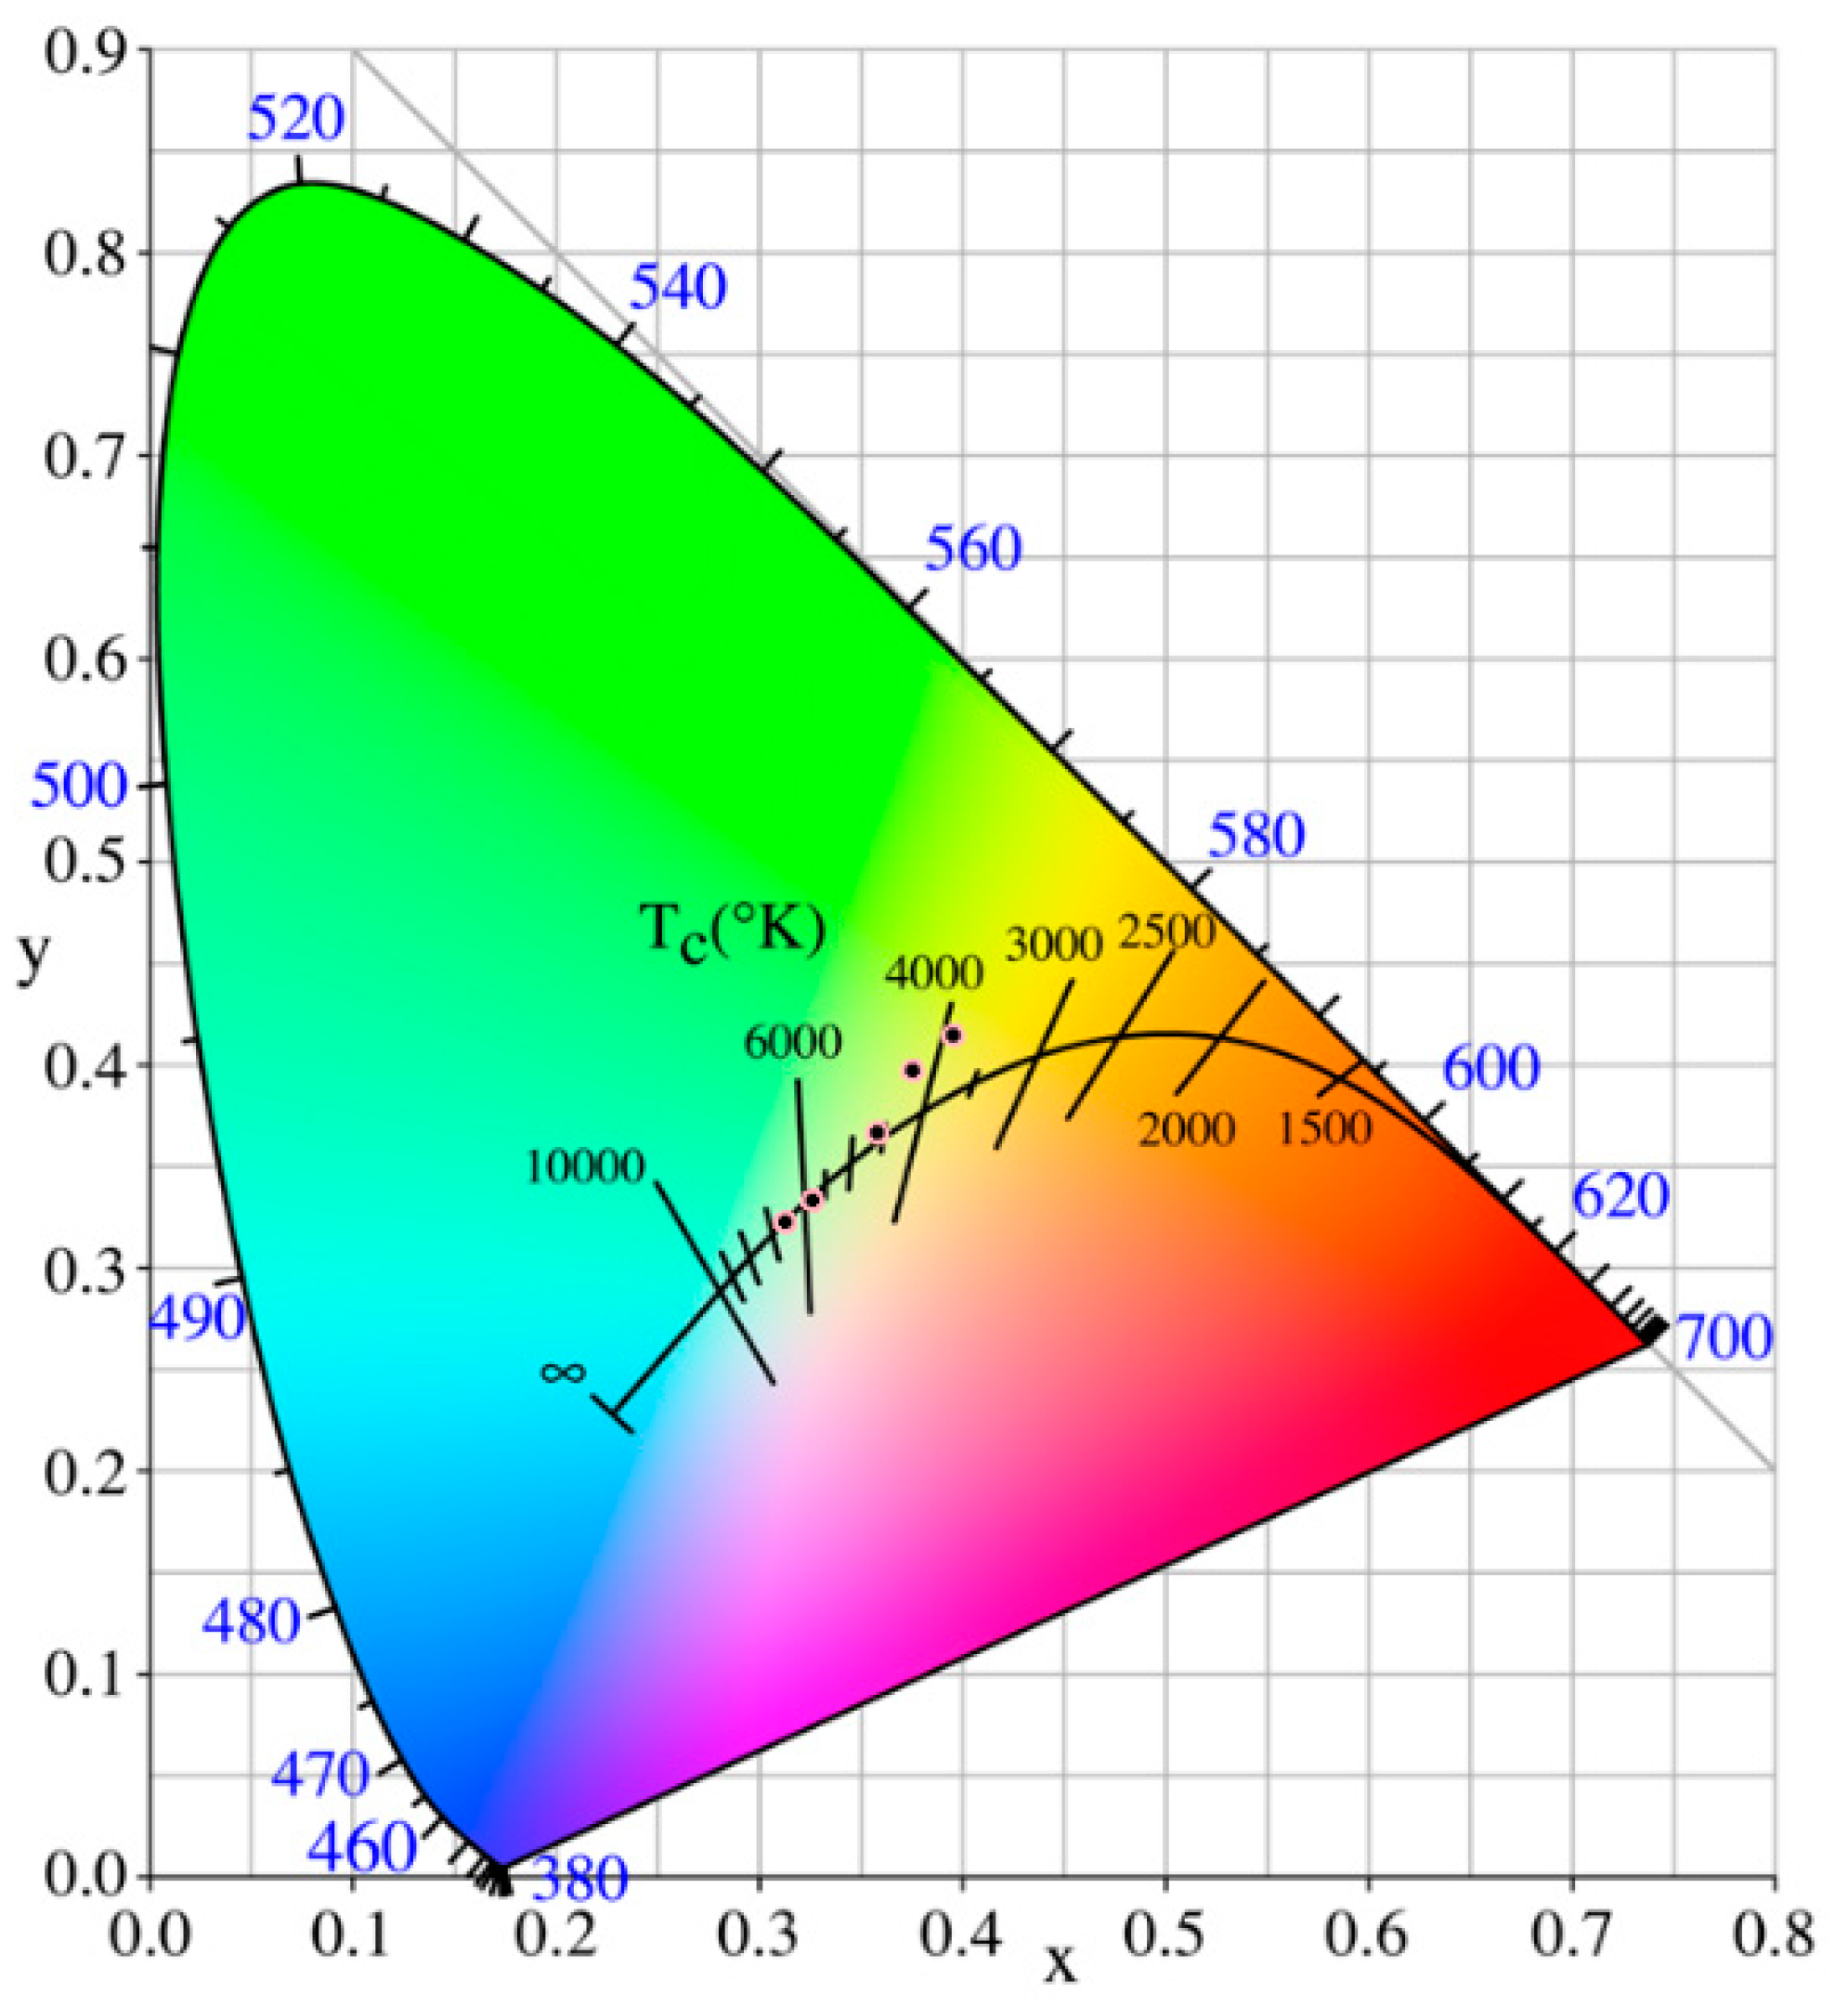
Figure 7.
The photocatalytic degradation of RhB over time (a); the first-order kinetic curve (b) for pure SnS2 and Ag2S@SnS2 composites.
Figure 7.
The photocatalytic degradation of RhB over time (a); the first-order kinetic curve (b) for pure SnS2 and Ag2S@SnS2 composites.

Figure 8.
The photocatalytic cycle stability of 3% Ag2S@SnS2 composite.
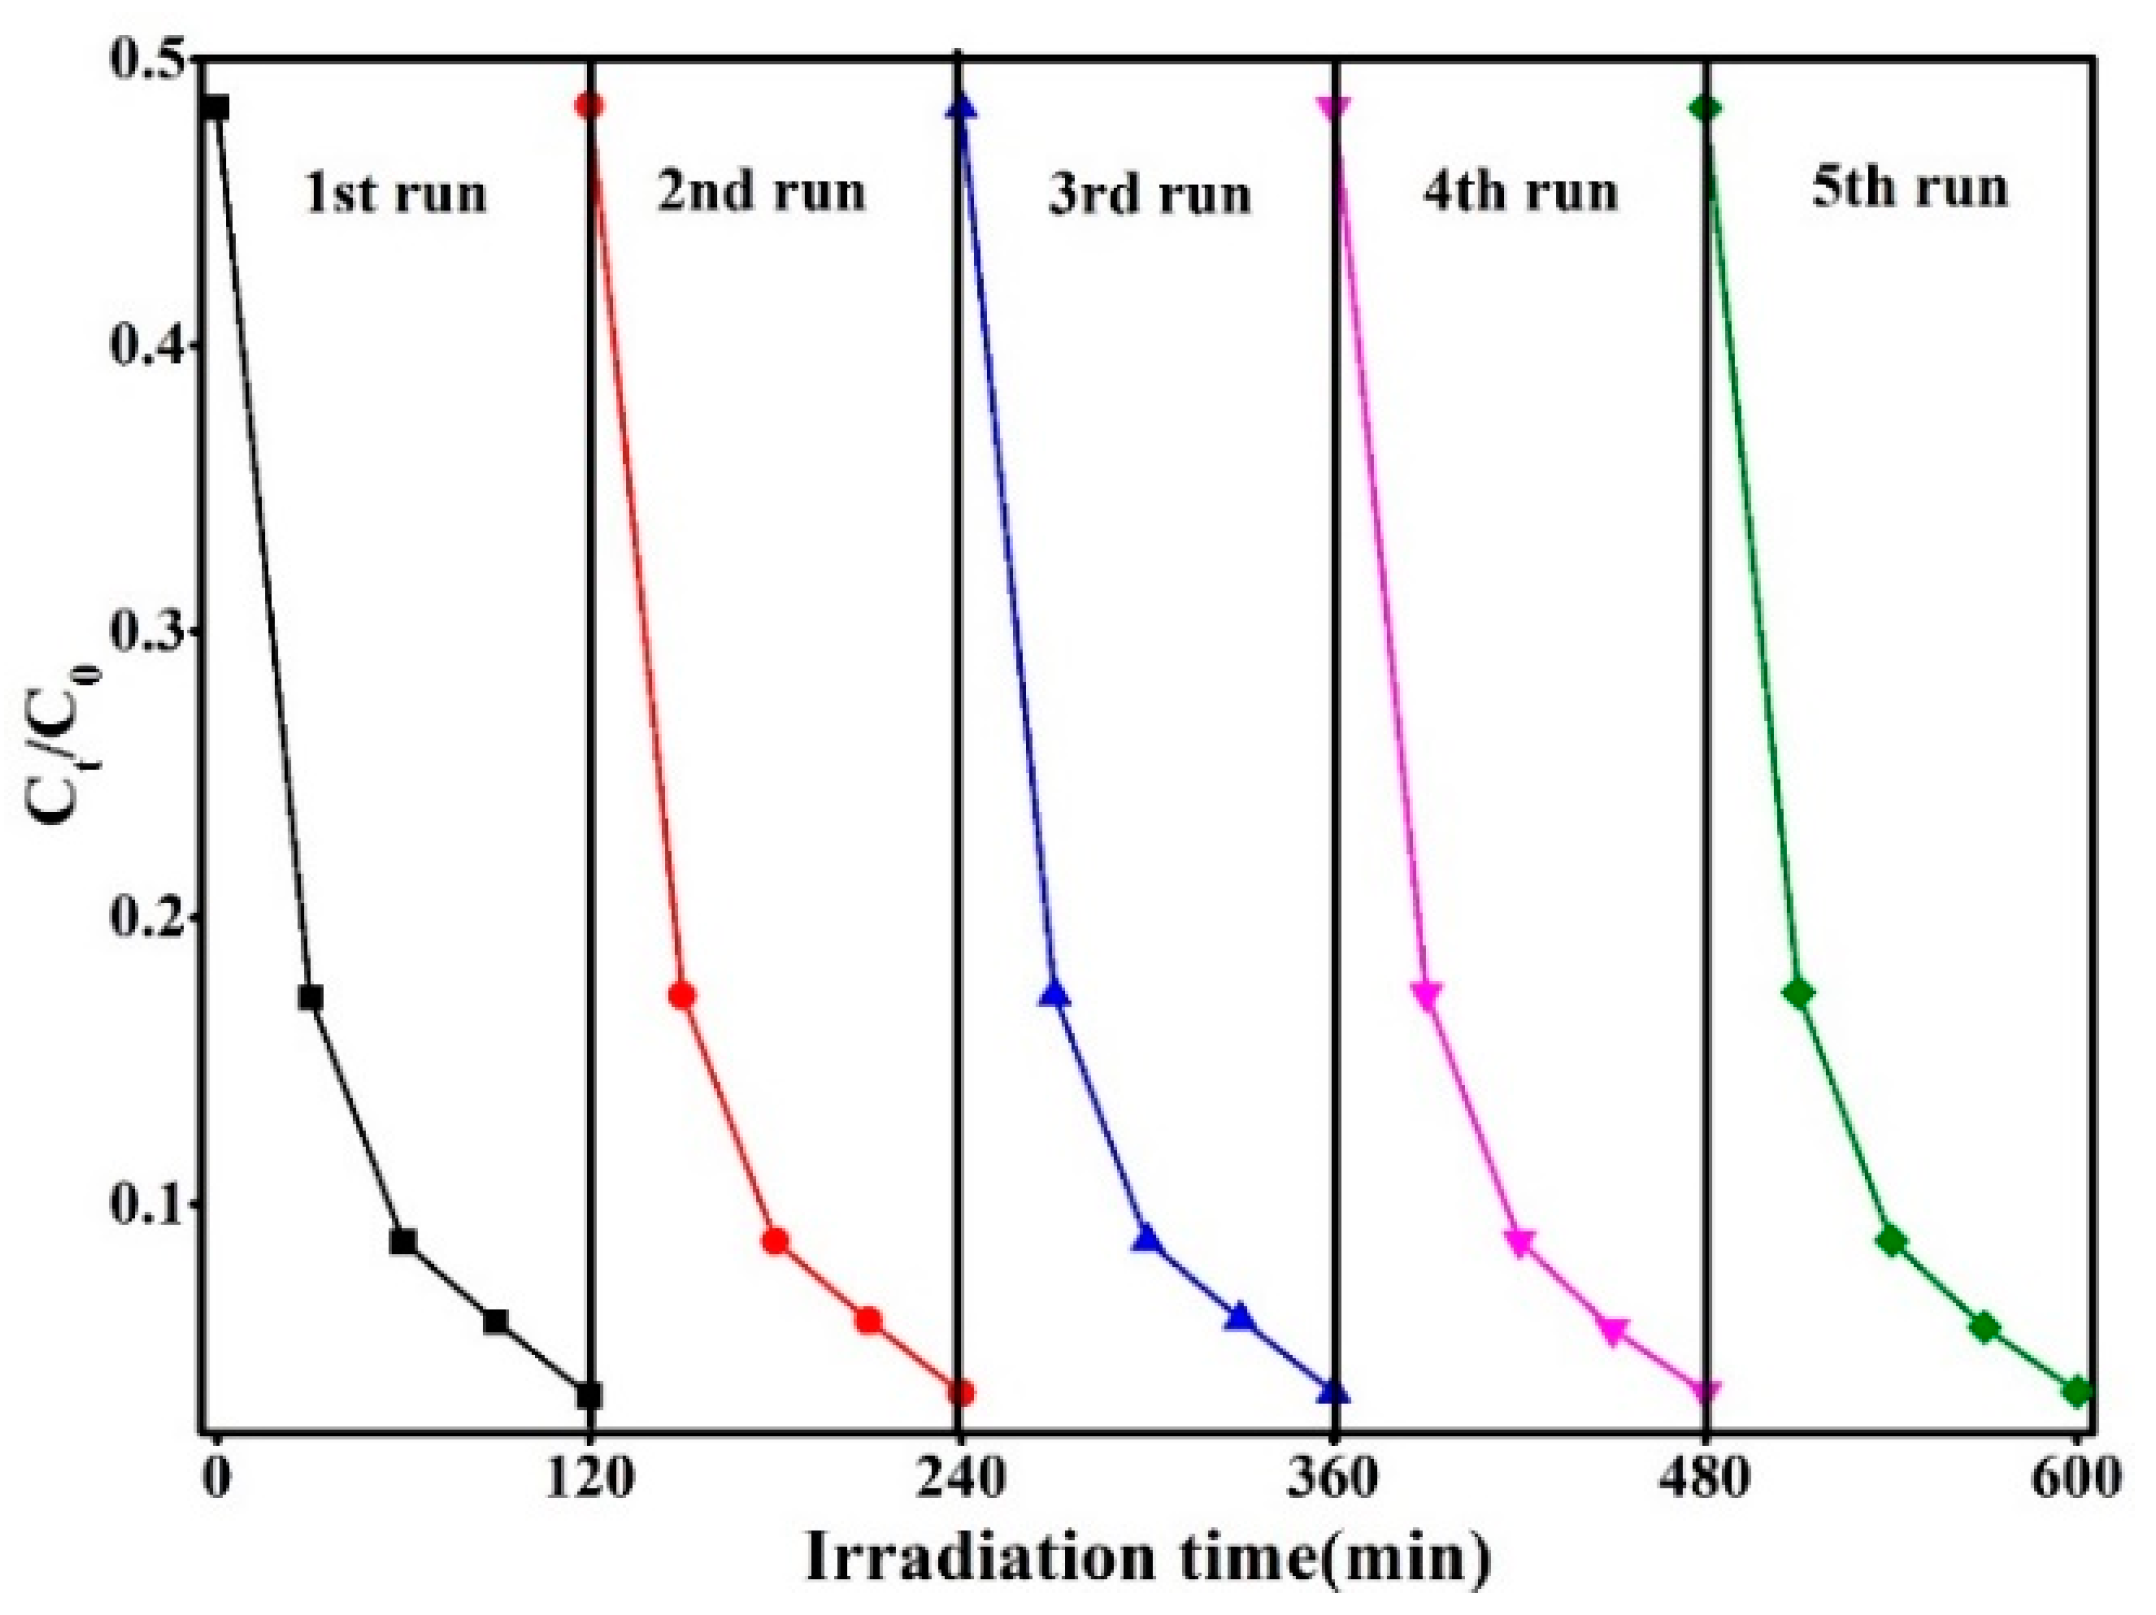
Figure 9.
Photocatalytic degradation of 3% Ag2S@SnS2 composite with different capture agents: isopropanol (IPA), benzoquinone (BQ) and triethanolamine (TEOA).
Figure 9.
Photocatalytic degradation of 3% Ag2S@SnS2 composite with different capture agents: isopropanol (IPA), benzoquinone (BQ) and triethanolamine (TEOA).
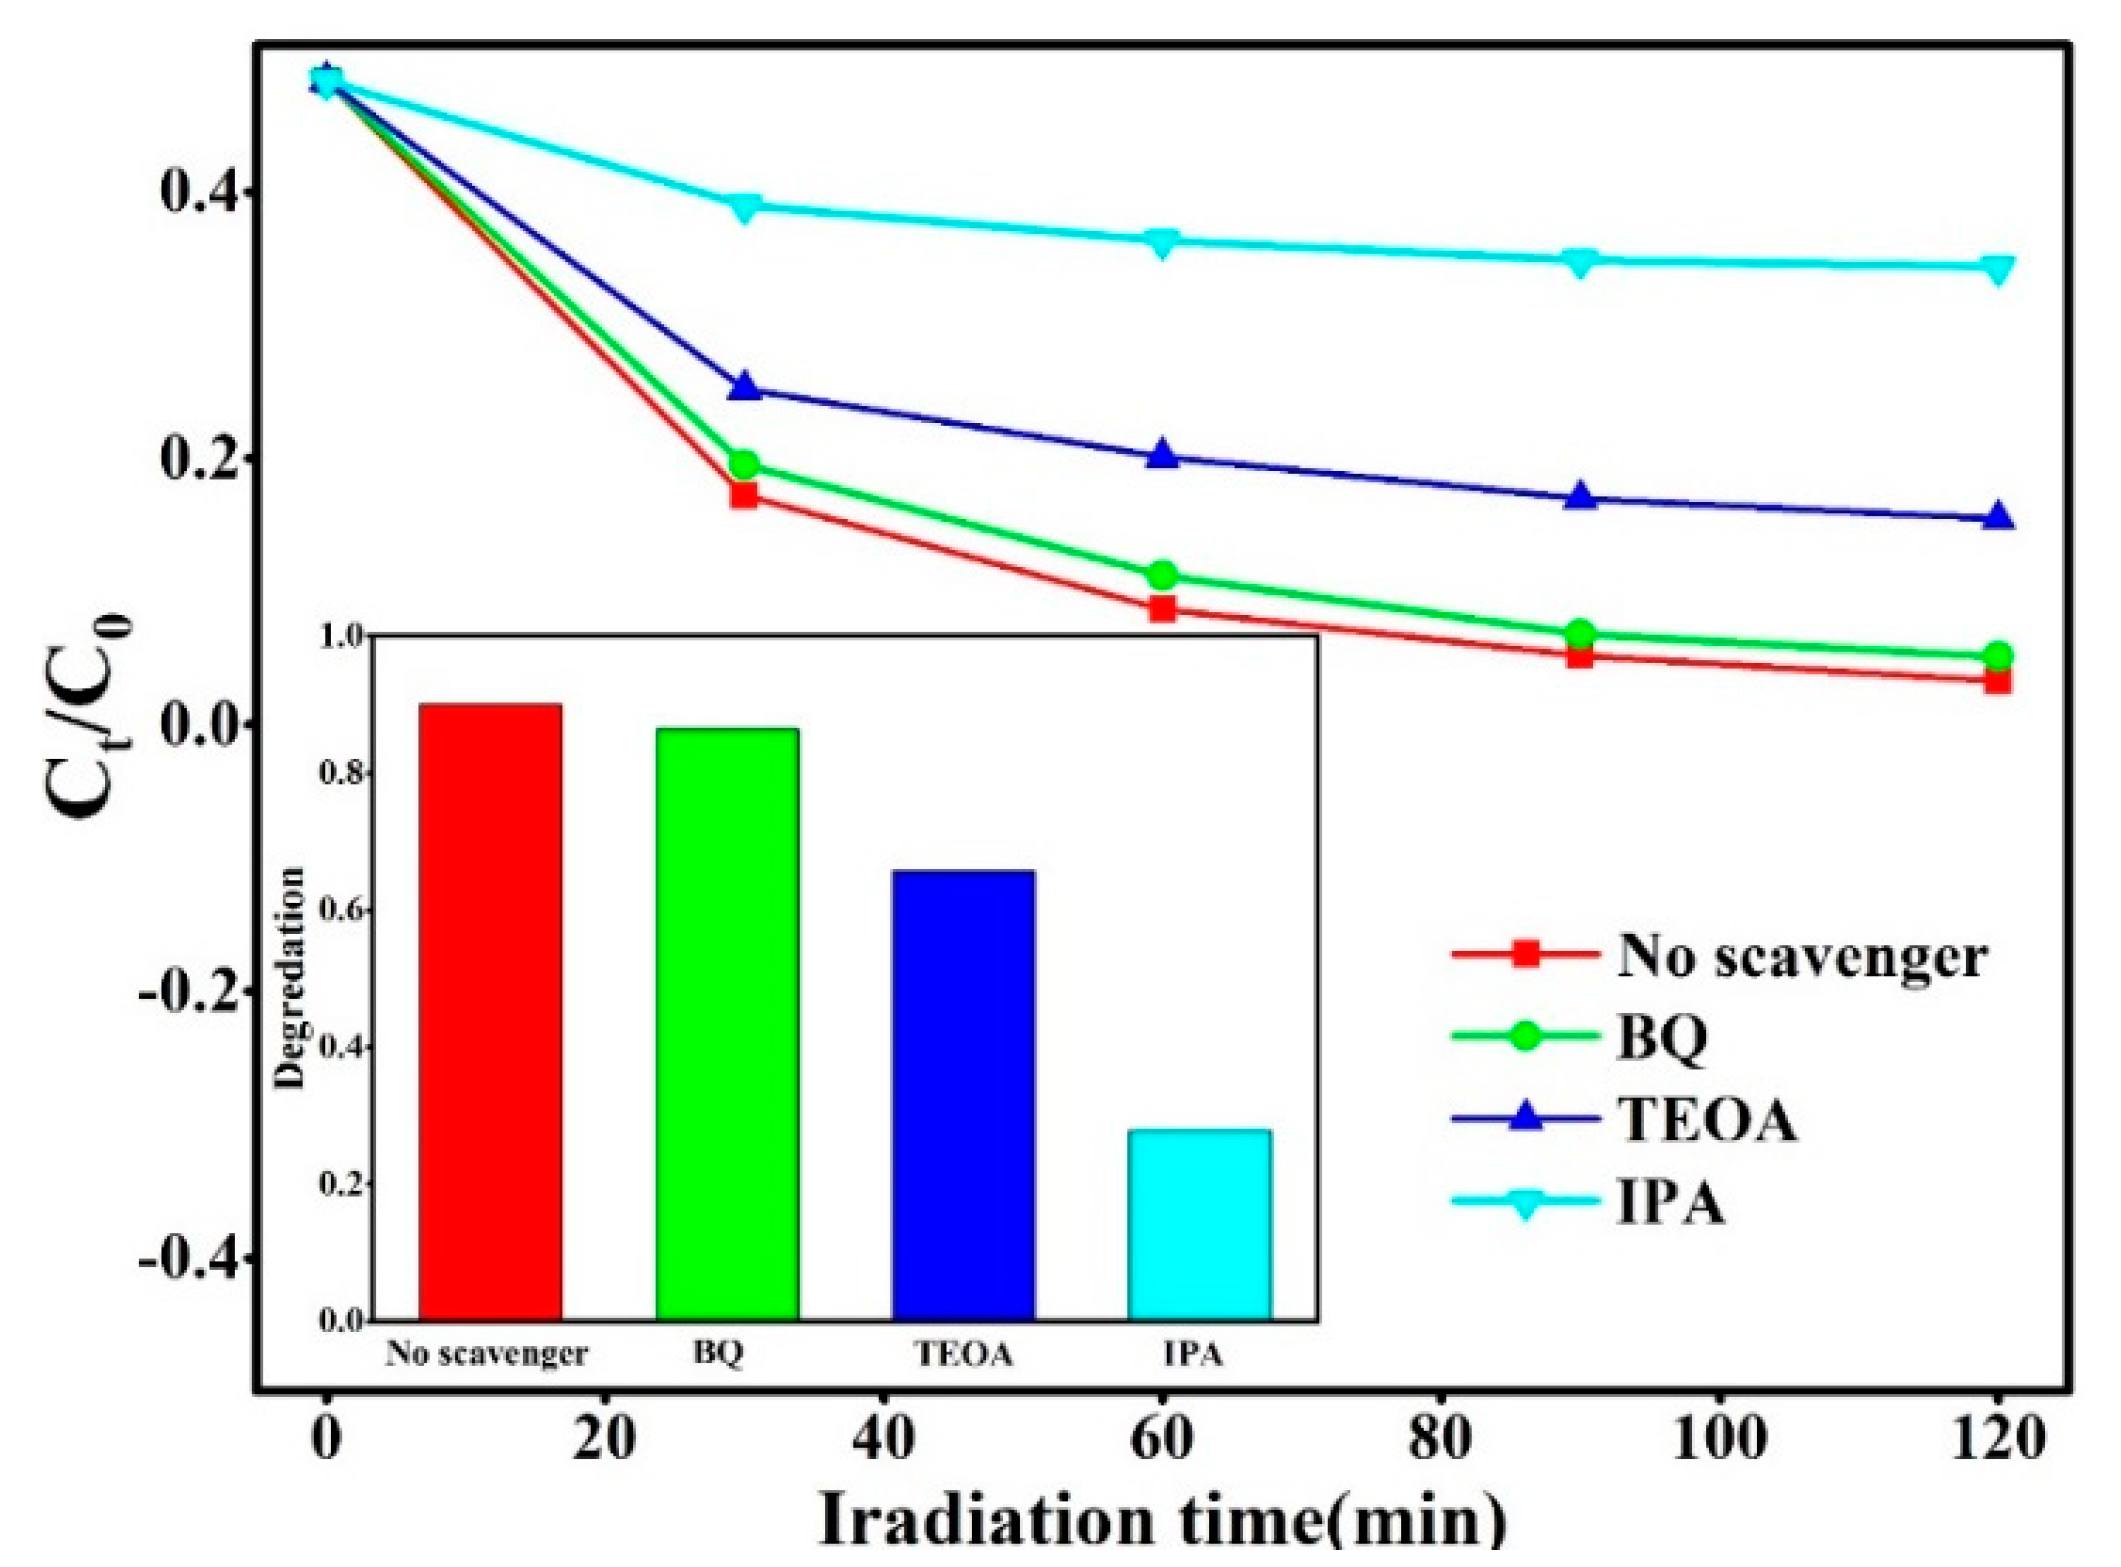
Figure 10.
The schematic diagram of photocatalytic mechanism of Ag2S@SnS2 composites under simulated sunlight.
Figure 10.
The schematic diagram of photocatalytic mechanism of Ag2S@SnS2 composites under simulated sunlight.

Table 1.
The coordinates (x, y) corresponding to the CIE chromaticity diagram of pure SnS2 and Ag2S@SnS2 composites.
Table 1.
The coordinates (x, y) corresponding to the CIE chromaticity diagram of pure SnS2 and Ag2S@SnS2 composites.
| Samples | X | Y | Peak Position (nm) | Intensity (a.u.) |
|---|---|---|---|---|
| pure SnS2 | 0.3593 | 0.3670 | 577 | 12.59 |
| 0.5%Ag2S@SnS2 | 0.3954 | 0.4152 | 588 | 42.67 |
| 1%Ag2S@SnS2 | 0.3754 | 0.3975 | 591 | 30.97 |
| 3%Ag2S@SnS2 | 0.3262 | 0.3327 | 404 | 9.3 |
| 5%Ag2S@SnS2 | 0.3128 | 0.3224 | 403 | 15.08 |
© 2019 by the authors. Licensee MDPI, Basel, Switzerland. This article is an open access article distributed under the terms and conditions of the Creative Commons Attribution (CC BY) license (http://creativecommons.org/licenses/by/4.0/).
Share and Cite
MDPI and ACS Style
Zhao, W.; Wei, Z.; Ma, L.; Liang, J.; Zhang, X. Ag2S Quantum Dots Based on Flower-like SnS2 as Matrix and Enhanced Photocatalytic Degradation. Materials 2019, 12, 582. https://doi.org/10.3390/ma12040582
AMA Style
Zhao W, Wei Z, Ma L, Liang J, Zhang X. Ag2S Quantum Dots Based on Flower-like SnS2 as Matrix and Enhanced Photocatalytic Degradation. Materials. 2019; 12(4):582. https://doi.org/10.3390/ma12040582
Chicago/Turabian StyleZhao, Wenhua, Zhiqiang Wei, Long Ma, Jiahao Liang, and Xudong Zhang. 2019. "Ag2S Quantum Dots Based on Flower-like SnS2 as Matrix and Enhanced Photocatalytic Degradation" Materials 12, no. 4: 582. https://doi.org/10.3390/ma12040582
Note that from the first issue of 2016, this journal uses article numbers instead of page numbers. See further details here.