Hydrogen Absorption in Pd–Ag Systems: A TPD and Electrical Resistivity Study


1
Department of Energy Technologies, ENEA Casaccia Research Center, Via Anguillarese 301, 00123 S. Maria di Galeria (Rome), Italy
2
Laboratory of Physics, Vinča Institute of Nuclear Sciences, University of Belgrade, P.O. Box 522, 11001 Belgrade, Serbia
3
Center of Excelence for Hydrogen and Renewable Energy (CONVINCE), Vinča Institute of Nuclear Sciences, University of Belgrade, P.O. Box 522, 11001 Belgrade, Serbia
4
Division of Fusion Physic, ENEA Frascati Research Center, Via E. Fermi 45, 00044 Frascati (RM), Italy
*
Authors to whom correspondence should be addressed.
†
Both authors contributed equally to this work.
Materials 2019, 12(19), 3160; https://doi.org/10.3390/ma12193160
Submission received: 3 September 2019
/
Revised: 19 September 2019
/
Accepted: 25 September 2019
/
Published: 27 September 2019
(This article belongs to the Special Issue Hydrogen and Isotope Diffusion in Alloyed or Non-alloyed Palladium Membrane or in Cathodes—Hydrogen Obtained from Solid Polymer Electrolyte)
Abstract
:Hydrogen retention in Pd–Ag (silver 21 wt. %) thin foil has been tested by means of temperature-programmed desorption (TPD) in the temperature range 25–200 °C and compared to the resistivity measurements for the purpose of explaining the characteristic S-shaped resistivity curve and its minimum observed in the same temperature range. The TPD results indicated that the highest uptake of hydrogen was between 65 °C and 105 °C, with a maximum at ~85 °C. Furthermore, in all examined cases, the hydrogen desorption peak was between 140 °C and 180 °C. The resistivity measurements in argon, hydrogen, and vacuum allowed us to examine the influence of hydrogen on the resistivity of a Pd–Ag alloy. The results showed evidence of two kinds of hydrides: (1) a weak absorption at low temperature (T < 70 °C) with the hydrogen present mainly in tetrahedral sites, and (2) a strong absorption up to 150 °C with the hydrogen present mainly in octahedral sites. The behaviour of the electrical resistivity and the minimum between 90 °C and 110 °C can be explained by the two kinds of hydrogen uploaded into the metal lattice.
1. Introduction
Palladium-based membranes are important for technological processes such as the separation and purification of hydrogen [1,2]. In order to avoid hydrogen embrittlement, an alloy of Pd and Ag is generally made [3,4]. Indeed, a hydrogenated Pd-membrane becomes brittle after certain cycles of α ↔ β hydride transformation due to its lattice expansion. Conversely, in Pd–Ag alloys, the lattice has already been expanded by the silver atoms, so it is less influenced by hydrogen uploading and, consequently, less brittle than the pure Pd [1]. The alloying with Ag also improves the mechanical properties and the hydrogen permeability [5]. In fact, both the tensile strength and the permeability show a maximum for a silver content in the range 20–40 wt.%, a content of Ag in the commercial Pd alloys used for membrane applications. It is also noteworthy that the electrical resistivity of non hydrogenated Pd–Ag alloys reaches a maximum silver content in the range 20–40 wt. % [6]. Among different design configurations, the direct ohmic heating of Pd–Ag permeator tubes has been studied. Such an arrangement permitted the reduction of power consumption with respect to the traditional membrane module heating systems and shortened temperature ramping [5]. These applications evidenced the need to study the effects of the metal/hydrogen interactions on the electrical resistivity of the Pd alloy in more detail. The resistivity of a Pd1−x–Agx alloy shows a typical S-shape curve as a function of x (wt. %), appearing at x = 10 and disappearing completely at x = 50 [7,8,9]. This range of the S-shape curve is also influenced by the hydrogen uploading, and in presence of H, the x is reduced to the range of 19–29. Generally, several works agreed that the S-shaped trend vs. the H/M ratio for x in this range could be affected by the hydrogen uploading into the metal lattice, involving the presence of different hydride phases: an α-phase for low H/M, an α + β two-phase co-existence region for higher H/M, and then a β phase [7,8,9]. The exact phase limits should depend on the silver content, temperature, and pressure, and their increase reduces the two-phase region [3,10]. Nevertheless, the S-shape behavior of Pd–Ag resistivity remained unclear, as well as the minimum at a higher H/M ratio with its subsequent increase [11].
The low-temperature inversion (80–150 °C) in the electrical resistivity curve of Pd–Ag was observed and explained with consideration of the two different hydride forms present in its lattice [11,12,13]. A low-temperature hydride form (tetrahedral positions occupied by H) is expected to have a higher resistivity than a high-temperature one (octahedral), so a minimum of the resistivity for hydrogenated Pd–Ag appears in this temperature range [12,13].
Leary et al. have used a temperature-programmed desorption (TPD) method to evidence the penetration of hydrogen into subsurface absorption sites of silica-supported palladium [14]. The authors claimed that some of the hydrogen that is initially adsorbed on the surface at room temperature, penetrates into subsurface absorption sites during heating of the palladium crystallites. When the surface becomes depleted of hydrogen by desorption, the subsurface hydrogen moves back to the surface and desorbs in a high-temperature peak.
Baumberger et al. derived a surface structural model for the description of hydrogen chemisorption phases formed on Pd (110) [15]. On the basis of structural arguments, the authors suggested that the subsurface sites, corresponding to the octahedral interstitials between the topmost and second atomic layers, are populated by thermal activation.
We can suppose that the existence of different kinds of hydride forms is more pronounced in the Pd–Ag lattice where the difference between the hydrogen position in the lattice is more evident, as shown by resistivity data [11]. In this work, TPD and resistivity measurements were coupled in order to understand the hydrogen absorption process, its role in electrical resistivity, and its correlation to the existence of different hydride forms in hydrogenated Pd–Ag alloys in the temperature range 25–200 °C.
2. Experimental Methods
2.1. The Activation of Pd–Ag Foils
The foils of Pd0.79–Ag0.21 and Pd0.30–Ag0.70 were cleaned in acetone, ethanol, and water, respectively, for 15 min in ultrasound and dried in an oven at 130 °C for 30 min. Next, the foils were activated by heating in Ar at 250 °C for 1 h, followed by a 1 h treatment in H2 at 350 °C and cooled in Ar at 250 °C for 1 h, before being allowed to cool to room temperature. The gas flow was 30 mL min−1 in all the cases. Then, the foils were instantly placed on the bottom of the quartz tube (Figure 1a) for absorption/desorption tests.
2.2. Absorption/Desorption Tests and Resistivity Measurements
The quartz tube (Figure 1a) was positioned in the center of the heating zone and calibration was performed to provide accurate temperature measurement in the foil vicinity (Figure 1a). Prior to hydrogen uploading experiments, the system was vacuumed for 15 min by a roughing pump, purged with H2 at room temperature (~30 s total exposure), and vacuumed again. Next, the system was filled with hydrogen at ~105 Pa at room temperature and absorption experiments were performed with Tabs from 25 to 200 °C by allowing a sufficient amount of time (~90 min, on average) for pressure equilibration due to hydrogen uploading into the foil. After pressure equilibration, the hydrogen was vacuumed by a roughing pump (2–3 min) and desorption measurements were started. In this process, the temperature was increased from the Tabs, at a rate of 10 °C/min, up to 450 °C, while the desorbed hydrogen was monitored by a quadruple mass spectrometer (QMS, XT300, Extorr Inc. New Kensington, PA, USA)) which was mounted on a homemade TPD set-up.
The resistivity measurements were performed in four-electrode AC impedance mode using a Solartron 1260 frequency response analyzer by Schlumberger. The spectra were recorded continuously at 10 Hz with 10 points per decade and a maximum perturbation amplitude of 0.5 mA.
The same experimental setup as that described in a previous work was used [11]. In brief, a Pd–Ag 21 wt. % thin foil was cut into a strip of length 14.10 cm and width 0.44 cm that was positioned in a gas-tight stainless steel module. Four parallel platinum contacts were welded onto the ends of the Pd–Ag strip. The length (l) of the Pd–Ag sample between the measuring voltage probes was 13.75 cm. The impedance of the foil was measured in the tangential direction (in-plane) and the resistivity was calculated using the equation:
where ρ, l, RΩ, and A denote the resistivity, the distance between the probe, the measured resistance, and the cross-sectional area of the Pd–Ag sample, respectively. The term A was obtained from the product of the Pd–Ag thickness (r) 51 µm and its width (h) 0.44 cm.
The closed stainless steel vessel container provided with a gas inlet and outlet was equipped with an electrical heating system and two control thermocouples (Figure 1b). This vessel was thermally insulated and small enough to ensure a uniform temperature in the entire volume.
The resistivity and temperature were continuously measured during the entire experiment, which was performed in stages. In stage 1, the experiment started with argon flow (15 mL min−1) at room temperature, and we waited for a stable signal. Then, in stage 2, the temperature was increased, in argon, to an absorption temperature (Tabs). In stage 3, at Tabs, the vessel was purged with H2 (15 mL min−1), and we waited again for signal stabilization. In stage 4, the vessel was closed and the hydrogen was vacuumed by a mechanical pump, and we waited for a stable signal. In stage 5, the temperature was increased from the Tabs, at a rate of 5 °C min−1, up to the final temperature (about 450 °C), while always monitoring the resistivity. At the end of the heating ramp, in stage 6, a flow of argon was sent into the vessel, cooling the system until room temperature was reached. This procedure was applied for each Tabs temperature.
3. Results and Discussion
3.1. Resistivity in A Pd–Ag–Hn (n = H/Me) System in Argon and Hydrogen Atmosphere
Figure 2 shows the resistivity and temperature during a typical impedance measurement following the above-mentioned procedure.
The total resistivity of Pd79–Ag21–Hn (n = H/Me) can be defined as the sum of two terms [11,15]:
where ρT is the resistivity due only to the thermal motion of the hydrogen-free Pd–Ag lattice. This is the typical behaviour of a nonhydrogenated metal that can described by the simplified equation:
where T is the temperature, T° is a reference temperature (usually room temperature), ρ° is the resistivity at T°, and α is the change in resistivity per unit temperature and is called the thermal coefficient. ρ° and α can be obtained by measuring the resistivity in flowing argon as a function of temperature (Figure 3).
The ρi in Equation (2) is the resistivity due to scattering of the free electrons on the metal’s and hydrogen atoms. This term clearly depends on the H concentration in the sample, which, at constant H2 gas pressure, changes with temperature due to a temperature-dependent H solubility. From Equations (2) and (3), we can calculate this contribution simply by subtracting the resistivity measured in argon from that in pure hydrogen (Figure 3):
The ρi contribution is strictly dependent on the hydrogen trapped in the lattice in relation to the total amount of silver. Particularly for Ag 21 wt. %, the hydrogen atoms can occupy octahedral and tetrahedral positions [13]. Before the d-band is filled, all hydrogen atoms occupy the octahedral positions at high temperatures and the tetrahedral positions at low temperatures. However, at higher hydrogen concentrations, the tetrahedral interstitial positions begin to be occupied too. We obtain the relation:
According to this model [13], the s-band density of states is assumed to be constant in the diamagnetic state, i.e., only when x + n ≥ 0.6, does the s-band starts to accept electrons from hydrogen [16,17]. This means that, for Ag 21%, if n ≥ 0.39, the amount of hydrogen in a tetrahedral position should increase, and for n ≤ 0.39, the amount of ntet should be equal to zero.
The ρi contribution due to the hydrogen inside the lattice can change or disappear totally after a vacuum/desorption process, depending on the temperature. So, at every Tabs, a resistivity in flowing hydrogen (ρi) and in a vacuum (ρi′) can be measured. In addition, the vacuum process always reduces n ≤ 0.39. In this case, the exact position of hydrogen, tetrahedral or octahedral, will depend on the Tabs. So the parameter ρi′ can be considered to be dependent on the hydrogen trapped in the lattice position at Tabs after the vacuum process.
3.2. Thermal Desorption of Hydrogen from A Pd–Ag Alloy.
The experimental tests have been focused on studying the absorption/desorption behavior of hydrogen in Pd–Ag alloys. In a preliminary TPD test, samples with two different Ag loadings (in wt.%), Pd0.79–Ag0.21 and a Pd0.30–Ag0.70, were compared, evidencing that the alloy composition plays a determining role in hydrogen absorption/desorption behavior. In particular, Pd0.30–Ag0.70 showed no H2 desorption, while Pd0.79–Ag0.21 showed desorption up to Tabs = 160 °C. As explained in a previous article [11], the 40 wt. % of silver in the alloy irreversibly modified the behavior of the alloy so that it cannot absorb any kind of hydrogen due to its electronic structure. The TPD effectively evidenced this effect, showing no hydrogen absorption/desorption for 70 wt.% of Ag.
The TPD was used to analyze alloys with 21 wt. % Ag in more detail. The absorption of H2 was performed at Tabs 25–160 °C, and the results are shown in Figure 4. As can be seen, detectable hydrogen desorption can be already observed at ~100 °C, with maxima between 140 and 180 °C, thus representing a region of thermal stability of the hydrogen–metal bond.
The area under the TPD curves can be used for a relative comparison of the amount of hydrogen absorbed by the Pd–Ag lattice at a well-defined absorption temperature (Tabs), remaining after the vacuum process, and then recovered by desorption (Figure 5). It can be concluded that the highest uptake of hydrogen was achieved between Tabs ~63 °C and 105 °C, with a maximum at ~85 °C.
In the following discussion about the behaviour of the electrical resistivity of hydrogenated Pd–Ag, we will try to identify the origin of hydrogen from the perspective of its bonding in the Pd–Ag lattice.
3.3. Resistivity of Pd0.79–Ag0.21 in Hydrogen and a Vacuum and Its Link to Hydride Forms
Figure 6 shows the temperature evolution of the three terms of Equation (2) in the range 25–235 °C. As in Figure 3, we can distinguish a minimum of ρi at about 110 °C and the maximum at 200 °C. Similarly, Figure 7 shows the total resistivity ρ’ and the intrinsic resistivity ρi′ after the vacuum step at different Tabs. So, we attempt to establish a relationship between the residual intrinsic resistivity ρi′ after the vacuum process and the hydrogen presence inside the lattice as observed by the TPD measurements.
It can be noticed that the maximum ρi′ appeared in the same range of absorption temperatures (90–110 °C) as in the case of the TPD experiment (Figure 5). This evidenced that the amount of hydrogen extracted by the vacuum was correlated to the absorption temperature. This hydrogen, as in the TPD measurement (Figure 4), could be extracted completely only by increasing the temperature to over 200 °C.
To explain the trend of resistivity obtained in hydrogen after the vacuum process, when the excess H2 was pumped out, we must first consider how the absorption temperature and the amount of hydrogen determined the position of the hydrogen inside the lattice and its role.
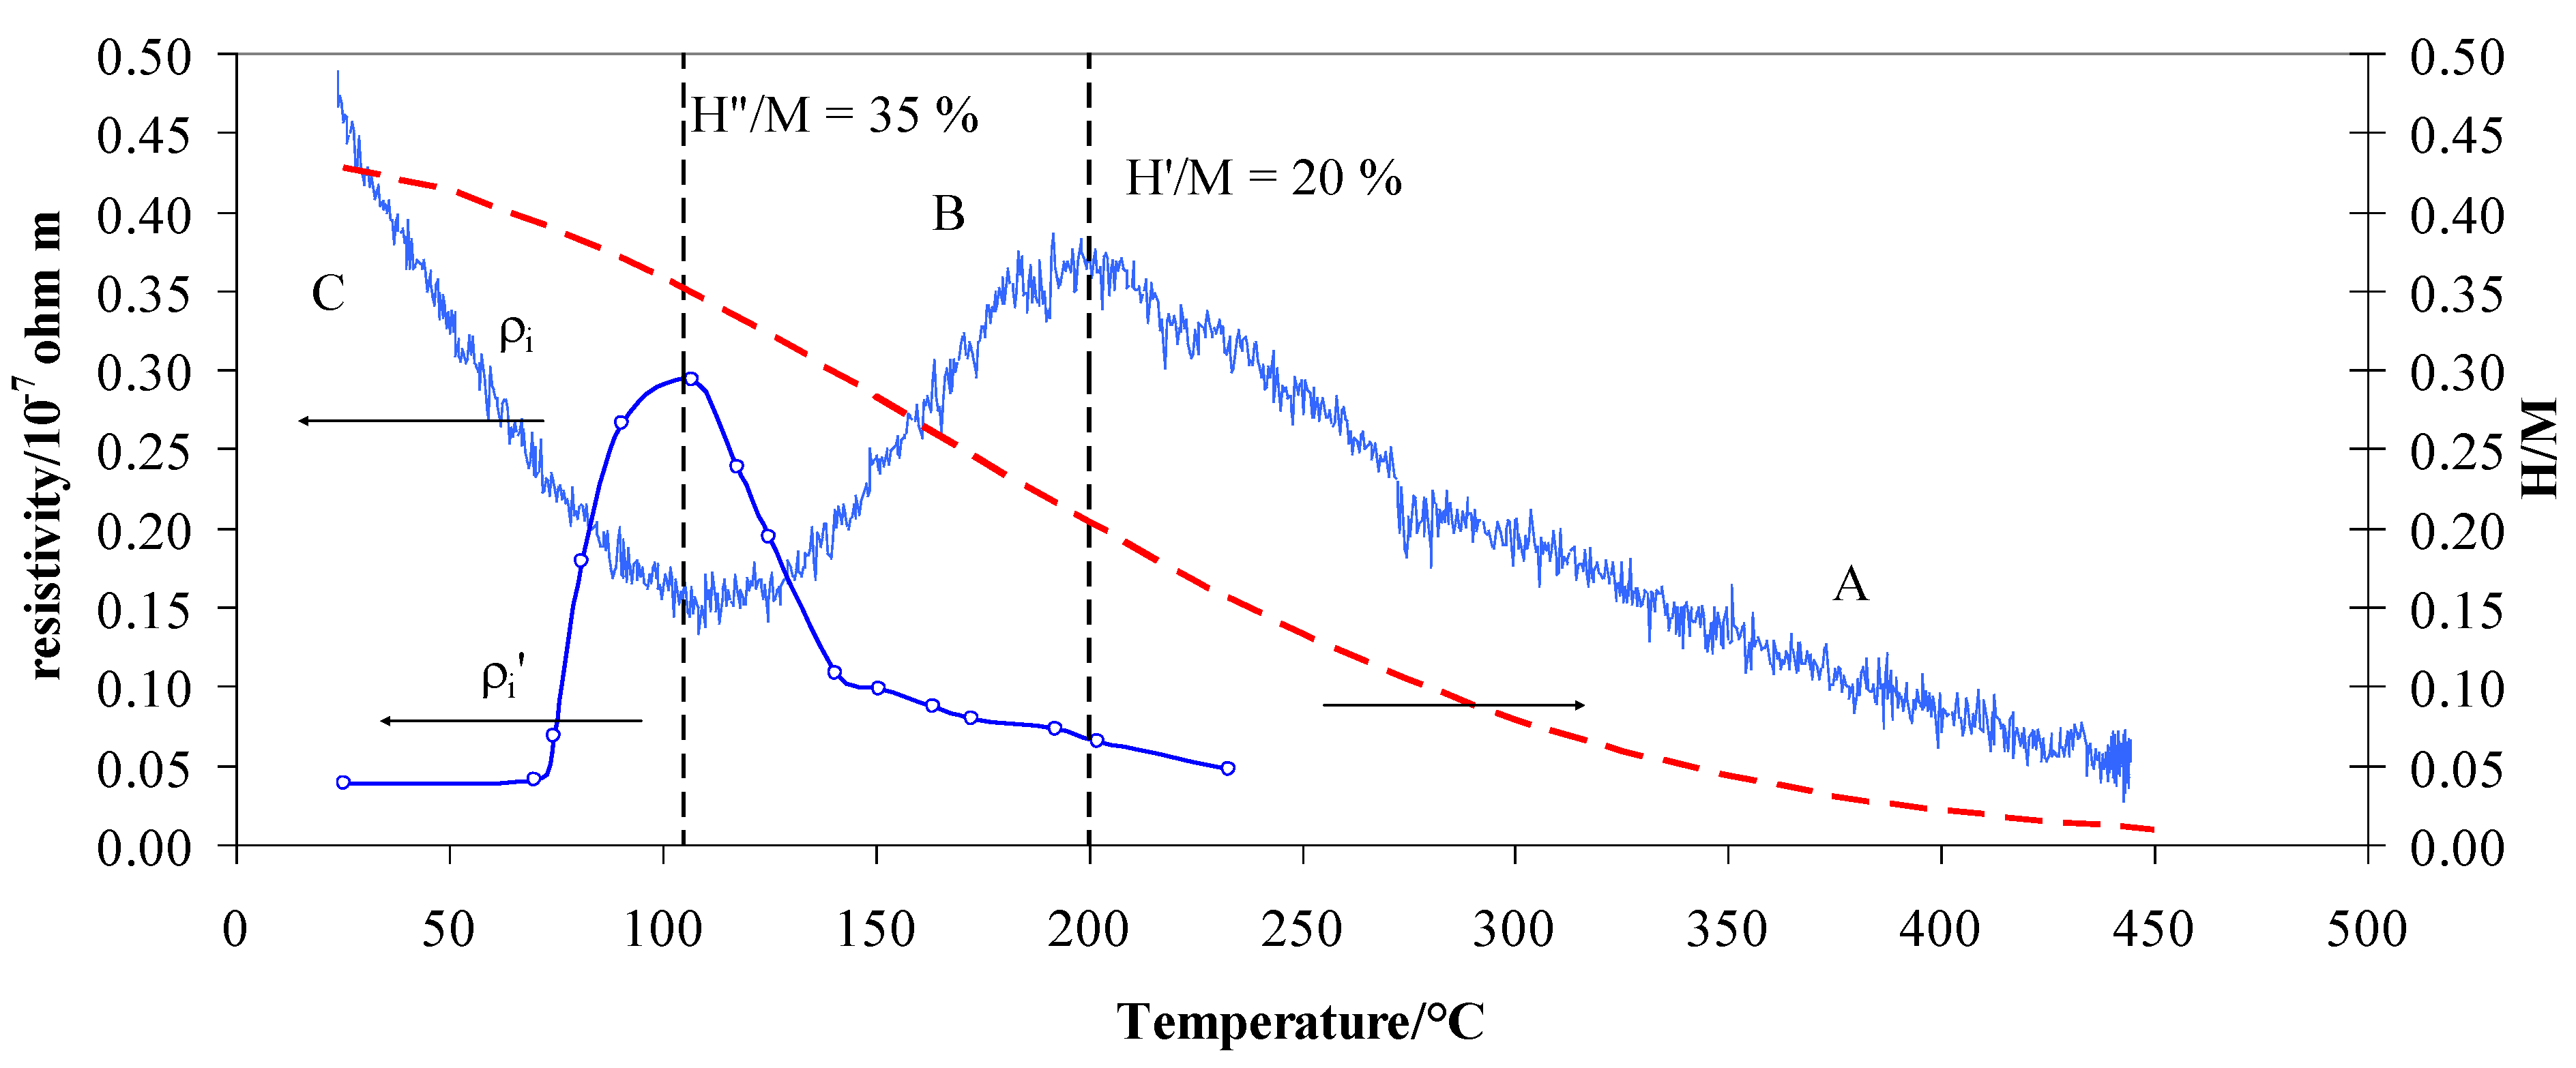
According to the literature, we can summarize the situation in a hydrogen atmosphere as in [13]. So, the vacuum process after absorption at different temperature acted on different kinds of hydrogen. From 25 to 70 °C, the vacuum process extracted practically all of the hydrogen present in the tetrahedral sites so that the resistivity ρi′ was about zero. By increasing the temperature to above 70 °C, the equilibrium shifted from the tetrahedral to the octahedral sites, and the residual resistivity ρi′ increased. The growth of ρi′ with the absorption of temperature is explained by an increase of hydrogen inside the lattice due to the shift in the tetrahedral ↔ octahedral equilibrium. The vacuum process seemed to extract the hydrogen completely from the tetrahedral sites (25–70 °C) but only partially from the octahedral sites (T > 70 °C). Now, we can observe that this amount of hydrogen, which still remained inside the lattice in octahedral sites, filled the d-band since the H/M ratio was lower than 0.2 (Table 1). Consequently, this hydrogen produced an increase of resistivity with respect to that in pure argon, therefore, we observed a maximum of resistivity ρi’ at ~110 °C. Thus, the maximum can be interpreted as a complete shift of the tetrahedral ↔ octahedral equilibrium. Above this temperature, the vacuum, also assisted by desorption process, would extract hydrogen only from the octahedral sites, so a successive increase of temperature would reduce the H/M ratio. As in the previous case, hydrogen that still remained inside the lattice would occupy the d-band, but as the temperature increased, this amount would be lowered (H/M reduces with temperature), so the residual resistivity ρi′ tended to decrease. While ρi′ was correlated to the amount of absorbed hydrogen, as shown by the relative trend in Figure 5, the TPD results also revealed the range of temperature stability for hydrogen in a Pd–Ag alloy, which helps us to understand the trend of ρi in Figure 8. As can be seen in Figure 4, desorption of hydrogen occurred between 100 and 200 °C, but in the case of higher Tabs, the desorption process was already active (Figure 4e,f). Thus, in the case of measurements in flowing hydrogen, resistivity ρi can be understood as a net result of a complex absorption/desorption process whose constants, depending on the temperature, determine the H/M content in the alloy.
The Pd–Ag resistivity measured in hydrogen (Figure 3) can be now overlapped by that obtained after the vacuum/desorption process at different absorption temperatures. Here, H/M was extrapolated by the literature data on the same kind of alloy [11,18,19,20,21,22]. By moving from right to left of the graph in Figure 8, i.e., following the temperature decrease starting from 450 °C, it is observed that: (1) in region A below 450 °C, the resistivity ρi increases until a maximum was reached at ~200 °C, (2) in region B, a decrease is observed until a minimum in resistivity is reached at ~110 °C, and (3) in region C, there is a continuous increase of resistivity. Such a trend can be explained due to the fact that the hydrogen uploaded into different lattice positions affects the resistivity in a different way. The hydrogen uploaded at high temperatures (200–450 °C) increases the resistivity, while that uploaded below 200 °C decreases it. In a previous article [11], we hypothesized that introducing H into a Pd79–Ag21 lattice initially decreases the number of metal valence electrons (N), thus increasing the resistivity ρi. This effect occurs until the electrons fill the valence band (saturation effect) at a well-defined loading of hydrogen H’ until the sum of H’/M + 0.21(Ag) reaches about 40% [16,17,23]. Effectively, we observed a maximum of (H′/M) = 0.20 at about 200 °C. Before the d-band is filled, all these hydrogen atoms occupied interstitial positions of one kind only, in this case at high temperatures, hydrogen occupied the octahedral positions.
Further uptake of hydrogen involves an increase of N to decrease resistivity ρi until we reach a higher H″/M ratio. After the d-band is filled, hydrogen continues to occupy octahedral interstitial positions, but as the H/M increases tetrahedral positions can also be occupied. The theoretical limit of H/M for the octahedral position should be reached for n ≤ 0.39. In contrast to the model [13], the resistivity ρi in Figure 8 decreases until H″/M is 0.35 at 105 °C. This can be explained by considering that the limit between octahedral and tetrahedral positions is not as well defined. In addition, it should be considered that the H/M at a low temperature is affected by measurement uncertainty. However, we can observe that above a threshold value (H″/M), the hydrogen is also in the tetrahedral position.
From the TPD and resistivity results in the range 25–200 °C, we can clearly see the transition between the two different hydrides. The vacuum process reduces the amount of hydrogen well under the filling of the d-band, so the hydrogen atoms, if present, can occupy interstitial positions of one kind only. Measurements show that the hydrogen amount still inside the alloy increases as we shift toward higher absorption temperatures. The maximum of this hydrogen is reached at an absorption temperature corresponding to that which we observed at the minimum resistivity. As predicted from the model [13], this point should represent the limit of existence for the ntet. We can conclude that this hydrogen is located in a well-defined octahedral site when thermally activated, and occupies a well-defined range of temperatures.
Above this H″/M ratio at lower temperatures, the tetrahedral interstitial positions also begin to be extensively occupied. The scattering effect is dominant with respect to the numbers of conduction electrons per unit volume—the high concentration of H atoms, always occupying more tetrahedral sites, act mainly as a point defect, thus decreasing the electrons mean free paths and sharply increasing the resistivity.
The experiment on TPD and resistivity in vacuum conditions demonstrated the existence of different kinds of hydride that can be activated by means of temperature by starting from about 70 °C. This activation effect was already evidenced in previous electrochemical measurements. Pozio et al. [24] used a similar Pd–Ag cathode in an experimental alkaline electrolyser and observed characteristic changes in the slope of a permeating flux of H2 for different temperatures in 1 M KOH. Their results showed that the permeating flux logarithm is a linear function of 1/T, with a slope change at about 70 °C. Particularly, an activation energy of 34.7 kJ mol−1 was calculated between 50 and 70 °C, and 4.0 kJ mol−1 between 70 and 80 °C. This change of slope corresponds to the change of resistivity ρi′ evidenced in Figure 7 and Figure 8 at the same temperature. We can presume that above 70 °C, the hydrogen undergoes thermal activation, and it can occupy and move across octahedral lattice sites, thus changing the physical parameters, such as resistivity, absorption, and permeability.
4. Conclusions
An experimental study based on TPD and electrical resistivity measurements was utilized to explain the characteristic S-shaped curve of electrical resistivity of a Pd–Ag foil in the temperature range 25–200 °C. Measurements showed that two different hydrides exist with their conversions starting at ~70 °C. At low temperatures, a weak absorption of hydrogen is present, mainly in tetrahedral sites. At higher temperatures, a stronger absorption occurs until 150 °C, with the hydrogen present mainly in octahedral sites. The behaviour of the electrical resistivity and the minimum between 90 and 110 °C was discussed from the perspective of the effects these hydride forms have on host metal lattices. This was enabled by the new approach that combined TPD and resistivity measurements in a vacuum, thus providing a novel insight into the interactions and temperature stability of hydrogen in a Pd–Ag alloy. Thanks to this, we were able to establish a relationship between the residual intrinsic resistivity after the vacuum/desorption process, hydrogen presence inside the lattice, and its role in the overall evolution of resistivity obtained in a hydrogen atmosphere.
Author Contributions
For conceptualization, visualization responsible are A.P., Z.J. and S.T.; investigation, methodology, validation and data analysis were performed by A.P. and Z.J.; writing and editing by A.P., Z.J.; project administration and supervision by S.T.
Funding
Z. Jovanovic acknowledges the financial support by the Ministry of Education, Science and Technological Development of Republic of Serbia, grant number III45006.
Conflicts of Interest
The authors declare no conflict of interest.
References
- Darling, A.S. Thermal and Electrolytic Palladium Alloy Diffusion Cells. Platin. Met. Rev. 1963, 7, 126–129. [Google Scholar]
- Medrano, J.A.; Fernandez, E.; Melendez, J.; Parco, M.; Tanaka, D.A.P.; van Sint Annaland, M.; Gallucci, F. Pd-based metallic supported membranes: High-temperature stability and fluidized bed reactor testing. Int. J. Hydrog. Energy 2018, 41, 8706–8718. [Google Scholar] [CrossRef]
- SShu, J.; Grandjean, B.P.A.; Van Neste, A.; Kaliaguine, S. Catalytic palladium-based membrane reactors: A review. Can. J. Chem. Eng. 1991, 69, 1036–1060. [Google Scholar] [CrossRef]
- Okazaki, J.; Tanaka, D.A.P.; Tanco, M.A.L.; Wakui, Y.; Mizukami, F.; Suzuki, T.M. Hydrogen permeability study of the thin Pd–Ag alloy membranes in the temperature range across the α–β phase transition. J. Membr. Sci. 2006, 282, 370–374. [Google Scholar] [CrossRef]
- Tosti, S.; Borgognoni, F.; Santucci, A. Electrical resistivity, strain and permeability of Pd–Ag membrane tubes. Int. J. Hydrog. Energy 2010, 35, 7796–7802. [Google Scholar] [CrossRef]
- Lewis, F.A.; Kandasamy, K.; McNicholl, R.A.; Tong, X.Q. Hydrogen pressure-hydrogen content and electrical resistance-hydrogen content relationships of palladium and palladium alloy-hydrogen systems. Int. J. Hydrog. Energy 1995, 20, 369–372. [Google Scholar] [CrossRef]
- McNicholl, R.A.; Lewis, F.A. Hydrogen contents and electrical resistivity of palladium—Silver alloys. Int. J. Altern. Energy Ecol. 2004, 3, 32–33. [Google Scholar]
- Carson, A.W.; Lewis, A.; Schurter, H. Relationships between the Hydrogen Content and Electrical Resistance of Palladium + Silver Alloys. Trans. Faraday Sec. 1967, 43, 1447–1452. [Google Scholar] [CrossRef]
- Toth, J.; Garaguly, J.; Petera, L.; Tompa, K. Resistivity changes during hydrogenation of Pd80Ag20 alloy in non-equilibrium circumstances. J. Alloys Compd. 2000, 312, 117–120. [Google Scholar] [CrossRef]
- Brodowsky, H. On the Non-Ideal Solution Behavior of Hydrogen in Metals. Ber. Bunsenges. Phys. Chem. 1972, 76, 740–749. [Google Scholar]
- Pozio, A.; Jovanovic, Z.; Lo Presti, R.; De Francesco, M.; Tosti, S. Pd-Ag hydrogen content and electrical resistivity: Temperature and pressure effect. Int. J. Hydrog. Energy 2012, 37, 7925–7933. [Google Scholar] [CrossRef]
- Baranowski, B. Metal-hydrogen systems at high pressures. In Topics in applied physics. Hydrogen in Metals II; Alefeld, G., Volkl, J., Eds.; Springer-Verlag Berlin Heidelberg: Berlin, Germany, 1978; pp. 157–200. [Google Scholar]
- Szafransky, A.W.; Baranowski, B. The electrical resistance of the Pd-Ag-H system at 25 °C in a wide range of hydrogen pressure. Phys. Stat. Sol. 1972, 9, 435–445. [Google Scholar] [CrossRef]
- Leary, K.J.; Michaels, J.N.; Stacy, A.M. Penetration of Hydrogen into Subsurface Sites of Silica-Supported Palladium during Temperature-Programmed Desorption. Langmuir 1988, 4, 1251–1257. [Google Scholar] [CrossRef]
- Baumberger, M.; Stocker, W.; Rieder, K.H. Investigations of the selective population of hydrogen subsurface sites on Pd(110) using He diffraction and thermal-desorption spectroscopy. Appl. Phys. A 1986, 41, 151–156. [Google Scholar] [CrossRef]
- Mott, N.F. The Basis of the Electron Theory of Metals, with Special Reference to the Transition Metals. Proc. Phys. Soc. 1949, 62, 416–422. [Google Scholar] [CrossRef] [Green Version]
- Fort, D.; Harris, I.R. The physical properties of some palladium alloy hydrogen diffusion membrane material. J. Less Common Met. 1975, 41, 313–327. [Google Scholar] [CrossRef]
- Brodowsky, H.; Poeschel, E. Wasserstoff in Pd/Ag-Legierungen. Z. Phys. Chem. NF 1965, 44, 143–159. [Google Scholar] [CrossRef]
- Millet, P.; Lebouin, C.; Decaux, C.; Ngameni, R.; Ranjbari, A.; Guymont, M. Characterization of metal hydrides using pneumato-chemical impedance spectroscopy. Int. J. Hydrog. Energy 2009, 34, 4990–4996. [Google Scholar] [CrossRef]
- Serra, E.; Kemali, M.; Ross, D.K.; Perujo, A. Hydrogen and deuterium in Pd-25 pct Ag alloy: Permeation, diffusion, solubilization, and surface reaction. Met. Mater. Trans. A 1998, 29, 1023–1028. [Google Scholar] [CrossRef]
- Jeemaa, N.; Grandjean, B.P.A.; Kaliaguine, S. Diffusion coefficient of hydrogen in a Pd-Ag Membrane: Effect of hydrogen solubility. Can. J. Chem. Eng. 1995, 73, 405–410. [Google Scholar] [CrossRef]
- Paolone, A.; Tosti, S.; Santucci, A.; Palumbo, O.; Trequattrini, F. Hydrogen and Deuterium Solubility in Commercial Pd–Ag Alloys for Hydrogen Purification. Chem. Eng. 2017, 1, 1–9. [Google Scholar] [CrossRef]
- Piccard, C.; Kleppa, O.J.; Boureau, G. High temperature thermodynamics of the solutions of hydrogen in palladium-silver alloys. J. Chem. Phys 1979, 70, 2710–2719. [Google Scholar] [CrossRef]
- Pozio, A.; De Francesco, M.; Jovanovic, Z.; Tosti, S. Pd-Ag hydrogen diffusion cathode for alkaline water electrolysers. Int. J. Hydrog. Energy 2011, 36, 5211–5217. [Google Scholar] [CrossRef]
Figure 1.
The schematic representation of (a) temperature-programmed desorption and (b) resistivity experimental setups.
Figure 1.
The schematic representation of (a) temperature-programmed desorption and (b) resistivity experimental setups.

Figure 2.
Resistivity and temperature during a typical impedance measurement.
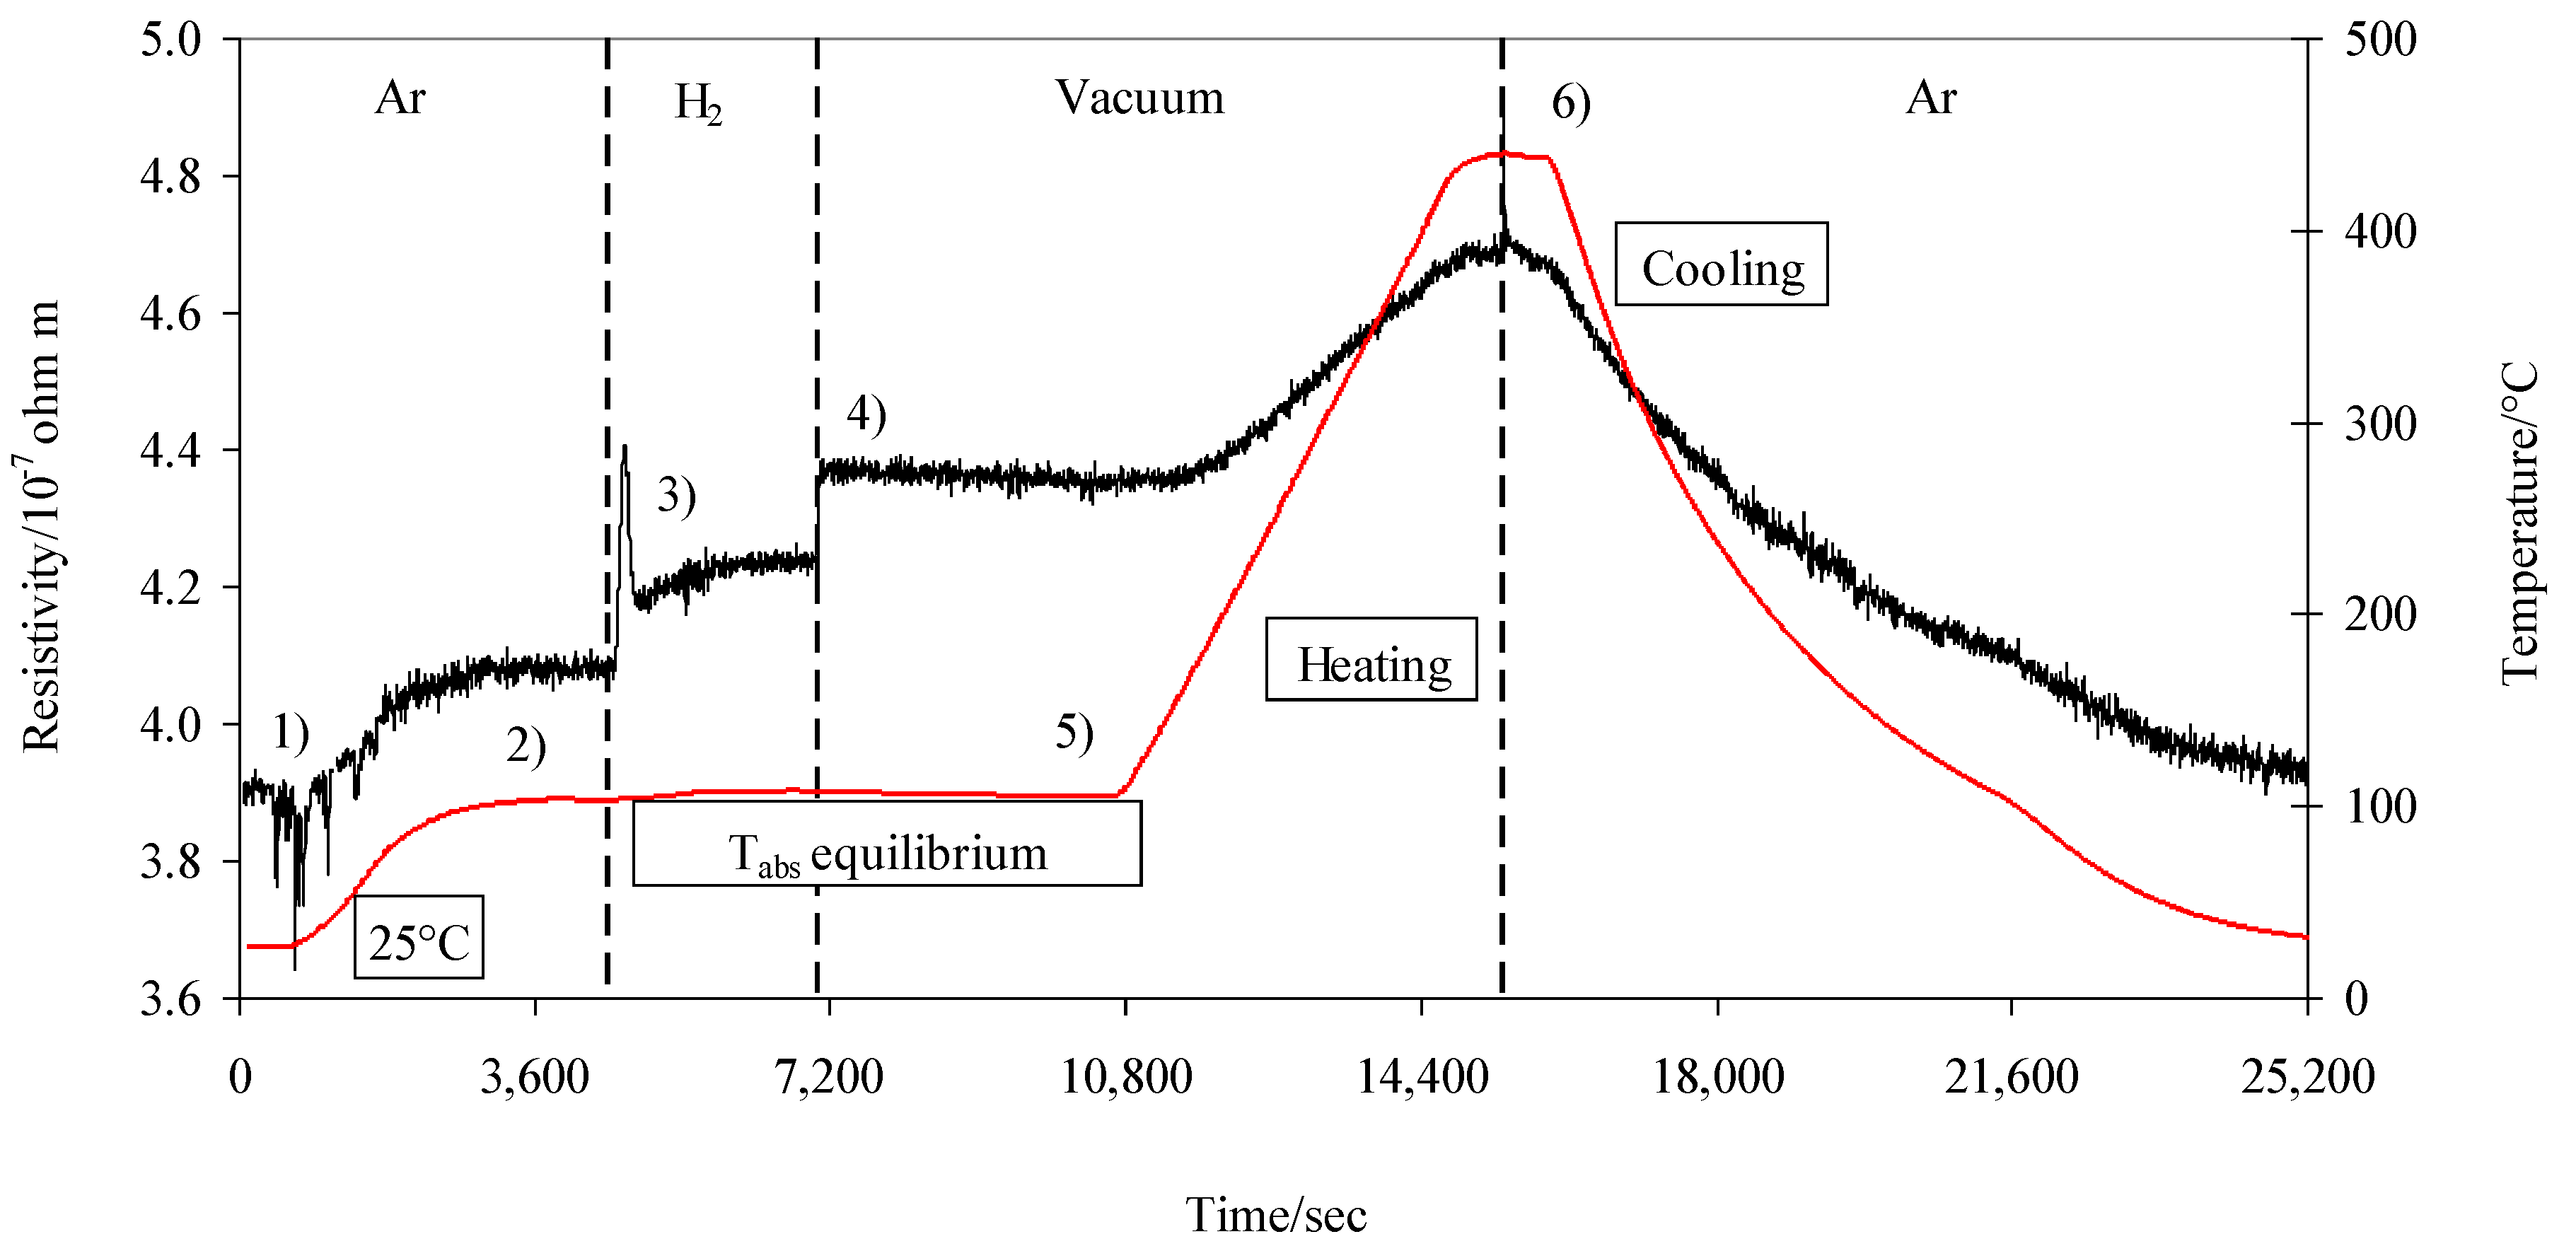
Figure 3.
Total resistivity (ρ), contribution due to the scattering measured in pure hydrogen (ρi), and contribution of ρT measured in argon of Pd–Ag 21 wt. % thin foil. For all temperatures, the measurements were performed at 100 kPa of hydrogen.
Figure 3.
Total resistivity (ρ), contribution due to the scattering measured in pure hydrogen (ρi), and contribution of ρT measured in argon of Pd–Ag 21 wt. % thin foil. For all temperatures, the measurements were performed at 100 kPa of hydrogen.
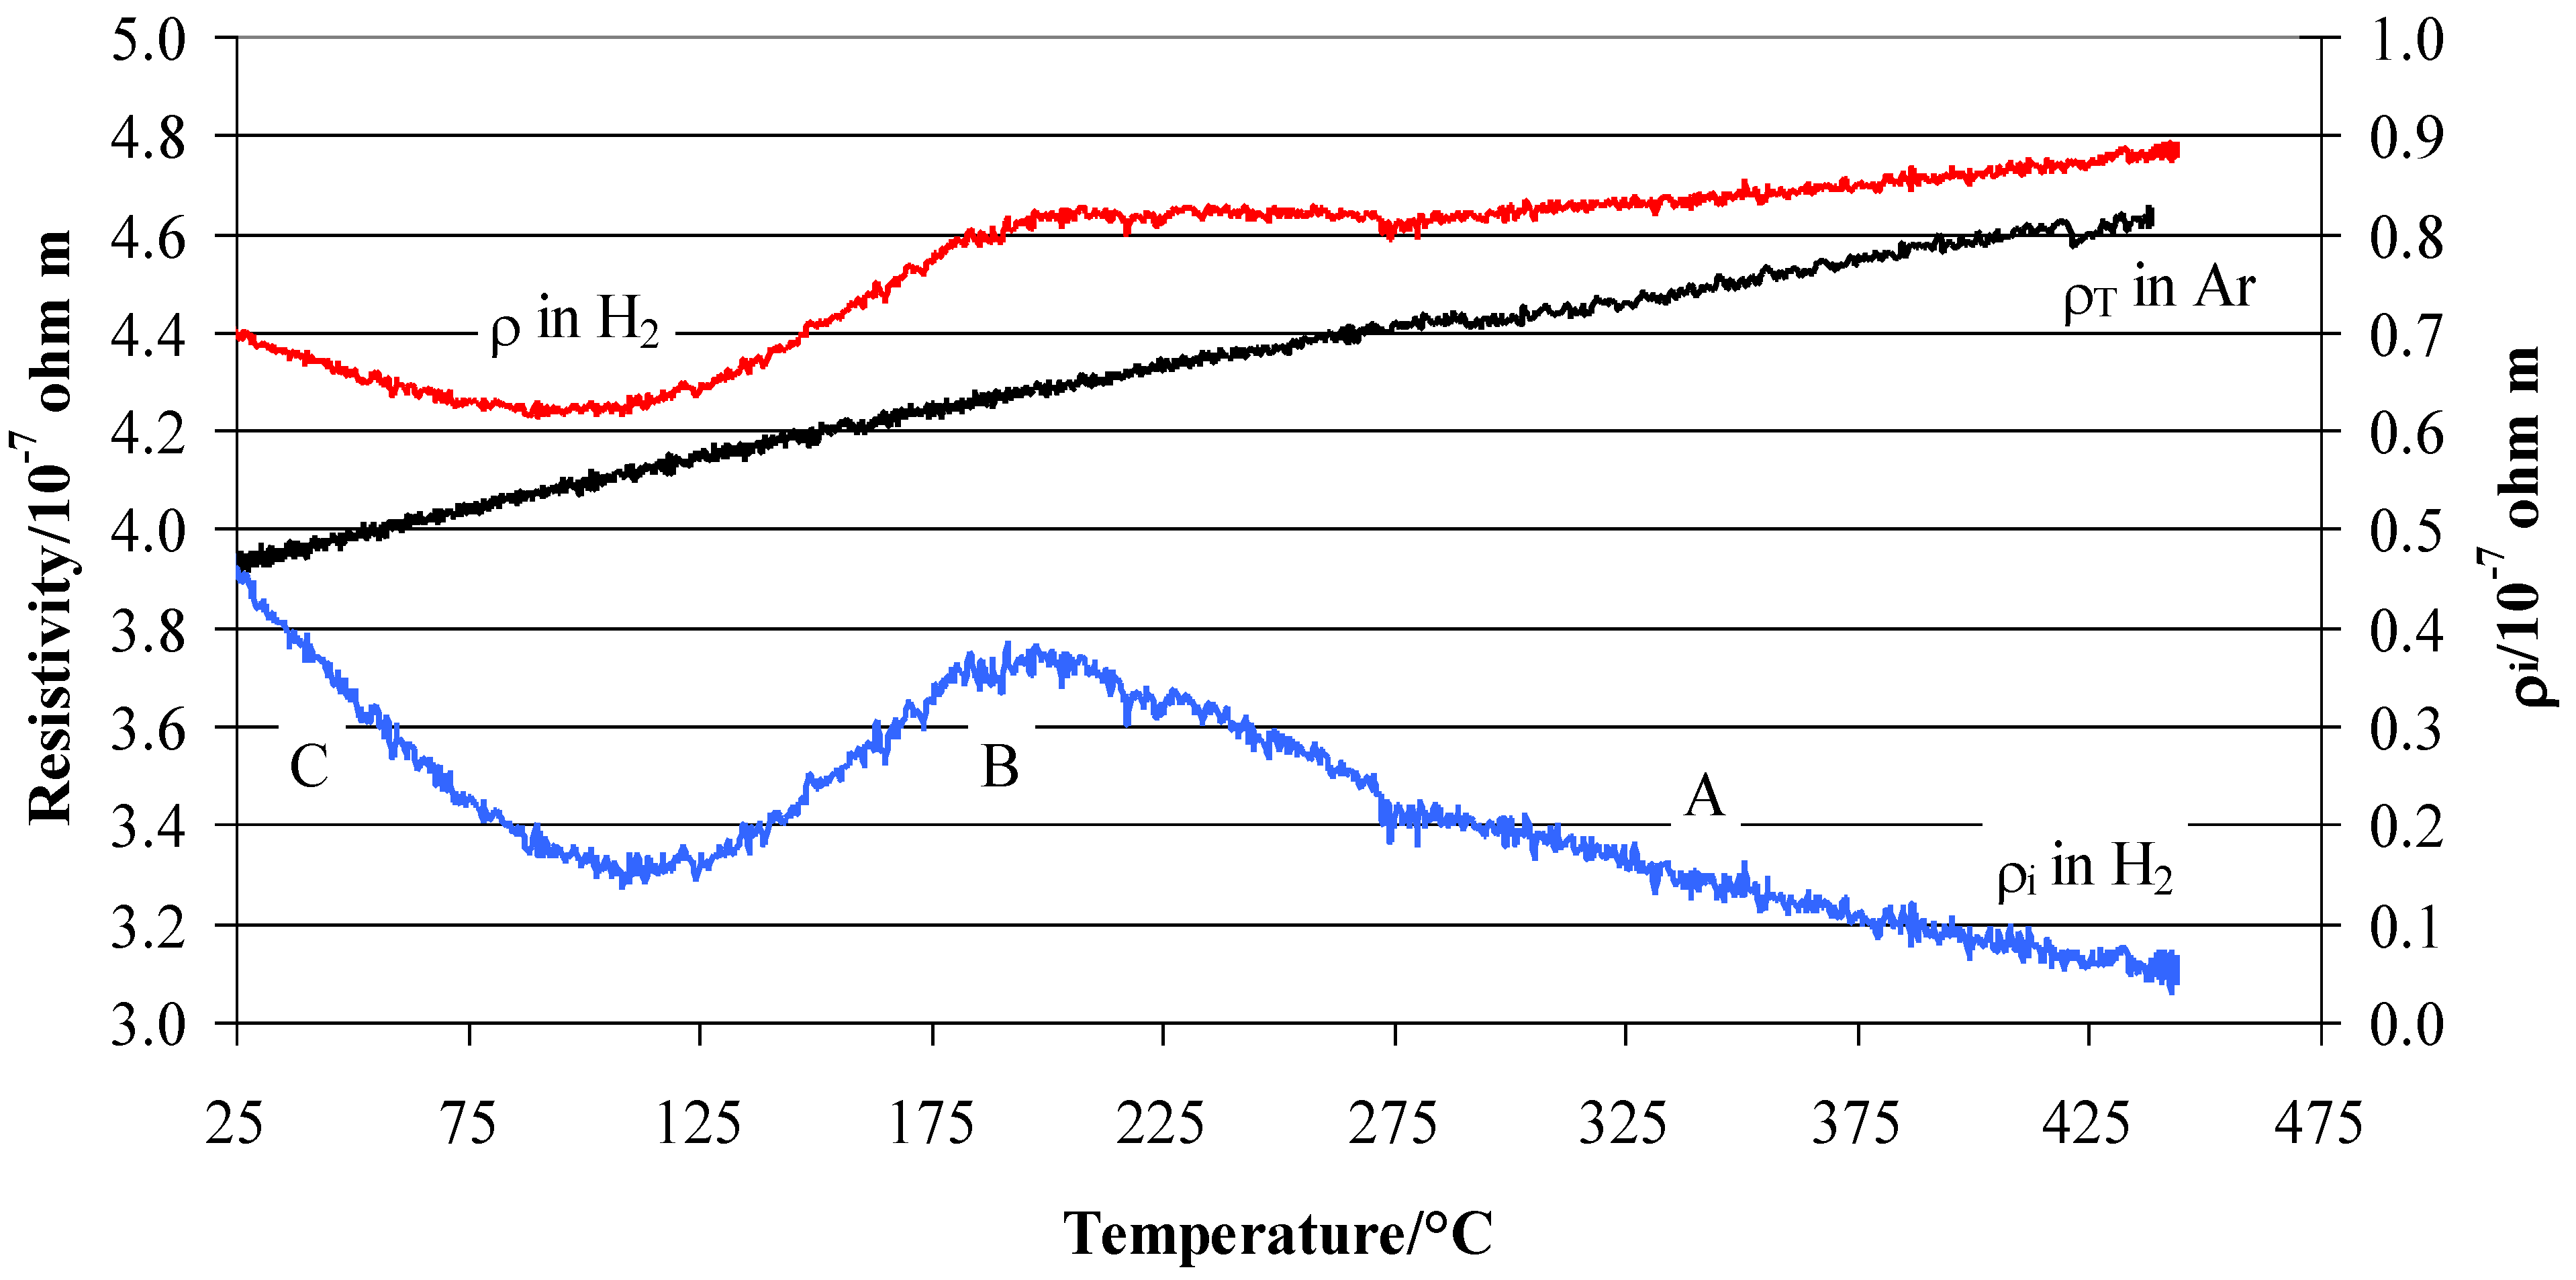
Figure 4.
Thermal desorption of H2 from Pd79–Ag21 foil after absorption at: (a) 25 °C; (b) 60 °C; (c) 100 °C; (d) 120 °C; (e) 140 °C; and (f) 160 °C.
Figure 4.
Thermal desorption of H2 from Pd79–Ag21 foil after absorption at: (a) 25 °C; (b) 60 °C; (c) 100 °C; (d) 120 °C; (e) 140 °C; and (f) 160 °C.
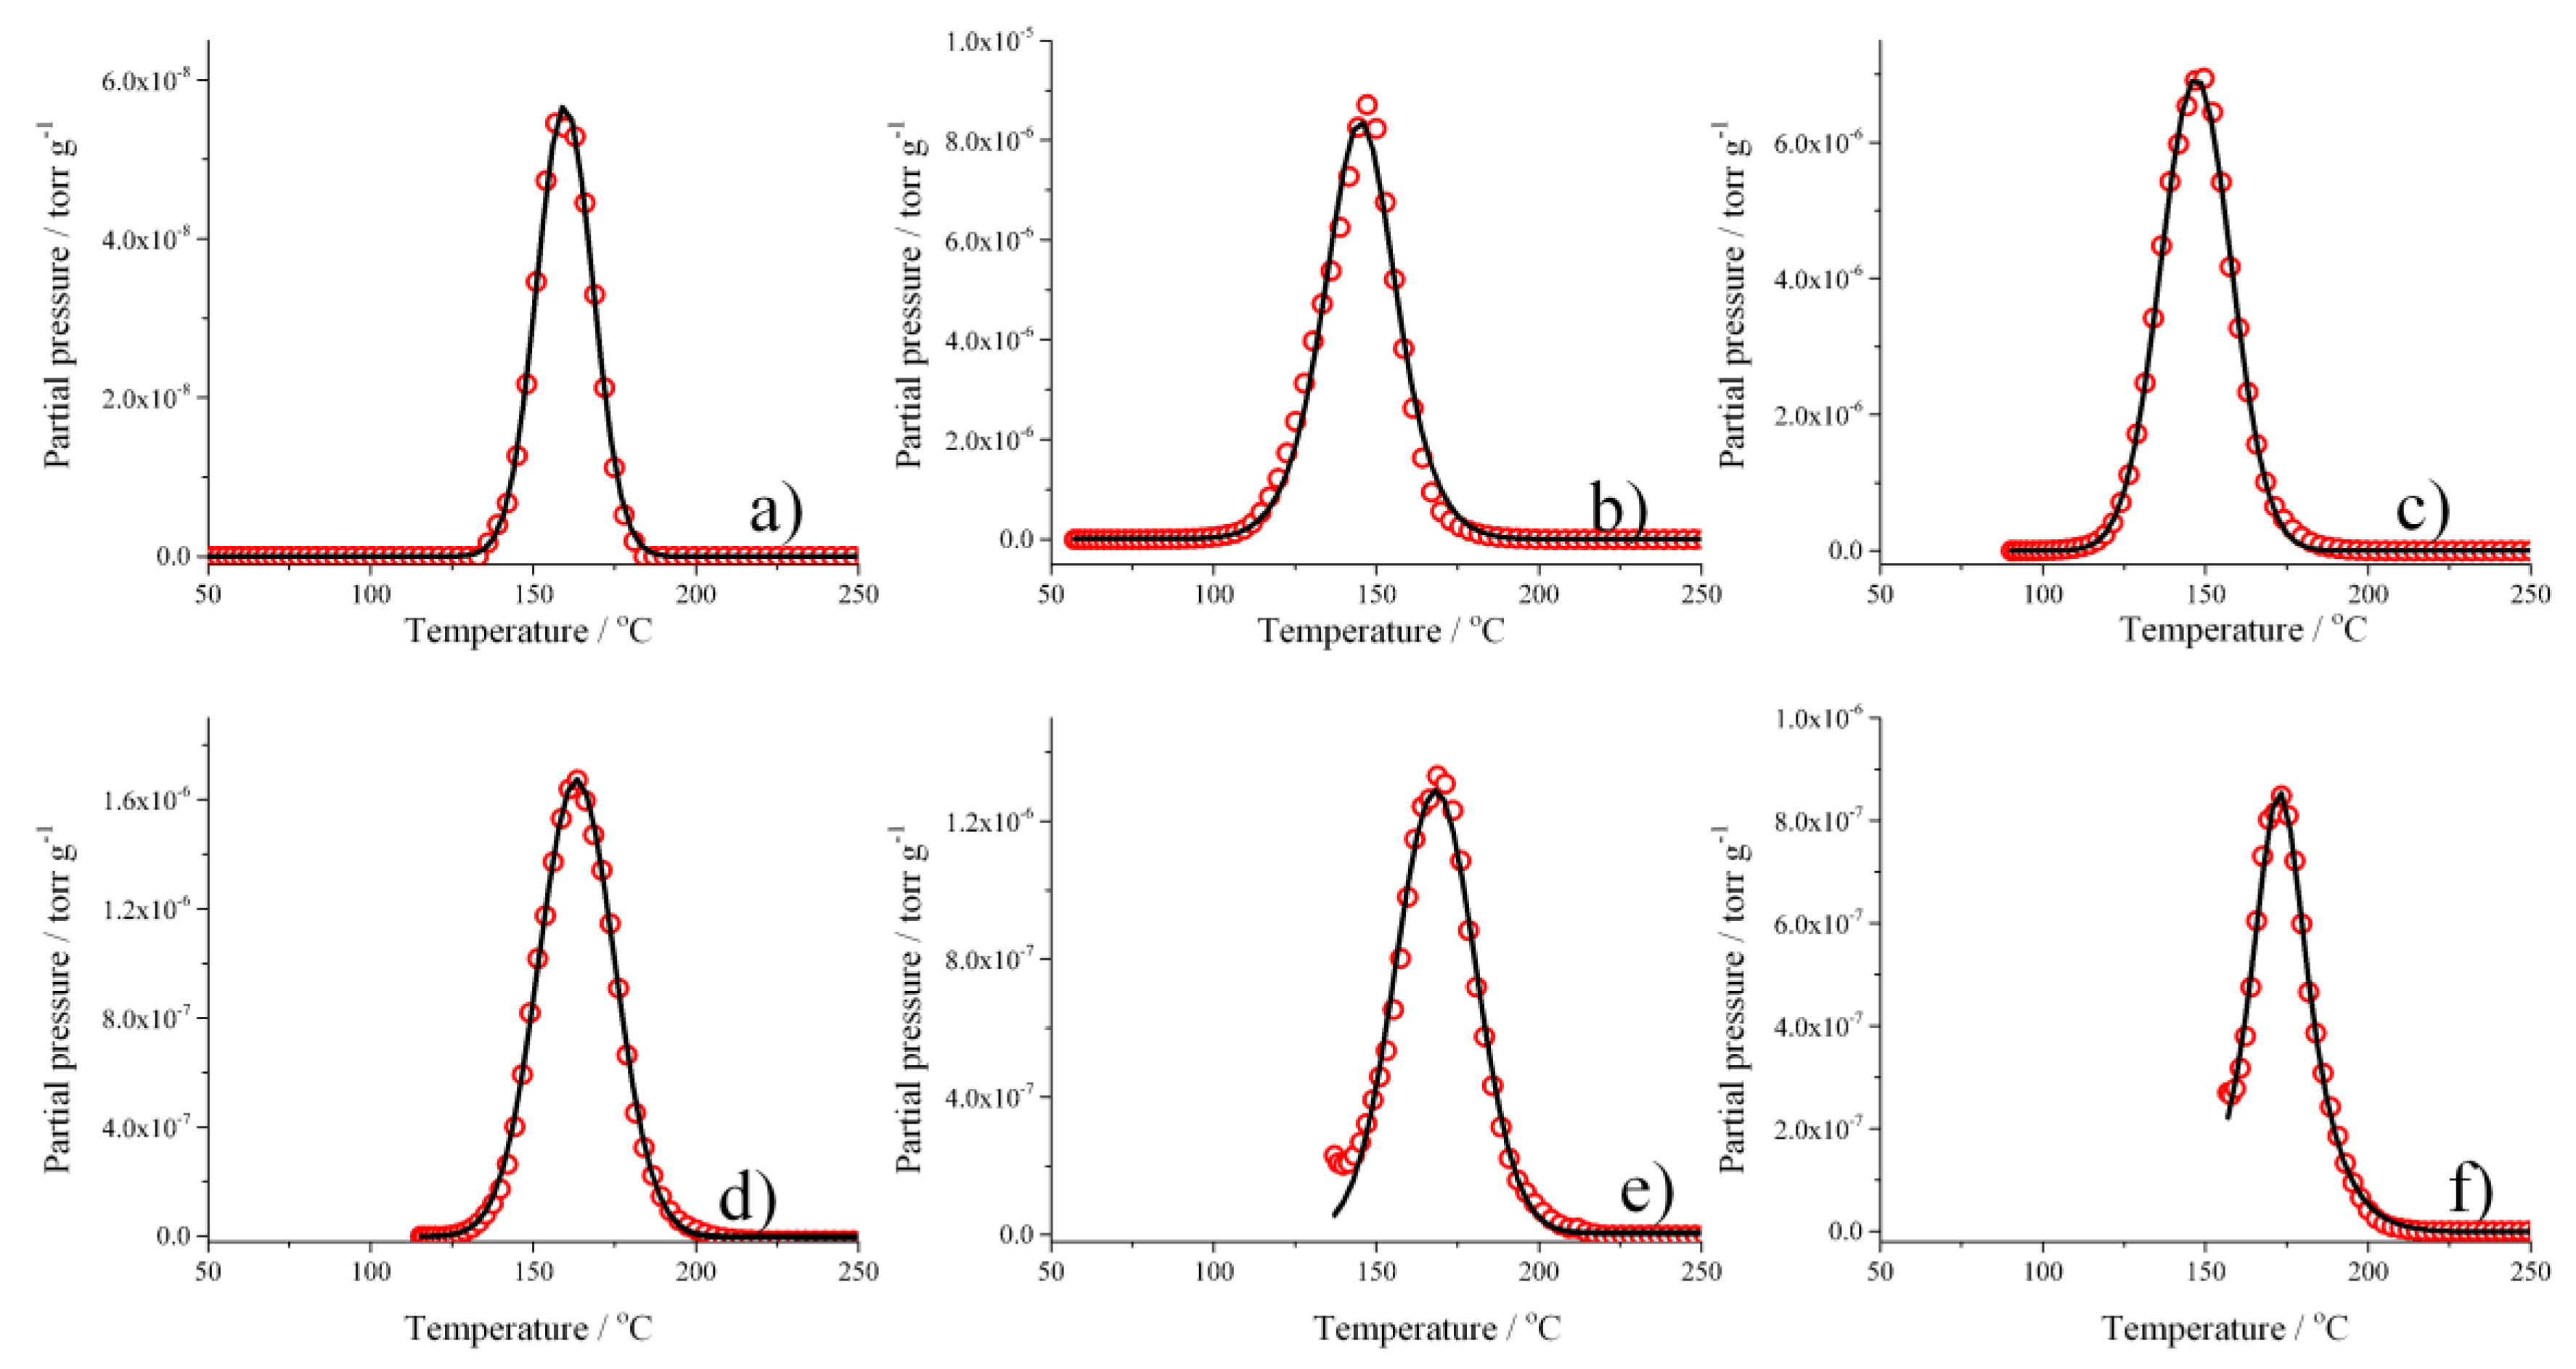
Figure 5.
The total area of H2 absorbed in Pd79–Ag21 foil for different absorption temperatures.

Figure 6.
Total resistivity ρ and its contribution due to the scattering ρi of Pd79–Ag21 foil measured in 100 kPa hydrogen at different temperatures.
Figure 6.
Total resistivity ρ and its contribution due to the scattering ρi of Pd79–Ag21 foil measured in 100 kPa hydrogen at different temperatures.
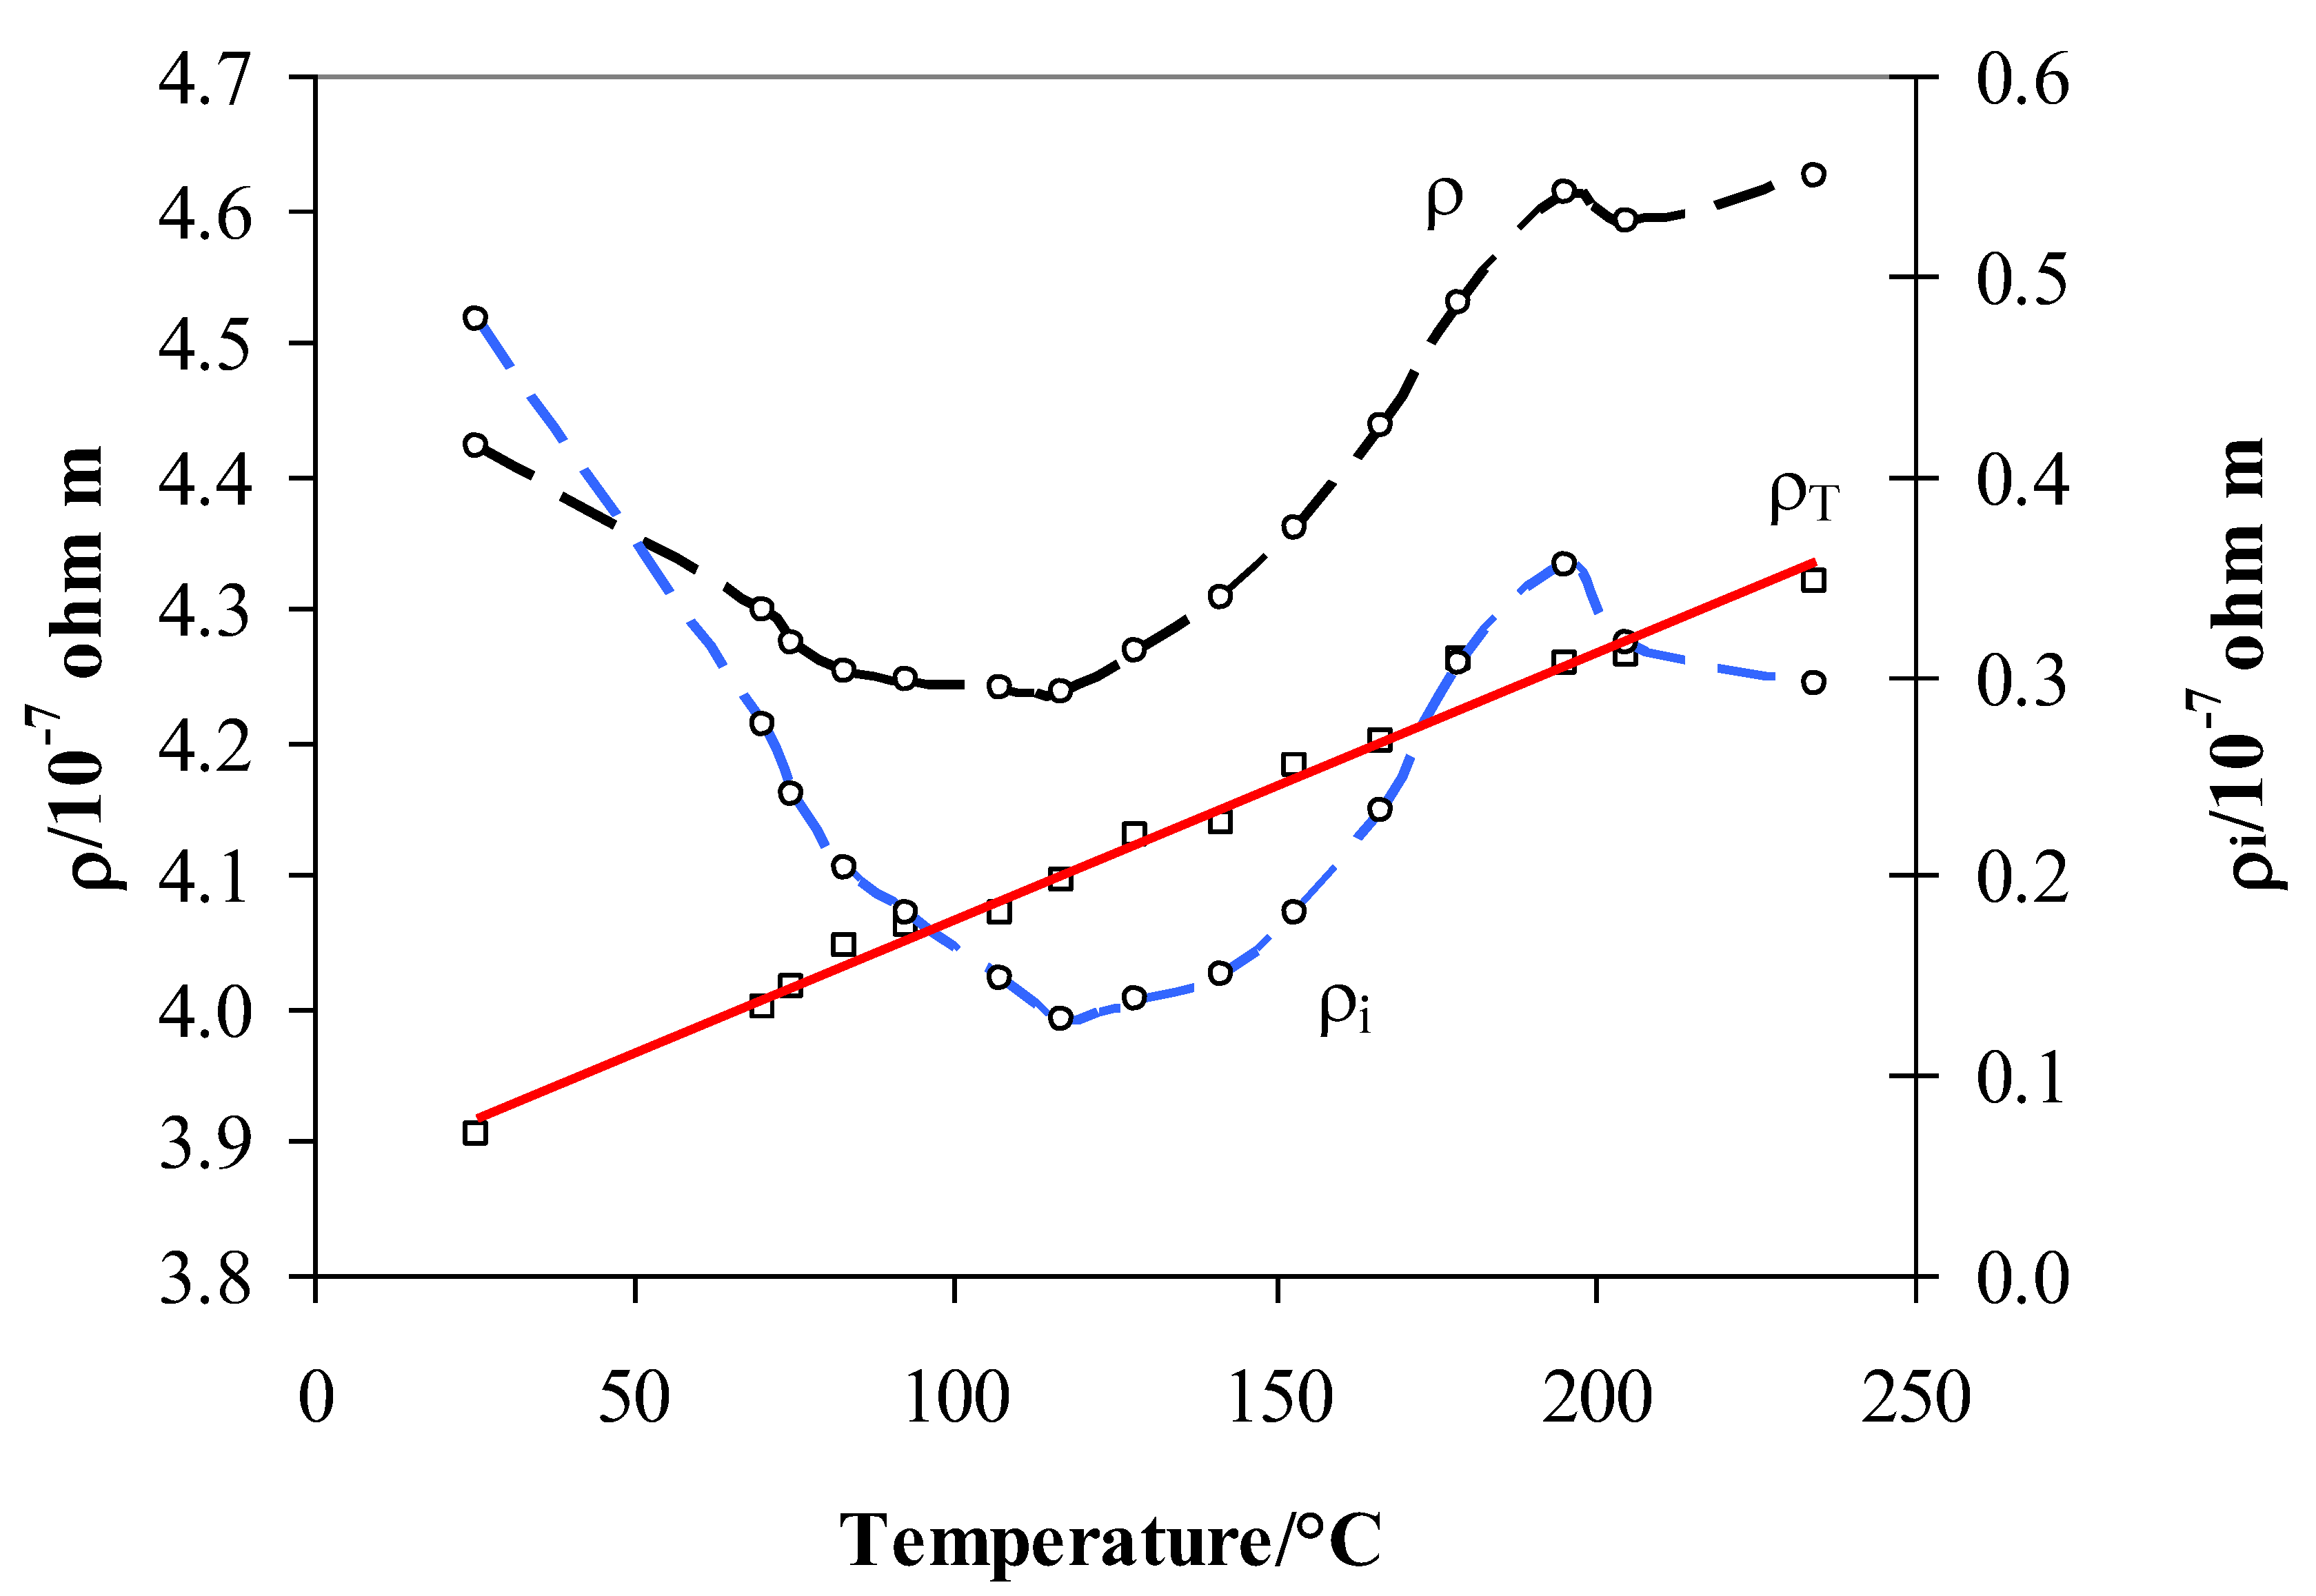
Figure 7.
Total resistivity ρ′ and its contribution due to the scattering ρi′ of Pd79–Ag21 foil measured after the vacuum step at different temperatures.
Figure 7.
Total resistivity ρ′ and its contribution due to the scattering ρi′ of Pd79–Ag21 foil measured after the vacuum step at different temperatures.
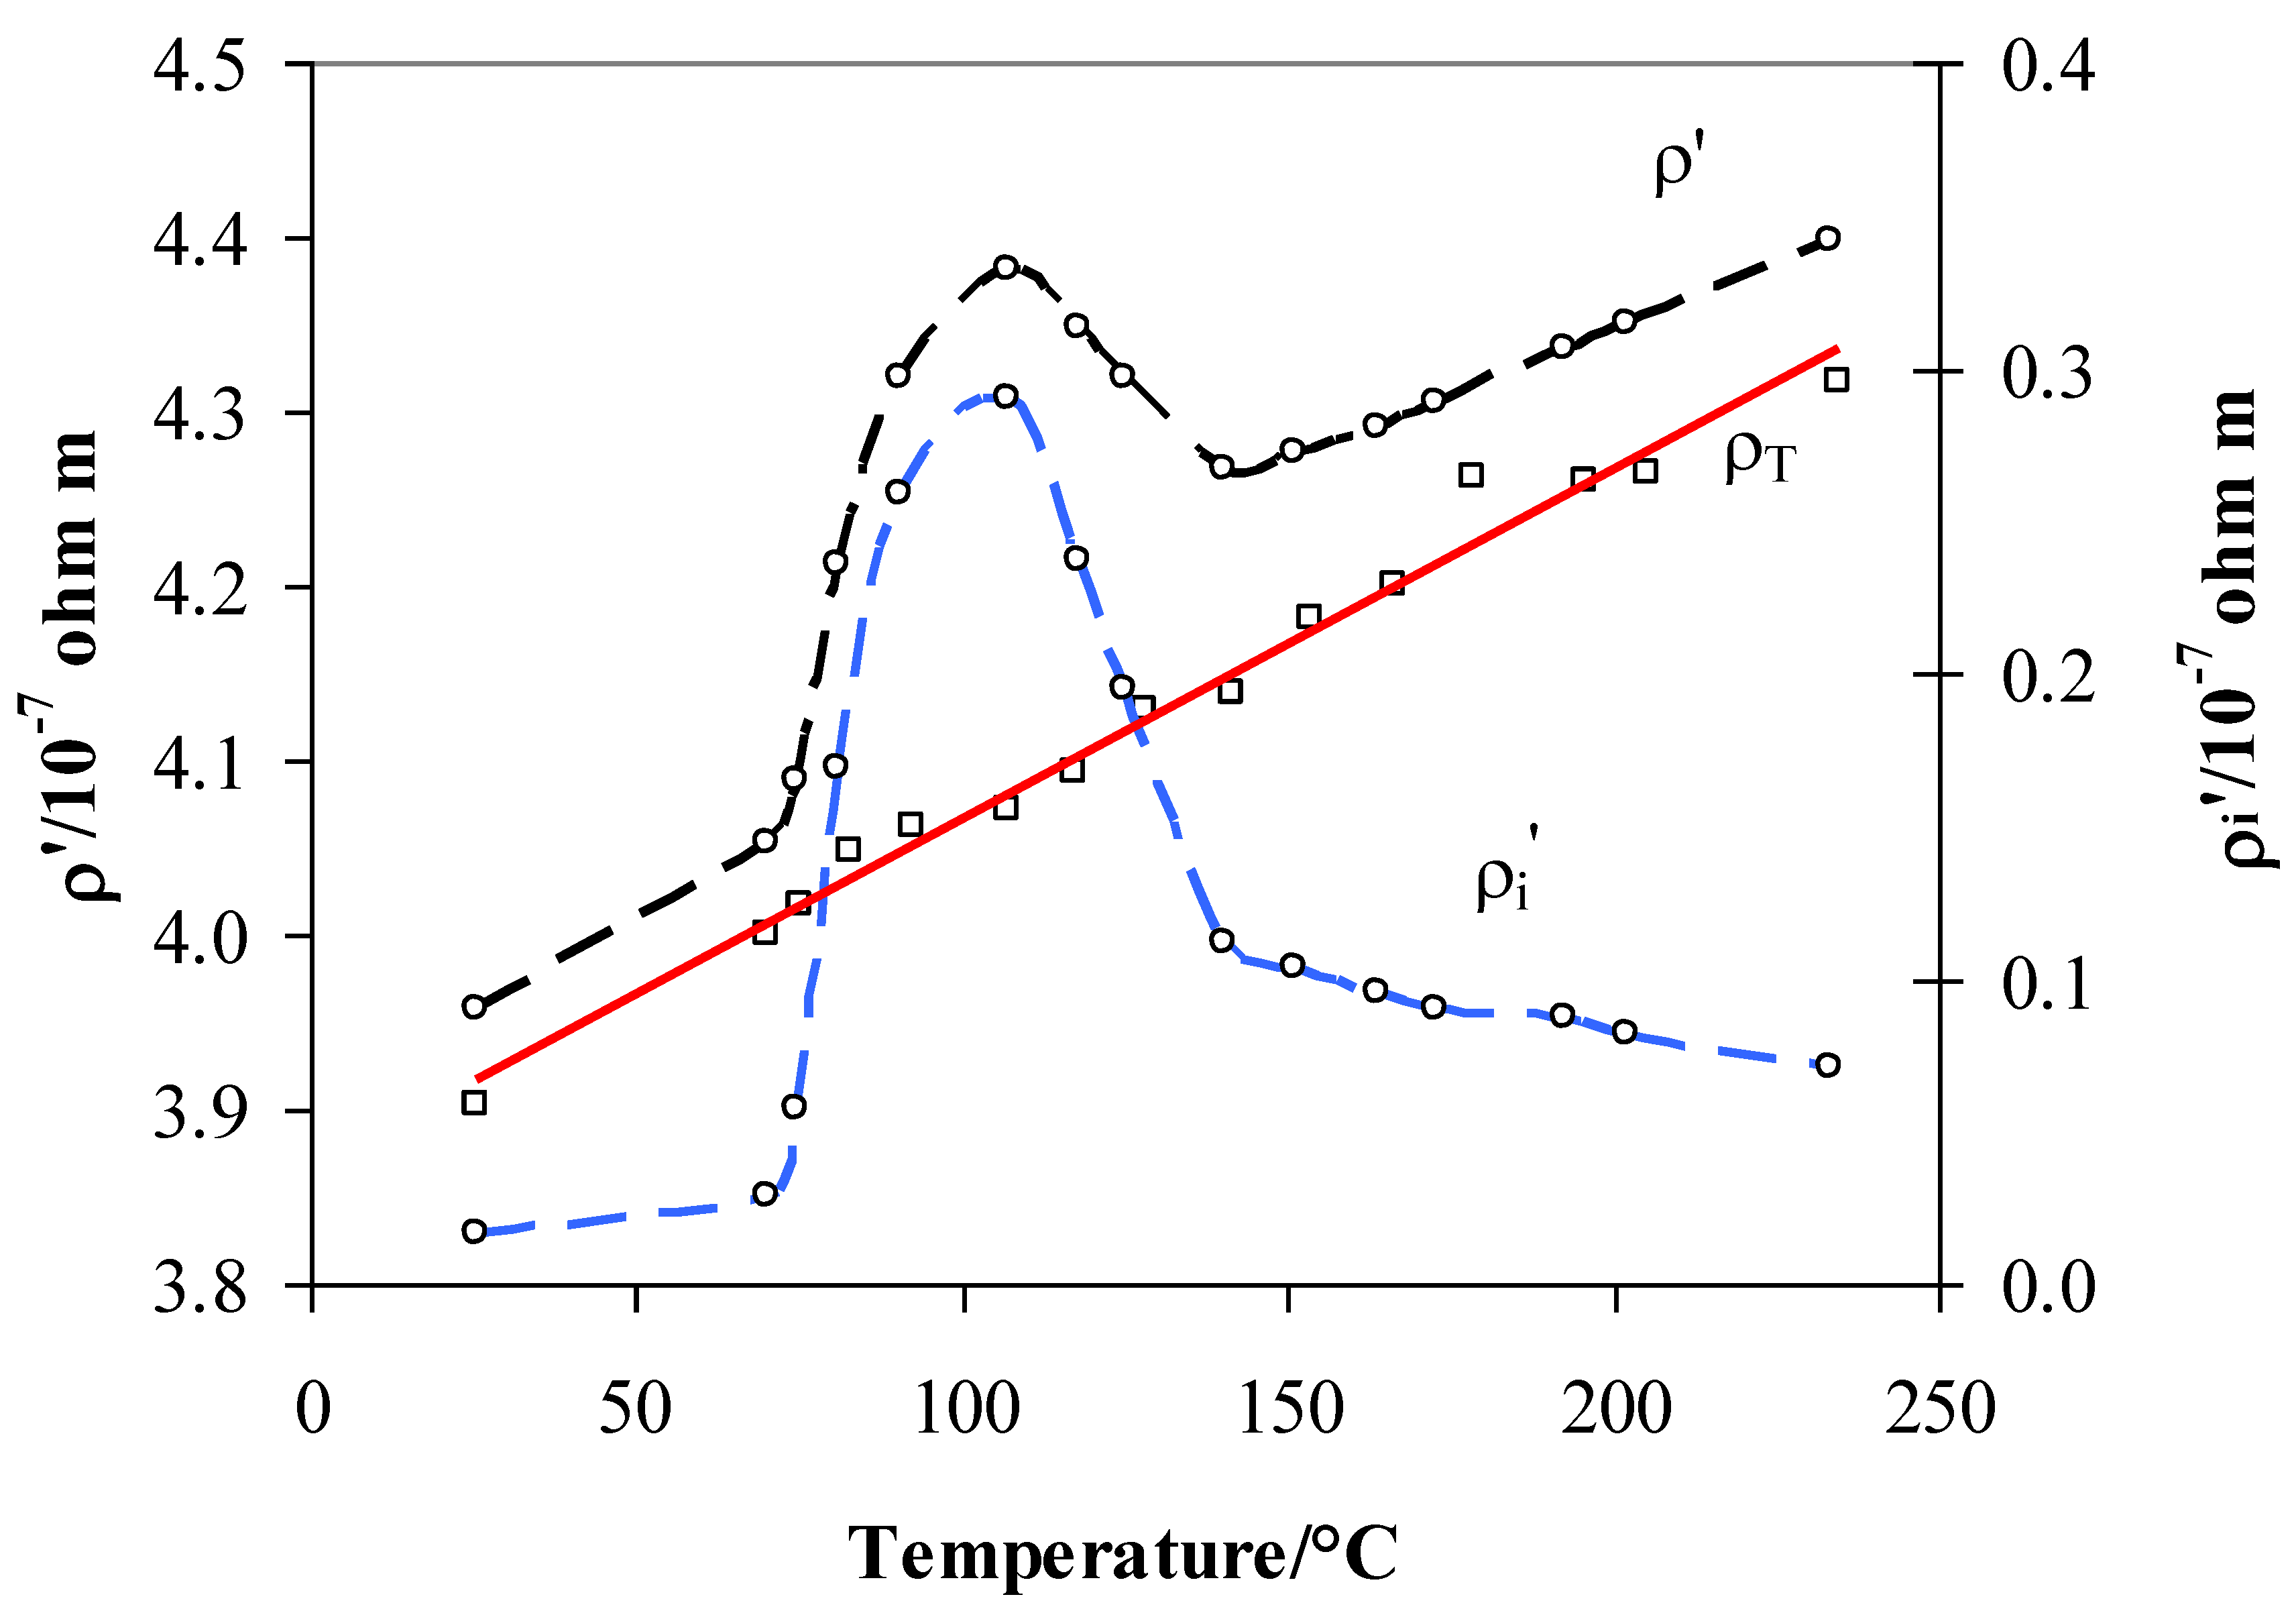
Figure 8.
The resistivity contribution due to the scattering of ρi measured in pure hydrogen and in a vacuum (ρi’) with the H/M vs. temperature in pure hydrogen at 100 kPa.
Figure 8.
The resistivity contribution due to the scattering of ρi measured in pure hydrogen and in a vacuum (ρi’) with the H/M vs. temperature in pure hydrogen at 100 kPa.

Table 1.
The hydrogen position in the Pd79–Ag21 lattice vs. H/M, temperature, related role, and resistivity trends.
Table 1.
The hydrogen position in the Pd79–Ag21 lattice vs. H/M, temperature, related role, and resistivity trends.
| Temperature/°C | H/M | H Position | Resistivity | Role |
|---|---|---|---|---|
| >200 | 0–0.20 | Octahedral | Increase | d-band filling |
| 200–110 | 0.20–0.39 | Octahedral | Decrease | Number of valence e− increases |
| <110 | >0.39 | Octahedral ↔ Tetrahedral | Increase | Scattering effect |
© 2019 by the authors. Licensee MDPI, Basel, Switzerland. This article is an open access article distributed under the terms and conditions of the Creative Commons Attribution (CC BY) license (http://creativecommons.org/licenses/by/4.0/).
Share and Cite
MDPI and ACS Style
Pozio, A.; Jovanovic, Z.; Tosti, S. Hydrogen Absorption in Pd–Ag Systems: A TPD and Electrical Resistivity Study. Materials 2019, 12, 3160. https://doi.org/10.3390/ma12193160
AMA Style
Pozio A, Jovanovic Z, Tosti S. Hydrogen Absorption in Pd–Ag Systems: A TPD and Electrical Resistivity Study. Materials. 2019; 12(19):3160. https://doi.org/10.3390/ma12193160
Chicago/Turabian StylePozio, Alfonso, Zoran Jovanovic, and Silvano Tosti. 2019. "Hydrogen Absorption in Pd–Ag Systems: A TPD and Electrical Resistivity Study" Materials 12, no. 19: 3160. https://doi.org/10.3390/ma12193160
Note that from the first issue of 2016, this journal uses article numbers instead of page numbers. See further details here.