Relationship between Phase Occurrence, Chemical Composition, and Corrosion Behavior of as-Solidified Al–Pd–Co Alloys

 , ,
, ,
Abstract
:
1. Introduction
2. Materials and Methods
3. Results and Discussion
3.1. Microstructure and Phase Occurrence before Corrosion Testing
3.2. Corrosion Behavior
4. Conclusions
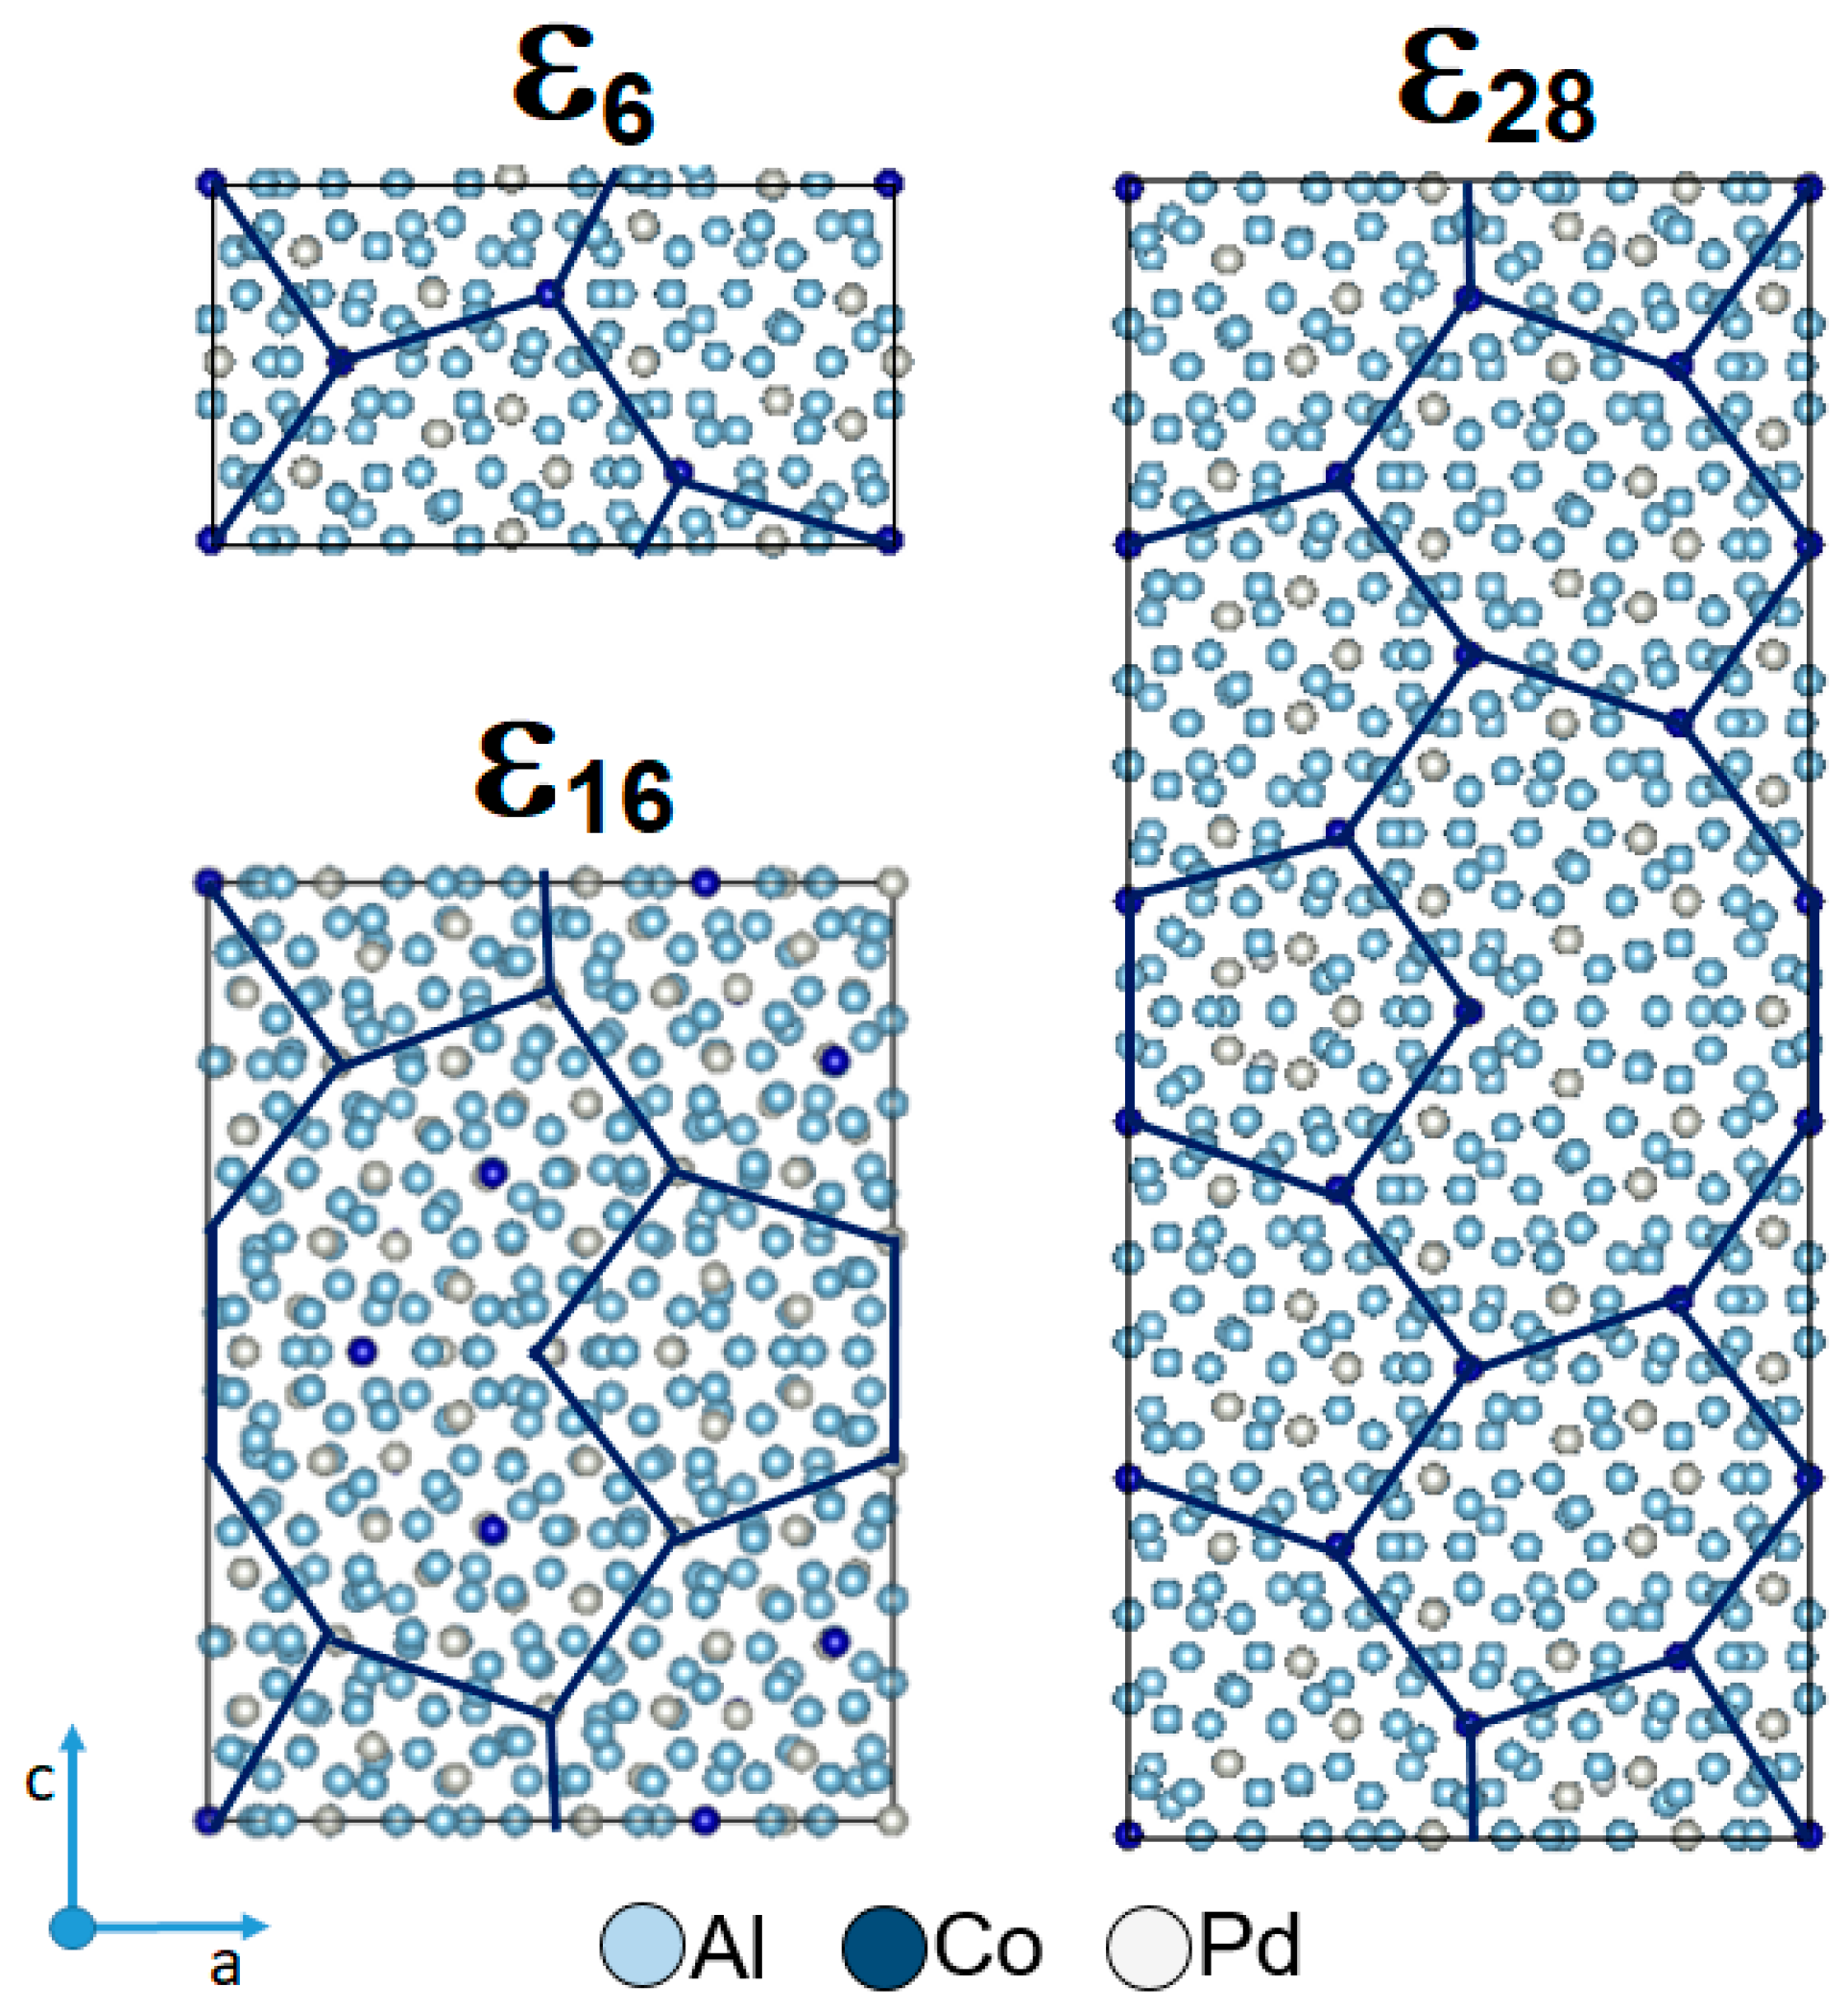
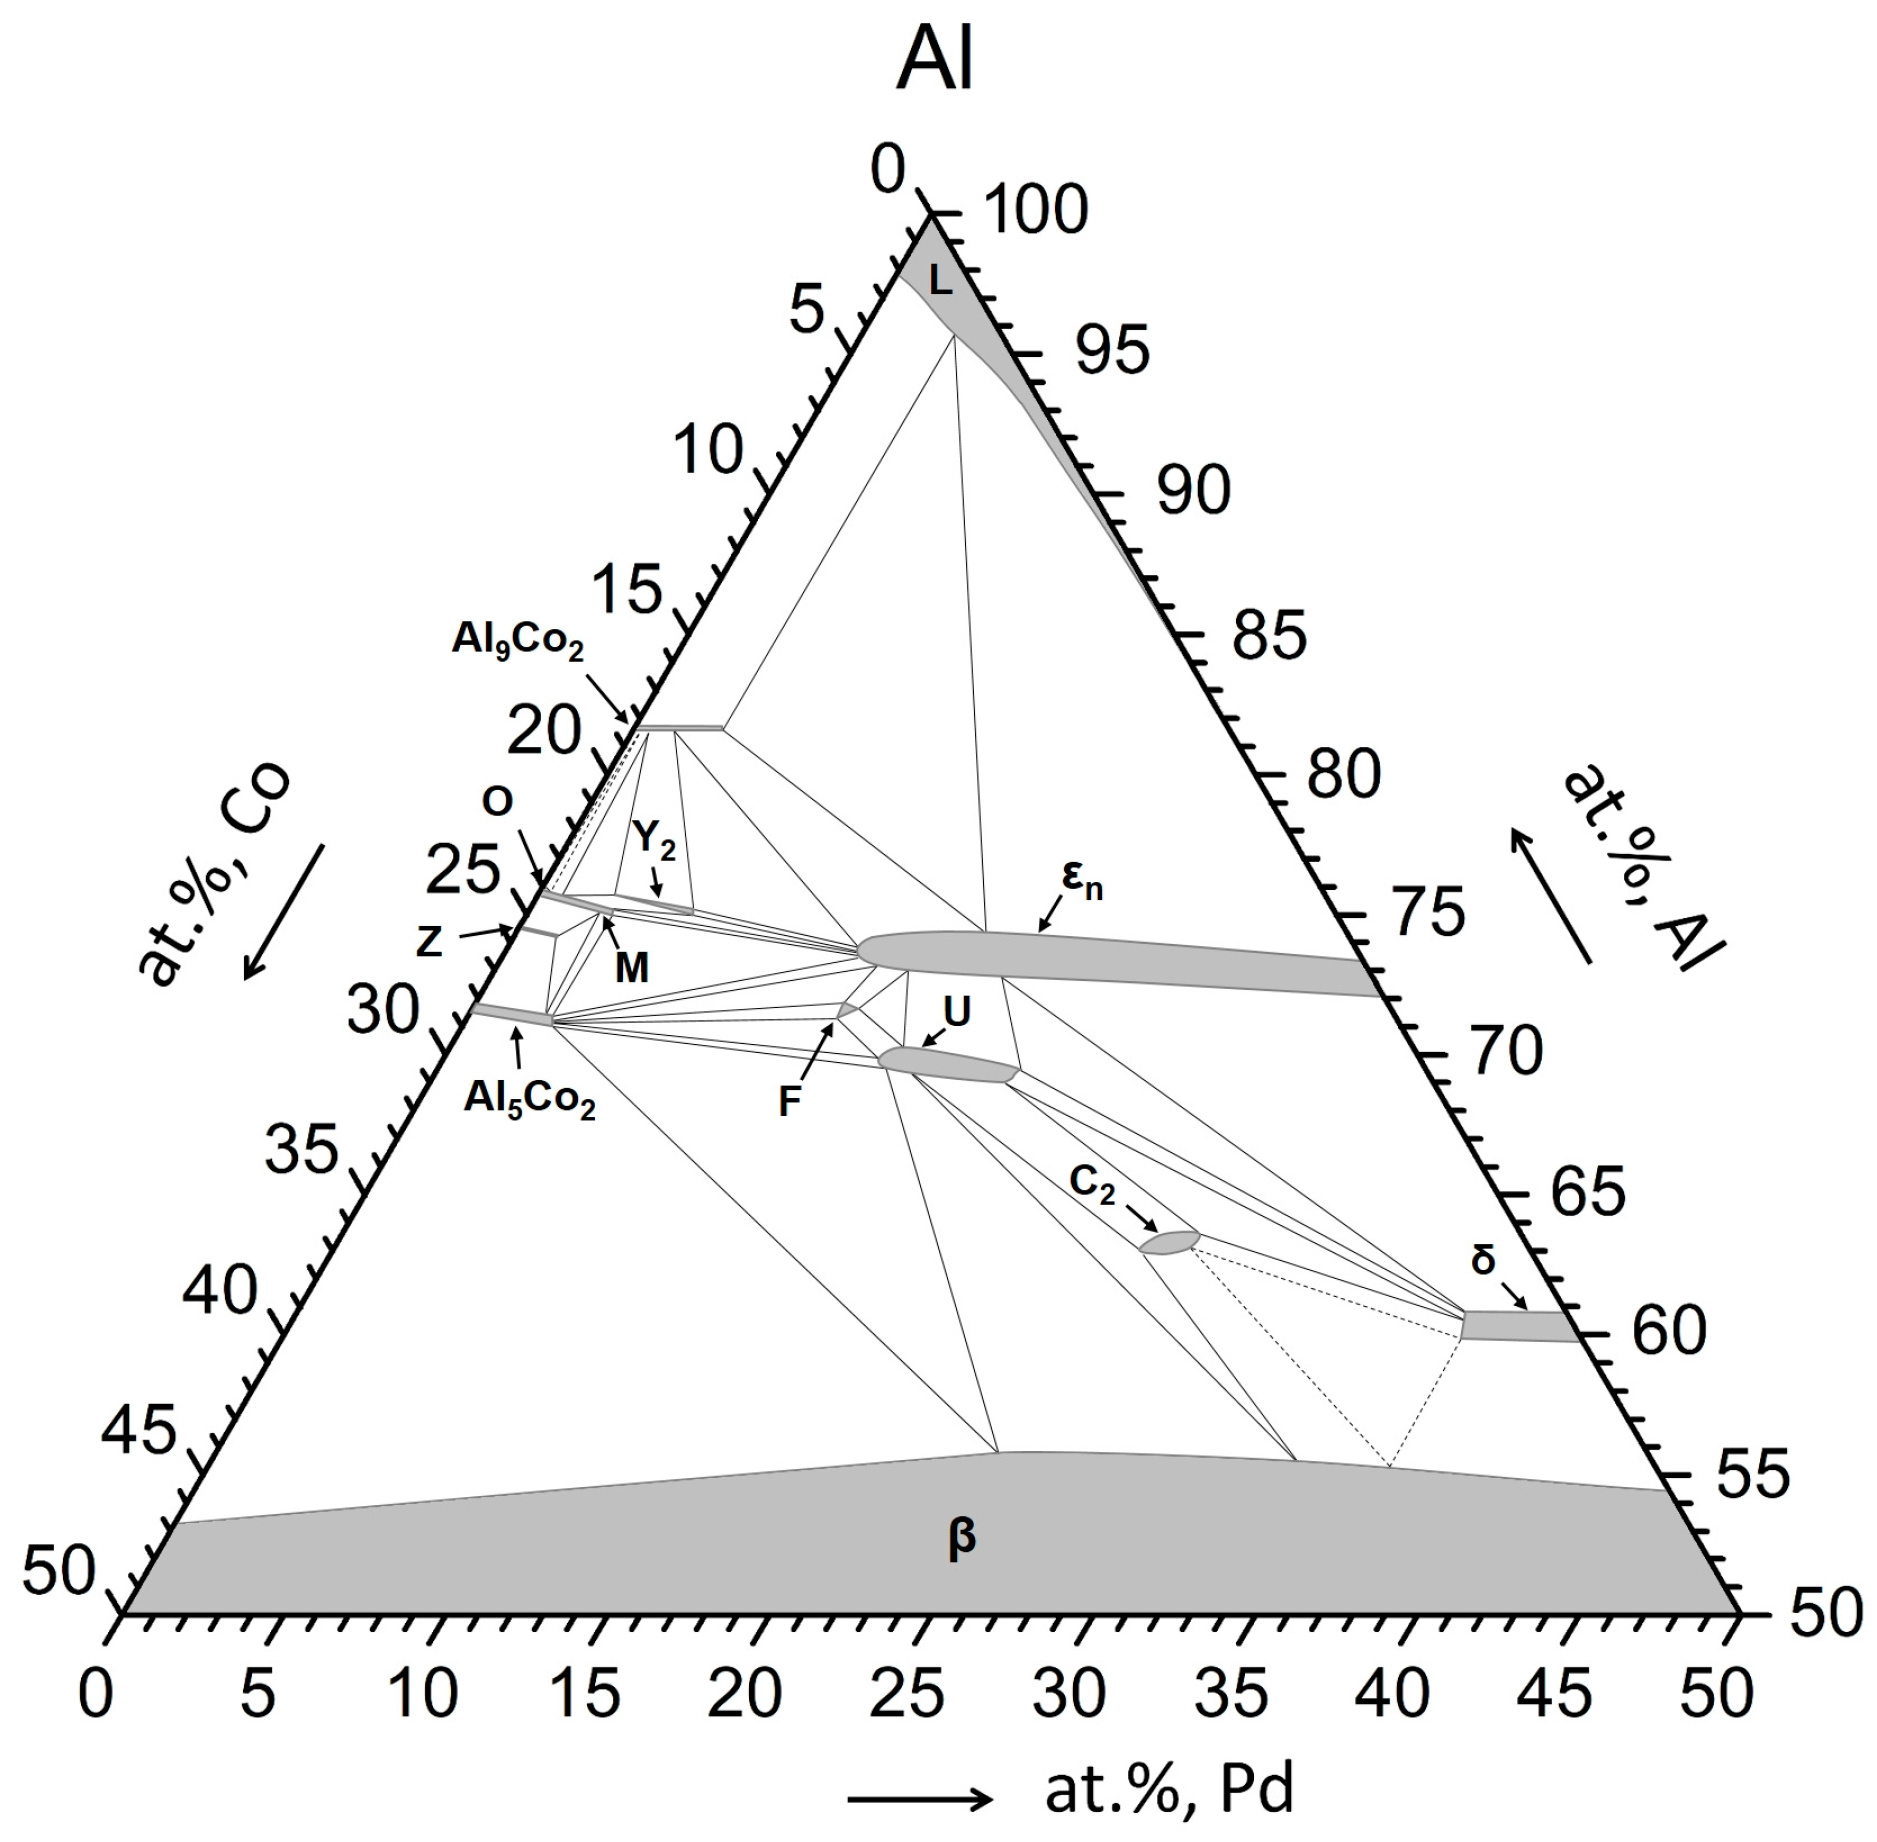
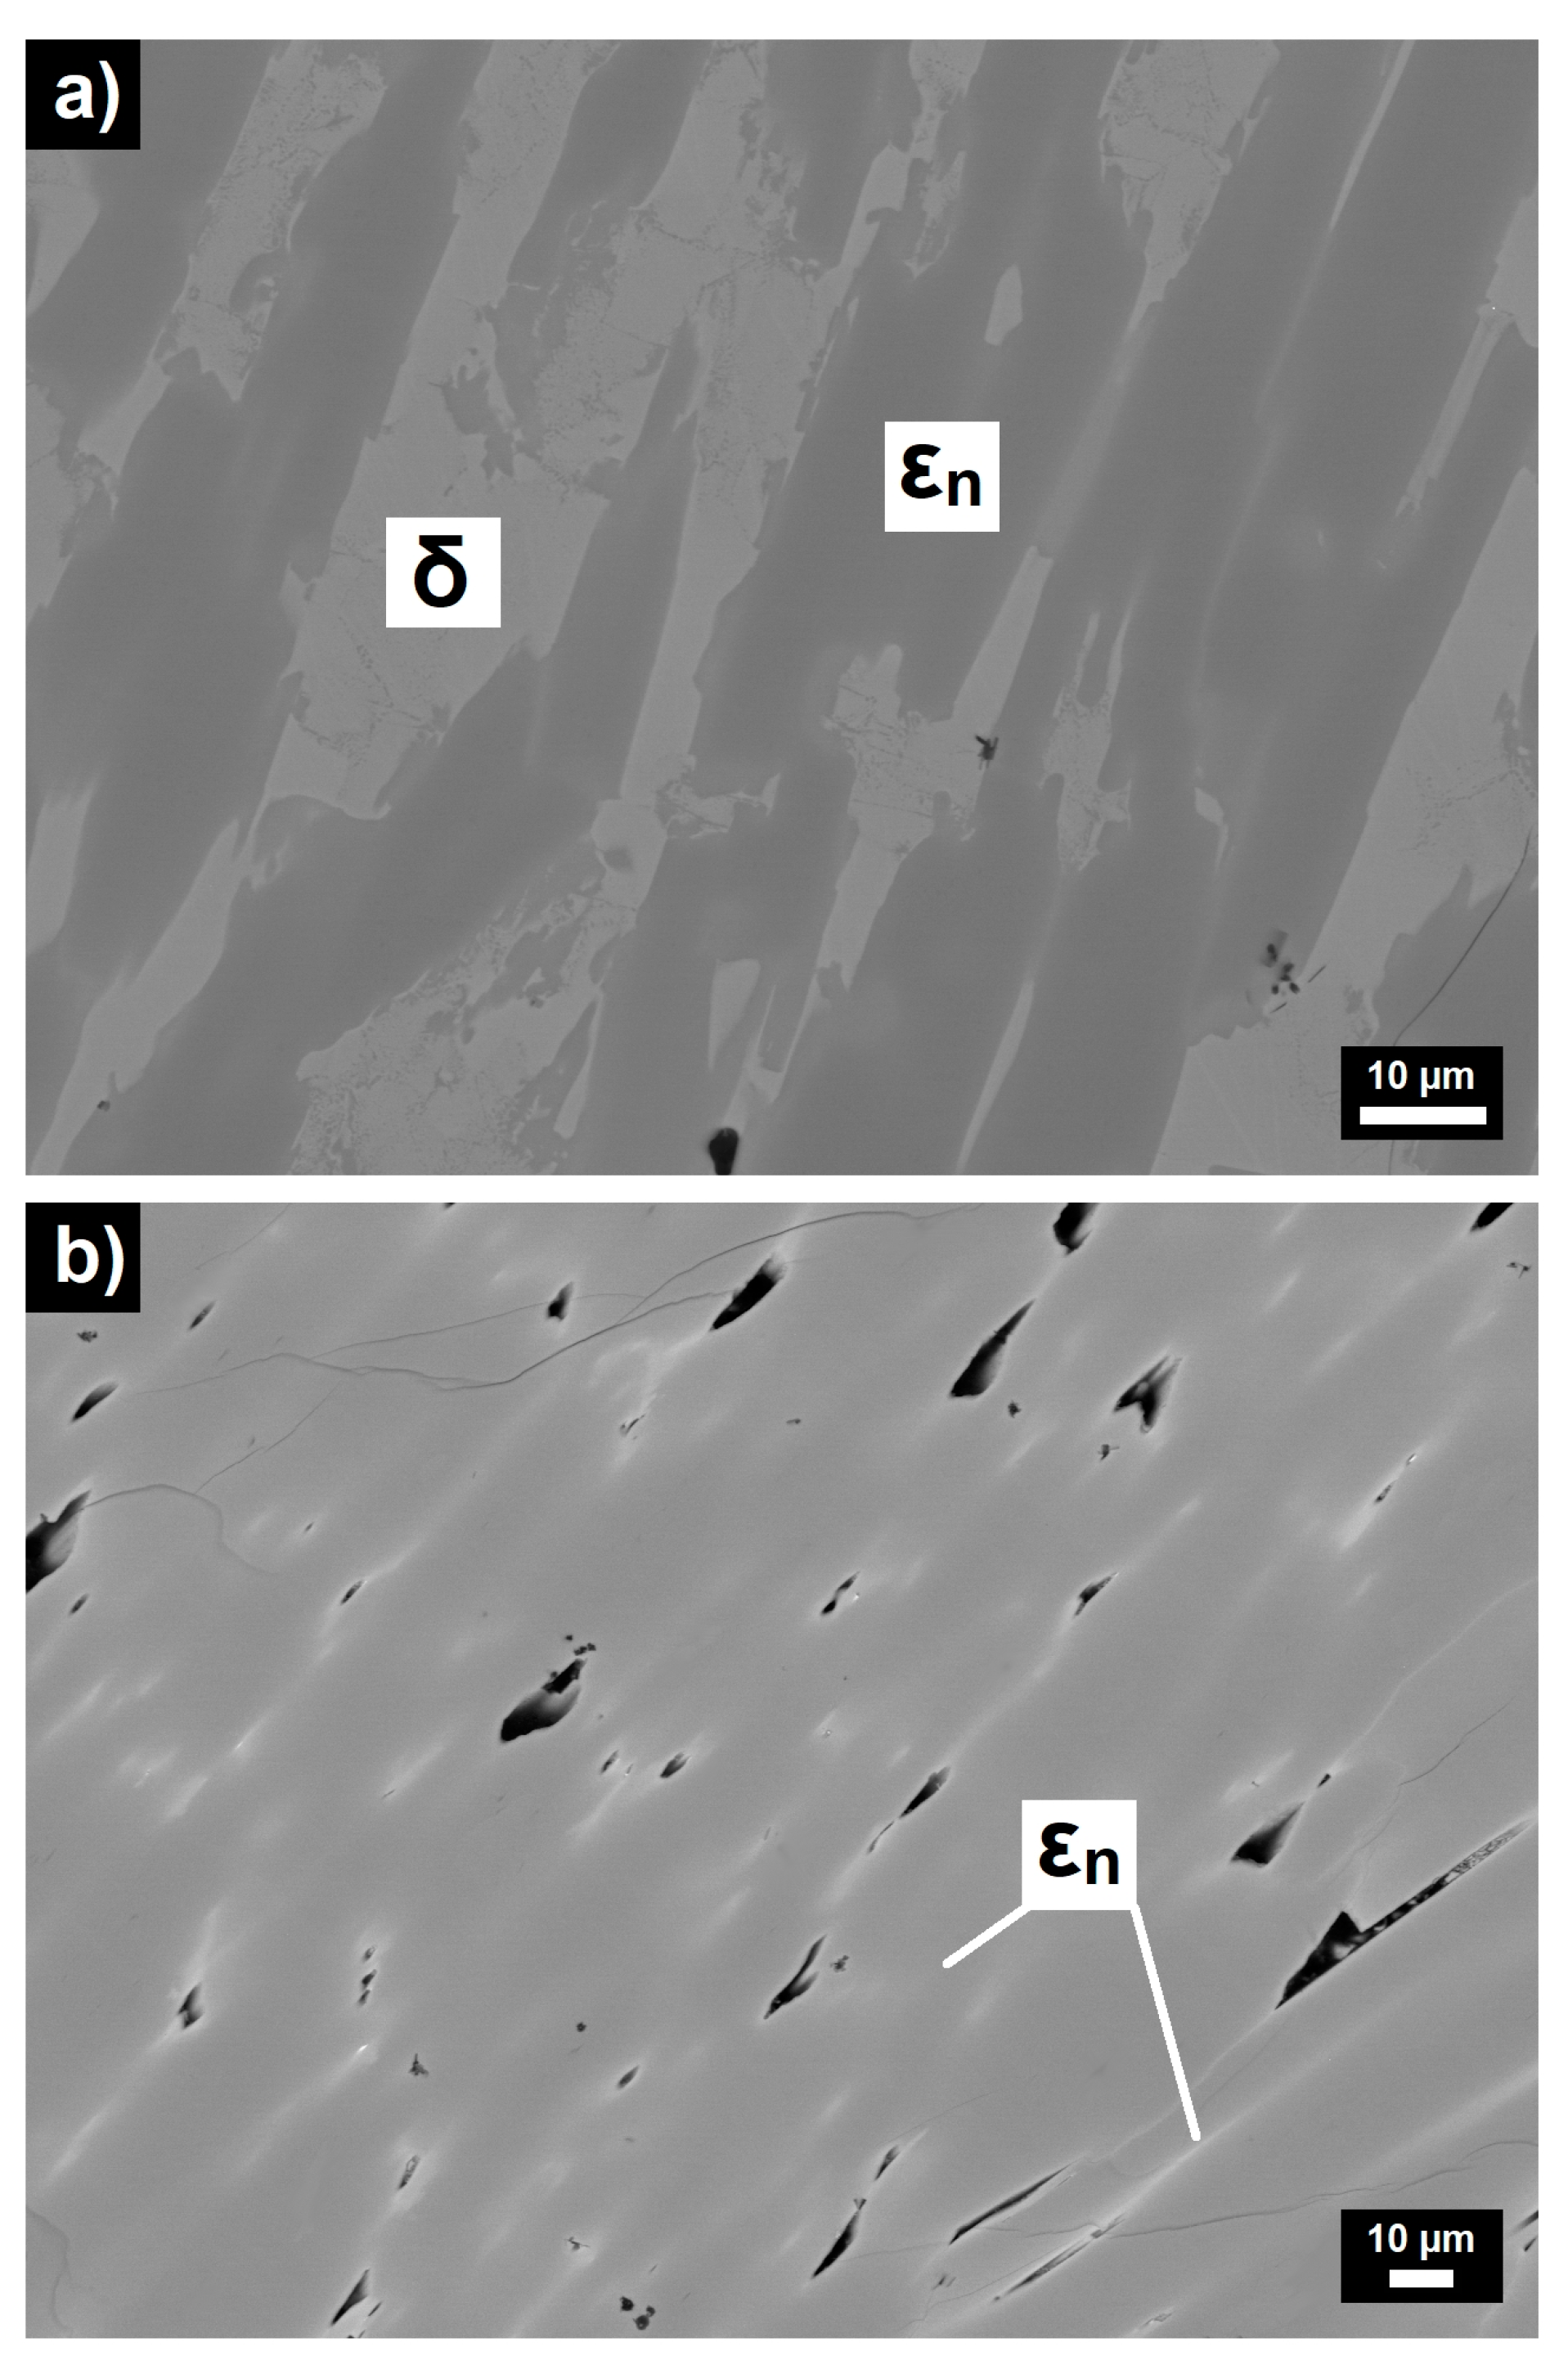
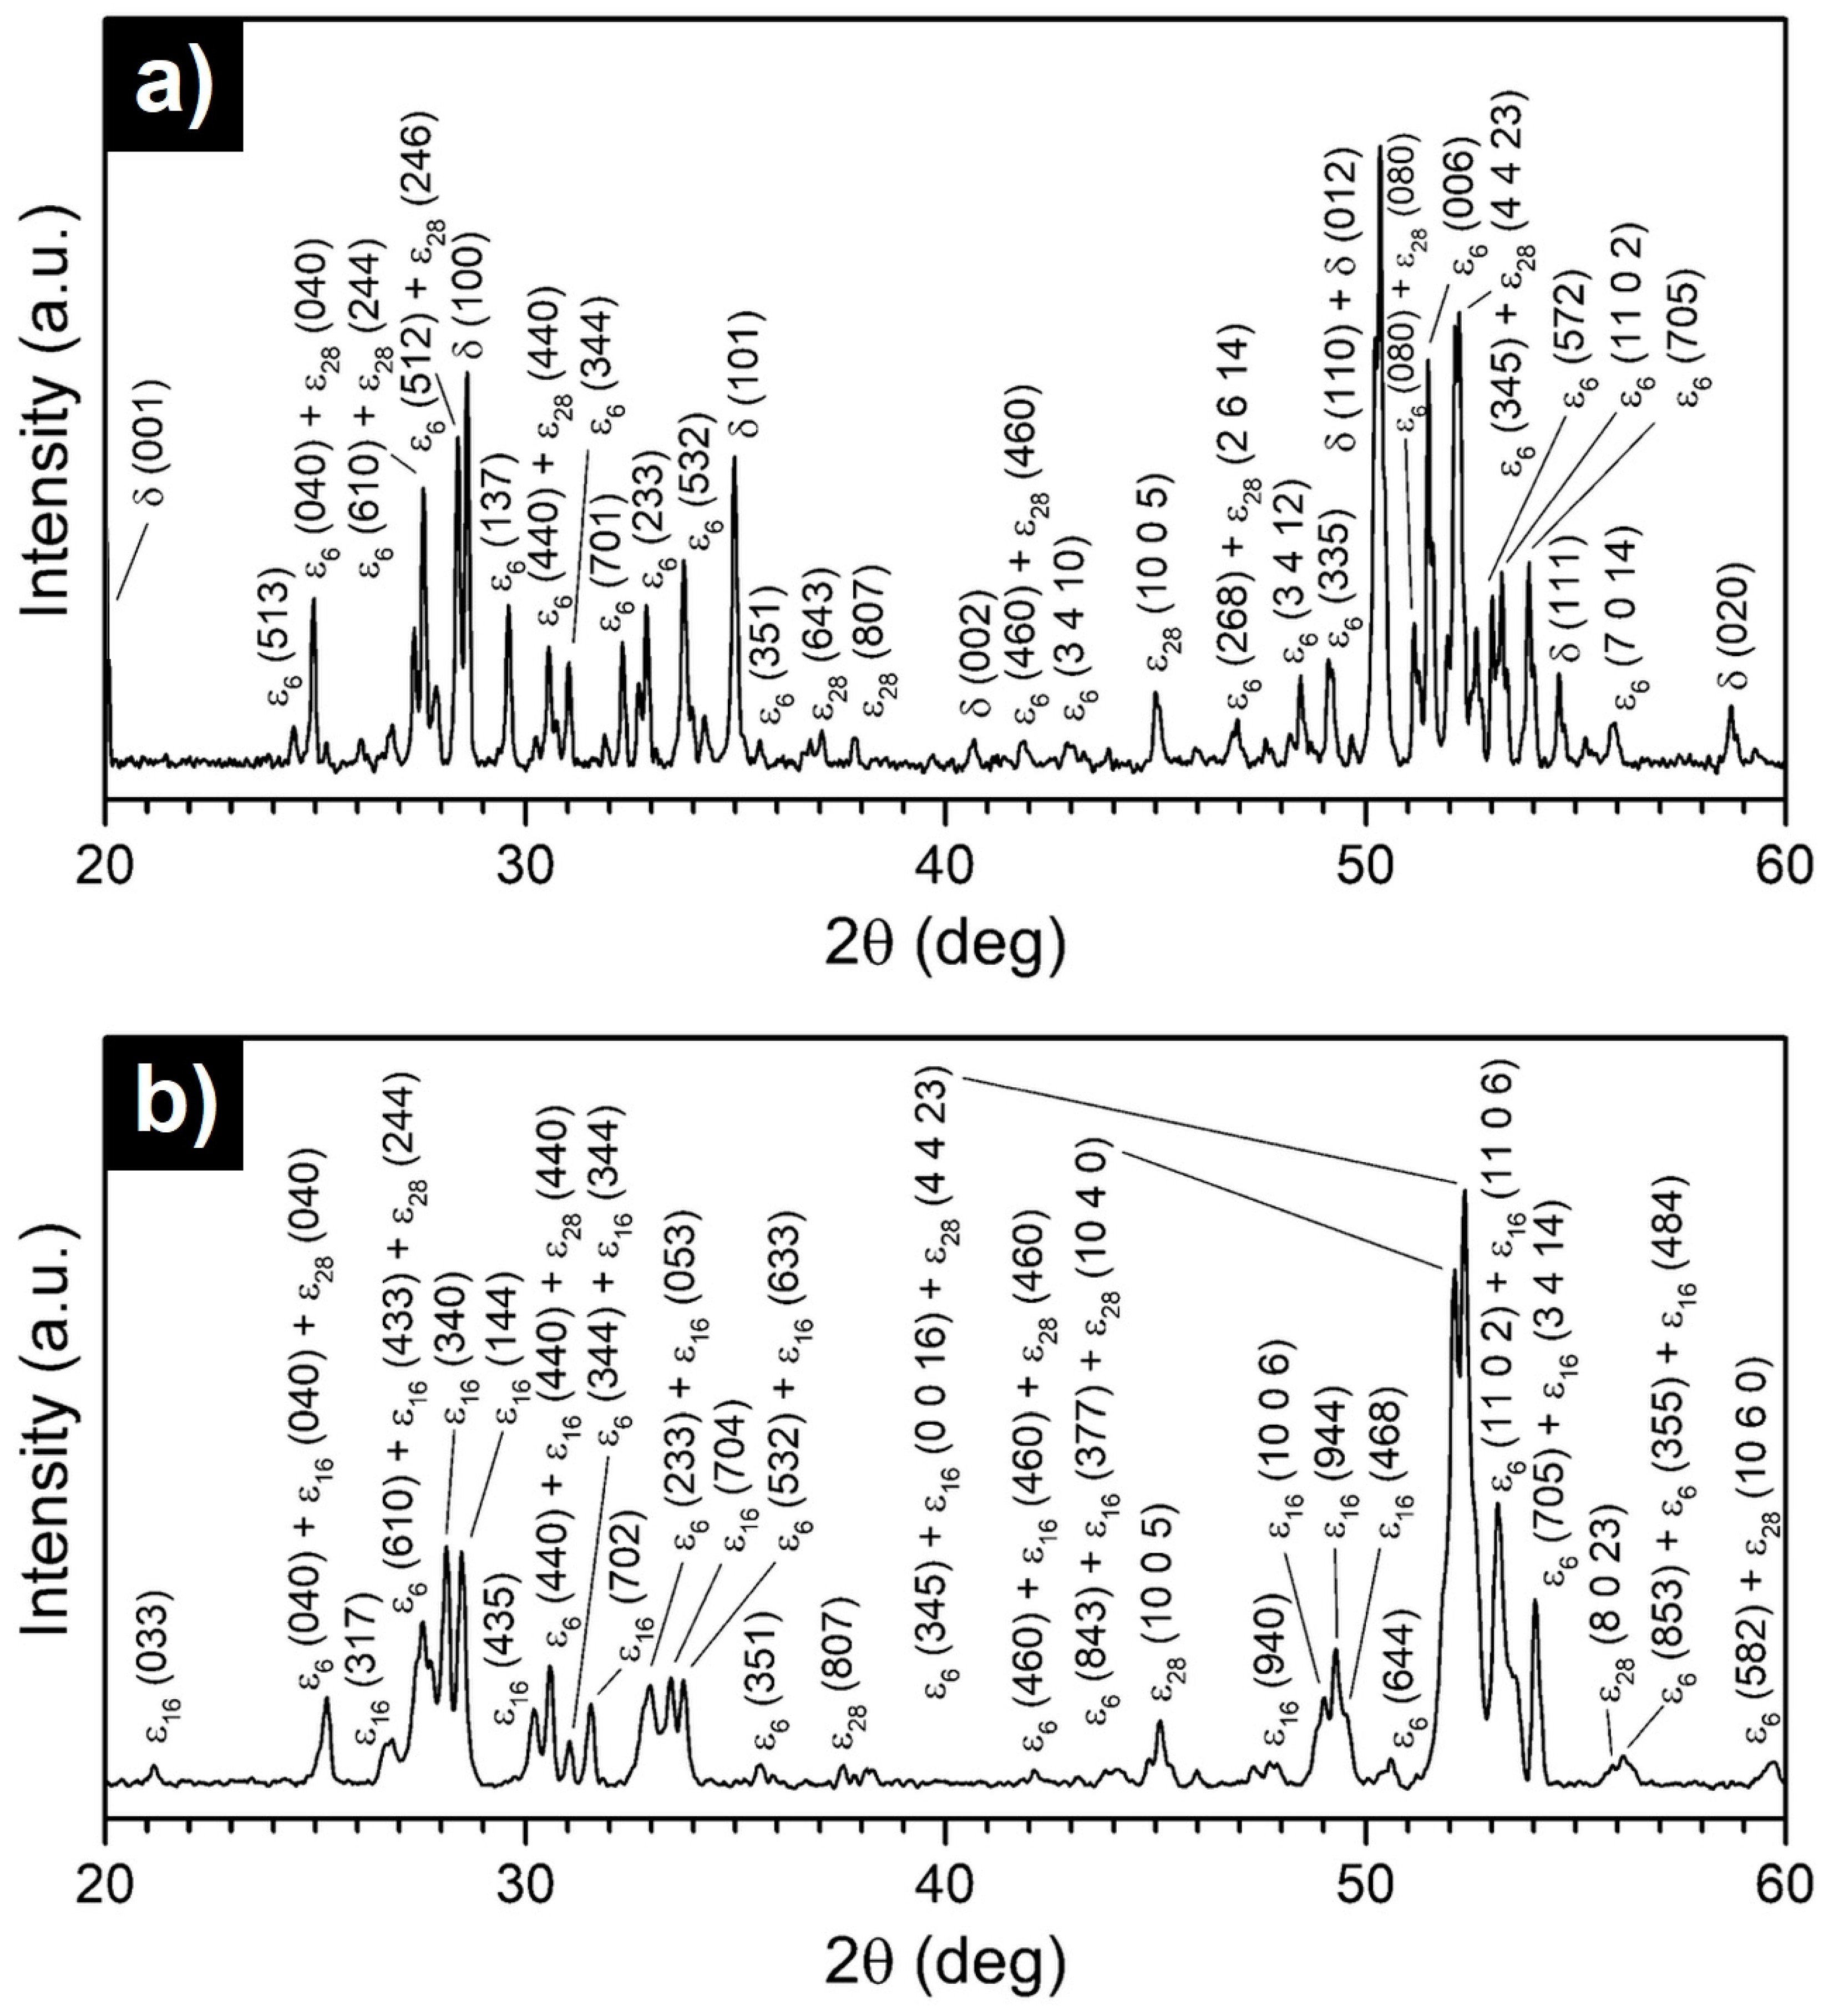
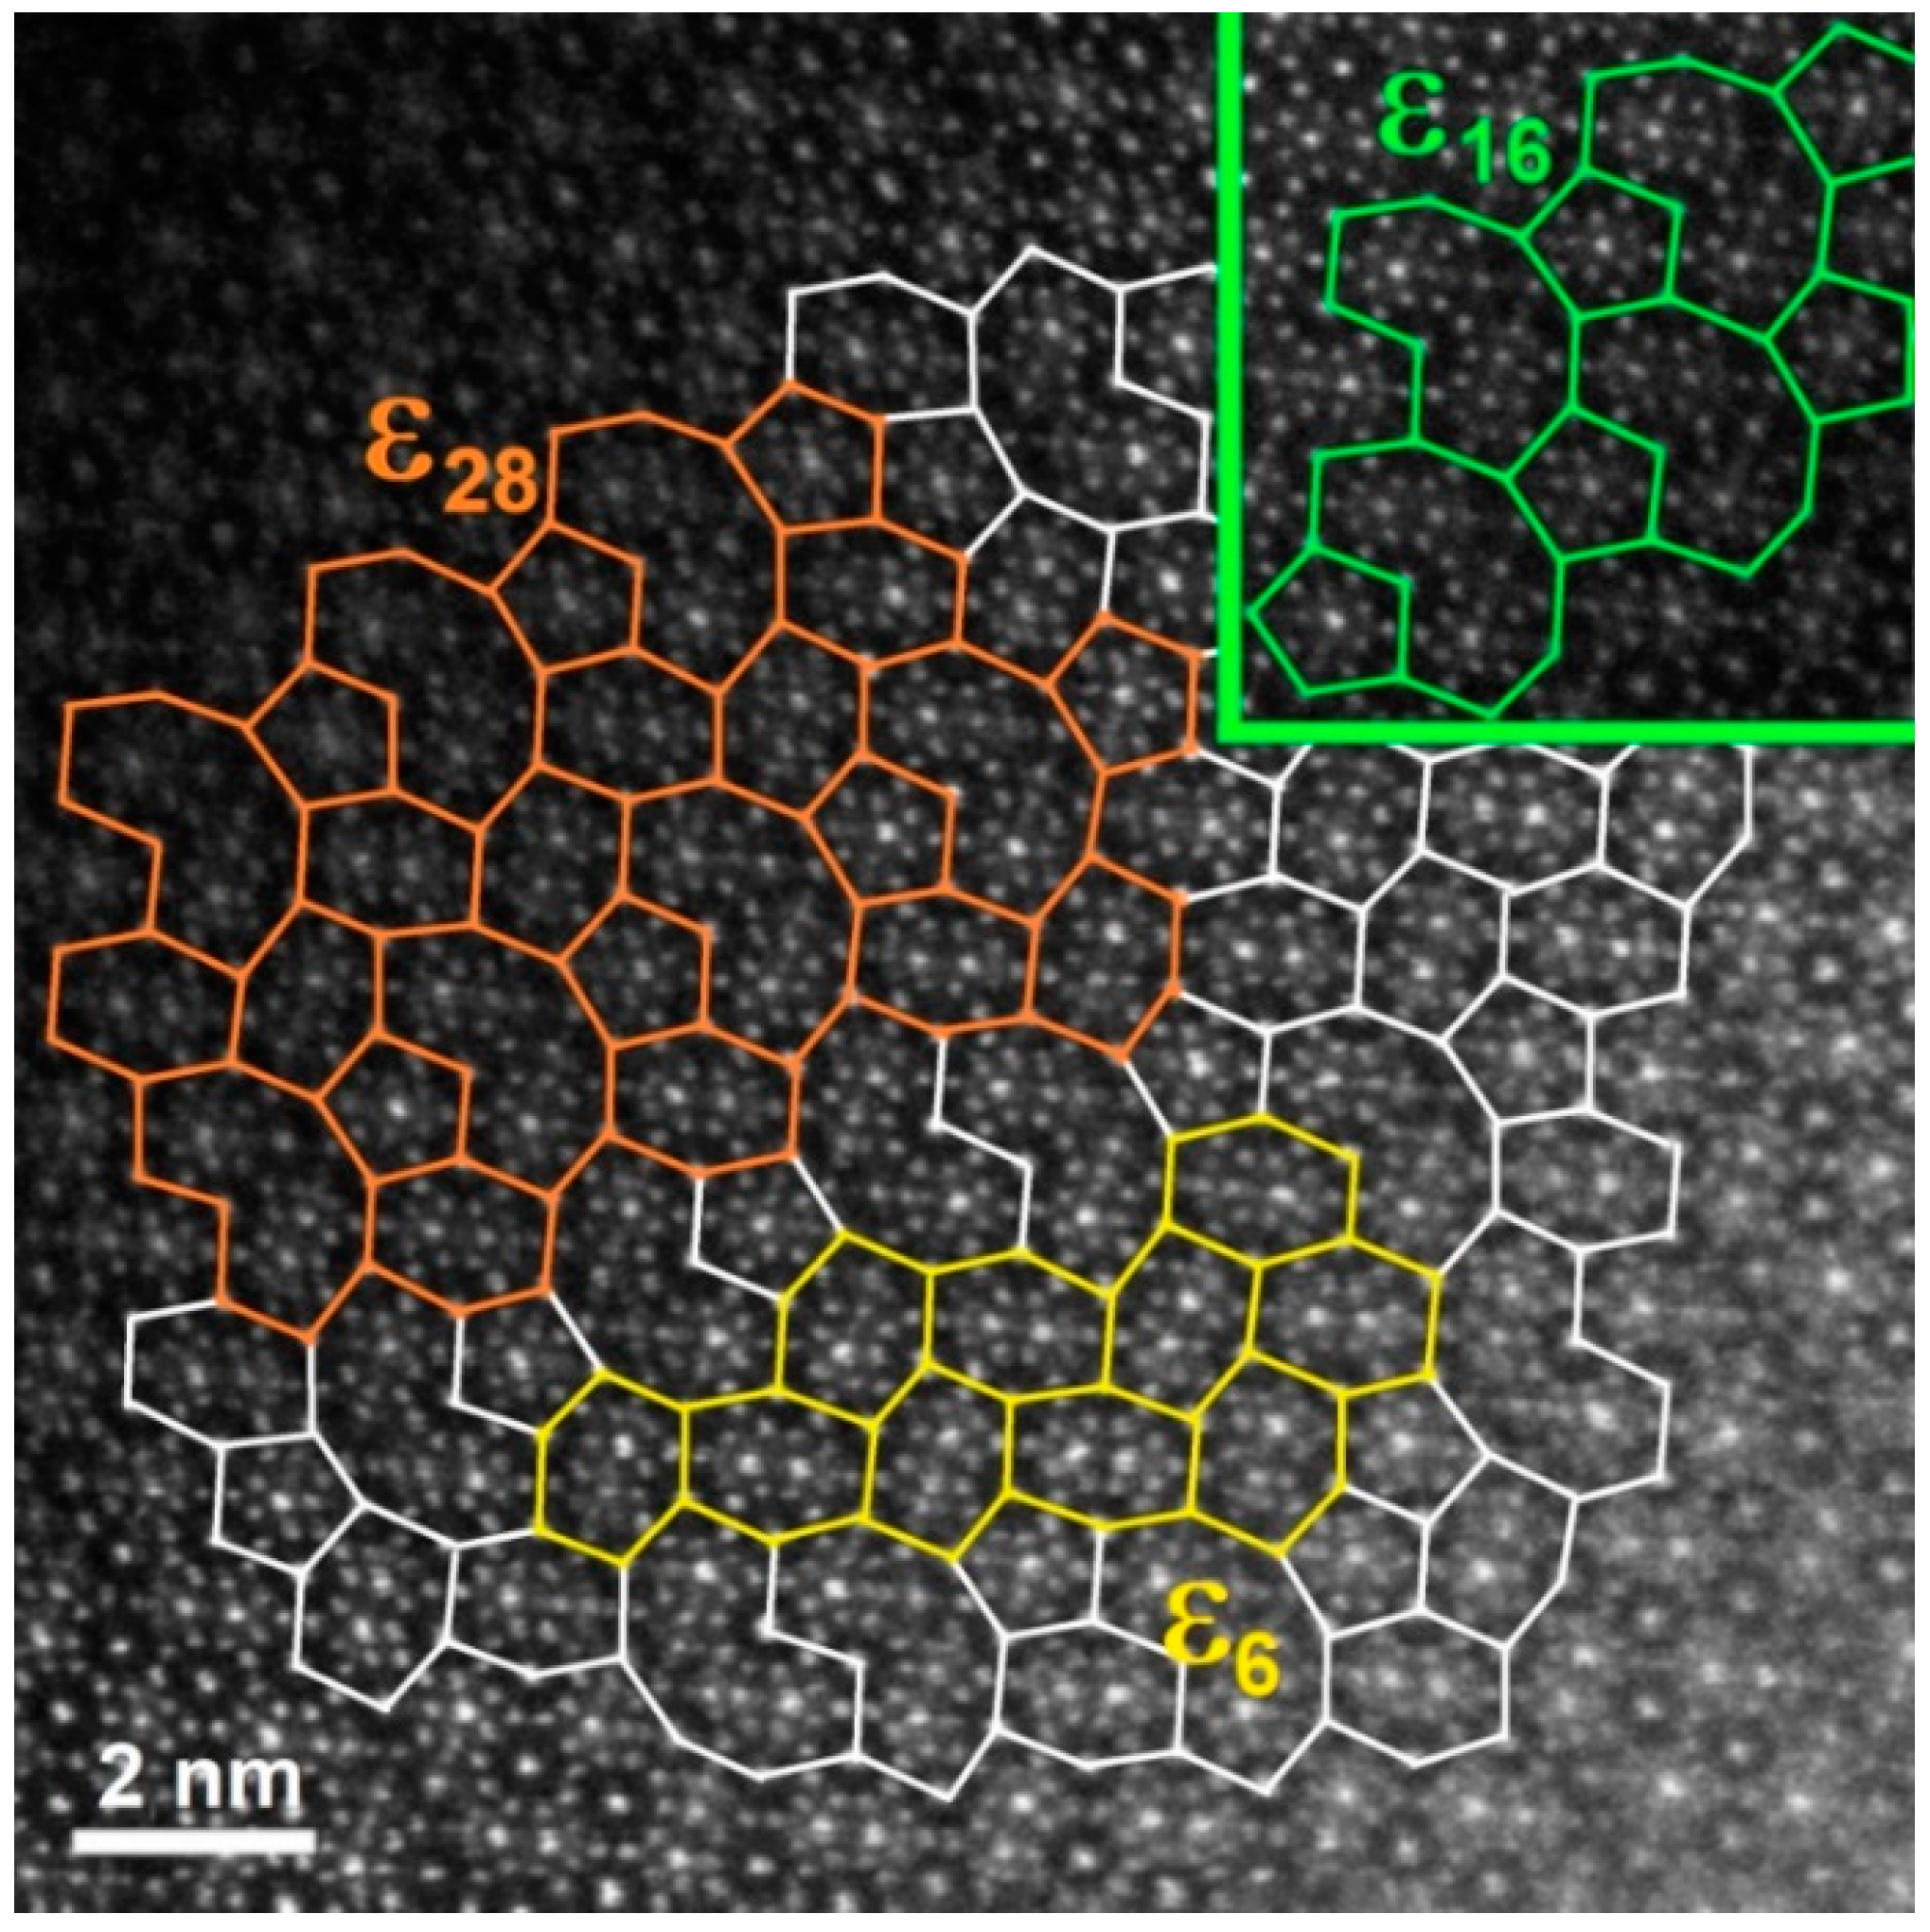
- The Al74Pd12Co14 alloy was a single-phase alloy composed of εn. In this alloy, a combination of three εn structures was identified: ε6, ε16, and ε28.
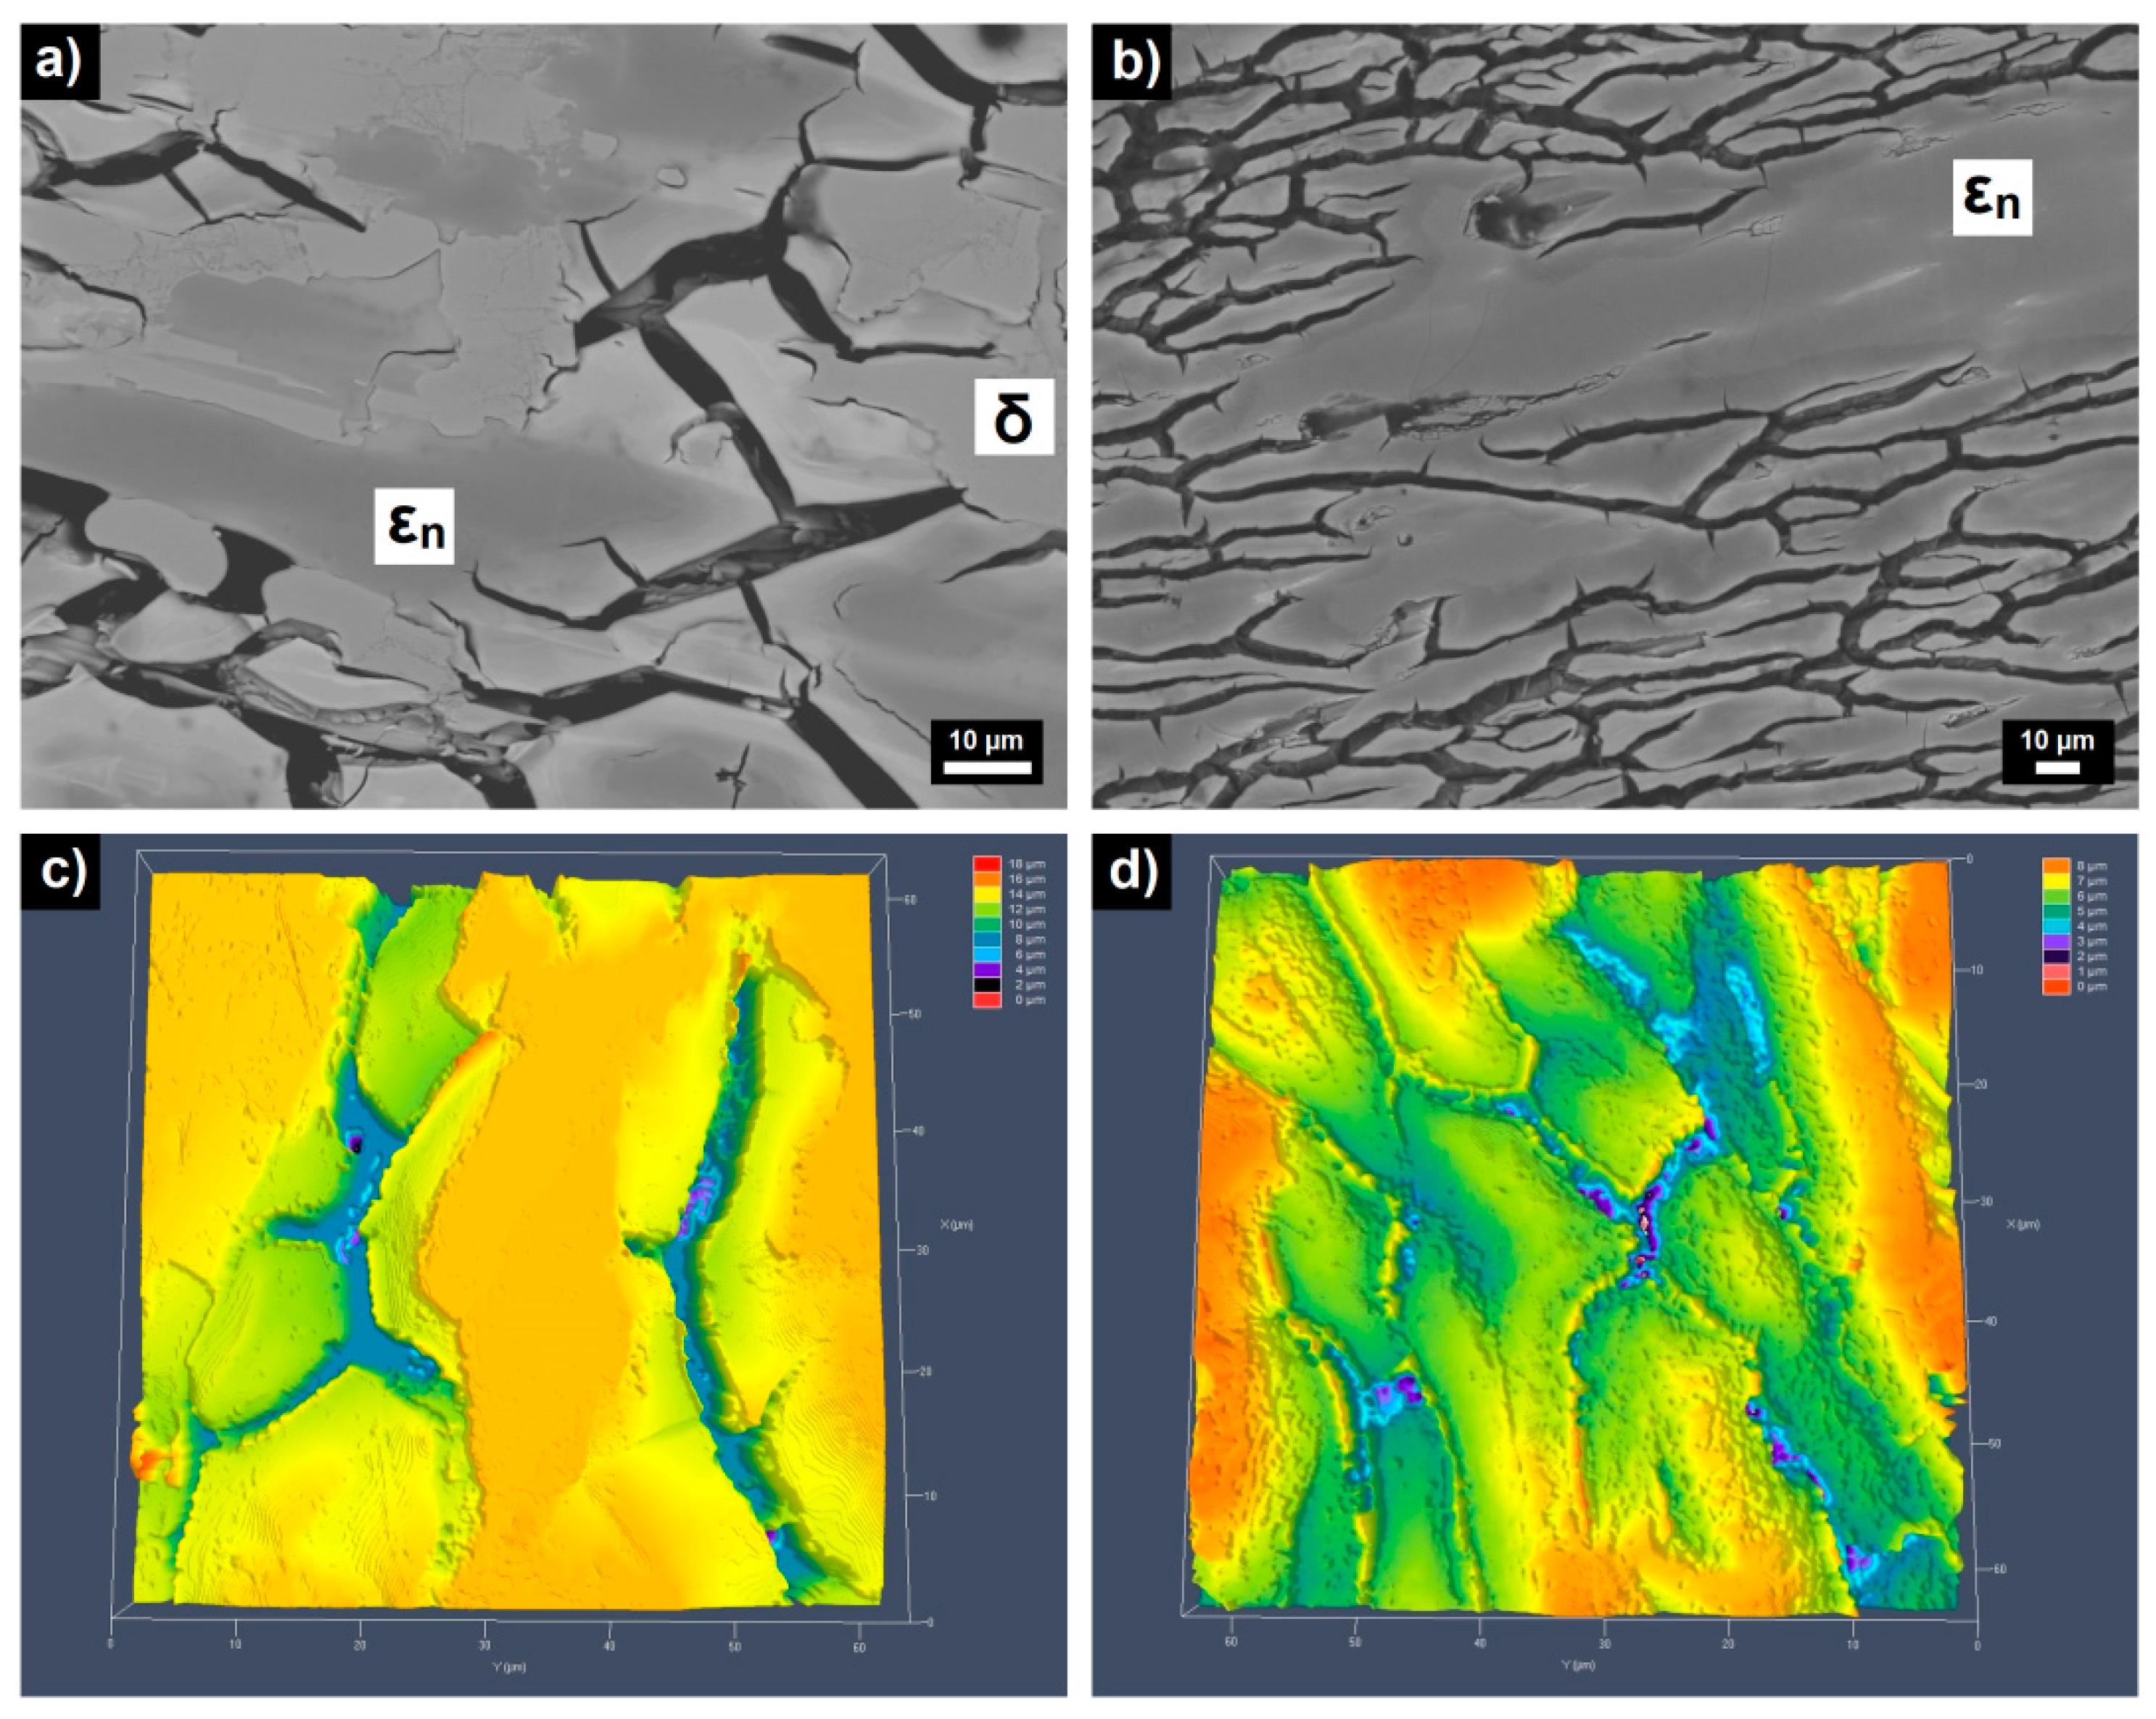
- The Al70Pd25Co5 alloy was a double-phase alloy composed of εn and δ (Al3Pd2). In this alloy, two εn structures were identified: ε6 + ε28.
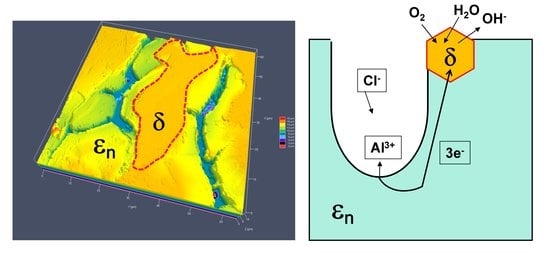
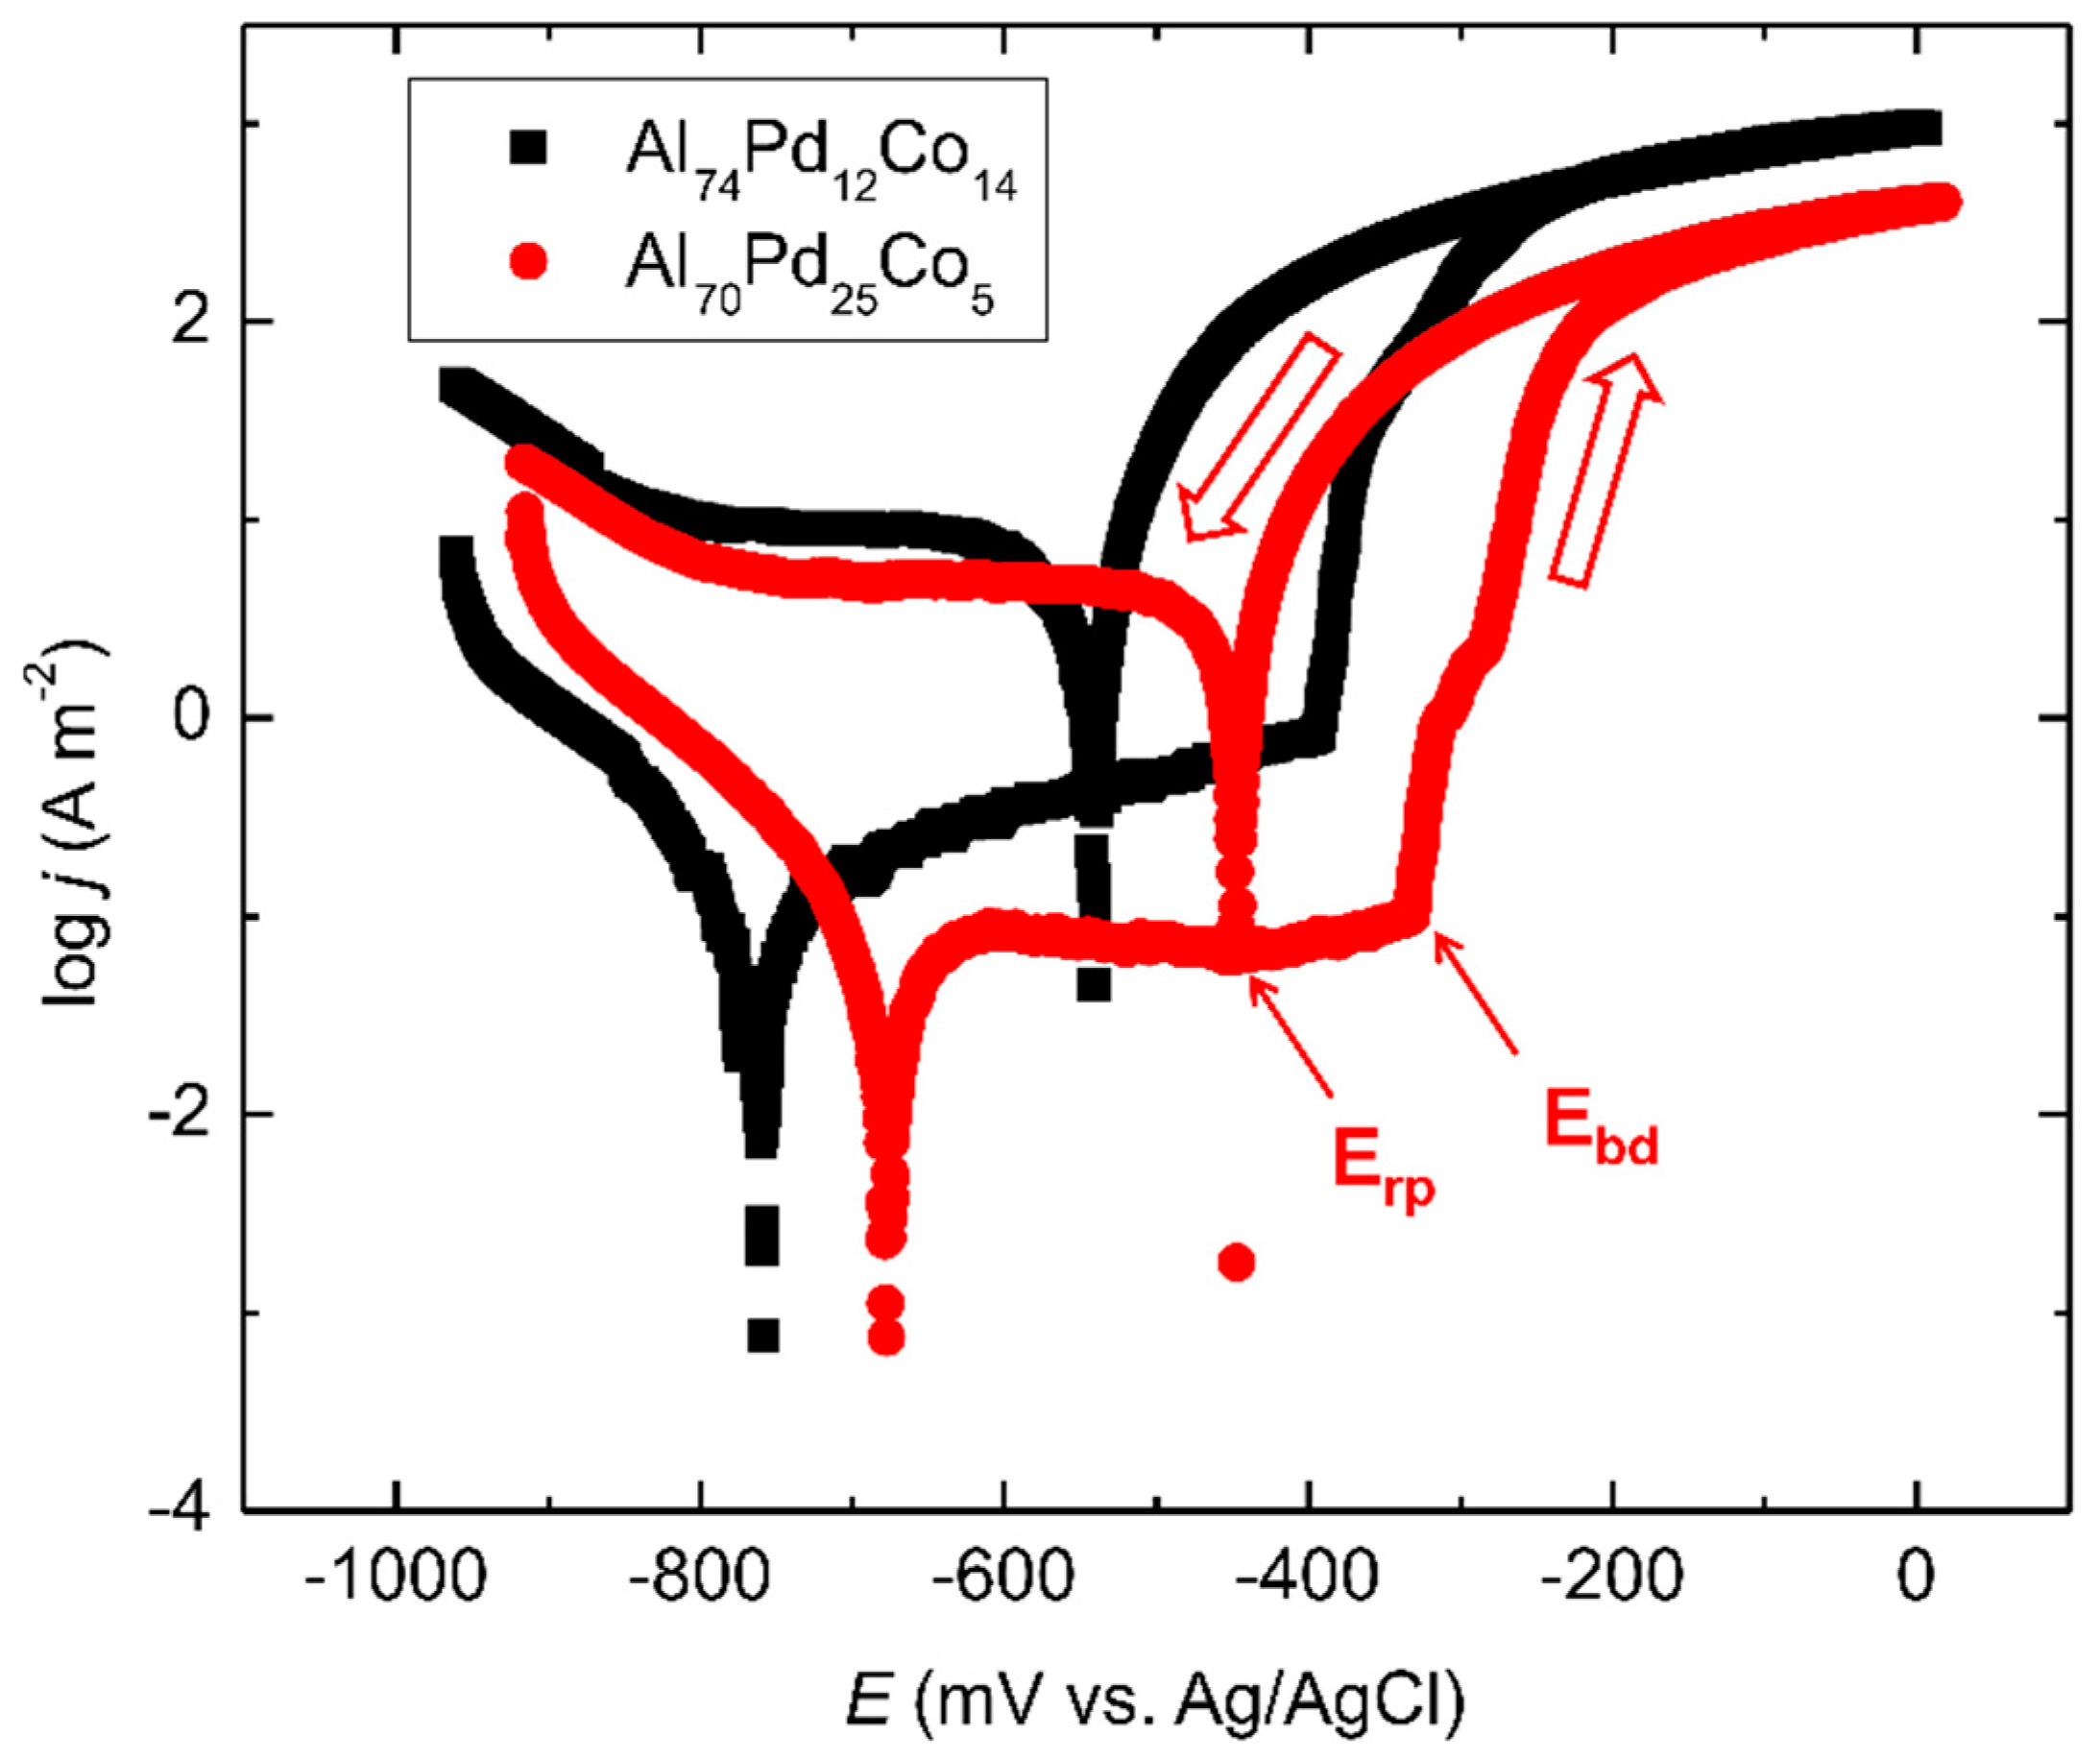
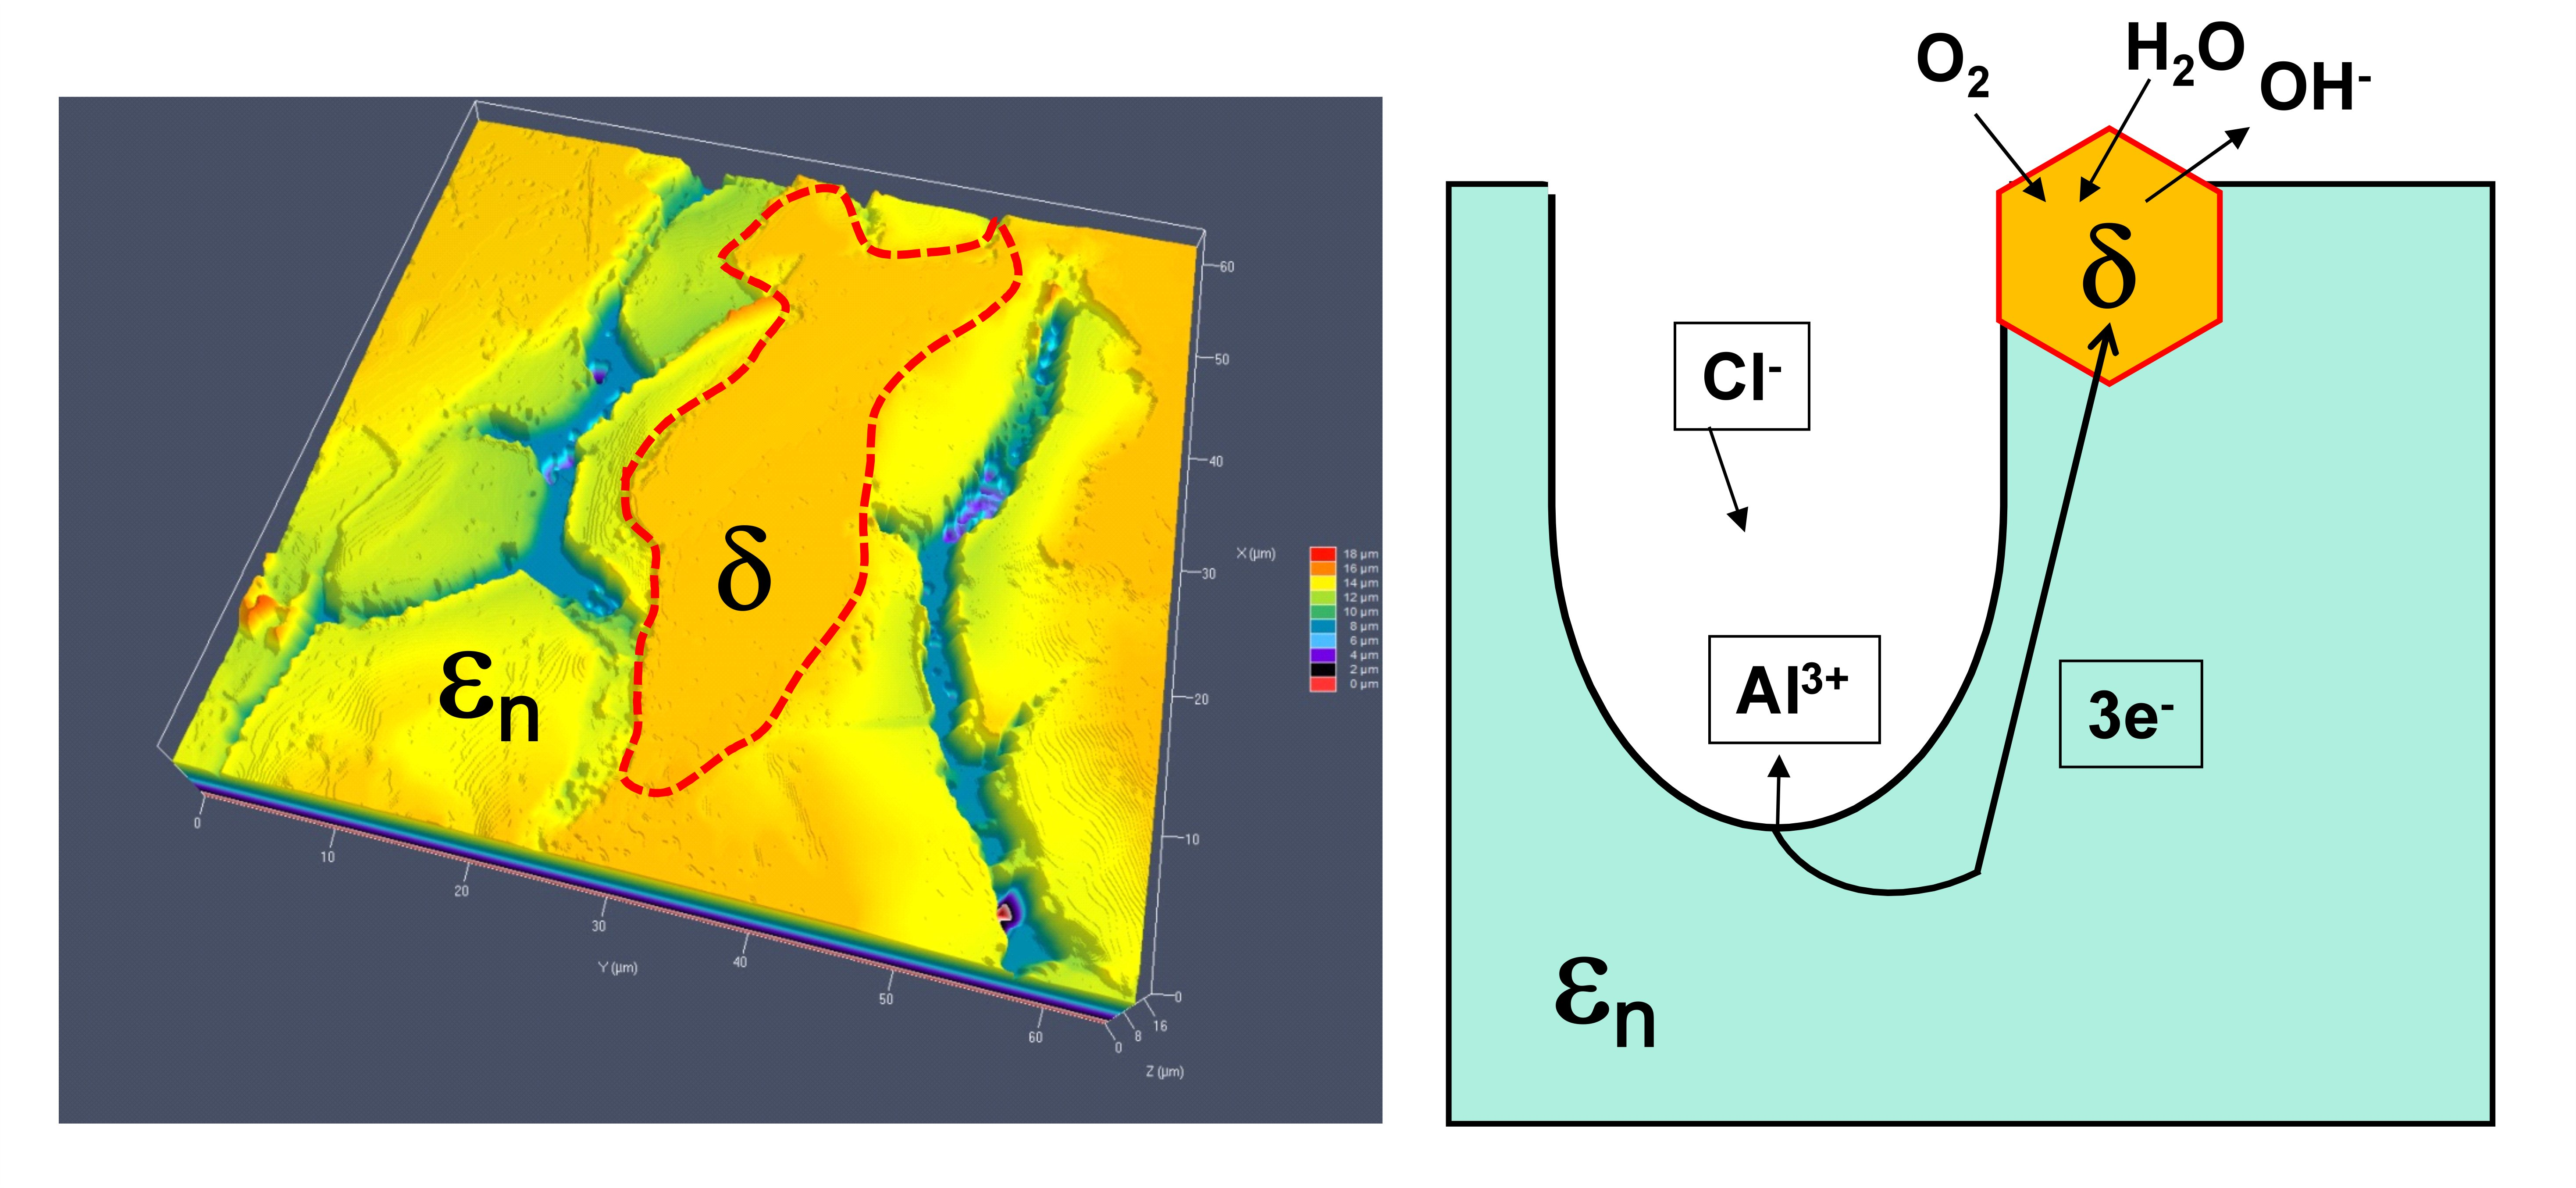
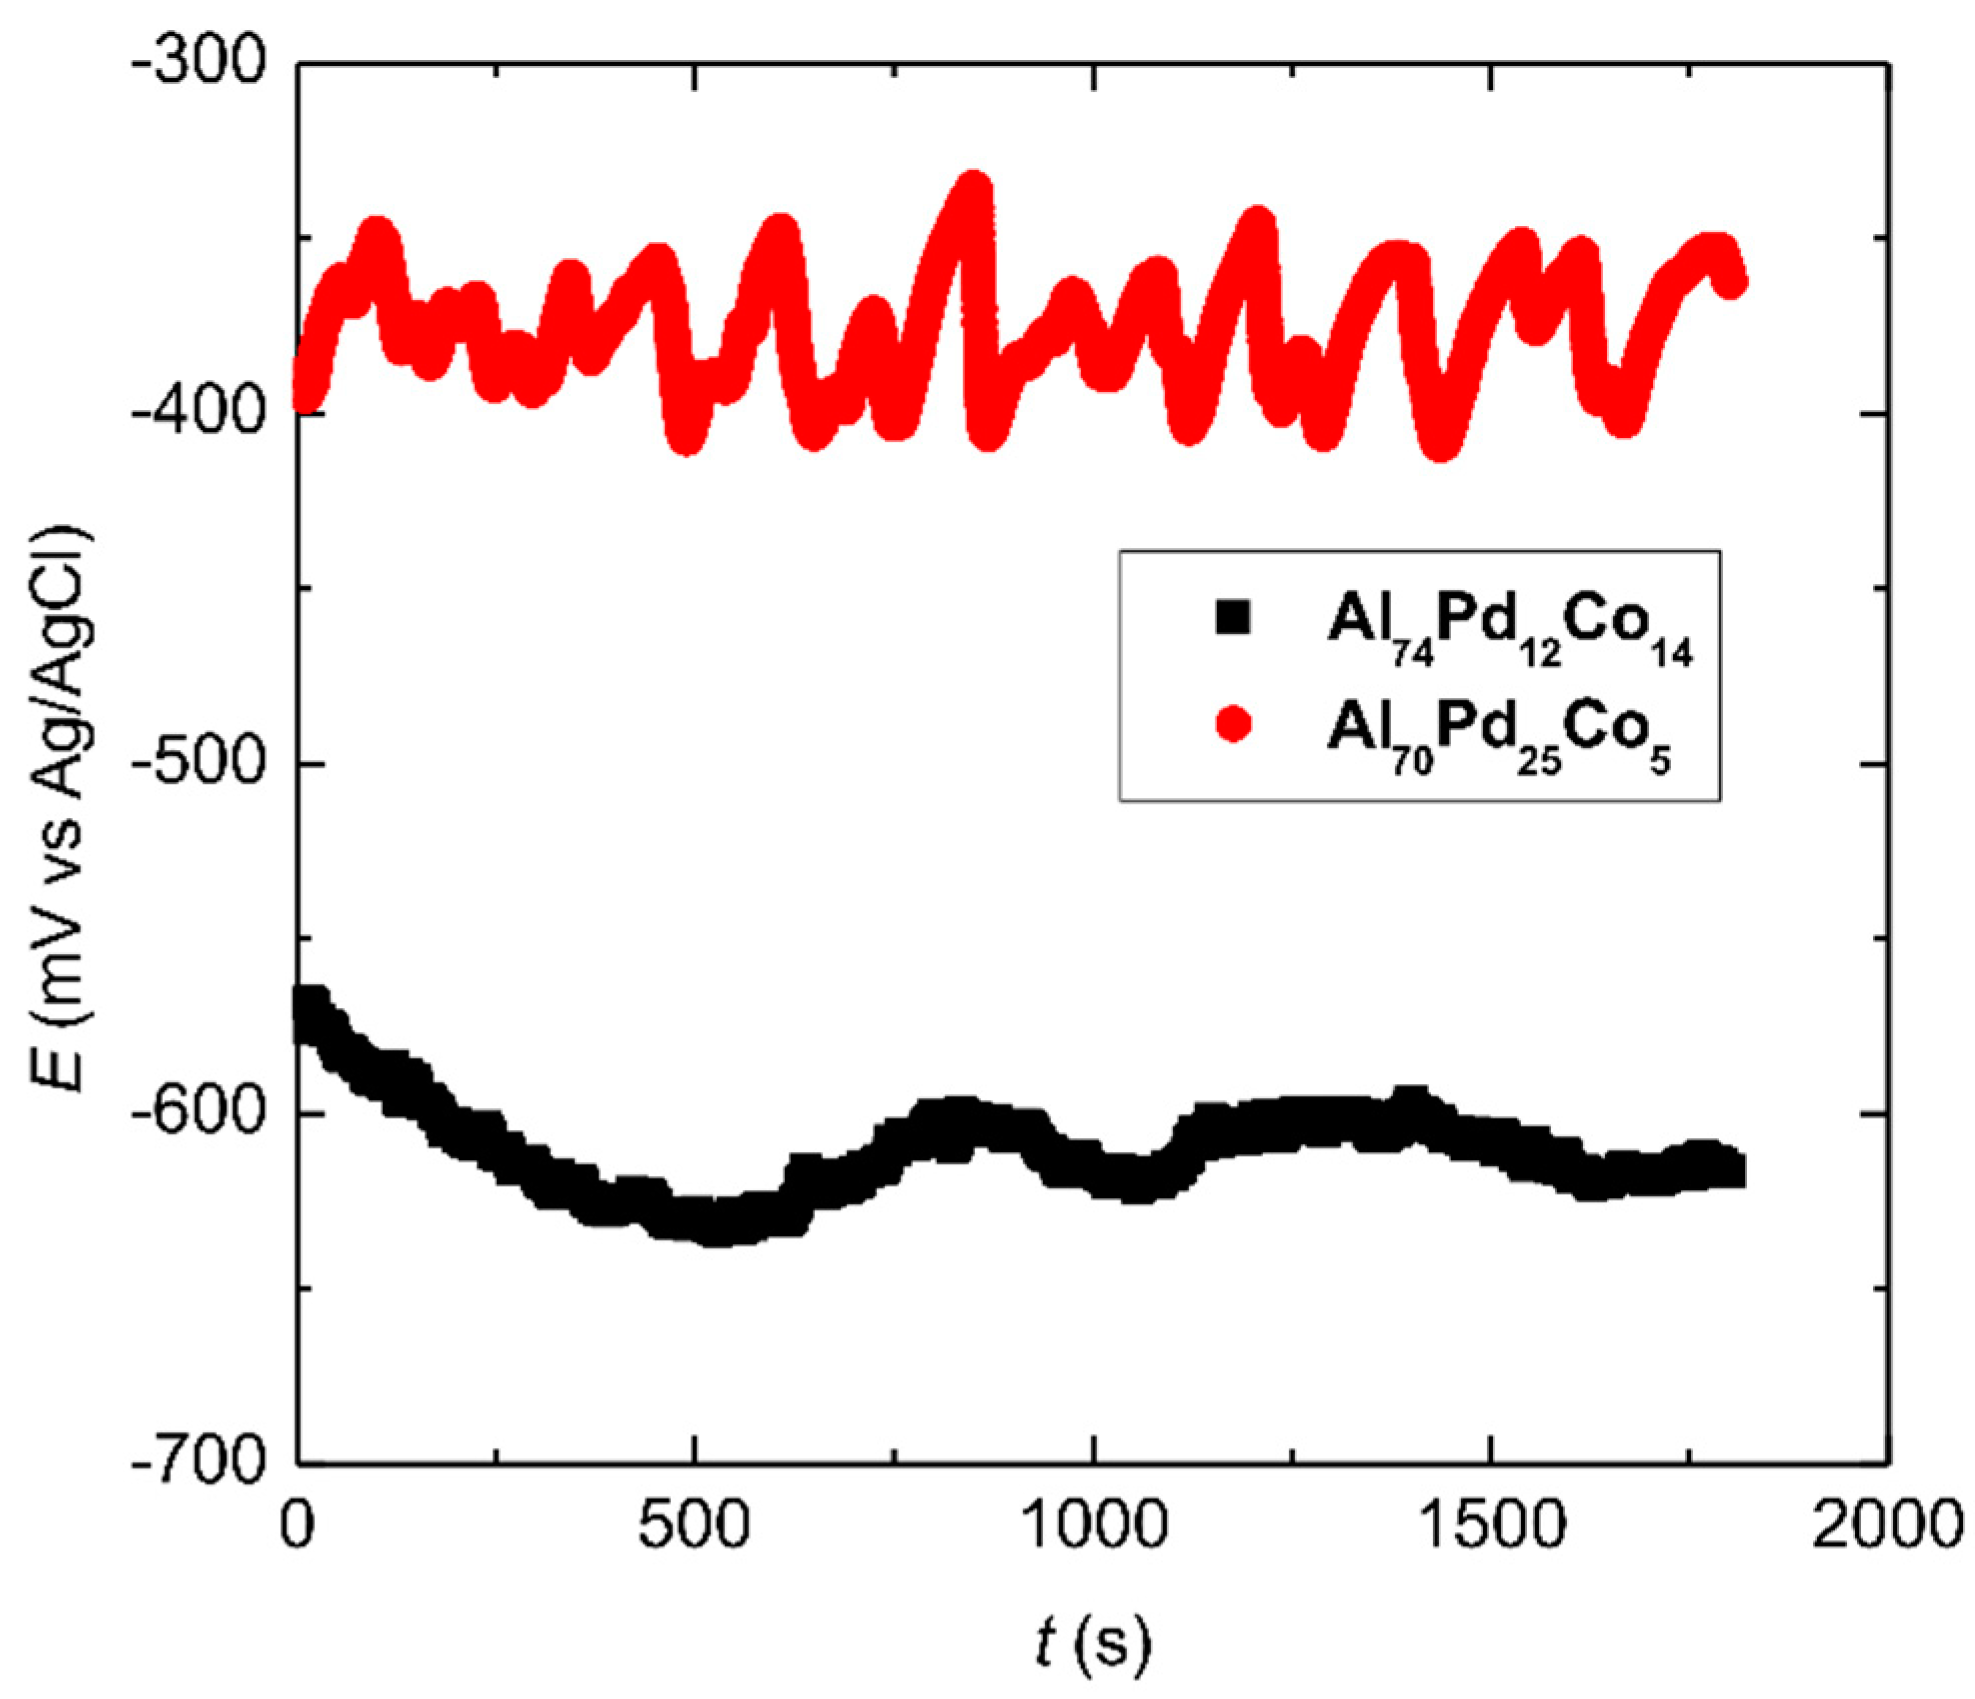
- Marked open circuit potential oscillations of the Al70Pd25Co5 alloy have been observed, indicating individual breakdown and re-passivation events on the sample surface. A preferential corrosion attack of εn was found. Binary δ phase (Al3Pd2) was less affected by corrosion.
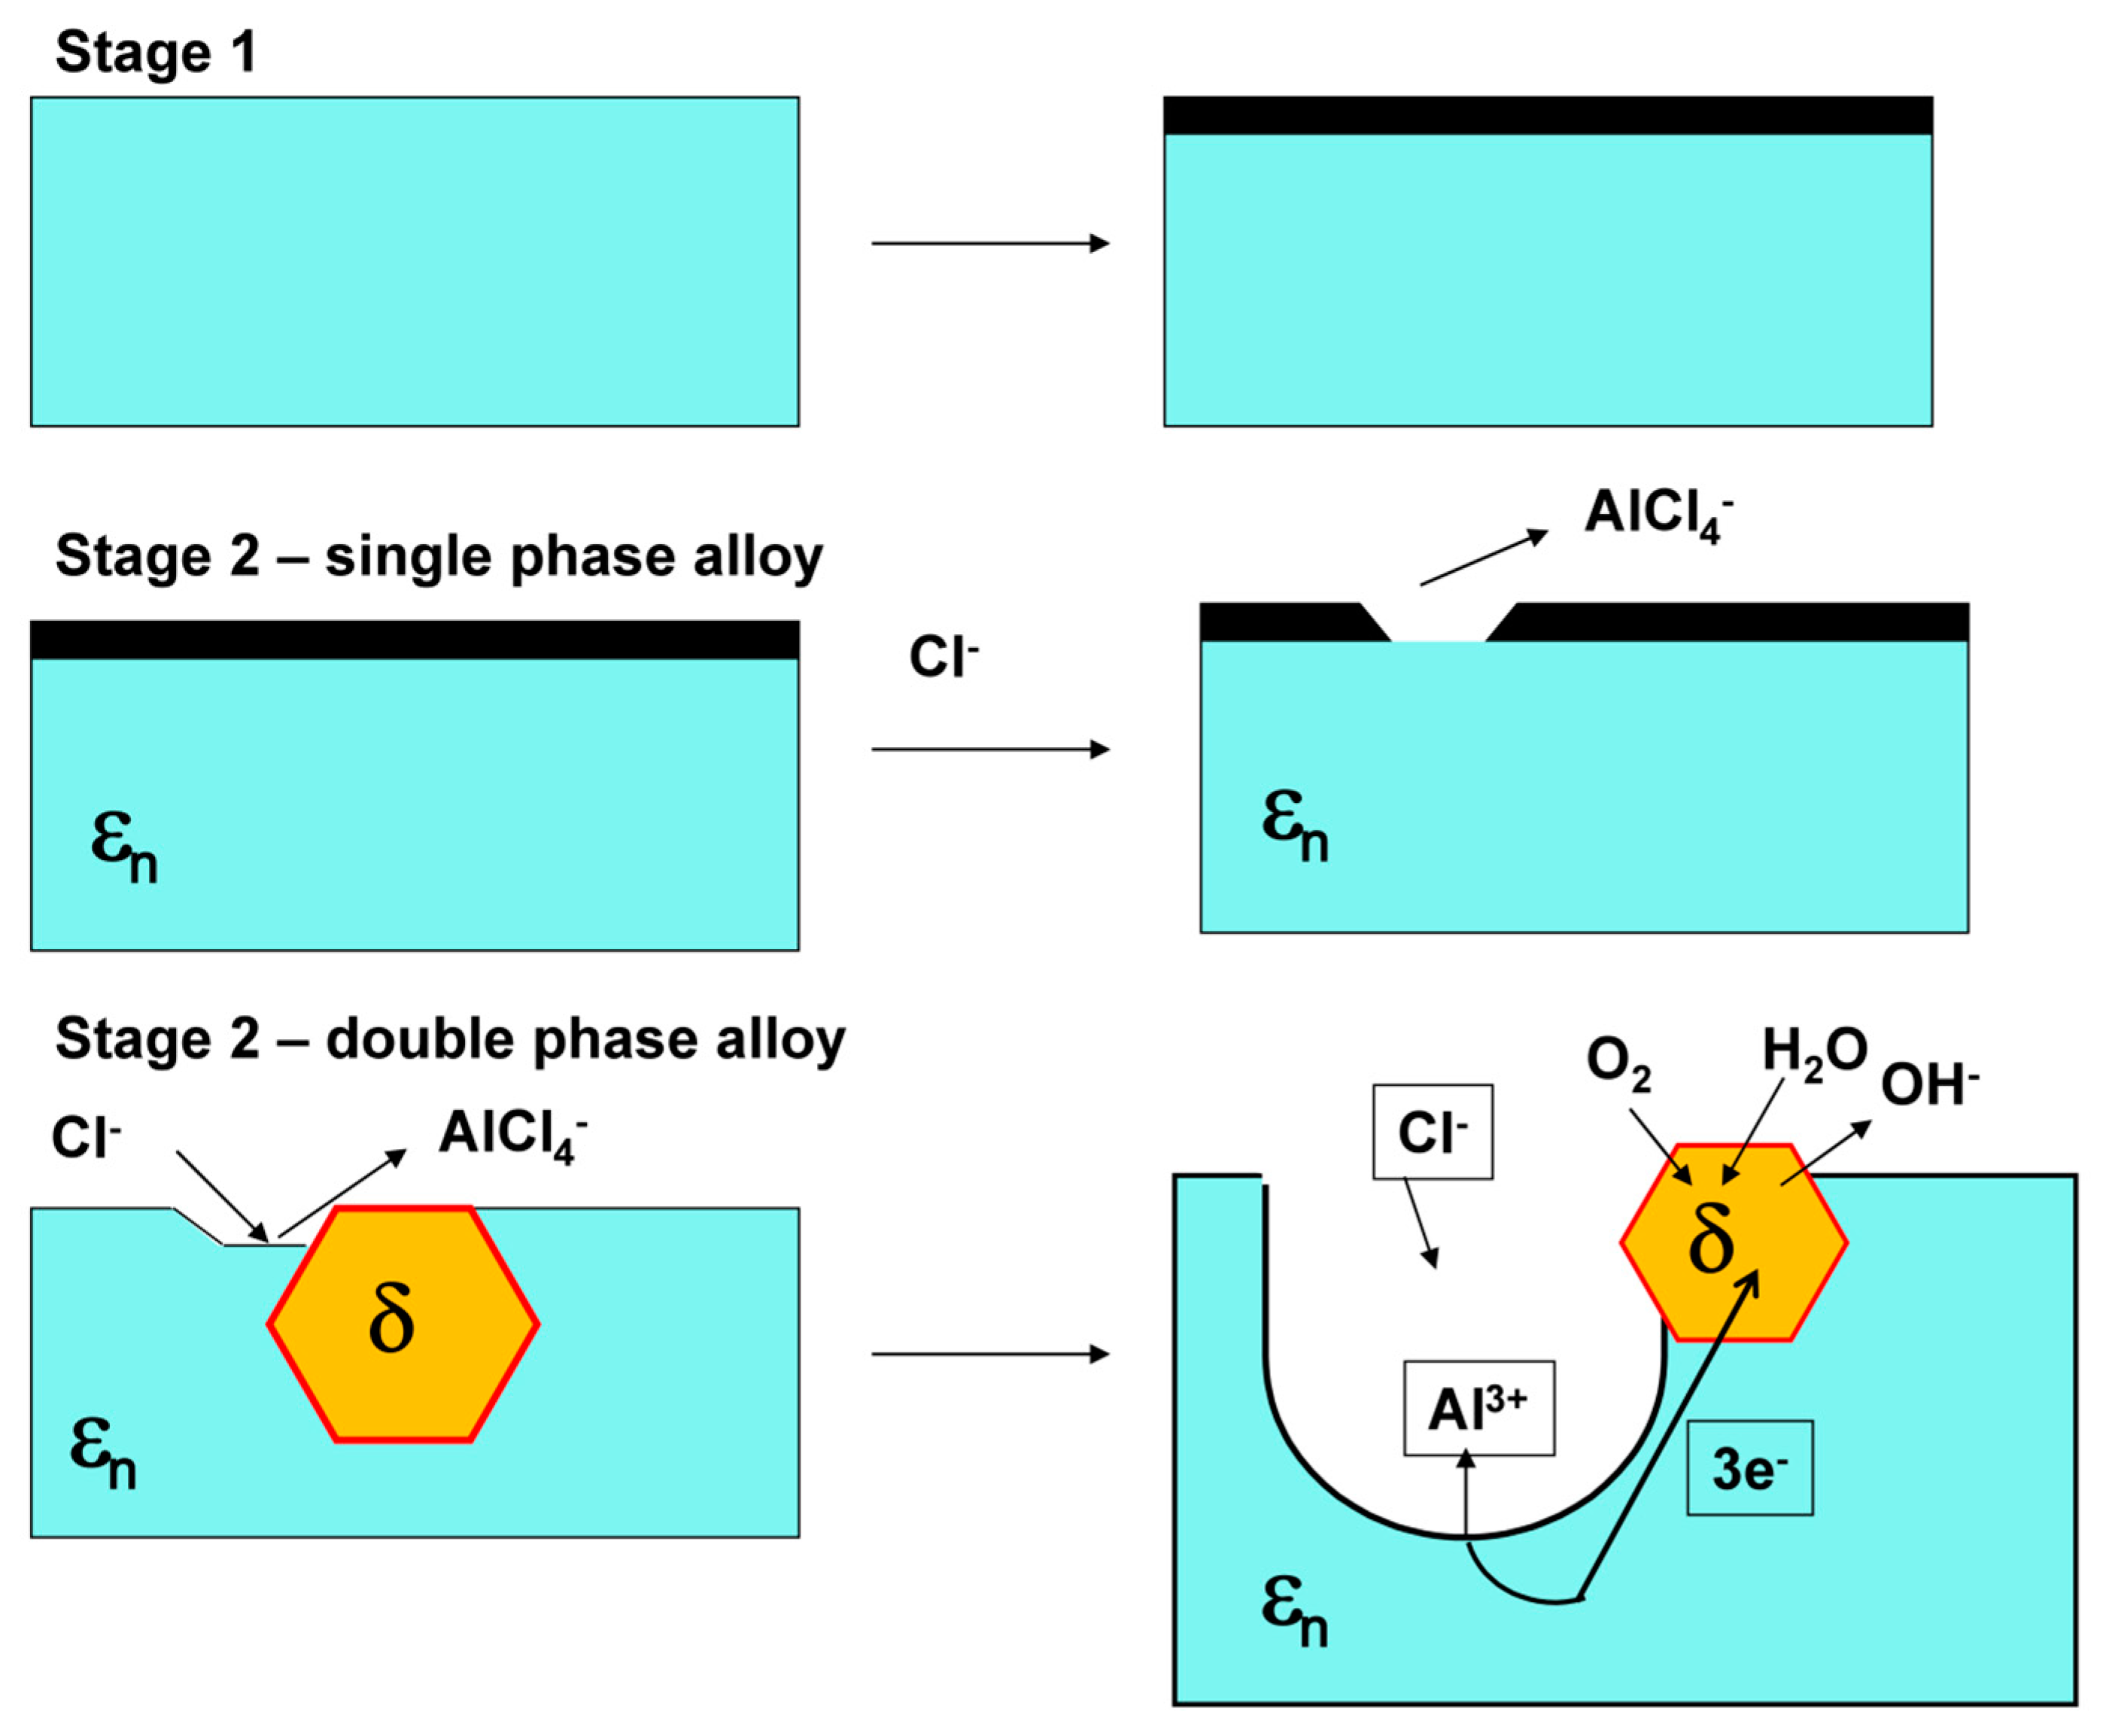
- De-alloying of Al from εn and formation of intermittent inter-penetrating channel networks occurred in both alloys.
- The corrosion attack of the Al74Pd12Co14 alloy was more significant compared to the Al70Pd25Co5 alloy and resulted in the formation of a de-alloyed and highly porous metallic network. The corrosion susceptibility of εn could be further utilized in preparing porous Pd–Co alloys with possible catalytic activity.
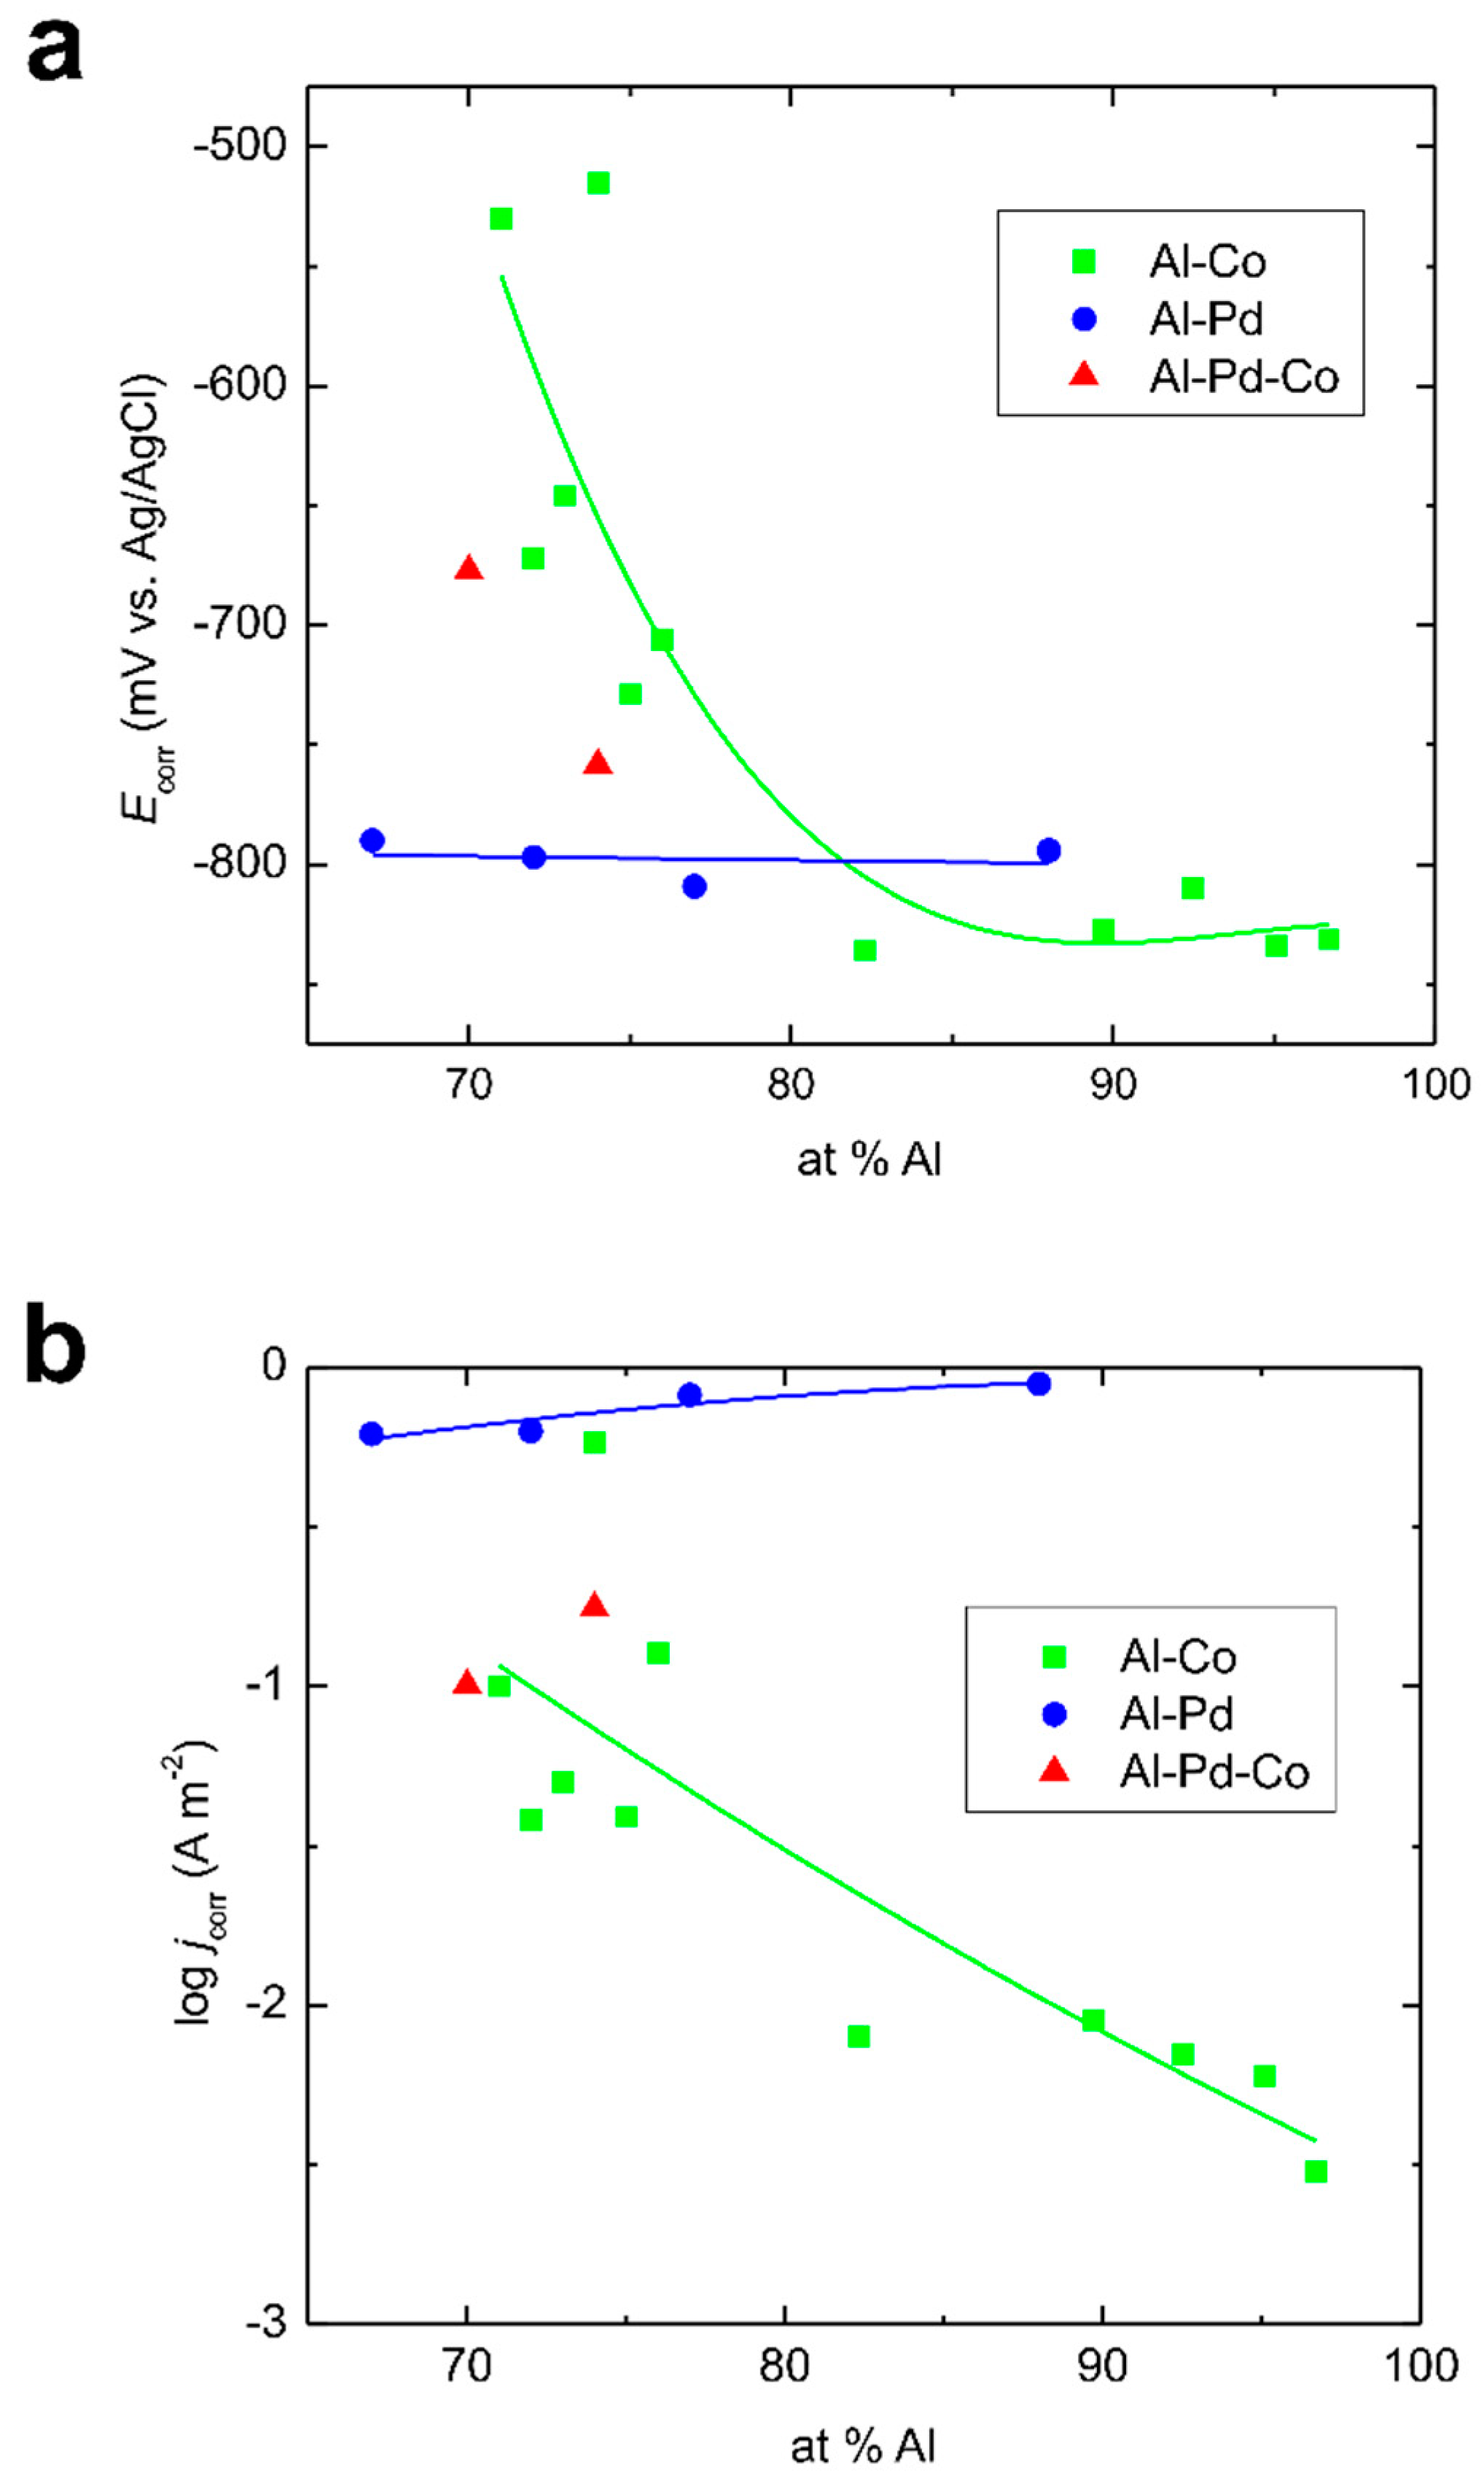
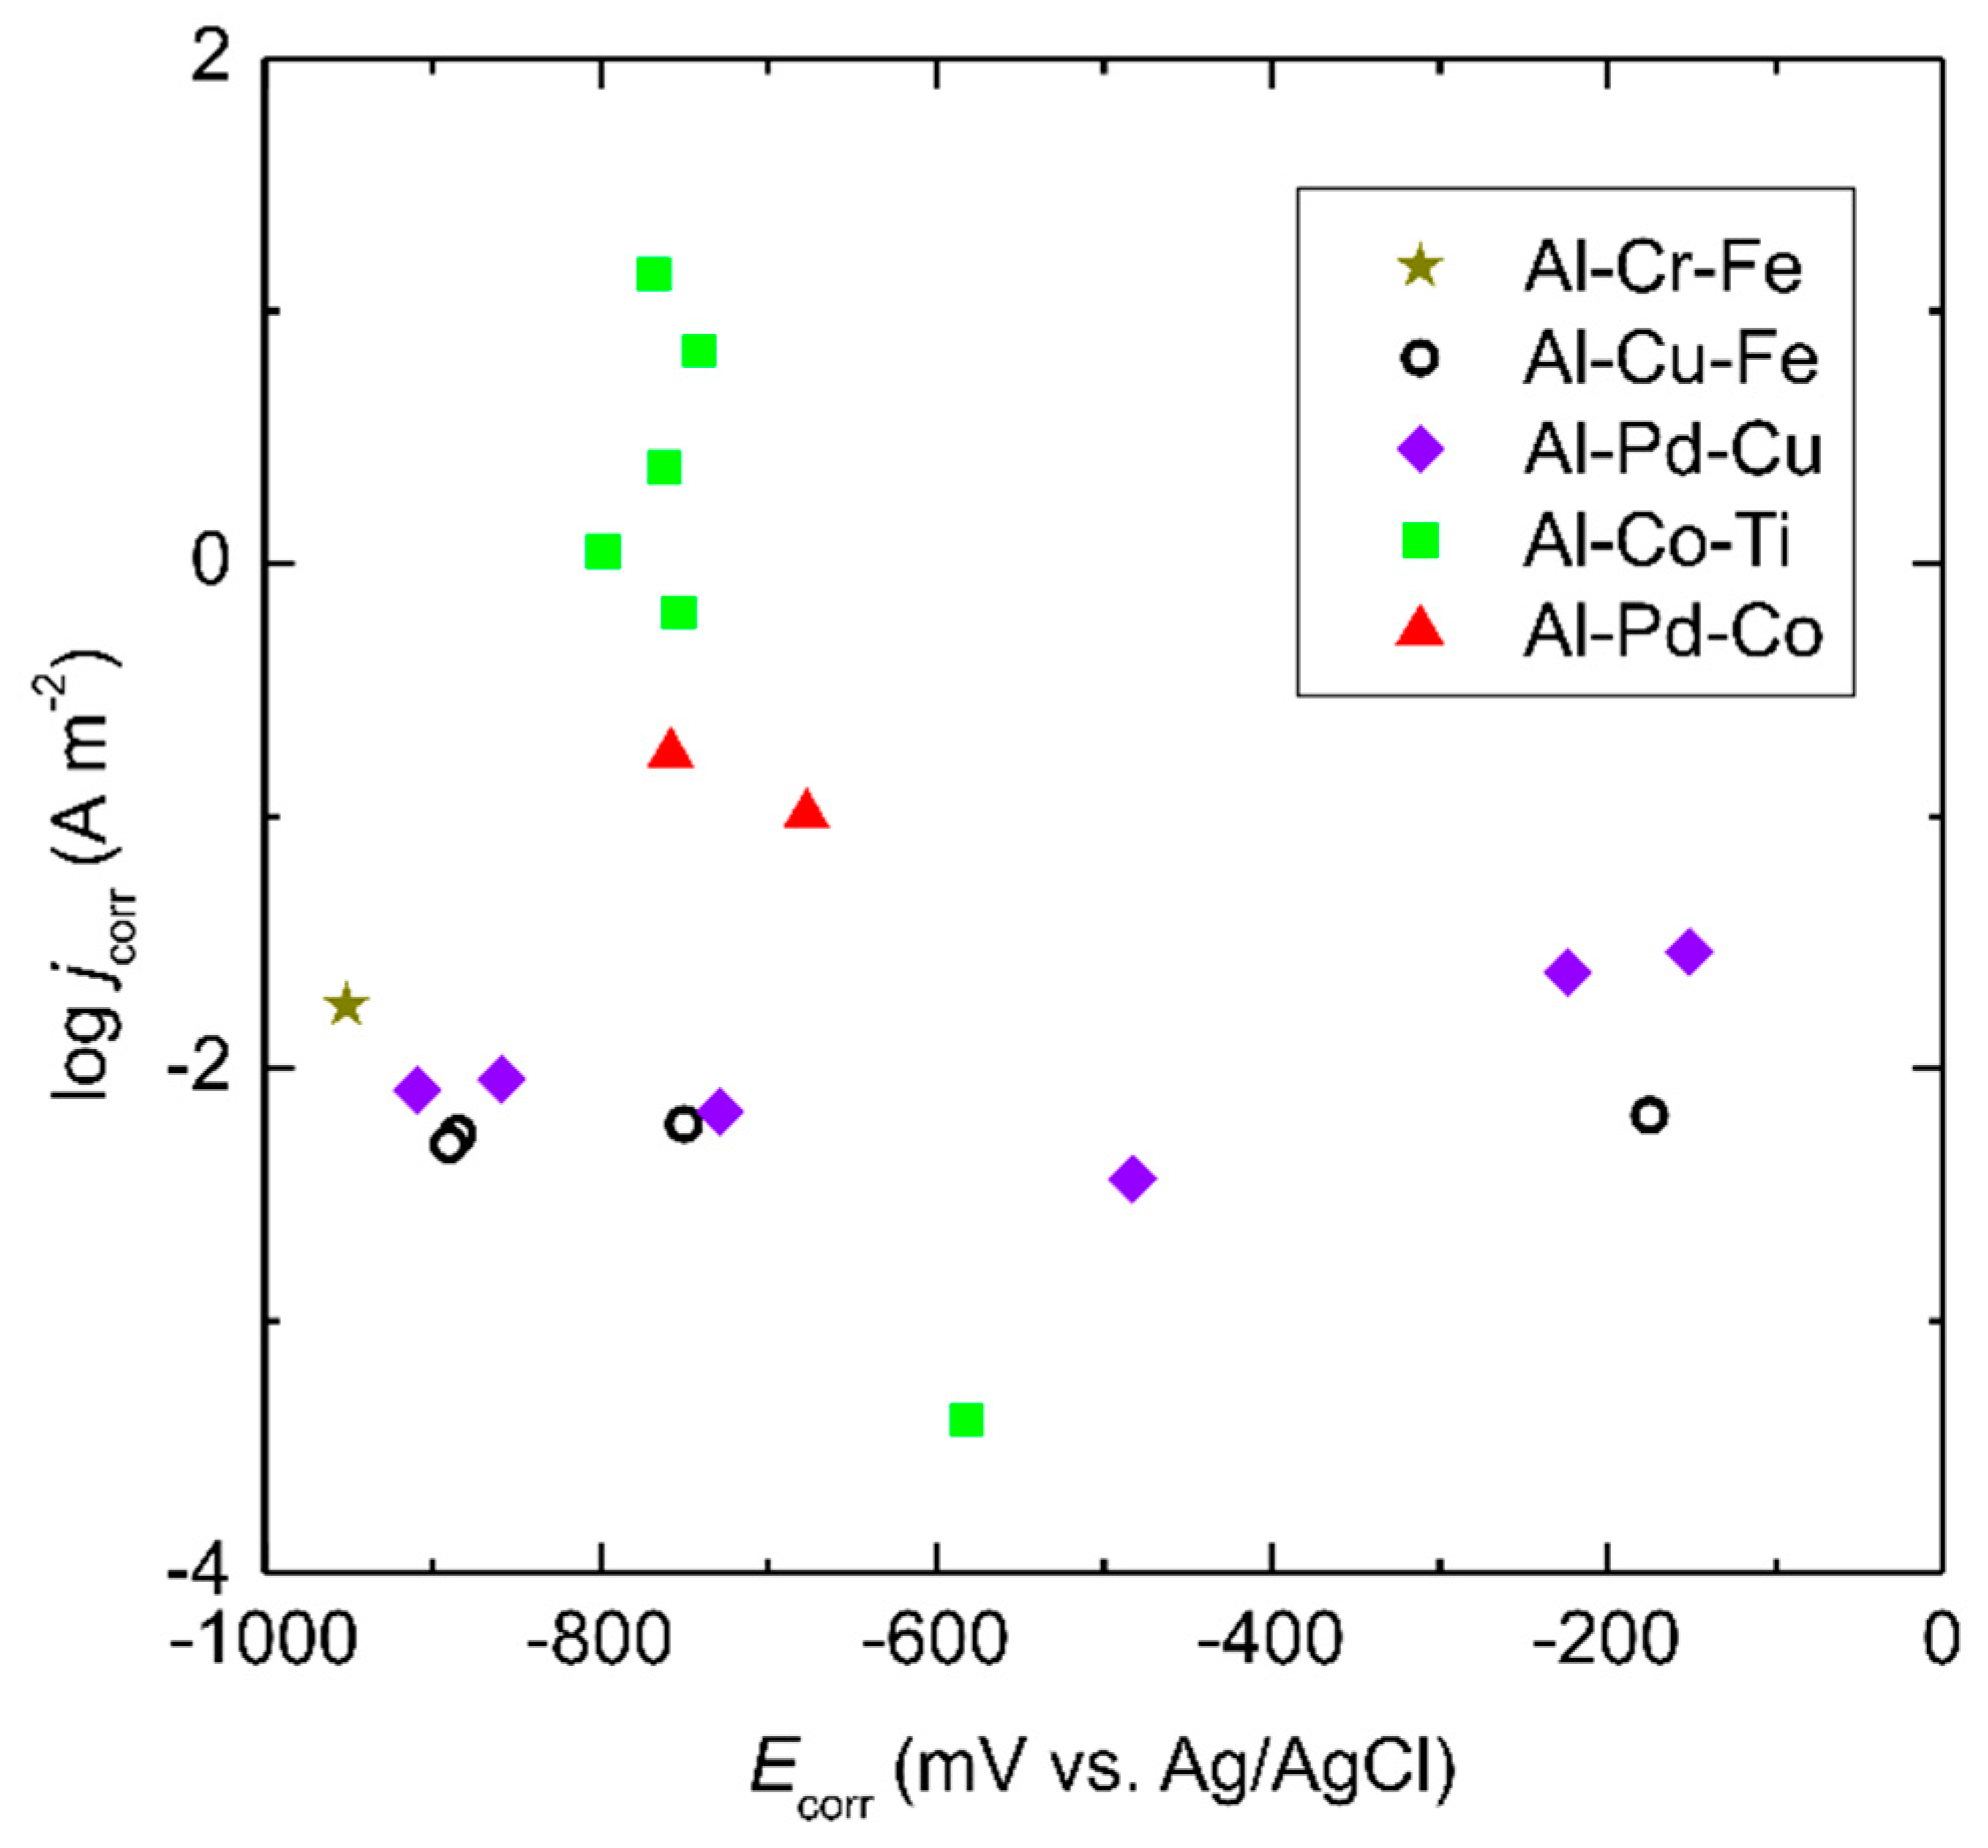
- The Co substitution for Pd significantly improves the corrosion resistance of εn. As such, it is probably not the crystal structure of the phase, but its chemical composition, that plays a major role in the corrosion behavior.
- Specific Co concentrations may greatly improve the corrosion performance of the Al–TM alloys.
Author Contributions
Funding
Acknowledgments
Conflicts of Interest
References
- Steurer, W. Twenty years of structure research on quasicrystals. Part I. Pentagonal, octagonal, decagonal and dodecagonal quasicrystals. Z. Kristallogr. 2004, 219, 391–446. [Google Scholar] [CrossRef]
- Dubois, J.M. Properties and applications of quasicrystals and complex metallic alloys. Chem. Soc. Rev. 2012, 41, 6760–6777. [Google Scholar] [CrossRef]
- Yurechko, M.; Grushko, B.; Velikanova, T.; Urban, K. Isothermal sections of the Al-Pd-Co alloy system for 50–100 at.% Al. J. Alloys Compond 2002, 337, 172–181. [Google Scholar] [CrossRef]
- Yurechko, M.; Grushko, B. A study of the Al-Pd-Co alloy system. Mater. Sci. Eng. A 2000, 294–296, 139–142. [Google Scholar] [CrossRef]
- Černičková, I.; Ďuriška, L.; Priputen, P.; Janičkovič, D.; Janovec, J. Isothermal section of the Al-Pd-Co phase diagram at 850 °C delimited by homogeneity ranges of phases epsilon, U, and F. J. Phase Equilib. Diffus. 2016, 37, 301–307. [Google Scholar] [CrossRef]
- Černičková, I.; Čička, R.; Švec, P.; Janičkovič, D.; Priputen, P.; Janovec, J. A study of phase equilibria in the Al-Pd-Co system at 700 °C. In Aperiodic Crystals (Cairns), 1st ed.; Schmid, S., Ed.; Springer: Berlin, Germany, 2013; pp. 133–139. [Google Scholar]
- Ďuriška, L.; Černičková, I.; Priputen, P.; Janovec, J. Partial experimental isothermal section of Al-Pd-Co phase diagram for Al-rich corner at 1020 °C. J. Phase Equilib. Diffus. 2019, 40, 45–52. [Google Scholar] [CrossRef]
- Frigan, B.; Santana, A.; Engel, M.; Schopf, D.; Trebin, H.R.; Mihalkovič, M. Low-temperature structure of ξ-Al–Pd–Mn optimized by ab initio methods. Phys. Rev. B 2011, 84, 184203. [Google Scholar] [CrossRef]
- Heggen, M.; Engel, M.; Balanetskyy, S.; Trebin, H.; Feuerbacher, M. Structural variations in ε-type Al-Pd-(Mn,Fe) complex metallic alloy phases. Philos. Mag. 2008, 88, 507–521. [Google Scholar] [CrossRef]
- Yurechko, M.; Fattah, A.; Velikanova, T.; Grushko, B. A contribution to the Al-Pd phase diagram. J. Alloys Compd. 2001, 329, 173–181. [Google Scholar] [CrossRef]
- Armbrüster, M.; Schlögl, R.; Grin, Y. Intermetallic compounds in heterogeneous catalysis-a quickly developing field. Sci. Technol. Adv. Mater. 2014, 15, 034803. [Google Scholar] [CrossRef]
- Massiani, Y.; Yaazza, S.A.; Croussier, J.P.; Dubois, J.M. Electrochemical behaviour of quasicrystalline alloys in corrosive solutions. J. Non-Cryst. Solids 1993, 159, 92–100. [Google Scholar] [CrossRef]
- Huttunen–Saarivirta, E.; Tiainen, T. Corrosion behaviour of Al–Cu–Fe alloys containing a quasicrystalline phase. Mater. Chem. Phys. 2004, 85, 383–395. [Google Scholar] [CrossRef]
- Rüdiger, A.; Köster, U. Corrosion of Al–Cu–Fe quasicrystals and related crystalline phases. J. Non-Cryst. Solids 1999, 250–252, 898–902. [Google Scholar] [CrossRef]
- Beni, A.; Ott, N.; Ura–Binczyk, E.; Rasinski, M.; Bauer, B.; Gille, P.; Ulrich, A.; Schmutz, P. Passivation and localised corrosion susceptibility of new Al–Cr–Fe complex metallic alloys in acidic NaCl electrolytes. Electrochim. Acta 2011, 56, 10524–10532. [Google Scholar] [CrossRef]
- Ura-Binczyk, E.; Homazava, N.; Ulrich, A.; Hauert, R.; Lewandowska, M.; Kurzydlowski, K.J.; Schmutz, P. Passivation of Al-Cr-Fe and Al-Cu-Fe-Cr complex metallic alloys in 1 M H2SO4 and 1 M NaOH solutions. Corros. Sci. 2011, 53, 1825–1837. [Google Scholar] [CrossRef]
- Palcut, M.; Priputen, P.; Kusý, M.; Janovec, J. Corrosion behaviour of Al–29at%Co alloy in aqueous NaCl. Corros. Sci. 2013, 75, 461–466. [Google Scholar] [CrossRef]
- Palcut, M.; Priputen, P.; Šalgó, K.; Janovec, J. Phase constitution and corrosion resistance of Al-Co alloys. Mater. Chem. Phys. 2015, 166, 95–104. [Google Scholar] [CrossRef]
- Priputen, P.; Palcut, M.; Babinec, M.; Mišík, J.; Černičková, I.; Janovec, J. Correlation between microstructure and corrosion behavior of near-equilibrium Al-Co alloys in various environments. J. Mater. Eng. Perform. 2017, 26, 3970–3976. [Google Scholar] [CrossRef]
- Lekatou, A.; Sfikas, A.K.; Karantzalis, A.E.; Sioulas, D. Microstructure and corrosion performance of Al-32%Co alloys. Corros. Sci. 2012, 63, 193–209. [Google Scholar] [CrossRef]
- Lekatou, A.; Sfikas, A.K.; Petsa, C.; Karantzalis, A.E. Al-Co alloys prepared by vacuum arc melting: Correlating microstructure evolution and aqueous corrosion behavior with Co content. Metals 2016, 6, 46. [Google Scholar] [CrossRef]
- Zhang, Q.; Zhang, Z. On the electrochemical dealloying of Al-based alloys in a NaCl aqueous solution. Phys. Chem. Chem. Phys. 2010, 12, 1453–1472. [Google Scholar] [CrossRef]
- Palcut, M.; Ďuriška, L.; Špoták, M.; Vrbovský, M.; Gerhátová, Ž.; Černičková, I.; Janovec, J. Electrochemical corrosion of Al-Pd alloys in HCl and NaOH solutions. J. Min. Metall. Sect. B-Metall. 2017, 53, 333–340. [Google Scholar] [CrossRef] [Green Version]
- Ďuriška, L.; Palcut, M.; Špoták, M.; Černičková, I.; Gondek, J.; Priputen, P.; Čička, R.; Janičkovič, D.; Janovec, J. Microstructure, phase occurrence, and corrosion behavior of as-solidified and as-annealed Al-Pd alloys. J. Mater. Eng. Perform. 2018, 27, 1601–1613. [Google Scholar] [CrossRef]
- Zhang, Z.; Wang, Y.; Qi, Z.; Zhang, W.; Qin, J.; Frenzel, J. Generalized fabrication of nanoporous metals (Au, Pd, Pt, Ag, and Cu) through chemical dealloying. J. Phys. Chem. C 2009, 113, 12629–12636. [Google Scholar] [CrossRef]
- Erlebacher, J.; Aziz, M.J.; Karma, A.; Dimitrov, N.; Sieradzki, K. Evolution of nanoporosity in dealloying. Nature 2001, 410, 450–453. [Google Scholar] [CrossRef] [PubMed]
- Wang, X.; Wang, W.; Qi, Z.; Zhao, Ch.; Ji, H.; Zhang, Z. High catalytic activity of ultrafine nanoporous palladium for electro-oxidation of methanol, ethanol, and formic acid. Electrochem. Commun. 2009, 11, 1896–1899. [Google Scholar] [CrossRef]
- Balanetskyy, S.; Grushko, B.; Velikanova, T.Ya.; Urban, K. An investigation of the Al-Pd-Fe phase diagram between 50 and 100 at. % Al: Phase equilibria at 750 °C. J. Alloys Compd. 2004, 374, 158–164. [Google Scholar] [CrossRef]
- Černičková, I.; Švec, P.; Watanabe, S.; Čaplovič, Ľ.; Mihalkovič, M.; Kolesár, V.; Priputen, P.; Bednarčík, J.; Janičkovič, D.; Janovec, J. Fine structure of phases of ε-family in Al73.8Pd11.9Co14.3 alloy. J. Alloys Compd. 2014, 609, 73–79. [Google Scholar] [CrossRef]
- Yubuta, K.; Suzuki, S.; Simura, R.; Sugiyama, K. Structure of ε16 phase in Al-Pd-Co system studied by HREM and X-ray diffraction. In Aperiodic Crystals (Cairns), 1st ed.; Schmid, S., Ed.; Springer: Berlin, Germany, 2013; pp. 231–236. [Google Scholar]
- Grushko, B. Again regarding the Al-Pd phase diagram. J. Alloys Compd. 2013, 557, 102–111. [Google Scholar] [CrossRef]
- Cheng, Y.L.; Zhang, Z.; Cao, F.H.; Li, J.F.; Zhang, J.Q.; Wang, J.M.; Cao, C.N. Study of the potential electrochemical noise during corrosion process of aluminum alloys 2024, 7075 and pure aluminum. Mater. Corros. 2003, 54, 601–608. [Google Scholar] [CrossRef]
- ASM International, ASM Handbook Committee. Corrosion: Fundamentals, Testing, and Protection (ASM Handbook Vol. 13A), 1st ed.; ASM International: Novelty, OH, USA, 2003. [Google Scholar]
- Szklarska-Smialowska, Z. Pitting corrosion of aluminum. Corros. Sci. 1999, 41, 1743–1767. [Google Scholar] [CrossRef]
- Li, J.; Dang, J. A summary of corrosion properties of Al-rich solid solution and secondary phase particles in Al alloys. Metals 2017, 7, 84. [Google Scholar] [CrossRef]
- Birbilis, N.; Buchheit, R.G. Electrochemical Characteristics of Intermetallic Phases in Aluminum Alloys: An experimental survey and discussion. J. Electrochem. Soc. 2005, 152, B140–B151. [Google Scholar] [CrossRef]
- Zhang, Q.; Wang, X.; Qi, Z.; Wang, Y.; Zhang, Z. A benign route to fabricate nanoporous gold through electrochemical dealloying of Al–Au alloys in a neutral solution. Electrochim. Acta 2009, 54, 6190–6198. [Google Scholar] [CrossRef]
- Lekatou, A.G.; Sfikas, A.K.; Karantzalis, A.E. The influence of the fabrication route on the microstructure and surface degradation properties of Al reinforced by Al9Co2. Mater. Chem. Phys. 2017, 200, 33–49. [Google Scholar] [CrossRef]
- Lim, A.B.Y.; Neo, W.J.; Yauw, O.; Chylak, B.; Gan, C.L.; Chen, Z. Evaluation of the corrosion performance of Cu–Al intermetallic compounds and the effect of Pd addition. Microelectron. Reliab. 2016, 56, 155–161. [Google Scholar] [CrossRef]
- Li, R.T.; Murugan, V.K.; Dong, Z.L.; Khor, K.A. Comparative study on the corrosion resistance of Al–Cr–Fe alloy containing quasicrystals and pure Al. J. Mater. Sci. Technol. 2016, 32, 1054–1058. [Google Scholar] [CrossRef]
- Debili, M.Y.; Sassane, N.; Boukhris, N. Structure and corrosion behavior of Al-Co-Ti alloy system. Anti Corros. Methods Mater. 2017, 64, 443–451. [Google Scholar] [CrossRef]
- Sassane, N.; Debili, M.Y.; Boukhris, N.E. Structural characterization of a ternary Al-Co-Ti alloy system. J. Adv. Microsc. Res. 2018, 13, 409–416. [Google Scholar] [CrossRef]
- Zhu, Y.; Sun, K.; Frankel, G.S. Intermetallic phases in aluminum alloys and their roles in localized corrosion. J. Electrochem. Soc. 2018, 165, C807–C820. [Google Scholar] [CrossRef]


| Phase | Space Group/Symmetry | Lattice Parameter | |||
|---|---|---|---|---|---|
| a (nm) | b (nm) | c (nm) | β (°) | ||
| Al–Pd–Co system | |||||
| W | Pmn21 | 2.36 | 0.82 | 2.07 | - |
| Y2 | Immm | 1.5451 | 1.2105 | 0.7590 | - |
| U | C121, C1m1 or C12/m1 | 1.9024 | 2.9000 | 1.3140 | 117.26 |
| V | P121, P1m1 or P12/m1 | 1.0068 | 0.3755 | 0.6512 | 102.38 |
| F | 2.4397 | - | - | - | |
| C2 | 1.5507 | - | - | - | |
| ε16 | Amm2 | 2.35 | 1.68 | 3.26 | - |
| ε22 | orthorhombic | 2.35 | 1.68 | 4.49 | - |
| ε34 | orthorhombic | 2.35 | 1.68 | 7.01 | - |
| Al–Pd system | |||||
| ε6 | Pna21 | 2.35 | 1.68 | 1.23 | - |
| ε28 | C2mm | 2.35 | 1.68 | 5.70 | - |
| Al3Pd2 (δ) | 0.4227 | - | 0.5167 | - | |
| AlPd (β) | 0.3036 | - | - | - | |
| Al–Co system | |||||
| Al9Co2 | P21/a | 0.85565 | 0.6290 | 0.62130 | 94.76 |
| O-Al13Co4 | Pmn21 or Pnmn | 0.8158 | 1.2347 | 1.4452 | - |
| M-Al13Co4 | C2/m | 1.5173 | 0.81090 | 1.2349 | 107.84 |
| Z-Al3Co | monoclinic | 3.984 | 0.8148 | 3.223 | 107.97 |
| Al5Co2 | P63/mmc | 0.76717 | - | 0.76052 | - |
| AlCo (β) | 0.2854 | - | - | - | |
| Alloy | Alloy Condition | Identified Phase/Structure | Element Concentration (at.%) | Volume Fraction (%) | ||
|---|---|---|---|---|---|---|
| Al | Pd | Co | ||||
| Al70Pd25Co5 | as-solidified | εn/ε6 + ε28 | 72.5 ± 0.1 | 18.9 ± 0.3 | 8.6 ± 0.3 | 77 |
| δ | 59.8 ± 0.2 | 39.7 ± 0.4 | 0.5 ± 0.2 | 23 | ||
| Al74Pd12Co14 | as-solidified | εn/ε6 + ε16 + ε28 | 73.9 ± 1.0 | 12.0 ± 5.5 | 14.1 ± 4.6 | 100 |
| Alloy | OCP (mV vs. Ag/AgCl) | Ecorr (mV vs. Ag/AgCl) | jcorr (A m−2) | Ebd (mV vs. Ag/AgCl) | Erp (mV vs. Ag/AgCl) |
|---|---|---|---|---|---|
| Al70Pd25Co5 | −370 ± 35 | −677 | 0.101 | −332 | −447 |
| Al74Pd12Co14 | −607 ± 9 | −758 | 0.176 | −393 | −540 |
| Alloy | Identified Phase/Structure | Element concentration (at.%) | |||||
|---|---|---|---|---|---|---|---|
| Al | Δ(Al) | Pd | Δ(Pd) | Co | Δ(Co) | ||
| Al70Pd25Co5 | εn/ε6 + ε28 | 69.0 ± 0.3 | −3.5 | 22.2 ± 0.4 | + 3.3 | 8.8 ± 0.4 | - |
| δ | 60.0 ± 0.3 | - | 39.4 ± 0.3 | - | 0.6 ± 0.2 | - | |
| Al74Pd12Co14 | εn/ε6 + ε16 + ε28 | 71.1 ± 0.9 | −2.8 | 14.3 ± 5.3 | + 2.3 | 14.6 ± 4.3 | - |
© 2019 by the authors. Licensee MDPI, Basel, Switzerland. This article is an open access article distributed under the terms and conditions of the Creative Commons Attribution (CC BY) license (http://creativecommons.org/licenses/by/4.0/).
Share and Cite
Palcut, M.; Ďuriška, L.; Černičková, I.; Brunovská, S.; Gerhátová, Ž.; Sahul, M.; Čaplovič, Ľ.; Janovec, J. Relationship between Phase Occurrence, Chemical Composition, and Corrosion Behavior of as-Solidified Al–Pd–Co Alloys. Materials 2019, 12, 1661. https://doi.org/10.3390/ma12101661
Palcut M, Ďuriška L, Černičková I, Brunovská S, Gerhátová Ž, Sahul M, Čaplovič Ľ, Janovec J. Relationship between Phase Occurrence, Chemical Composition, and Corrosion Behavior of as-Solidified Al–Pd–Co Alloys. Materials. 2019; 12(10):1661. https://doi.org/10.3390/ma12101661
Chicago/Turabian StylePalcut, Marián, Libor Ďuriška, Ivona Černičková, Sandra Brunovská, Žaneta Gerhátová, Martin Sahul, Ľubomír Čaplovič, and Jozef Janovec. 2019. "Relationship between Phase Occurrence, Chemical Composition, and Corrosion Behavior of as-Solidified Al–Pd–Co Alloys" Materials 12, no. 10: 1661. https://doi.org/10.3390/ma12101661