Article

Removal of Crystal Violet by Using Reduced-Graphene-Oxide-Supported Bimetallic Fe/Ni Nanoparticles (rGO/Fe/Ni): Application of Artificial Intelligence Modeling for the Optimization Process

1
Guizhou Provincial Key Laboratory for Information Systems of Mountainous Areas and Protection of Ecological Environment, Guizhou Normal University, Guiyang 550001, China
2
Cultivation Base of Guizhou National Key Laboratory of Mountainous Karst Eco-environment, Guizhou Normal University, Guiyang 550001, China
3
Department of Applied Chemistry, College of Chemistry and Molecular Engineering, Peking University, Beijing 100871, China
*
Author to whom correspondence should be addressed.
Materials 2018, 11(5), 865; https://doi.org/10.3390/ma11050865
Submission received: 1 May 2018 / Revised: 16 May 2018 / Accepted: 18 May 2018 / Published: 22 May 2018

Abstract

:
Reduced-graphene-oxide-supported bimetallic Fe/Ni nanoparticles were synthesized in this study for the removal of crystal violet (CV) dye from aqueous solutions. This material was characterized by X-ray diffraction (XRD), scanning electron microscopy (SEM) coupled with energy dispersive spectroscopy (EDS), Raman spectroscopy, N2-sorption, and X-ray photoelectron spectroscopy (XPS). The influence of independent parameters (namely, initial dye concentration, initial pH, contact time, and temperature) on the removal efficiency were investigated via Box–Behnken design (BBD). Artificial intelligence (i.e., artificial neural network, genetic algorithm, and particle swarm optimization) was used to optimize and predict the optimum conditions and obtain the maximum removal efficiency. The zero point of charge (pHZPC) of rGO/Fe/Ni composites was determined by using the salt addition method. The experimental equilibrium data were fitted well to the Freundlich model for the evaluation of the actual behavior of CV adsorption, and the maximum adsorption capacity was estimated as 2000.00 mg/g. The kinetic study discloses that the adsorption processes can be satisfactorily described by the pseudo-second-order model. The values of Gibbs free energy change (ΔG0), entropy change (ΔS0), and enthalpy change (ΔH0) demonstrate the spontaneous and endothermic nature of the adsorption of CV onto rGO/Fe/Ni composites.

1. Introduction

Crystal violet (CV) as a cationic dye belongs to the class of triphenylmethane dyes, which is used for different purposes, such as dermatological agents, biological staining, textile dying, and paper printing [1,2,3]. Colored dyes create issues in the ecosystem as they are not only nonbiodegradable, toxic, mutagenic, and carcinogenic but also reduce light penetration and affect the photosynthetic activity of aquatic life [4,5,6]. CV is commonly stable when discharged into waste water owing to the complex aromatic molecular structure; therefore, it is imperative to remove this dye from waste water [7,8]. There are many methods for the removal of dyes like biological treatment, oxidation, photochemical degradation, membrane separation, coagulation, and adsorption [9]. However, adsorption has been adopted as a superior method for the removal of dyes because of the advantages such as low cost, ease of operation, and good efficiency.
Nanoscale zero-valent iron (nZVI) with small particle size (1 to 100 nm), can be obtained through the sonochemistry method, electrochemical method, and the liquid-phase or gas-phase reduction methods. Recently, nZVI has gained interest as a more promising material for the long term because of its large specific surface area and high reactivity, and this material has been utilized for the remediation of wastewater contaminated with heavy metals, halogenated organic compounds, dyes, and phenol [10,11,12,13,14]. Nevertheless, nZVI can be oxidized and aggregated in air; as a result, it will render a lower reactivity and removal efficiency [15]. A further effort to improve the performance of nZVI was combination with a second metal (such as Ni, Pd, or Pt) which has been reported to enhance the dechlorination rate of chlorinated hydrocarbons. However, such bimetallic nanoparticles are still susceptible to several drawbacks, e.g., strong tendency to be oxidized, aggregated, and corroded during the dechlorination process. Recently, graphene oxide (GO), containing a range of reactive oxygen functional groups, has attracted multidisciplinary interest due to its excellent electrical, mechanical, and thermal properties (Figure 1) [16,17,18], and it has been applied in the fields of sensors, field-effect transistors, polymer composites, and nanocomposites [17]. Fe adsorption on graphene has been investigated previously by using computational simulation techniques [19,20,21,22,23]. Moreover, reduced graphene oxide (rGO) has high chemical stability, which is a good alternative as the support. rGO has been successfully used to immobilize nZVI for photodegradation of chlorophenols and the removal of heavy metals and dyes. Artificial intelligence (AI) techniques, such as artificial neural networks (ANNs), genetic algorithms (GAs), particle swarm optimization (PSO), adaptive neuro fuzzy inference systems (ANFISs), and support vector machines (SVMs), have been extensively used for modeling of the adsorption processes [24,25,26]. AI techniques have been applied in various fields, e.g., automatic programming, big data, pattern recognition, intelligent internet search, image understanding, autonomous driving, robotics, and human–computer games [27]. An ANN is constructed taking inspiration from the biological neurons in the human brain, which can solve complex and nonlinear problems with suitable amount of data, but its main disadvantage is that the solutions are easily trapped in a local optimum [28,29]. Both PSO and GA are powerful population-based techniques for optimizing problems to avoid a local optimum.
In this work, response surface methodology (RSM), ANN-GA, and ANN-PSO were applied to optimize and predict the process conditions for the maximum removal efficiency of CV removal from aqueous solutions. Parameters investigated for the CV removal include the effect of initial dye concentration, initial pH, contact time, and temperature. The rGO/Fe/Ni composites were synthesized by the co-precipitation method and characterized though X-ray diffraction (XRD), scanning electron microscopy (SEM) in conjunction with energy dispersive spectroscopy (EDS), Raman spectroscopy, N2-sorption, and X-ray photoelectron spectroscopy (XPS). The zero point of charge (pHZPC) of rGO/Fe/Ni composites was determined by using the salt addition method. The isotherm models of Freundlich, Langmuir, Temkin, and Dubinin–Radushkevich (D-R) were adopted to analyze the experimental data. Adsorption kinetics were examined by using pseudo-first-order, pseudo-second-order, intraparticle diffusion, and Elovich models. In addition, thermodynamics parameters (Gibbs free energy change, entropy and enthalpy changes) were calculated using the Van’t Hoff equation.

2. Experimental Section

2.1. Materials

All reagents and chemicals used in this work were of analytical grade, including H2SO4, FeSO4·7H2O, NiCl·6H2O, NaBH4, HCl, and NaOH. Crystal violet (molecular formula: C25H30N3Cl, molecular weight = 408 g/mol, λmax = 583 nm) used in this work was supplied by Tianjin Kemio Chemical Co., Tianjin, China (Figure 2, Table 1). The stock solution of this dye (1000 mg/L) was prepared with deionized water. Graphite powder (particle diameters < 30 μm) was purchased from Sinopharm Chemical Reagent (Beijing, China).

2.2. Preparation of the Nanomaterials

2.2.1. Synthesis of GO

GO was synthesized by the modified Hummers method [30]. Quantities of 2.0 g graphite powder and 0.5 g NaNO3 were placed into 40 mL H2SO4 in a 500 mL beaker under continuous stirring. Then, 5.0 g KMnO4 was slowly added and stirred for 2 h below 20 °C. After this, the temperature of the solution was raised to 35 °C and kept for 30 min during the above-mentioned process. Subsequently, the reaction mixture was heated to 98 °C and allowed to react for 15 min under stirring. Finally, H2O2 (30 wt %) was added to the reaction mixture, and the yellow-brown graphite oxide solution was washed several times with diluted HCl (5 wt %) and deionized water. The resultant nanoparticles were obtained by centrifugation, then dried at 60 °C for 48 h in vacuum.

2.2.2. Synthesis of Fe/Ni Nanoparticles and rGO/Fe/Ni Composites

The rGO/Fe/Ni composites were synthesized by the co-precipitation method [31]. FeSO4·7H2O solution and NiCl·6H2O solution were added into GO solution using ultrasonication for about 2 h. The mixture was then stirred for 12 h. After this, 5.2 g NaBH4 dissolved in 50 mL of deionized water was added to the mixture. The black precipitate was obtained via centrifugation with three deionized water and ethanol washing cycles, and then dried at 50 °C under a vacuum for 24 h before characterization. Furthermore, Fe/Ni nanoparticles were also prepared similarly to rGO/Fe/Ni composites without adding the GO.

2.3. Characterization of the Prepared Nanomaterials

X-ray diffraction patterns of Fe/Ni and rGO/Fe/Ni were obtained using a Philips Analytical X-ray (Lelyweg 1 7602, EA, Almelo, The Netherlands) with a Cu Kα X-ray source (generator tension 40 kV, current 40 mA) in the range of 5–90°. The morphology and dimensions of these materials were characterized by scanning electron microscopy (Quanta F250, FEI, Hillsboro, OR, USA) coupled with energy dispersive spectroscopy. Raman measurements were performed by using LabRAM HR800 spectroscopy recorded at a 532 nm laser source (Horiba Jobin Yvon, Paris, France). The specific surface areas of Fe/Ni nanoparticles and rGO/Fe/Ni composites were determined using the N2 adsorption/desorption isotherms at 77 K (Brunauer–Emmett–Teller (BET) Quadrasorb SI, Quantachrome Instruments, Boynton Beach, FL, USA). The Fe/Ni and rGO/Fe/Ni composites were characterized by X-ray photoelectron spectroscopy using an ESCALAB 250Xi spectrometer (Thermo Electron Corporation, Waltham, MA, USA).

2.4. Determination of the Zero Point of Charge

The pH of an aqueous solution is an important factor that may influence the adsorption process. The zero point of charge (ZPC) is defined as the pH value where a net surface charge equal to zero is indicated [32]. The pHZPC of rGO/Fe/Ni composites was determined by using the salt addition method [33]. A quantity of 30 mL of NaCl (0.05 mol/L) solution was added to several 100 mL Erlenmeyer flasks. Initial pH (pHi) values of NaCl solutions were adjusted over a range from 2 to 10 by adding 0.1 mol/L HCl and NaOH. pHi values of solutions were then accurately recorded, and 50 mg of each adsorbent was added to each flask. Suspensions were shaken at 298 K for 48 h. The suspensions were centrifuged at 4500 rpm for 5 min, and the final pH (pHf) values of the suspensions were recorded. The value of pHZPC is the point where the curve of ΔpH (pHf–pHi) versus pHi crosses the line equal to zero while pHZPC was determined by the intersection point of the curve.

2.5. Experiments

The removal of CV by rGO/Fe/Ni composites was studied in a batch system. Conical flasks with volume 100 mL were used for mixing 20 mg rGO/Fe/Ni with 50 mL of solution of known CV concentration, initial pH, temperature, and contact time. The solutions were agitated with a thermostatically controlled shaker at 200 rpm. The initial pH values were adjusted by the addition of 0.1 mol/L HCl or 0.1 mol/L NaOH to conduct the batch experiments at the desired pH. The isotherm study was carried out with different initial concentrations of CV from 200 to 1000 mg/L, keeping the other variables constant. The kinetic study was done by varying time from 5 to 24 min. For the thermodynamic study, the temperature was varied from 298 to 318 K. Then, the adsorbents were separated by centrifugation, and the final concentration of CV was analyzed by measuring a UV-visible spectrophotometer at λmax of 583 nm. The percentage removal (Y) and the amount of CV removal at equilibrium, qe (mg/g), were calculated by the following equations:
Y = ( C i C f ) C i × 100 %
q e = ( C i C f ) × v m
where Ci (mg/L) and Cf (mg/L) are the initial and final CV concentrations in solution, respectively; v is the volume of the solution (mL); and m is the dosage of the adsorbent (mg).

2.6. Optimization of Operating Parameters

2.6.1. Box–Behnken Design (BBD)
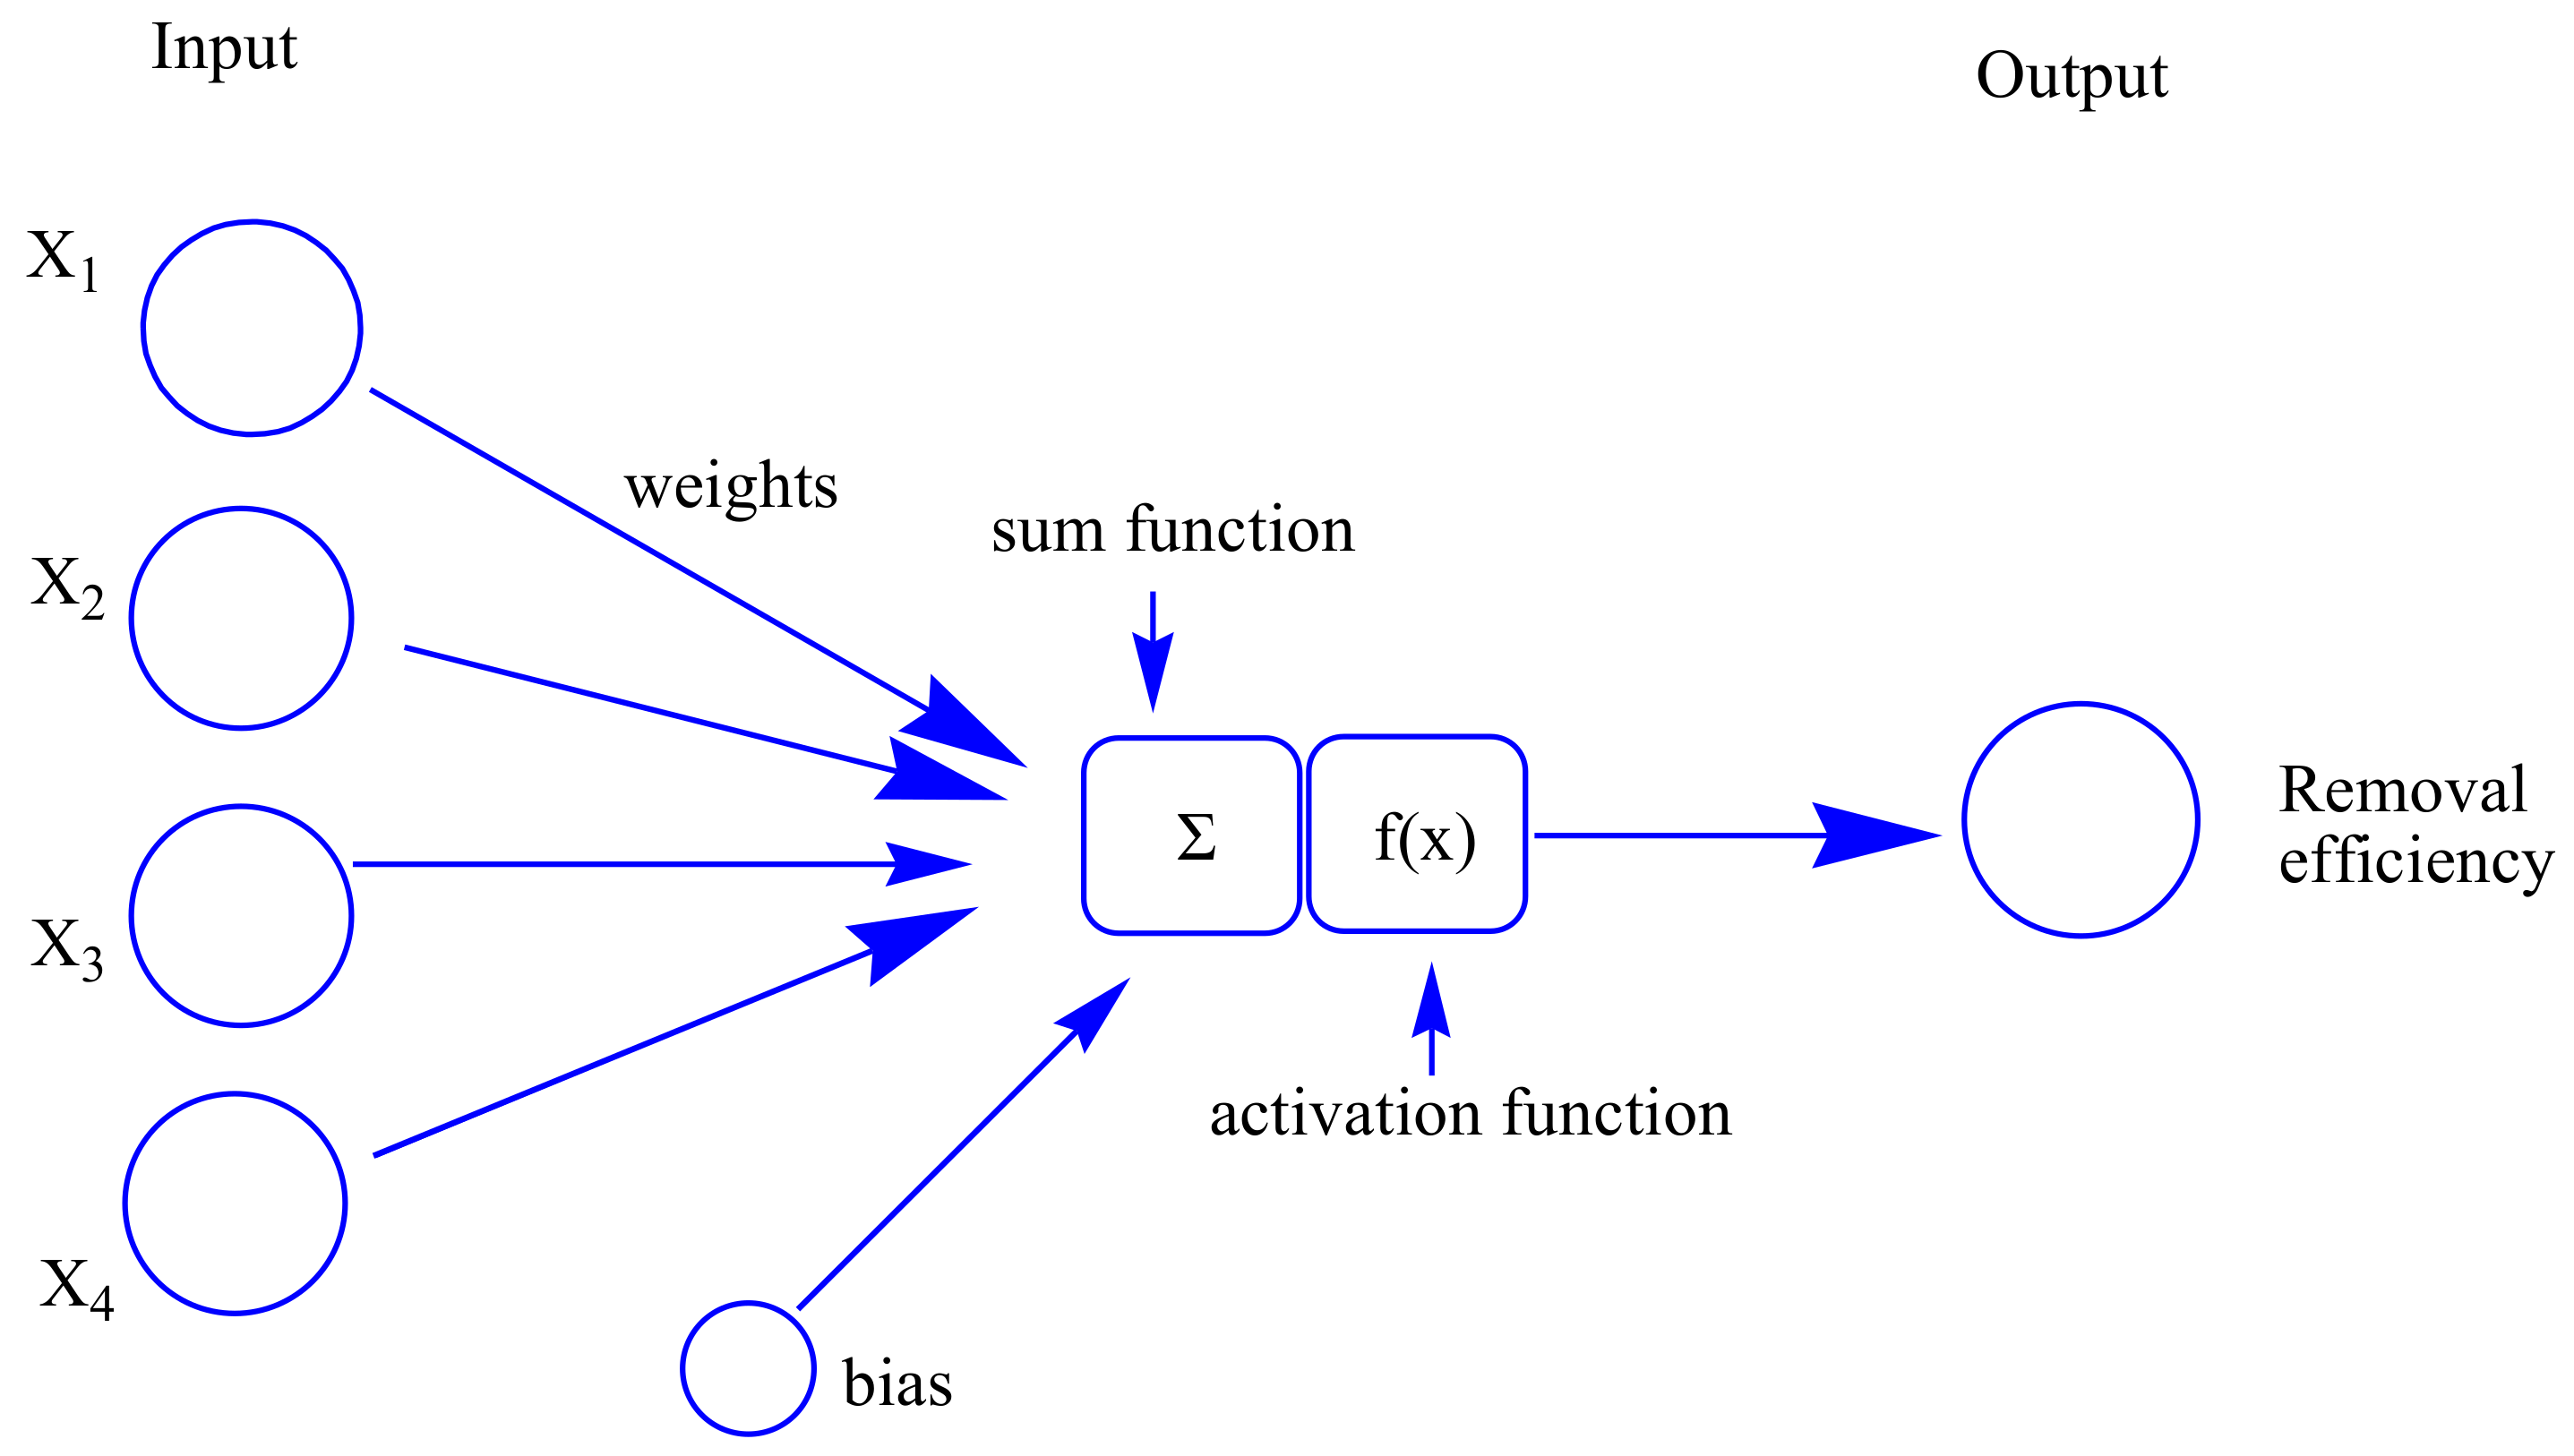
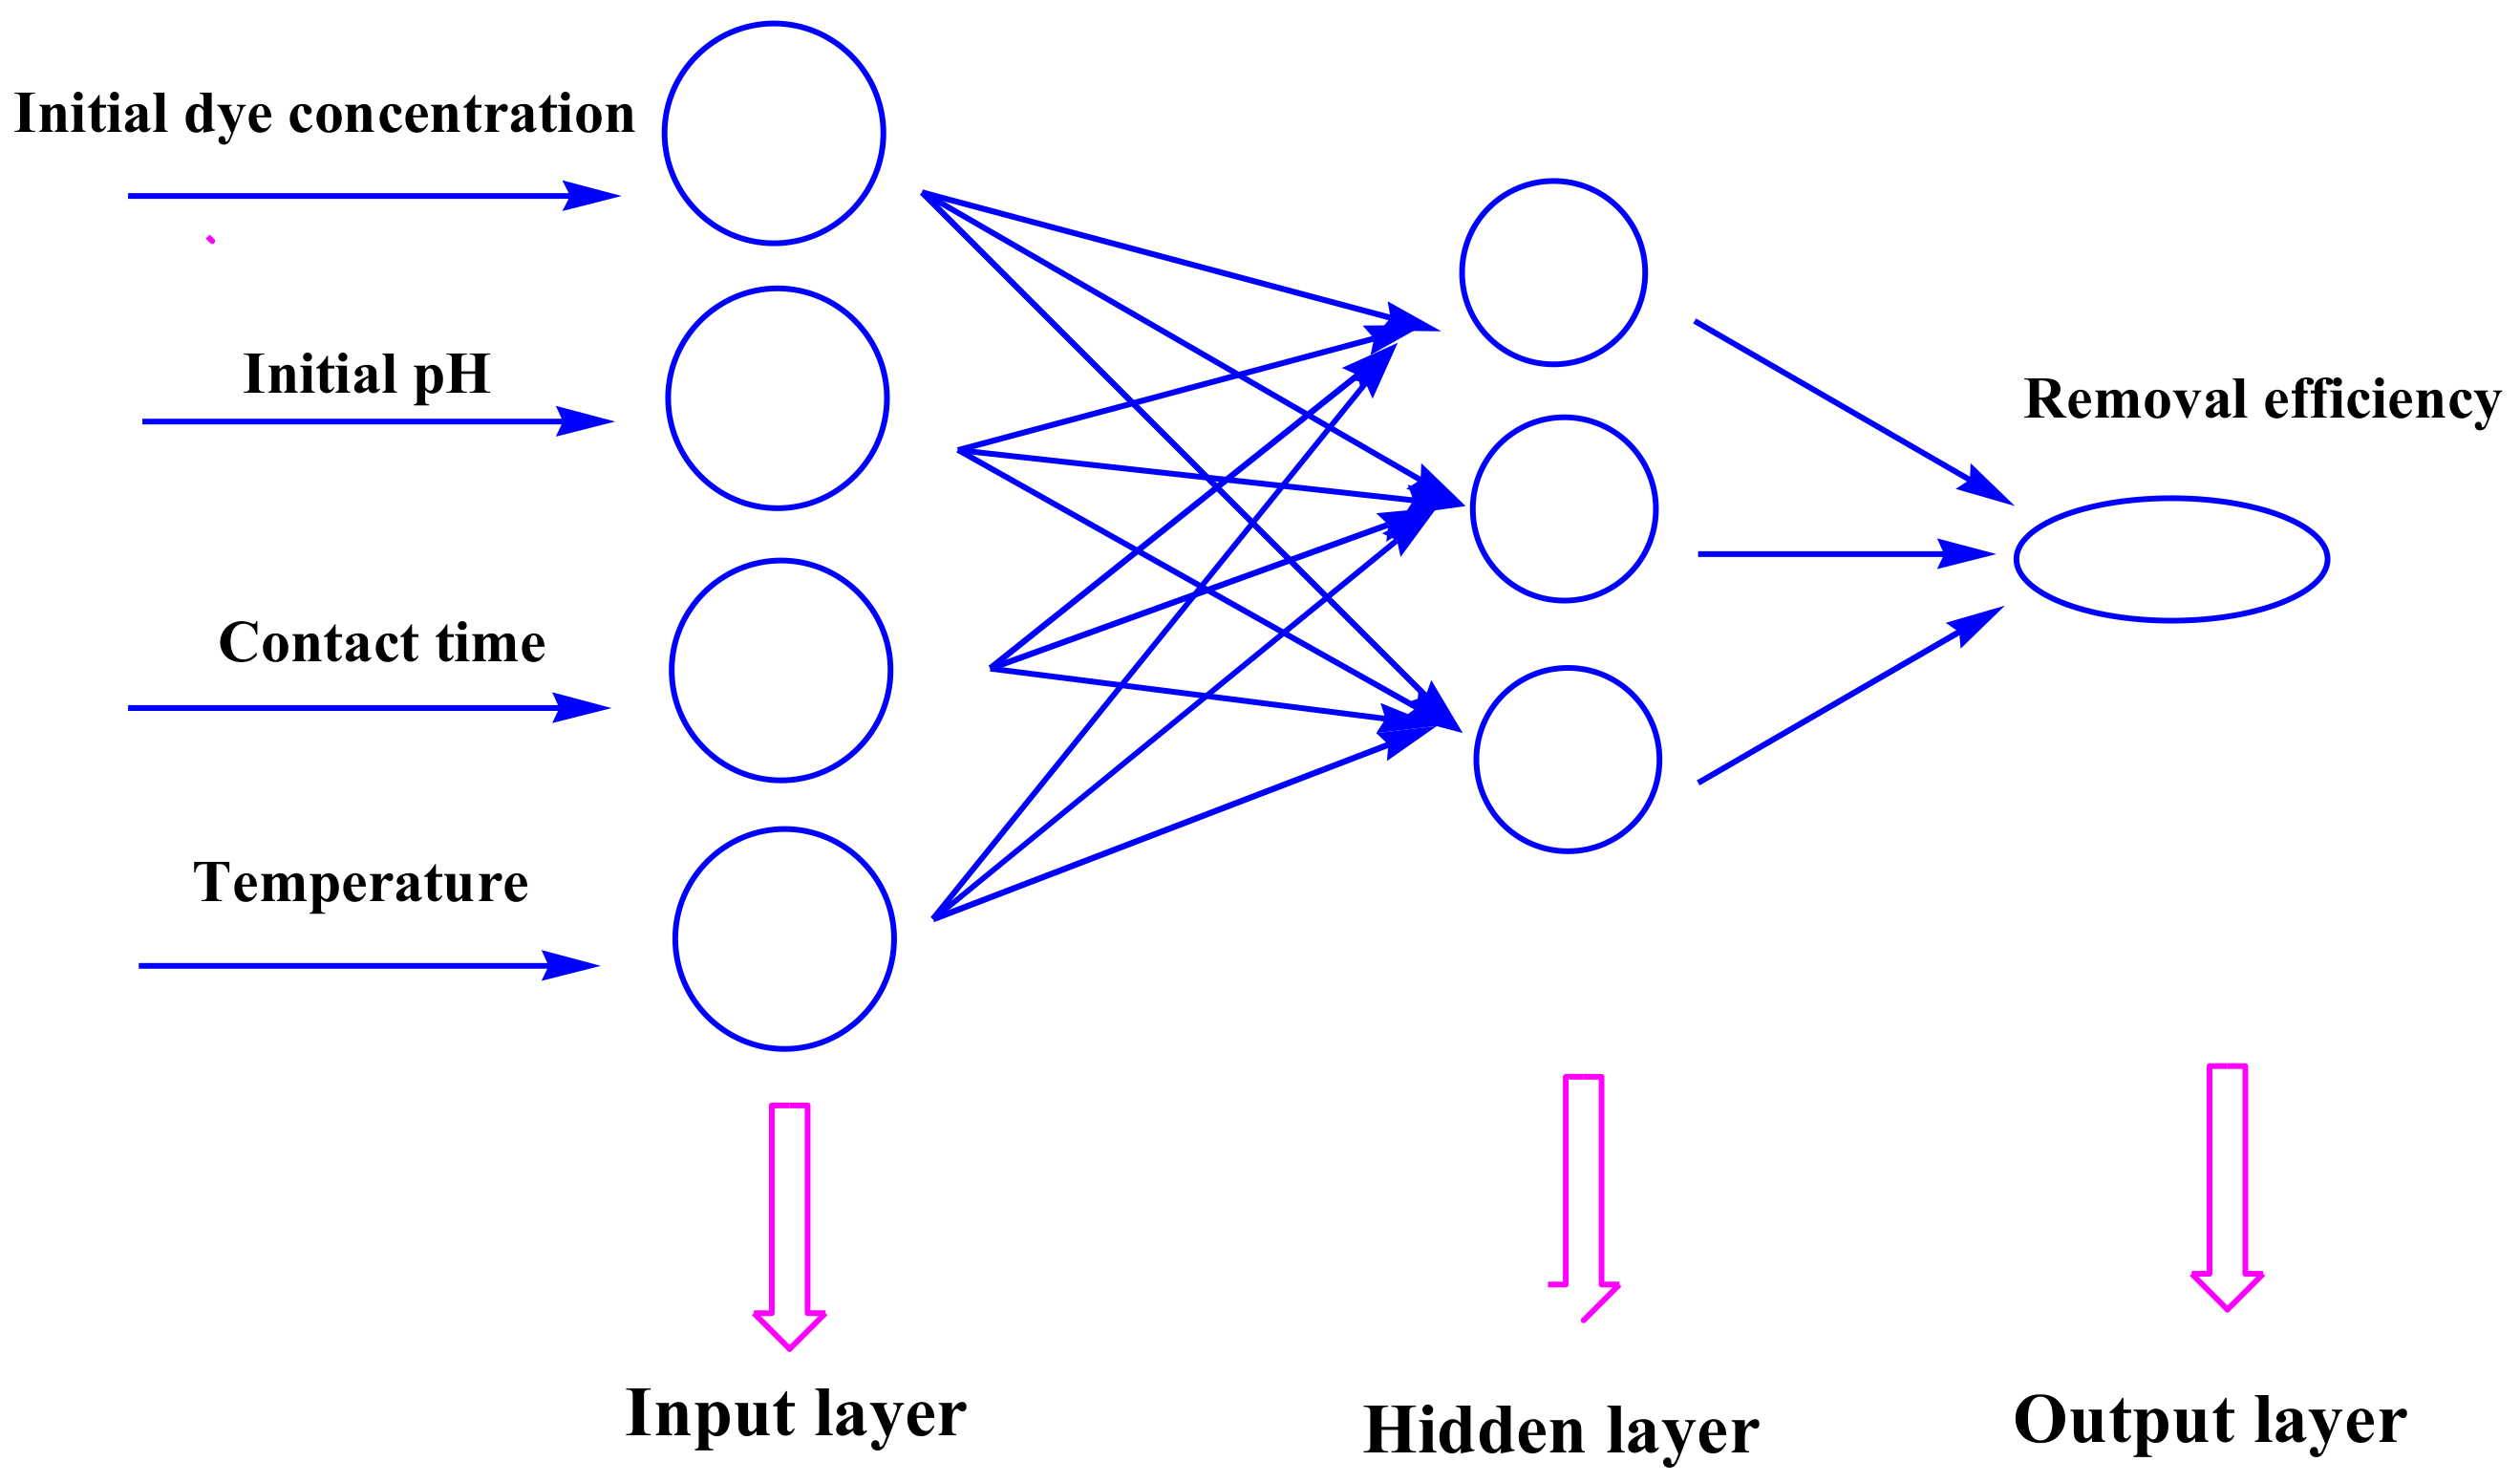
The Box–Behnken Design (BBD), as one of the designs for experiments of response surface methodology (RSM), was used to investigate the combined effects of independent variables, namely, initial dye concentration (X1), initial pH (X2), contact time (X3), and temperature (X4), with the minimum number of combinations for the four factors mentioned above [34]. A total of 29 experiments, involving the four operating parameters at three levels and five replications of the central point, were devised by BBD. This model will also give the maximum removal efficiency of CV under optimum conditions. Each independent variable has 3 levels designated as −1, 0, and +1 for low, middle, and high values, respectively (Table 2). The relationship of the independent variables and the percentage decolorization of CV is described by the second-order polynomial
Y = β 0 + β 1 X 1 + β 2 X 2 + β 3 X 3 + β 4 X 4 + β 5 X 1 X 2 + β 6 X 1 X 3 + β 7 X 1 X 4 + β 8 X 2 X 3 + β 9 X 2 X 4 + β 10 X 3 X 4 + β 11 X 1 2 + β 12 X 2 2 + β 13 X 3 2 + β 14 X 4 2
where Y is the removal efficiency of CV; Xi (i = 1–4) are noncoded variables; and βj (j = 0–14) are the regression coefficients for intercept, linear, quadratic, and interaction effects, respectively (ij).

2.6.2. ANN Modeling

ANNs are capable of machine learning and pattern recognition, which can solve problems like learning, thinking, remembering, and reasoning. The artificial neurons are the basic elements of ANNs, and consist of many simple computational elements that are connected to each other. The “network” is defined as the structure in which the neurons act simultaneously in a group. In the present study, a three-layer feed-forward perceptron ANNs with a back-propagation (BP) algorithm was established for modeling purposes [35]. This network consists of an input layer, hidden layers, and an output layer. All input weights were summed to create the output through the activation function [36] (Figure 3). The tangent sigmoid transfer function (tansig) (Equation (7)) was used in the input–hidden layer, whereas the linear transfer function (purelin) (Equation (8)) was adopted in the output layer.
All the input and output were normalized within uniform range (0.1–0.9) during training of the network. Normalization of the input data was done using the following equation:
x i = 2 × ( x x min ) / ( x max x min ) 1
where xi is the corresponding scaled variable for an input variable (x); likewise, xmin and xmax are the minimum and maximum values of the variable, respectively.
W i = i = 1 k w i j x i
s u m = W i + θ
In Equations (5) and (6), xi is the value of a neuron in the input layer, wij is the corresponding connection weight between neuron i in the input layer and neuron j in the hidden layer, Wi is the connection weight, and θ is called the bias. The tangent sigmoid (tansig) function and linear transfer function (purelin) were used between the input and hidden layers and between the hidden and output layers, respectively.
f ( x ) = 2 / ( 1 + e 2 x ) 1
f ( x ) = x
The output was produced by the weight and bias of neurons through the activation function using the following equation:
Y = f × s u m
where Y, f, and sum represent the output, activation function, and all weights and biases in hidden layer or output layer, respectively.
The relative influence of the individual variable was calculated by the following Garson equation [37,38]:
I a b = e n ( | w a e | g m | w g e | | w e b | ) z n ( l n ( | w a l | g m w g e | w e b | ) )
where Iab is the relative importance of the jth input variable to the output variable; wx is the connection weight; and a, e, and b are the number of neurons in the input layer, hidden layer, and output layer, respectively.

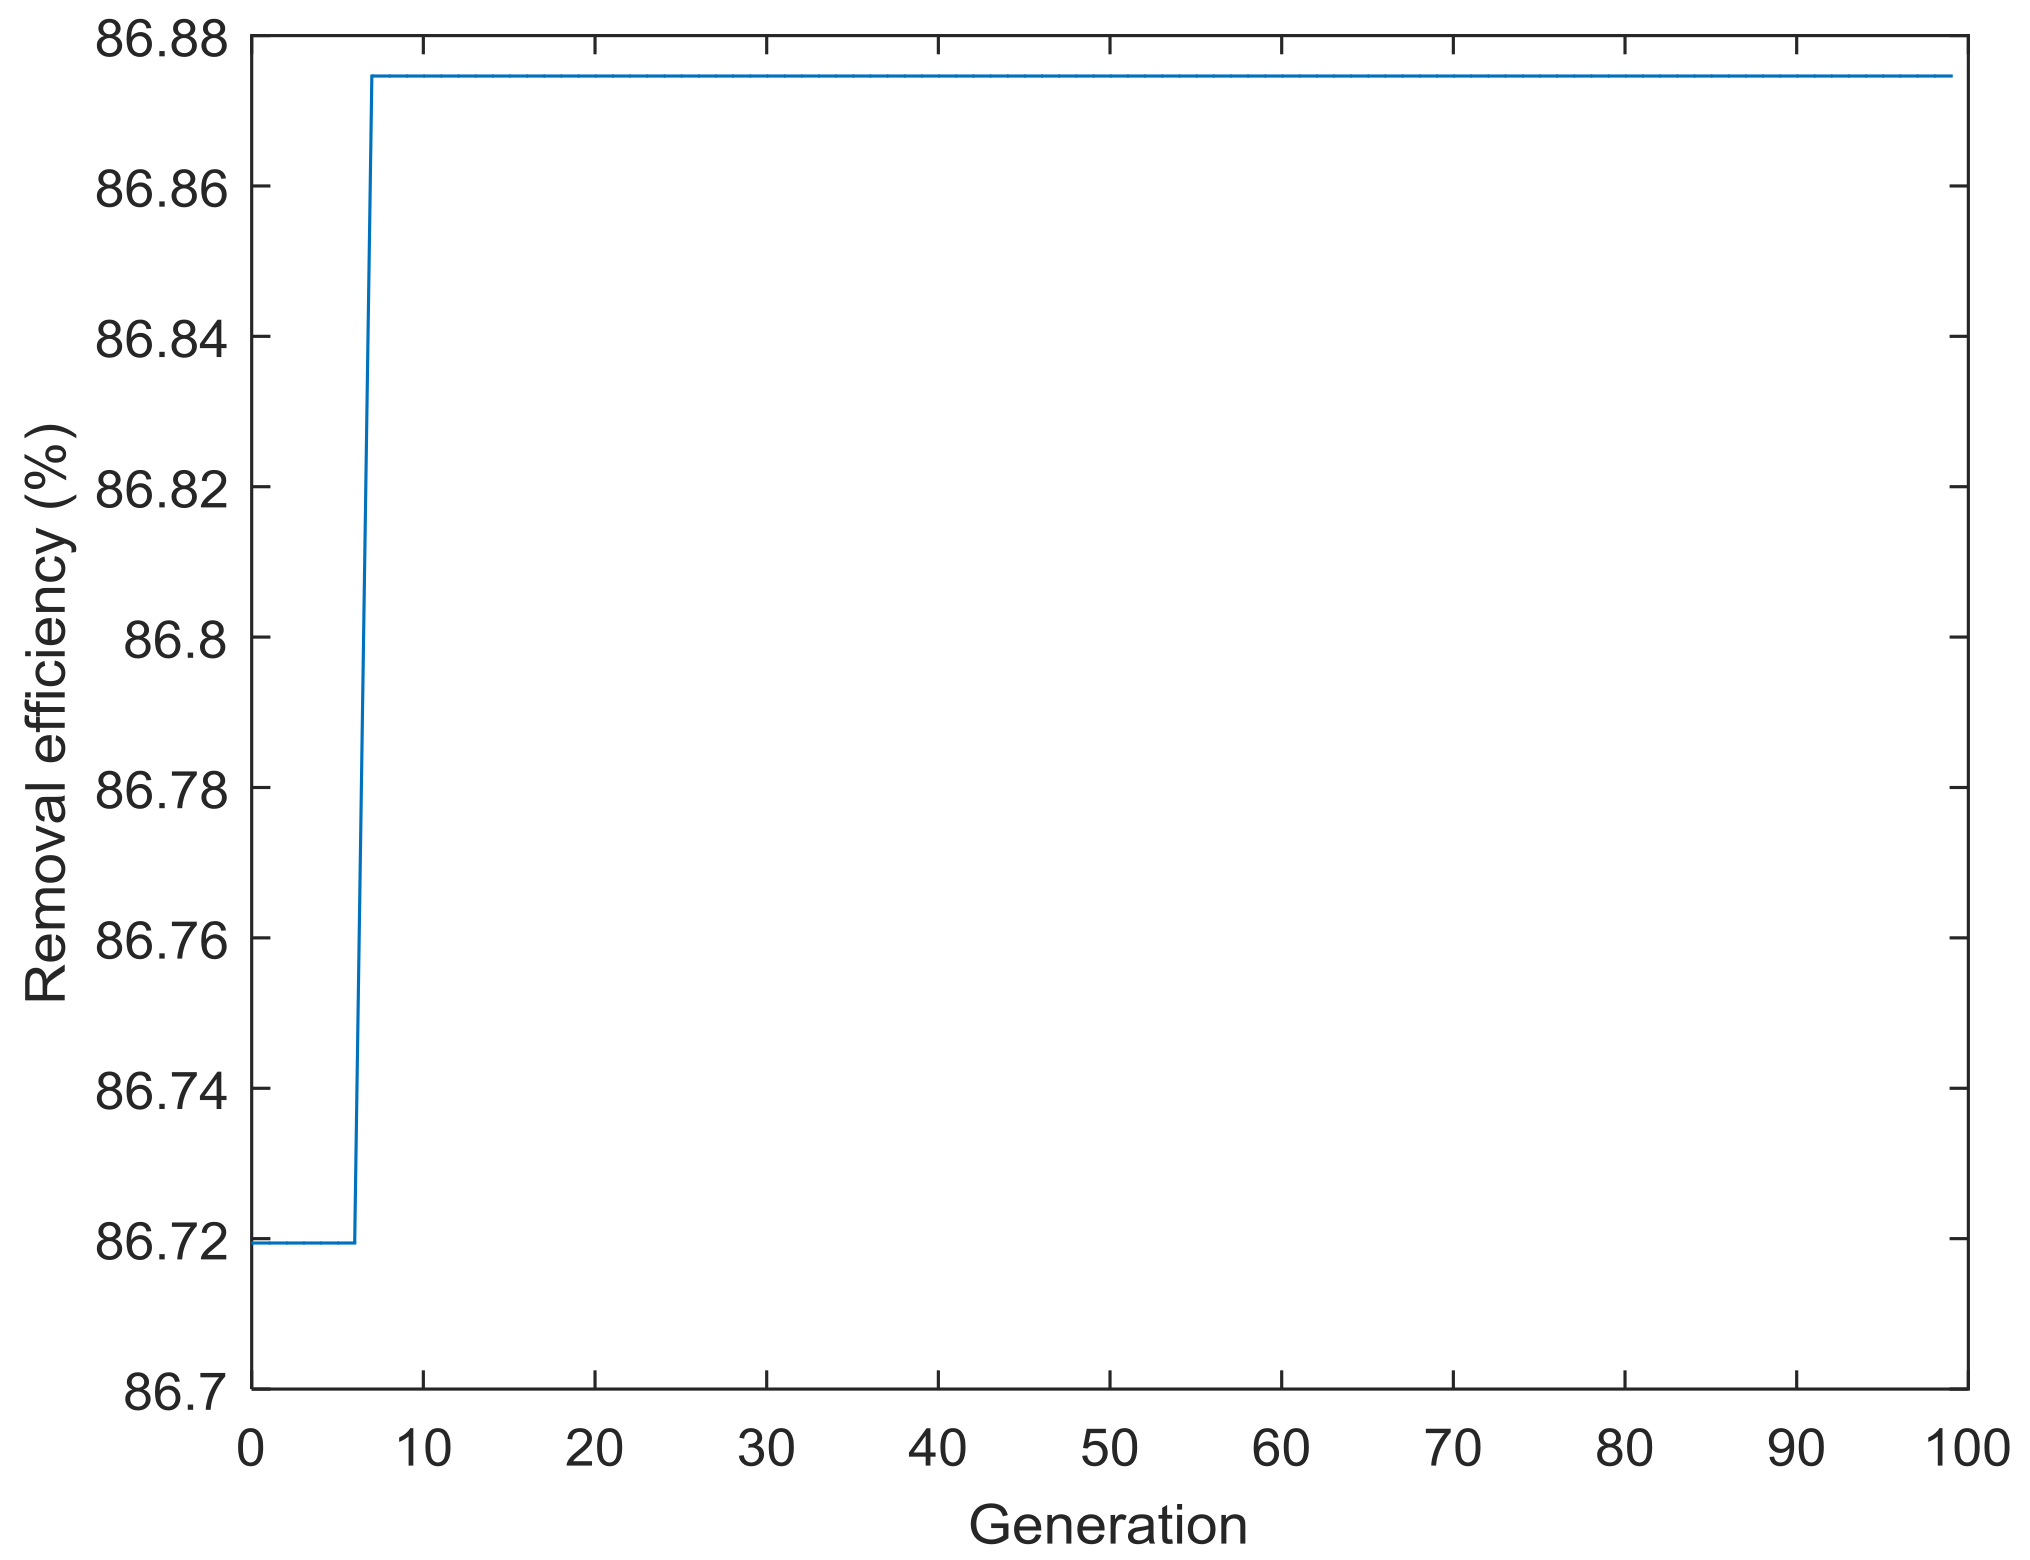
2.6.3. Optimization Using ANN-GA and ANN-PSO Models

GA is considered a useful method for solving optimization problems using the MATLAB 2015a software. PSO, as a new method, is able to accomplish the same goal as GA [39]. GA is inspired by the biological evolutionary process employing Darwin’s theory of survival of the fittest [40]. The optimization of GA begins with random solutions called population strings or chromosomes. Each of the chromosomes (combinations of four genes, X1, X2, X3, and X4) usually is represented as a binary string, which is evaluated by an objective function for their fitness [41]. In this process, GA uses three main types of rules (i.e., selection, crossover, and mutation) to create the new generation from the current population until one chromosome has the best fitness and thus is taken as the best solution to the problem. The values of the GA parameters for population size, number of generations, crossover rate, and mutation probability were 20, 100, 0.8, and 0.01.
PSO was firstly proposed by Kennedy and Eberhart. This metaheuristic method is inspired by the social behavior of birds flocking and fish schooling for searching for food [42]. PSO is started with a swarm of particles randomly positioned in multidimensional search space. Every particle is the solution to the problem, which has two characteristics, namely, velocity and position. These particles have a memory and it is helpful to keep track of its previous best position. The position corresponding to the best fitness is known as personal best and global best. After the completion of each iteration, the position of particles is adjusted based on its own historical behavior and neighbors. The particles continue to move in the search space until the maximum iteration number or the desired value of the objective function was reached. The operating parameters were the swarm size (20), maximum iteration (50), personal learning coefficient (2), global learning coefficient (2), minimum inertia weight (0.3), and maximum inertia weight (0.9).

3. Results and Discussion

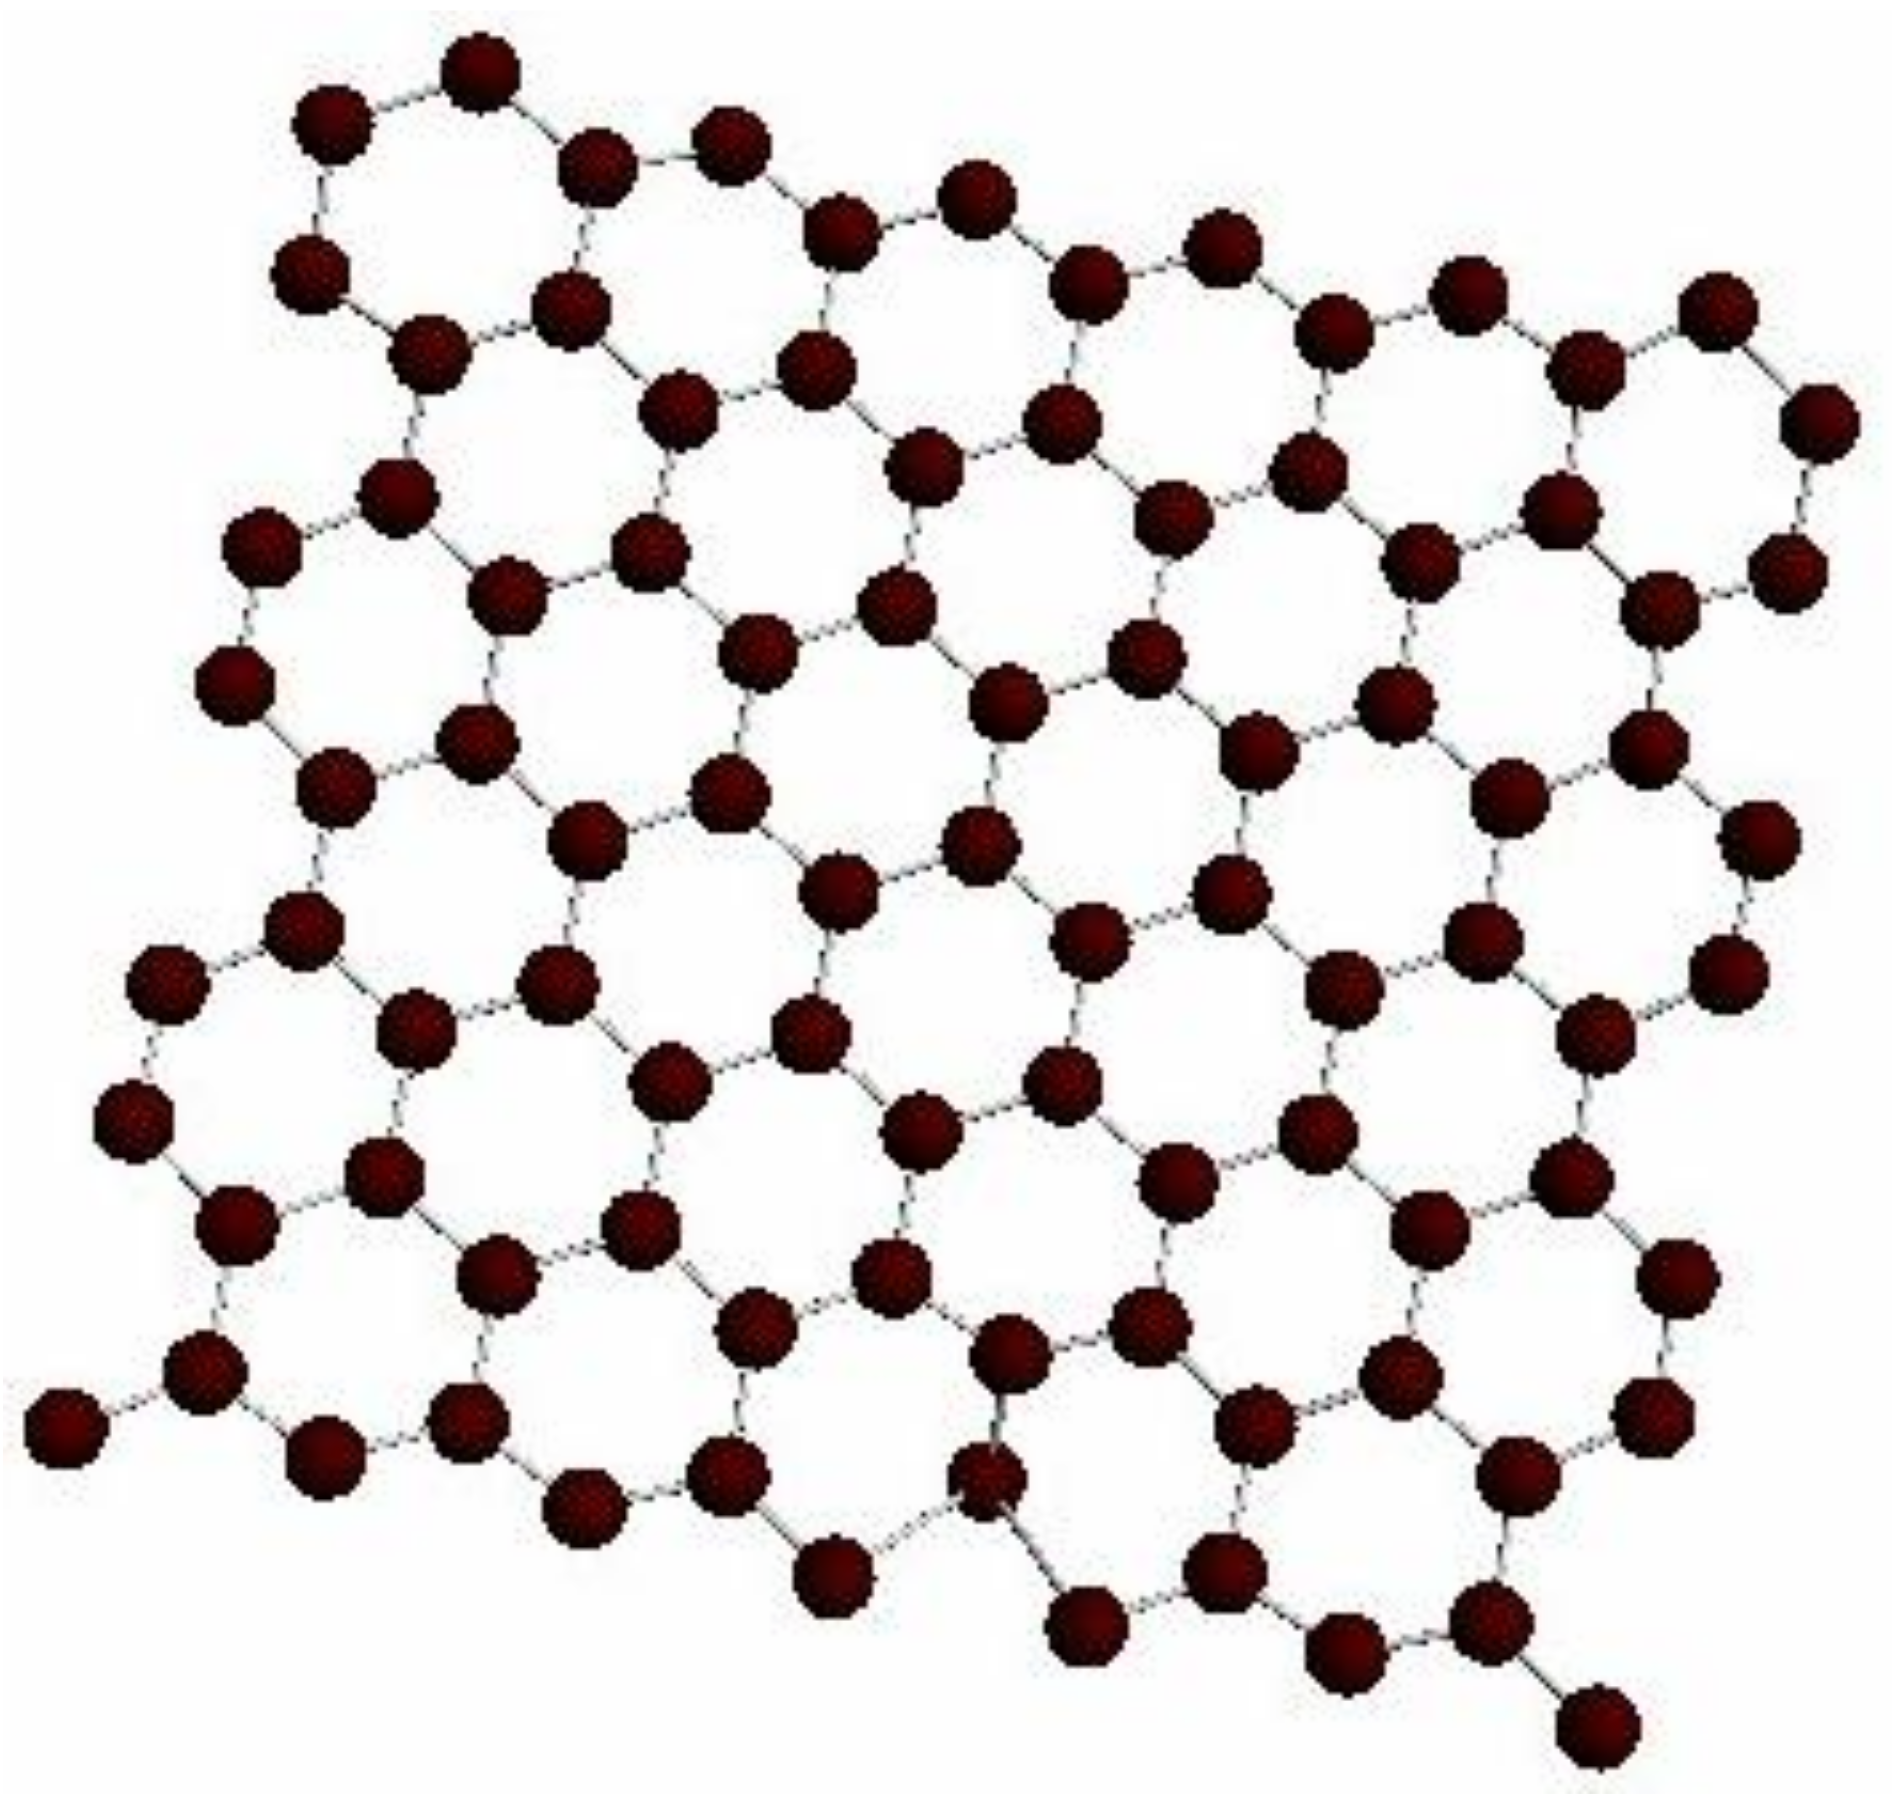
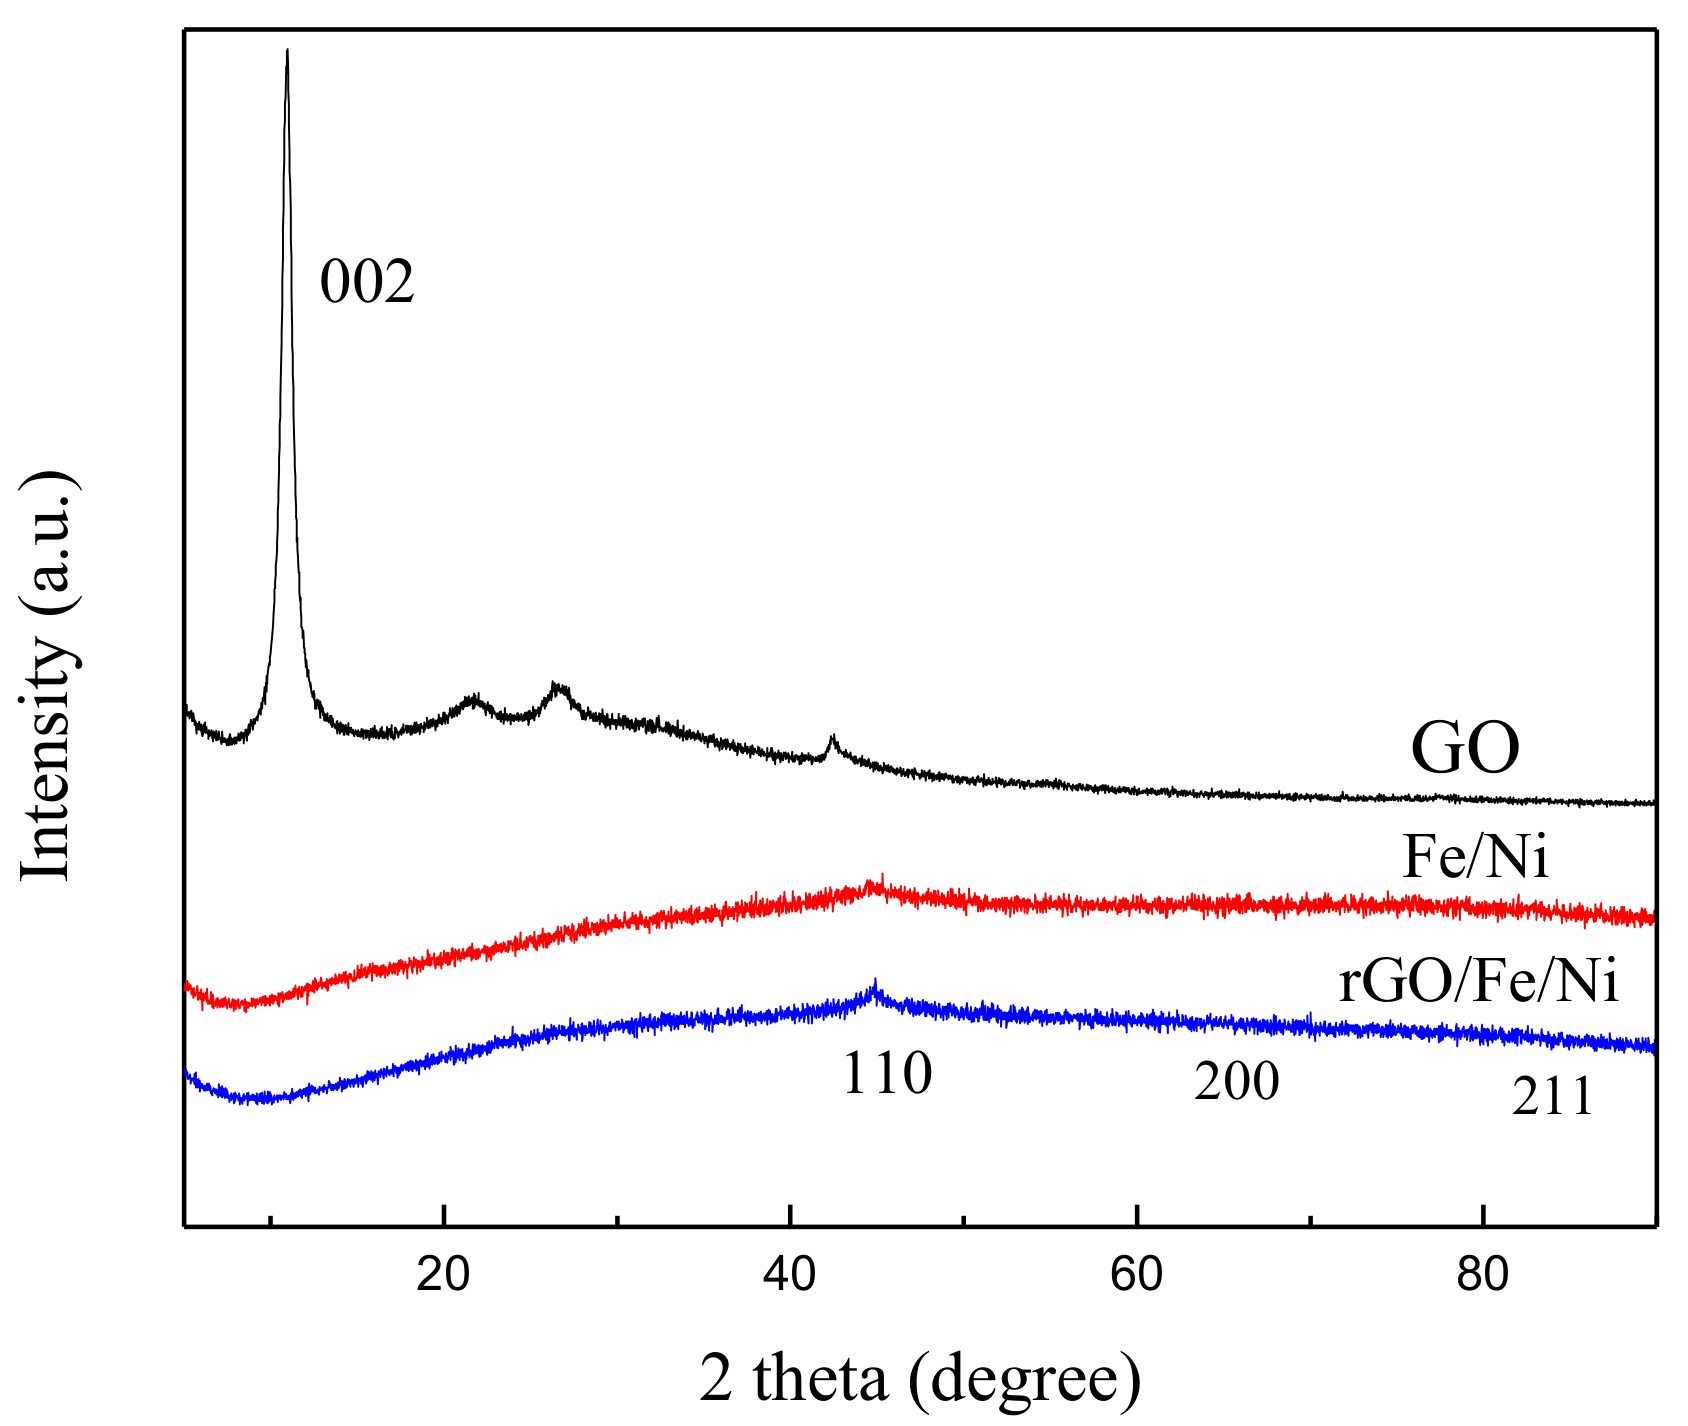
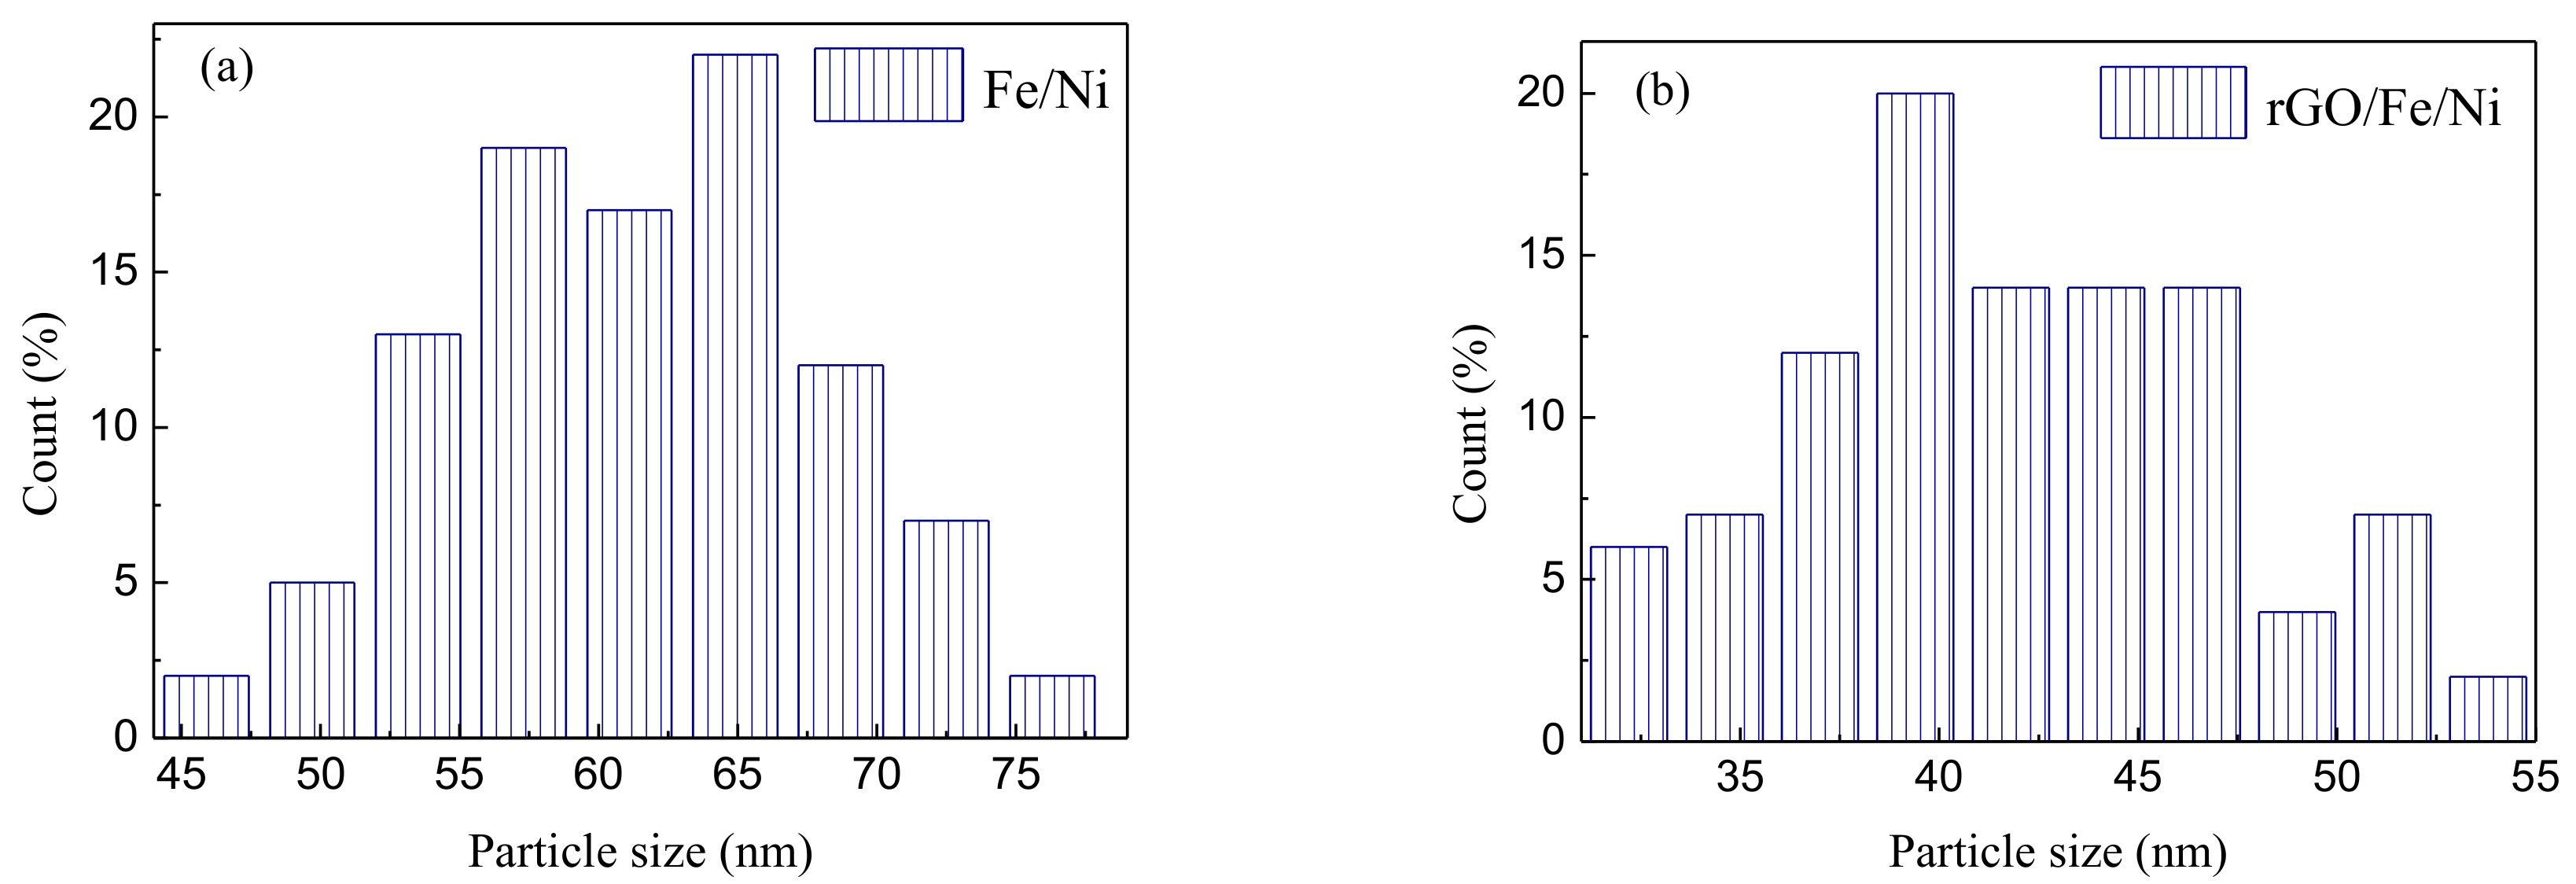
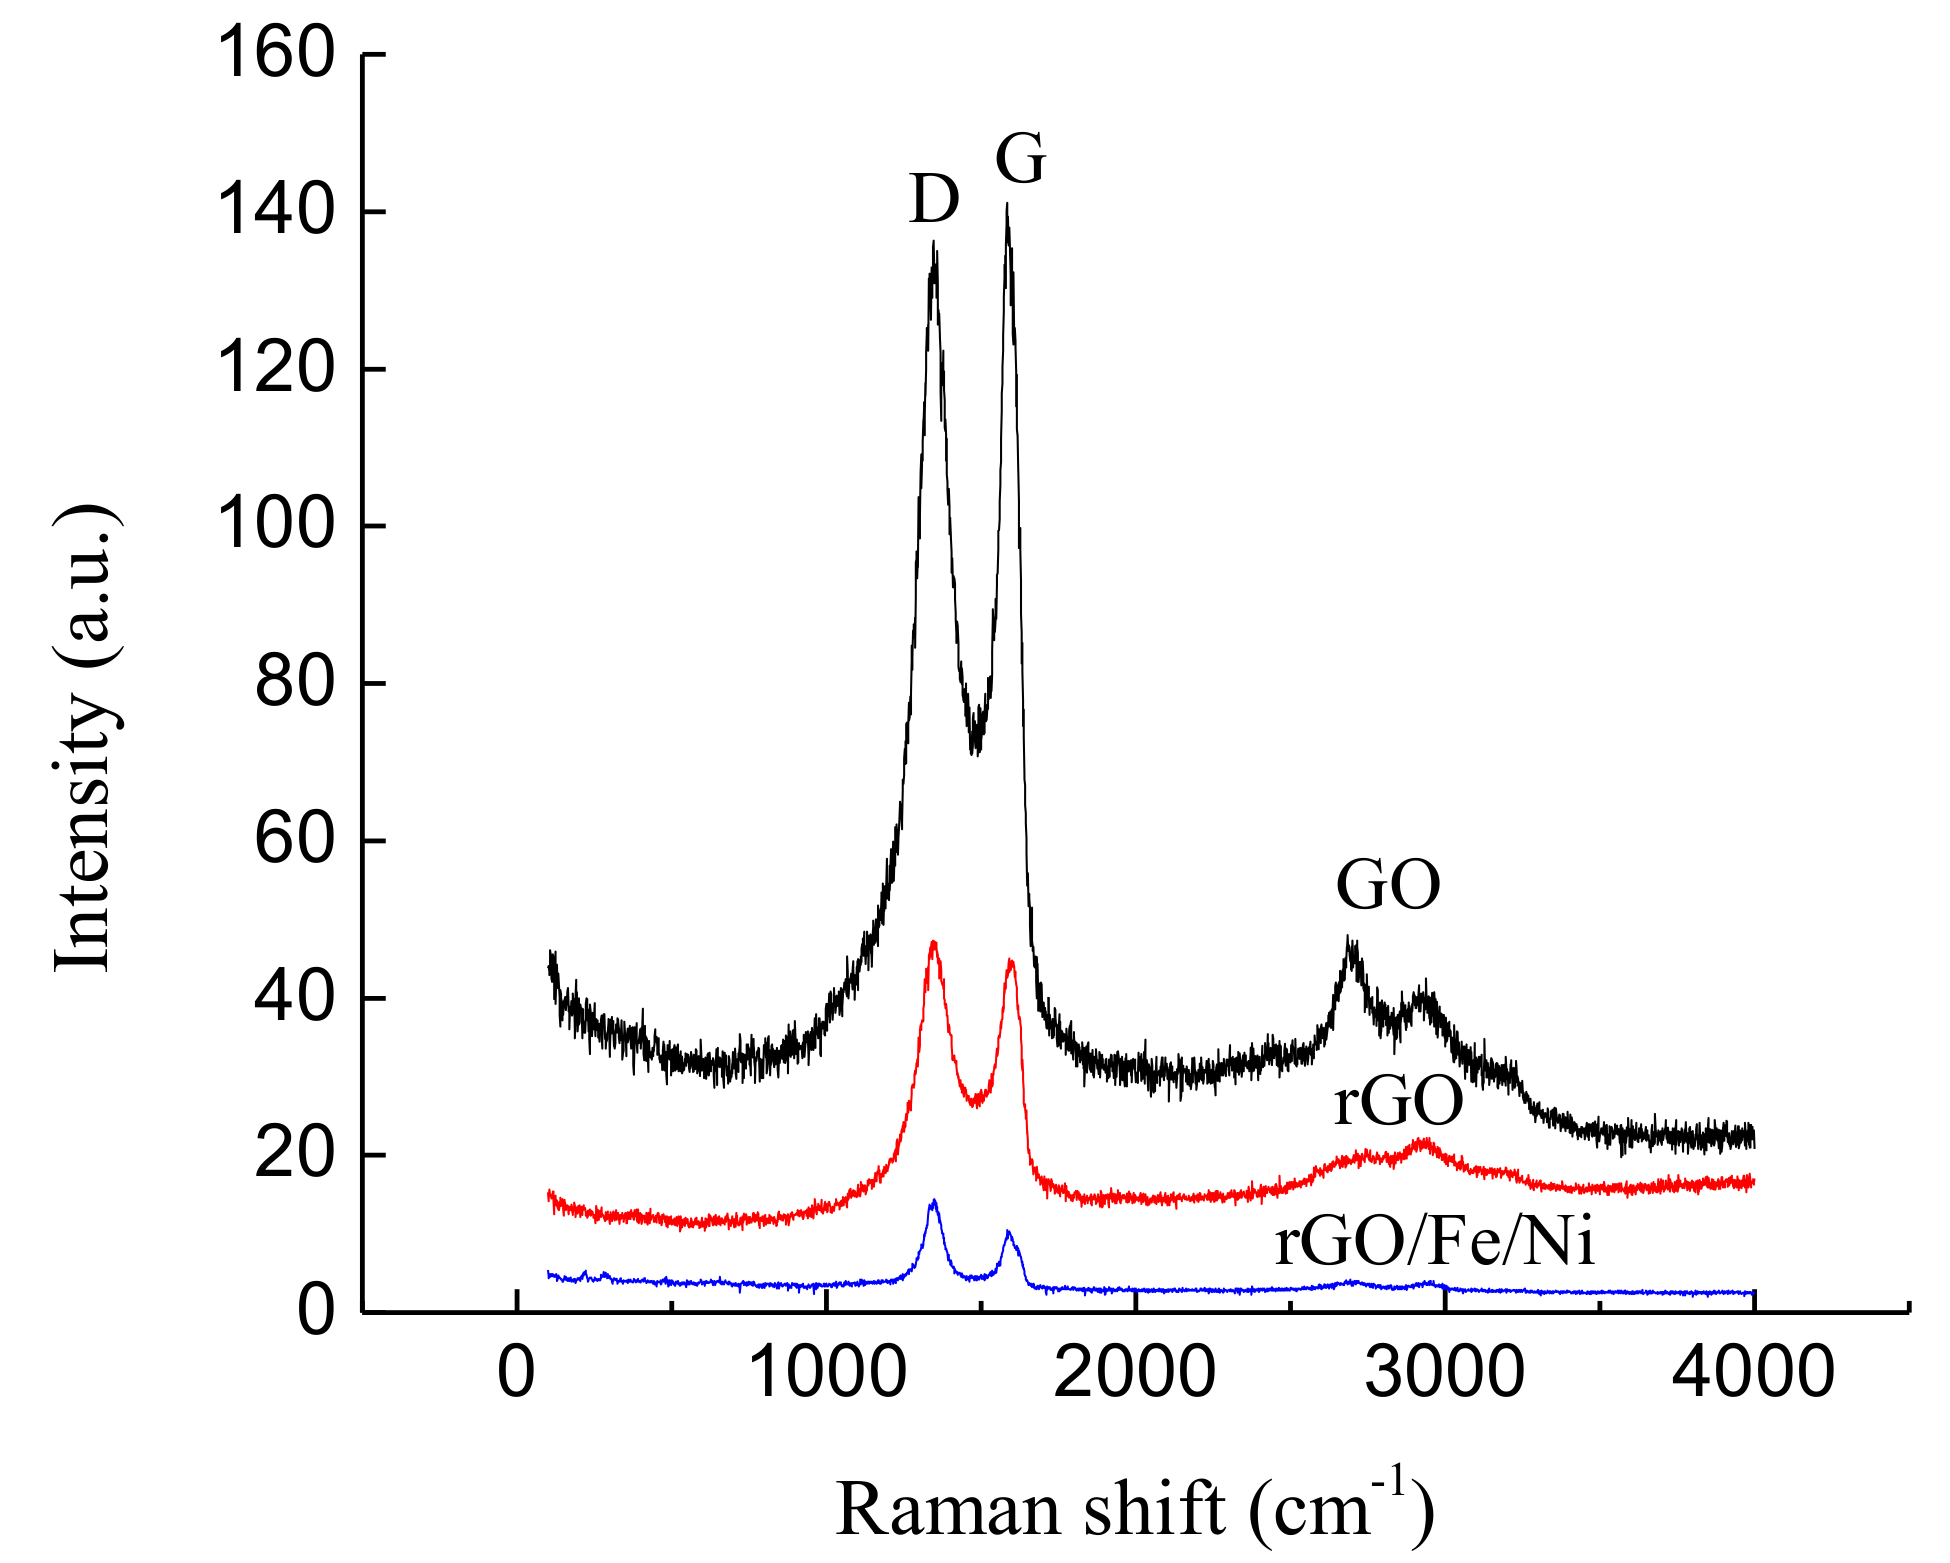
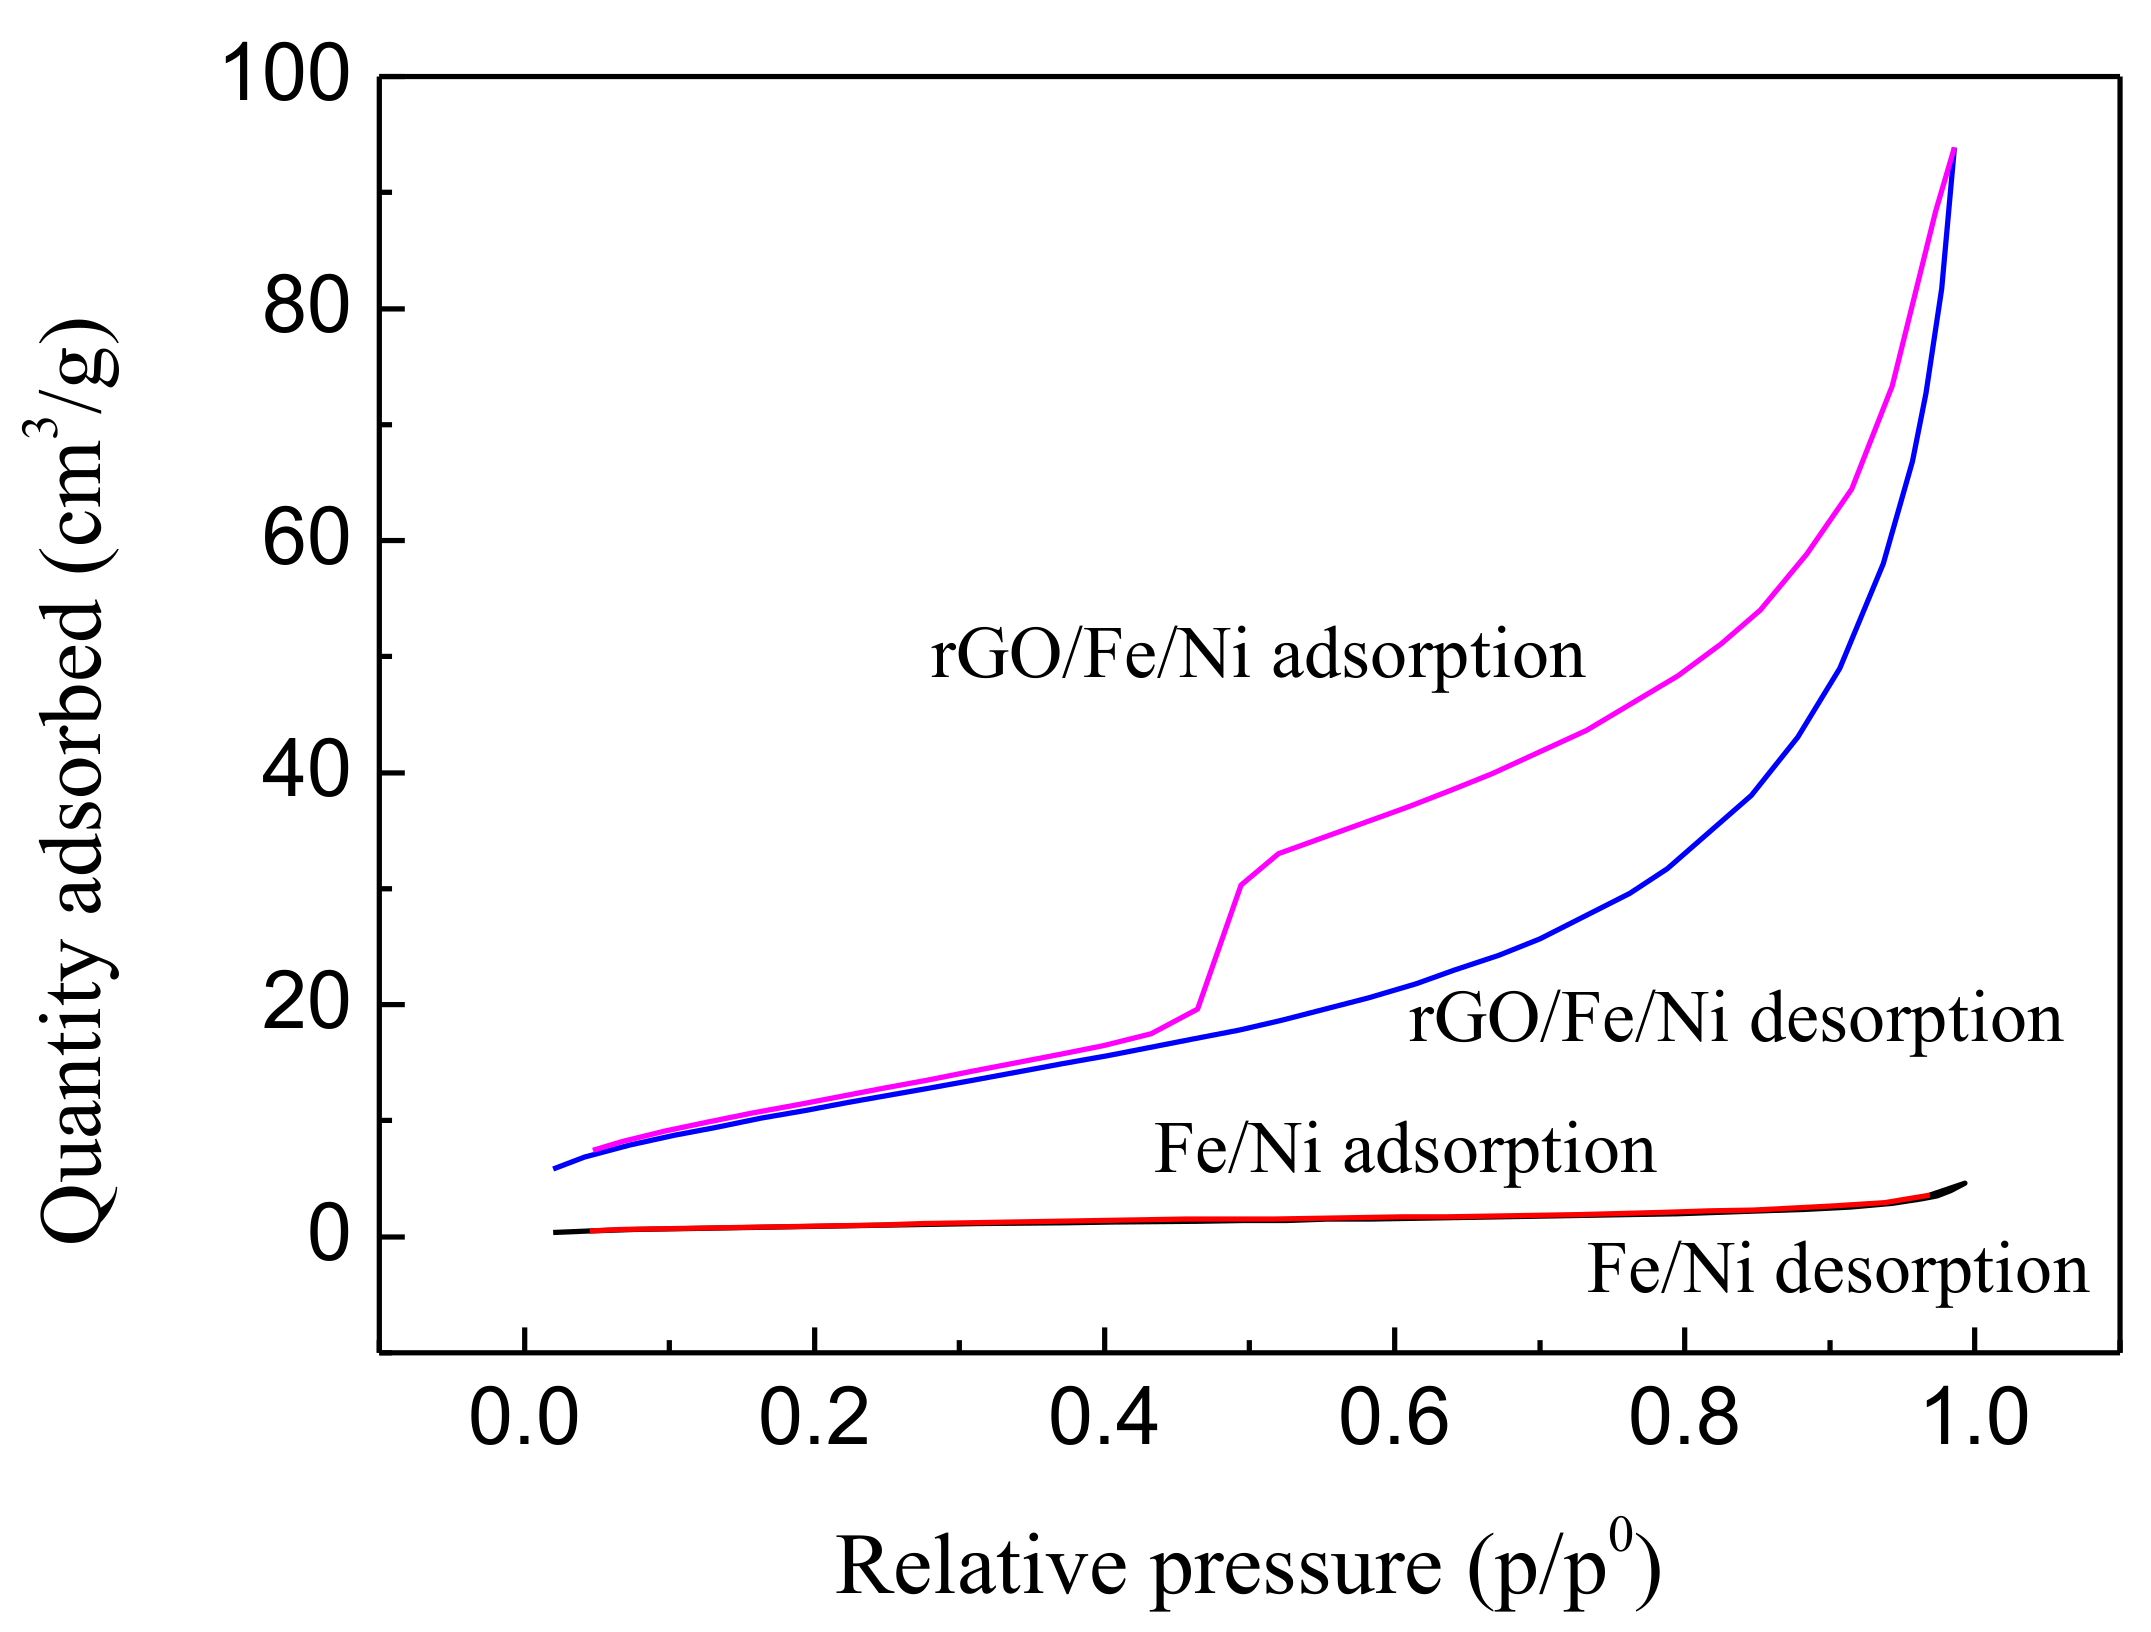
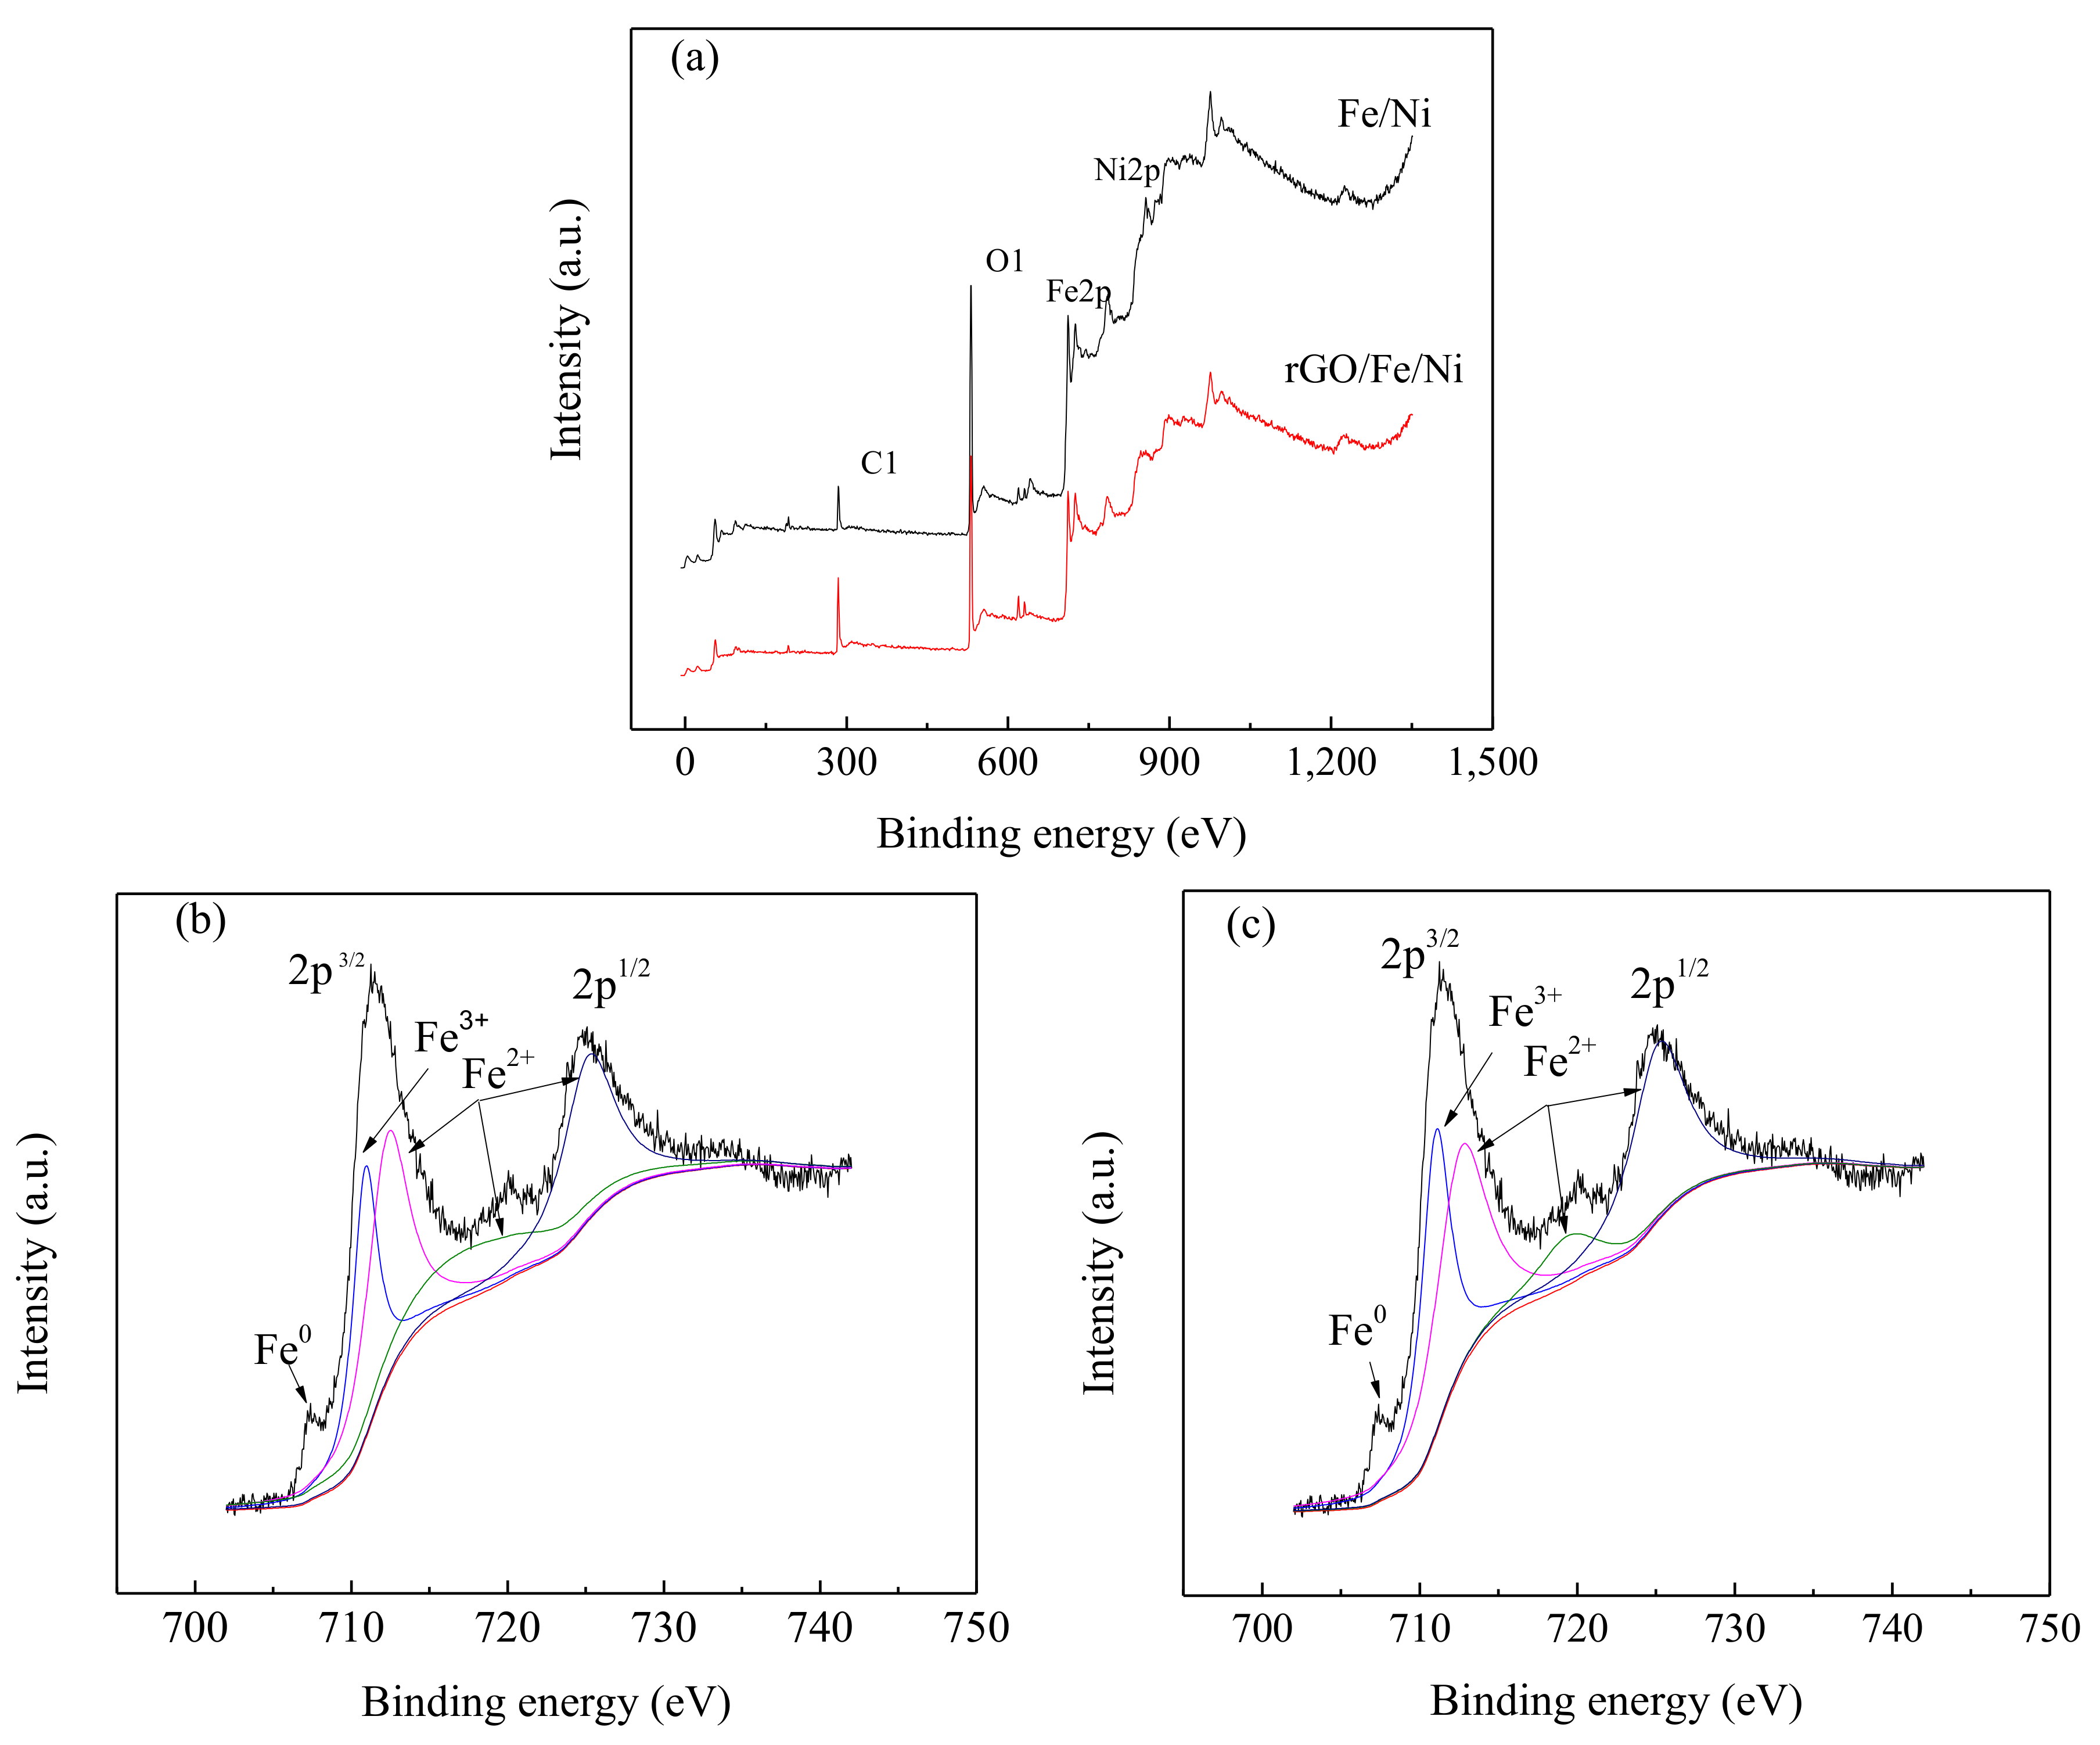
3.1. Characterization of Fe/Ni Nanoparticles and rGO/Fe/Ni Composites

The XRD patterns of the GO, Fe/Ni nanoparticles, and rGO/Fe/Ni composites are shown in Figure 4. The intense diffraction peaks of Fe0 at 2θ 44.4°, 58.7°, and 82.0° are assigned to the (110), (200), and (211) lattice planes, respectively. The prominent peak at 44.4° indicates the presence of Fe0 (JCPDS-00-001-01267) in Fe/Ni nanoparticles and rGO/Fe/Ni composites, which can be assigned to the (110) diffraction plane [43]. The diffraction peak of GO (10.9°, 001) in the pattern of rGO/Fe/Ni composites is not observed, demonstrating the reduction of GO. No diffraction peaks of Ni were observed, because of its low amounts in Fe/Ni nanoparticles and rGO/Fe/Ni composites.
The morphology of Fe/Ni and rGO/Fe/Ni was characterized by using SEM (Figure 5). Fe/Ni nanoparticles aggregated together tightly were observed (Figure 5a). As shown in Figure 5b, the Fe/Ni nanoparticles are homogeneously dispersed well on the rGO surface, which imply an inhibiting effect on the Fe/Ni nanoparticle aggregation. The spectra of EDS also illustrate the presence of Ni as shown in Figure 6a,b. nZVI was synthesized by Wang et al., and the average diameter of this material is 80 nm [44]. In this study, the particle sizes of Fe/Ni nanoparticles and rGO/Fe/Ni composites are 44–81 nm and 26–68 nm in diameter, and the average diameters of Fe/Ni nanoparticles and rGO/Fe/Ni composites are approximately 66 nm and 42 nm, respectively (Figure 7a,b). These results indicate that Ni can effectively prevent the aggregation of nZVI, and the Fe/Ni nanoparticles can be dispersed onto the rGO surface.
Raman spectroscopy can be used as an effective method to identify the degree of graphitization and structural changes in the GO-based nanomaterials. The spectra of the GO, rGO, and rGO/Fe/Ni are shown in Figure 8, which exhibit the characteristic D and G bands centered at 1345 and 1587 cm−1, respectively. The D band is a structural disorder originated from the breathing mode of A1g symmetry, whereas the G band is of E2g symmetry induced by the inplane vibrations of sp2 bond atoms [45]. The intensity ratio of the D to G bands (ID/IG) is often used as a measure of defect levels in graphene-based materials. The intensity of ID/IG increases from 0.98 for GO to 1.07 for rGO and then to 1.38 for rGO/Fe/Ni composites. This phenomenon could be attributed to the decrease in the sp2 cluster size, perhaps caused by the creation of defects owing to the presence of iron atoms on the surface of the rGO.
The surface area of Fe/Ni nanoparticles and rGO/Fe/Ni composites was measured using a BET analyzer, and the surface area of these materials was calculated to be 3.70 and 43.31 m2/g (Figure 9). It is noted that the surface area of rGO/Fe/Ni composites is significantly higher than that of Fe/Ni nanoparticles. This is attributed to the satisfactory dispersion of Fe/Ni on the surface of rGO.
The results of X-ray photoelectron spectroscopy (XPS) show that the binding energies at 284.6, 554.6, 720.6, and 860.8 eV are attributed to C1s, O1s, Fe2p, and Ni2p, respectively (Figure 10a). The Fe2p spectra consist of 2p1/2 and 2p3/2 peaks, which are located at 710.55 and 725.37 eV. The binding energies of the shake-up satellite (2p3/2 and 2p1/2) at 719.94 eV and 724.88 eV indicate the existence of Fe2+ and Fe3+ [45]. A weak peak at 707.5 eV corresponding to Fe0 was observed in both the Fe/Ni and rGO/Fe/Ni (Figure 10b,c). The intensity of the Fe0 peak in the rGO/Fe/Ni is stronger than that of the Fe/Ni particles, indicating that rGO might decrease the oxidation degree of Fe/Ni.

3.2. The Zero Point of Charge of rGO/Fe/Ni Composites

The behavior of CV adsorption on rGO/Fe/Ni composites was studied over a broad range of pH (2–10). It is worth noting that an obvious increase in the removal efficiency of CV by rGO/Fe/Ni composites was observed with the increase in pH of the solution (Figure 11a). The pHzpc value of this material is 3.5 (Figure 11b). For pH > pHzpc, the rGO/Fe/Ni composite surface will possess negative charge, which is in favor of the adsorption of CV [46,47]. For pH < pHzpc, this material’s surface is charged positively [48]. These results are in accordance with the effect of pH on the removal efficiency of CV.

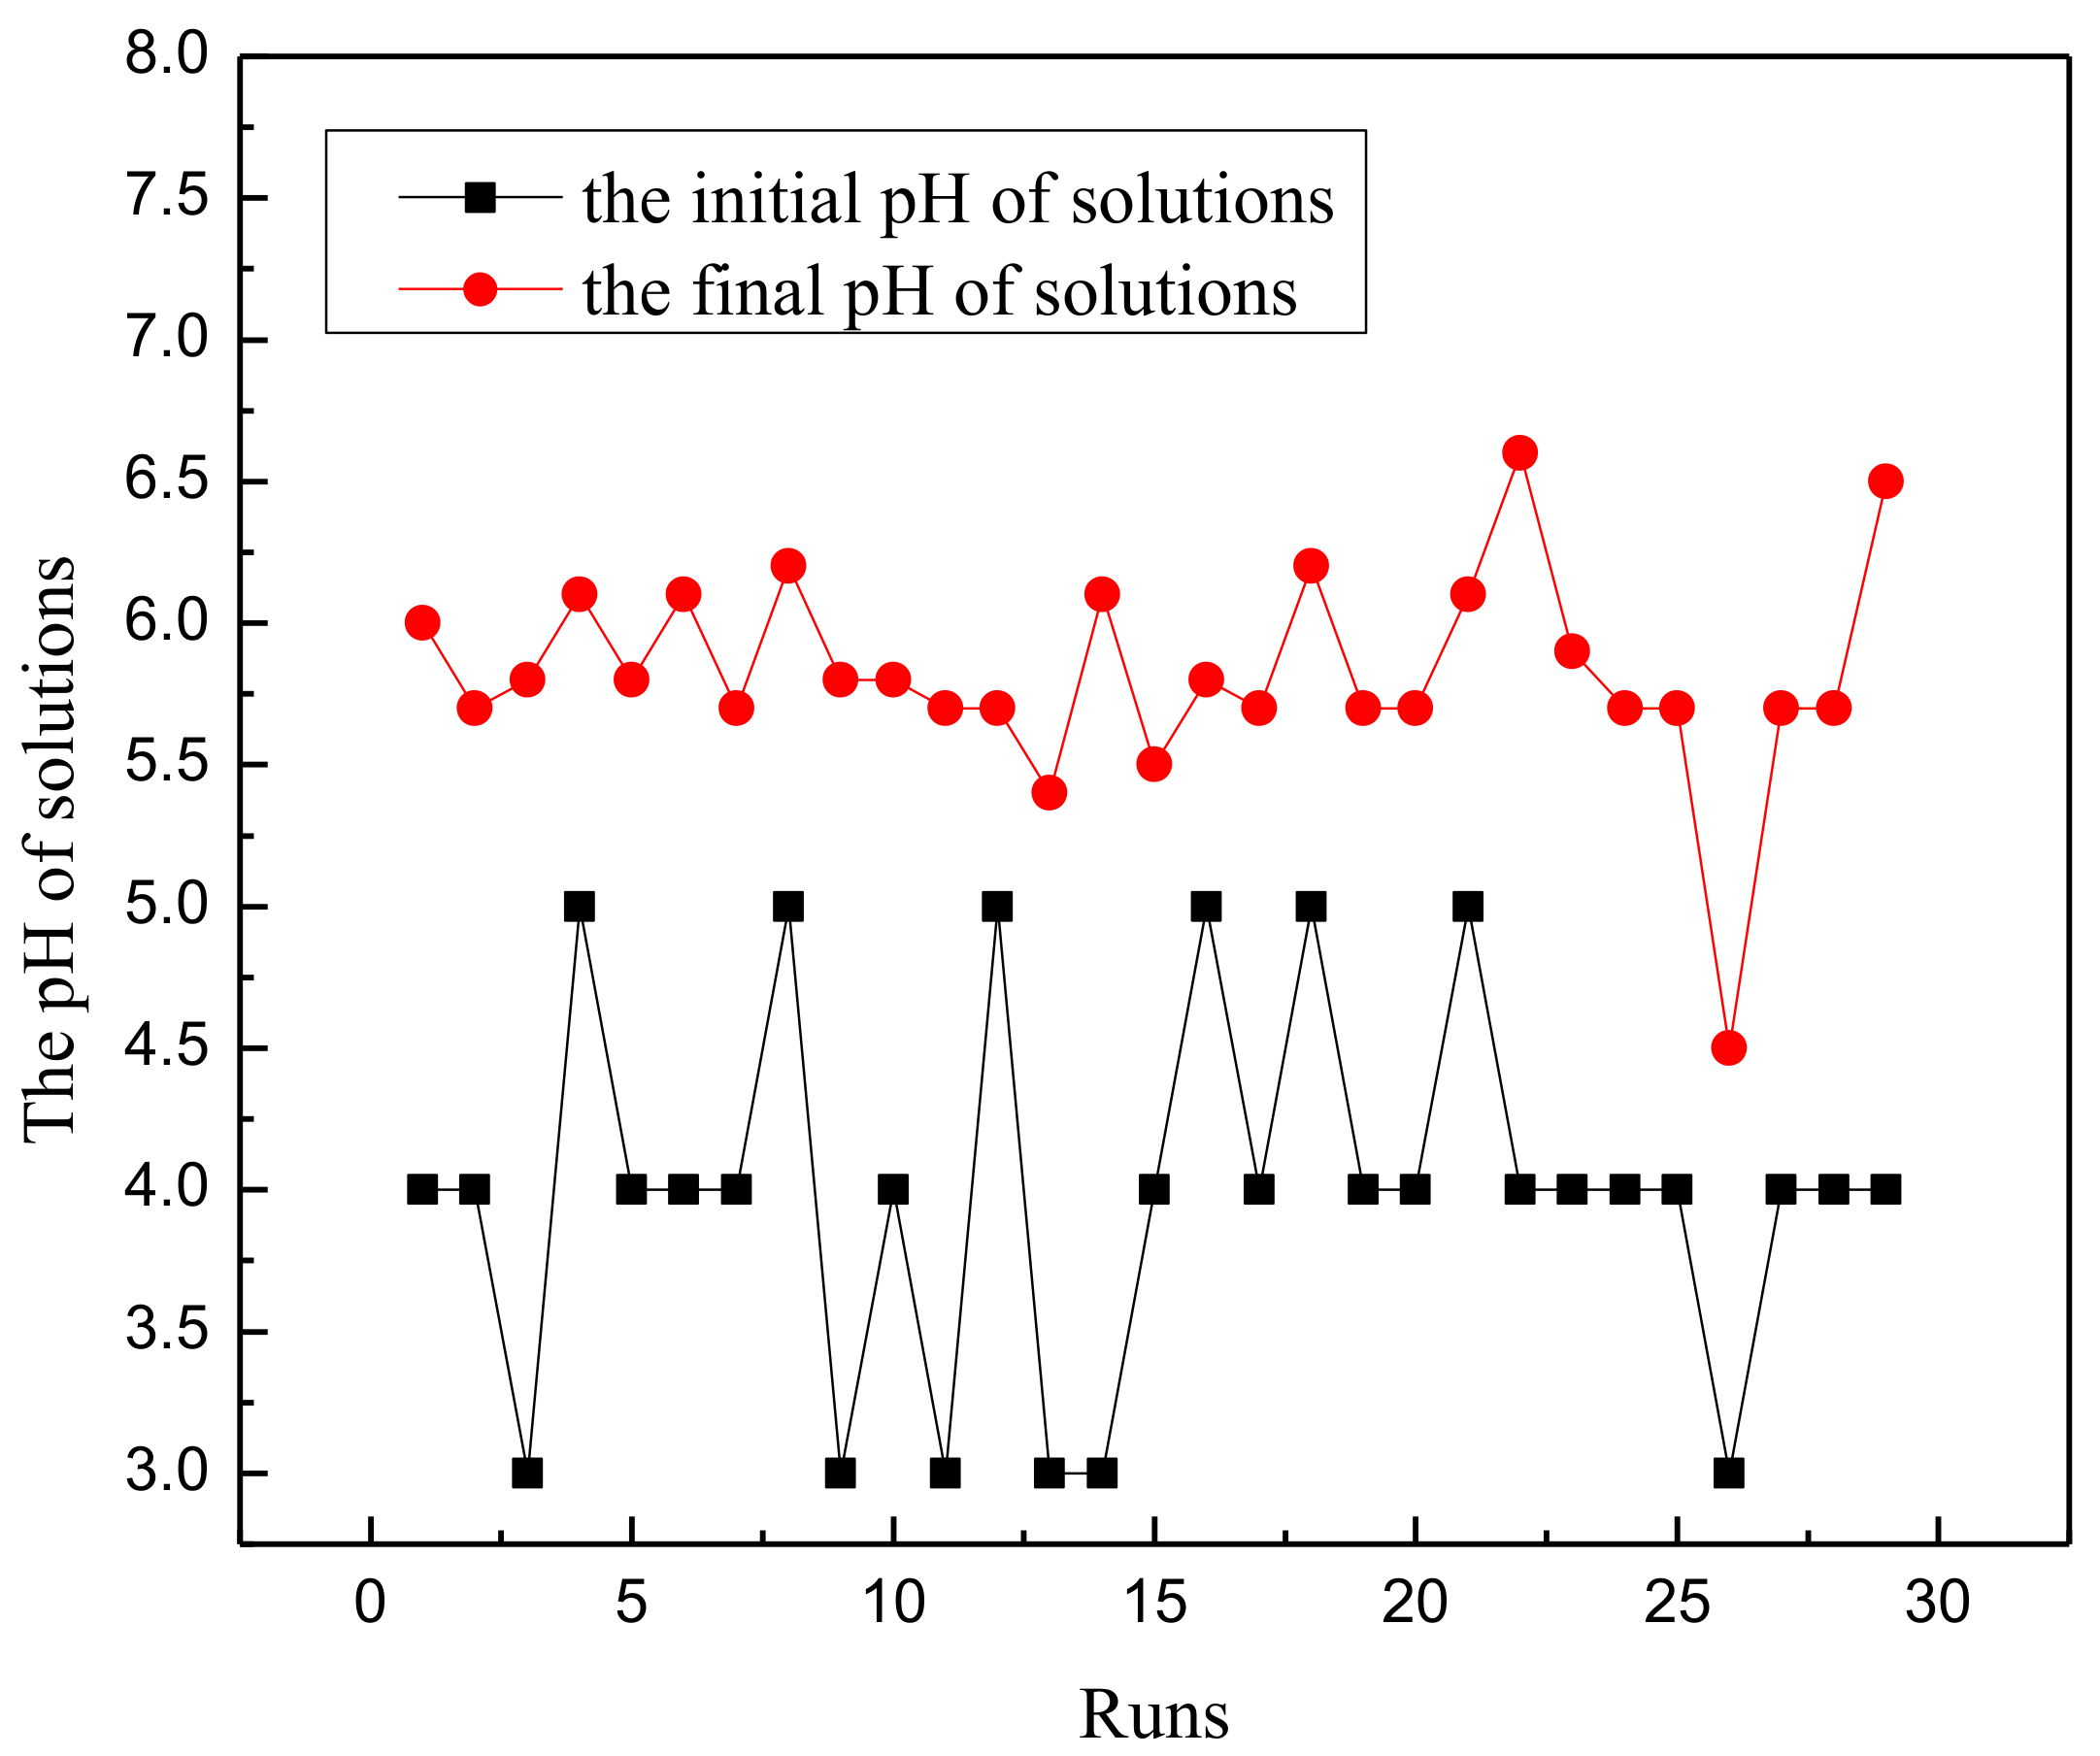
3.3. Experimental Results
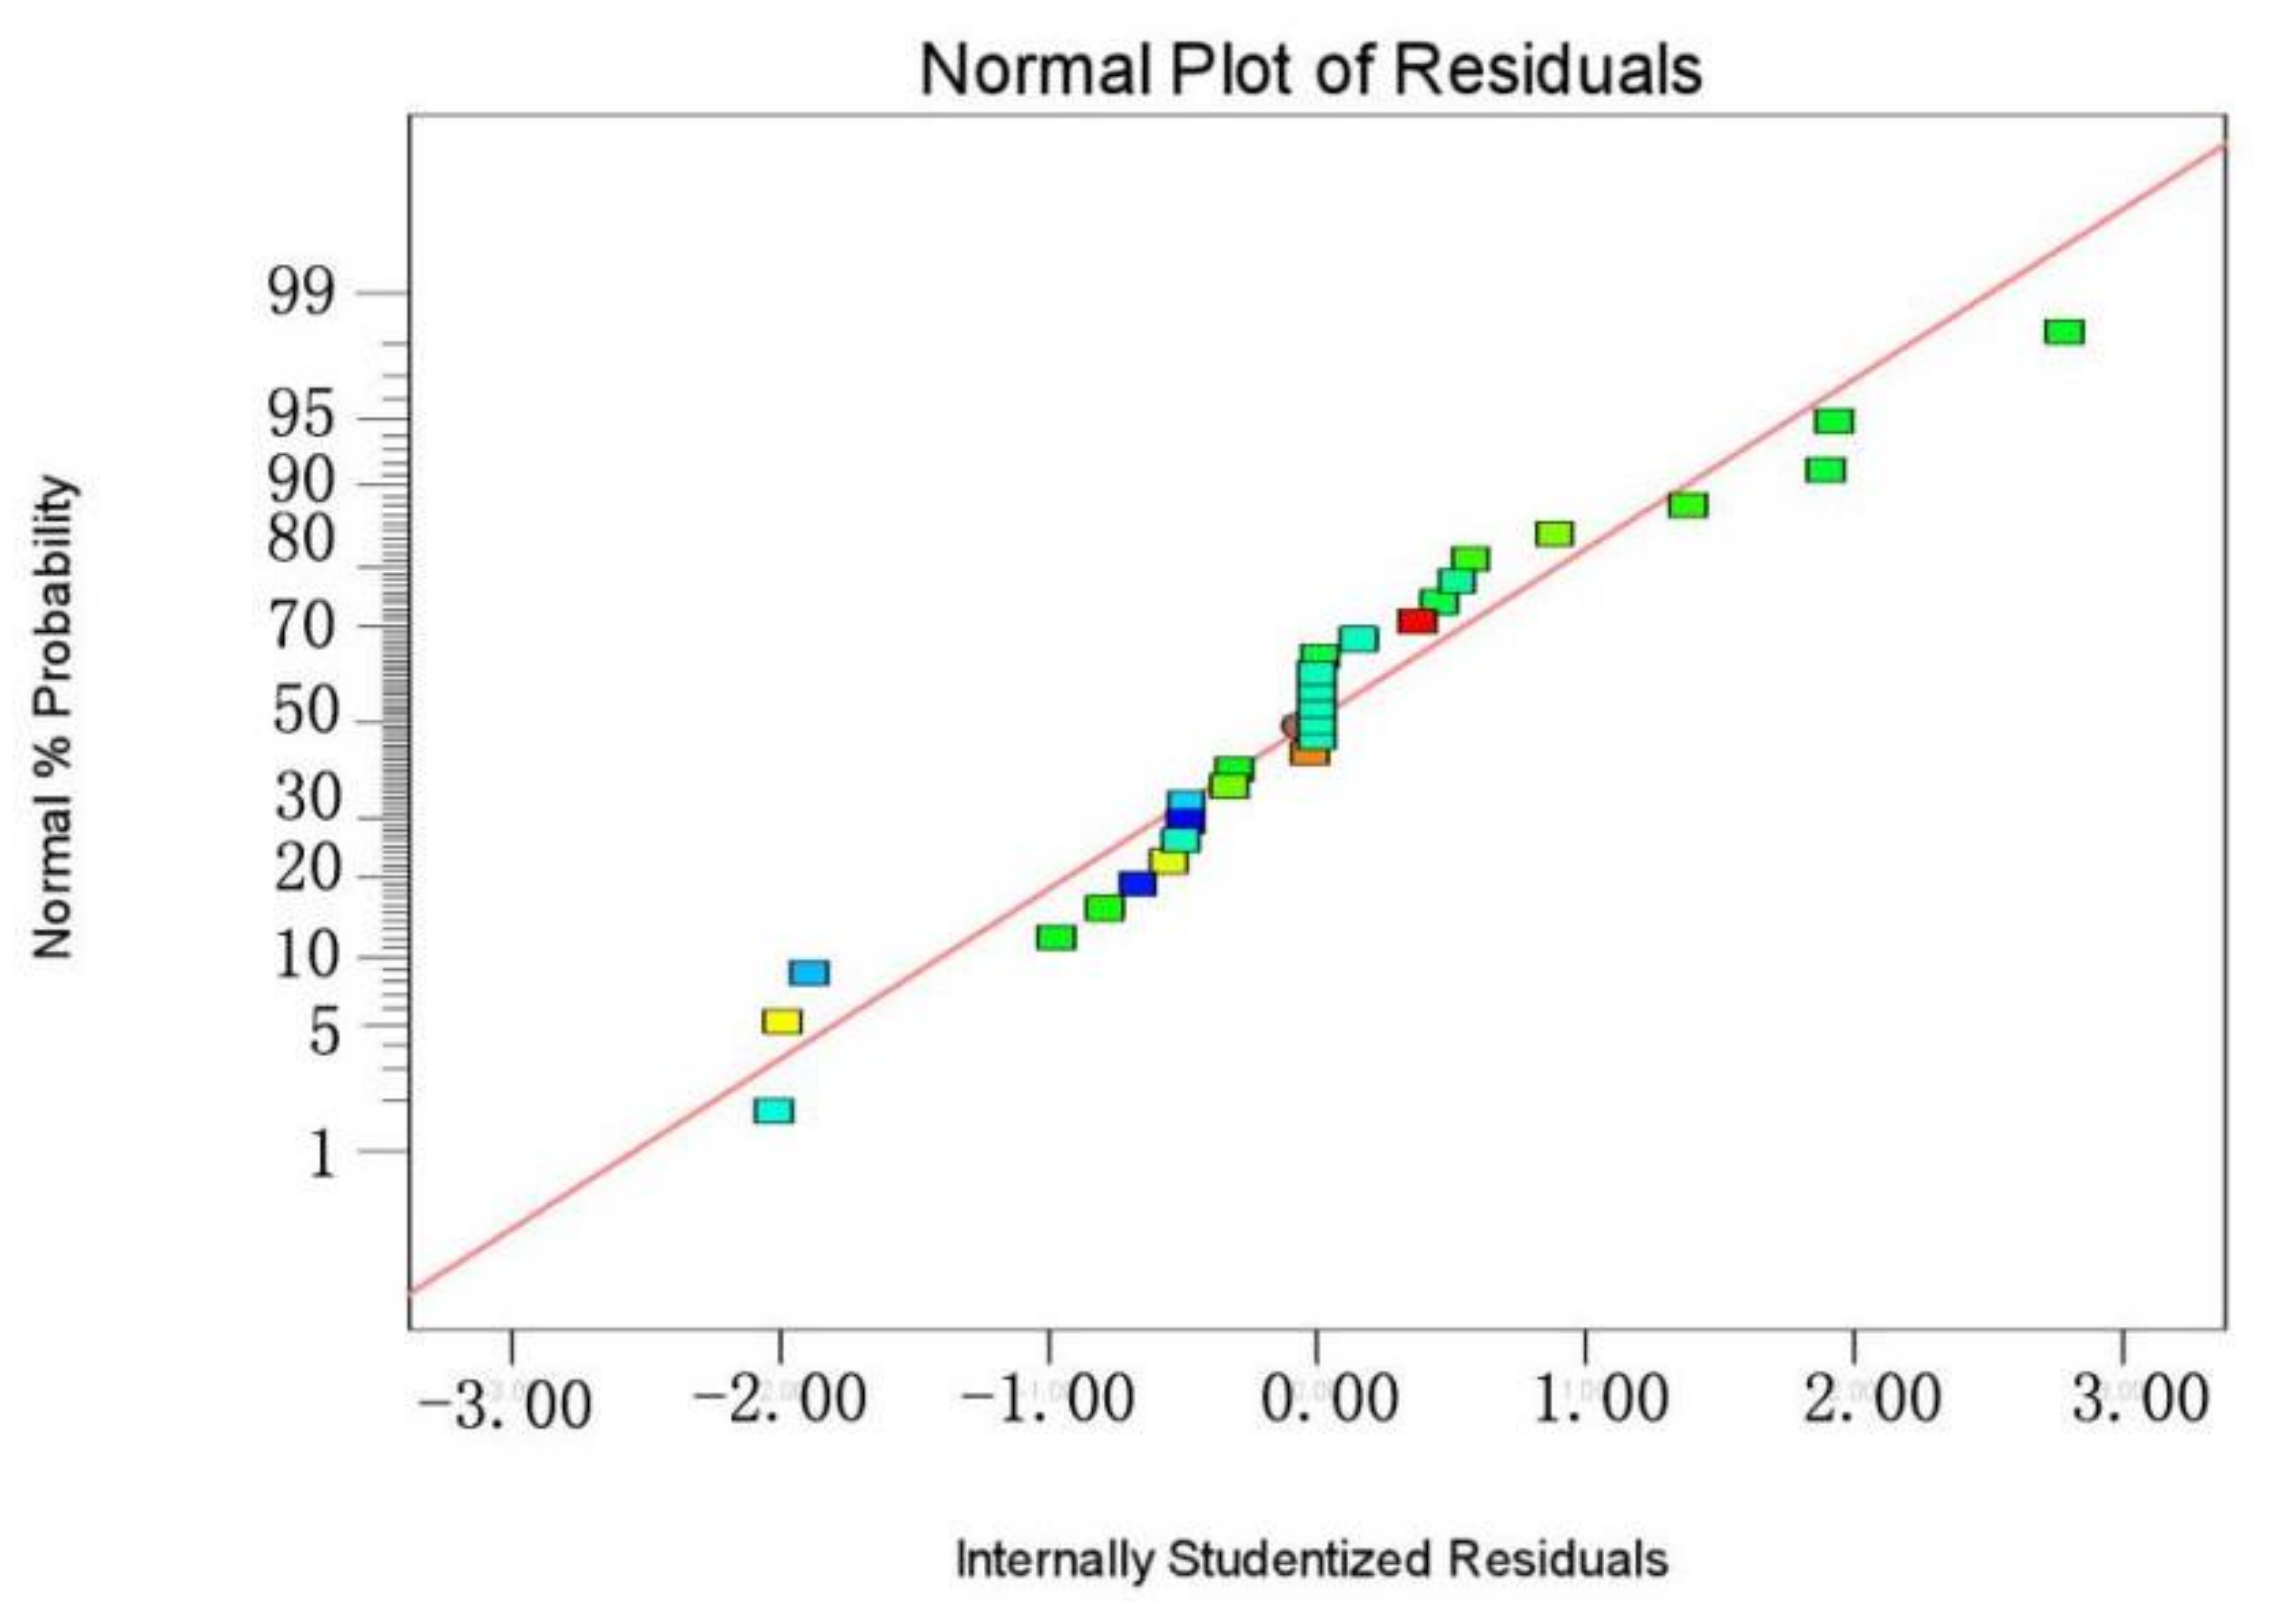
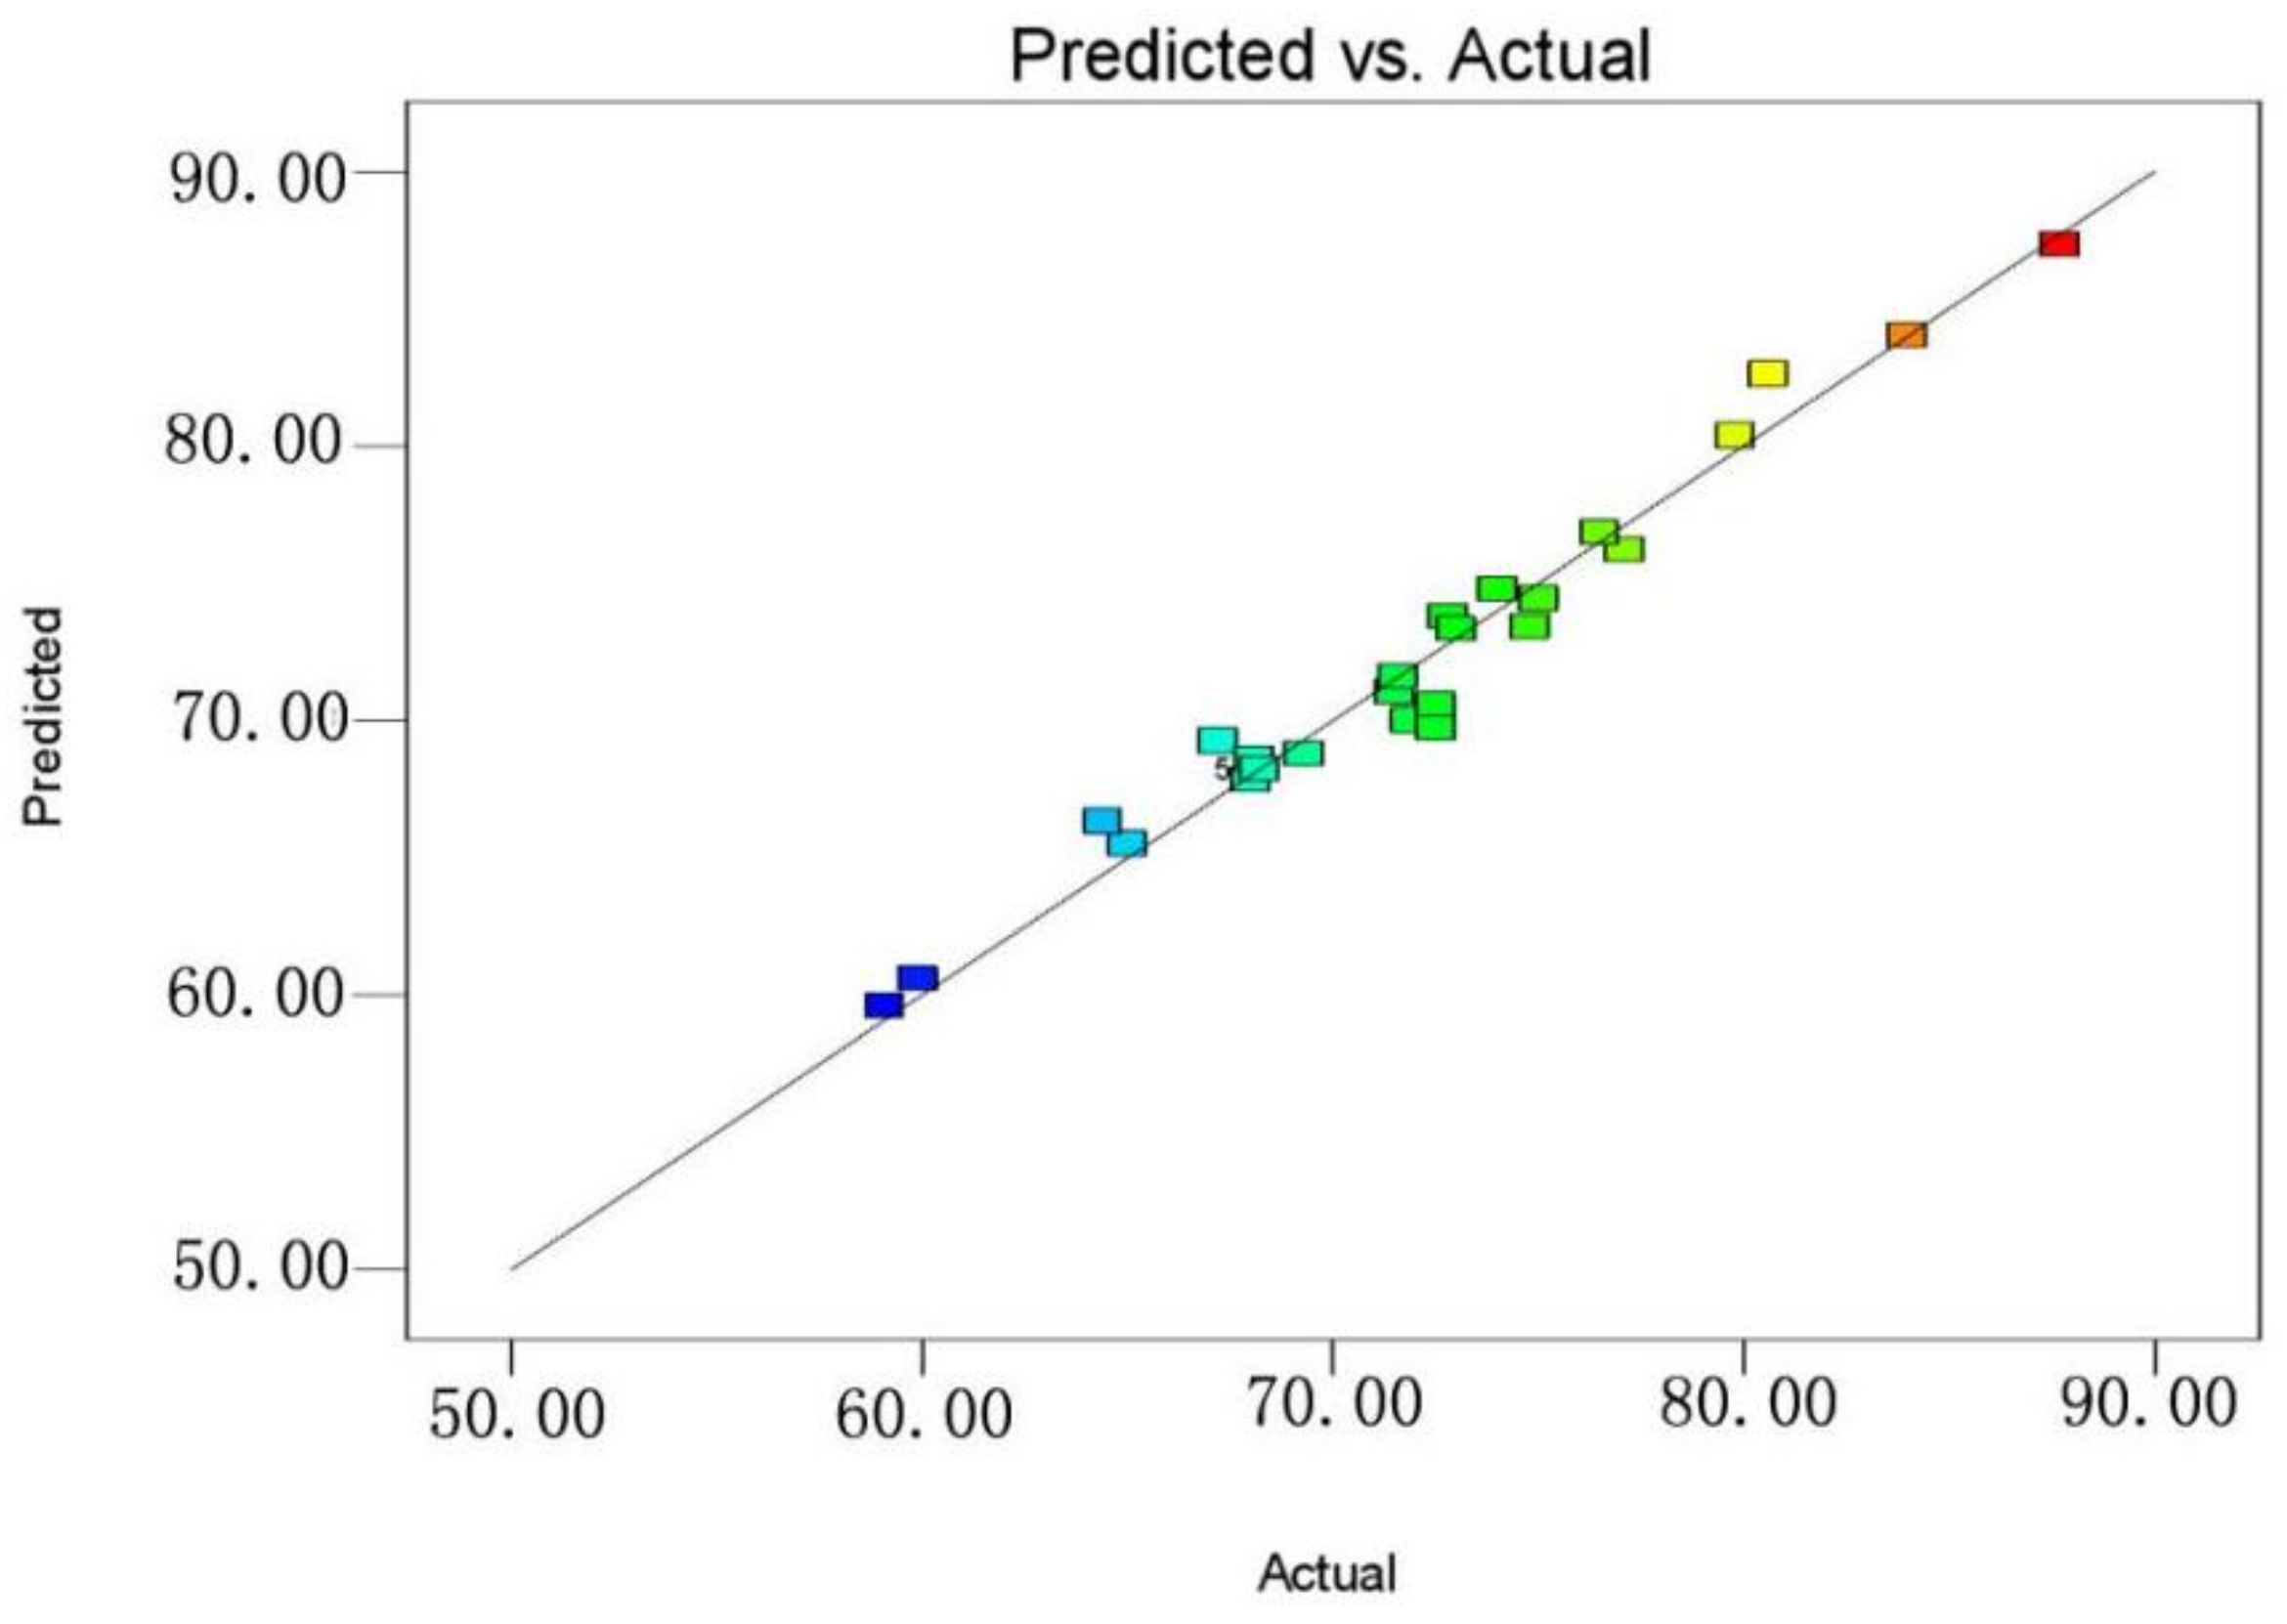
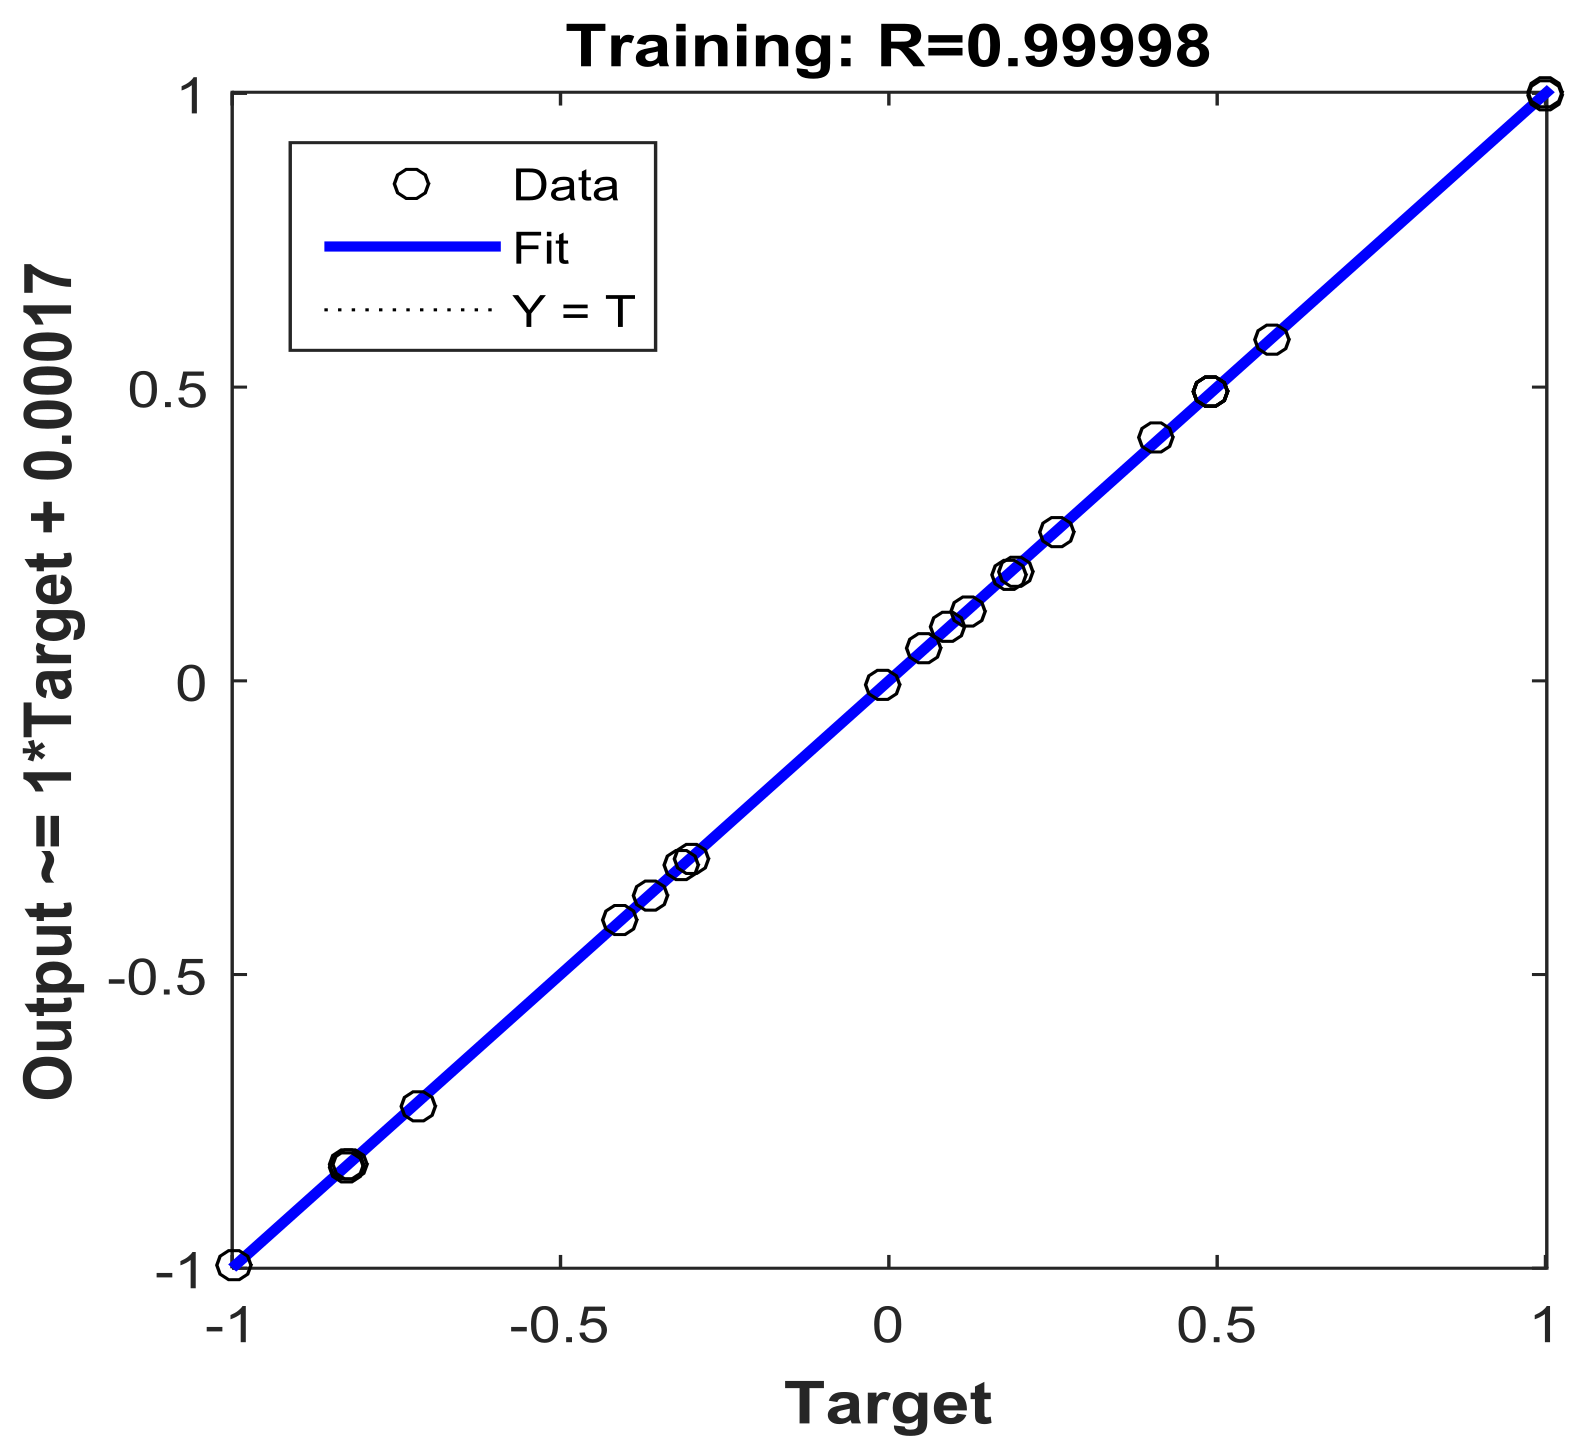
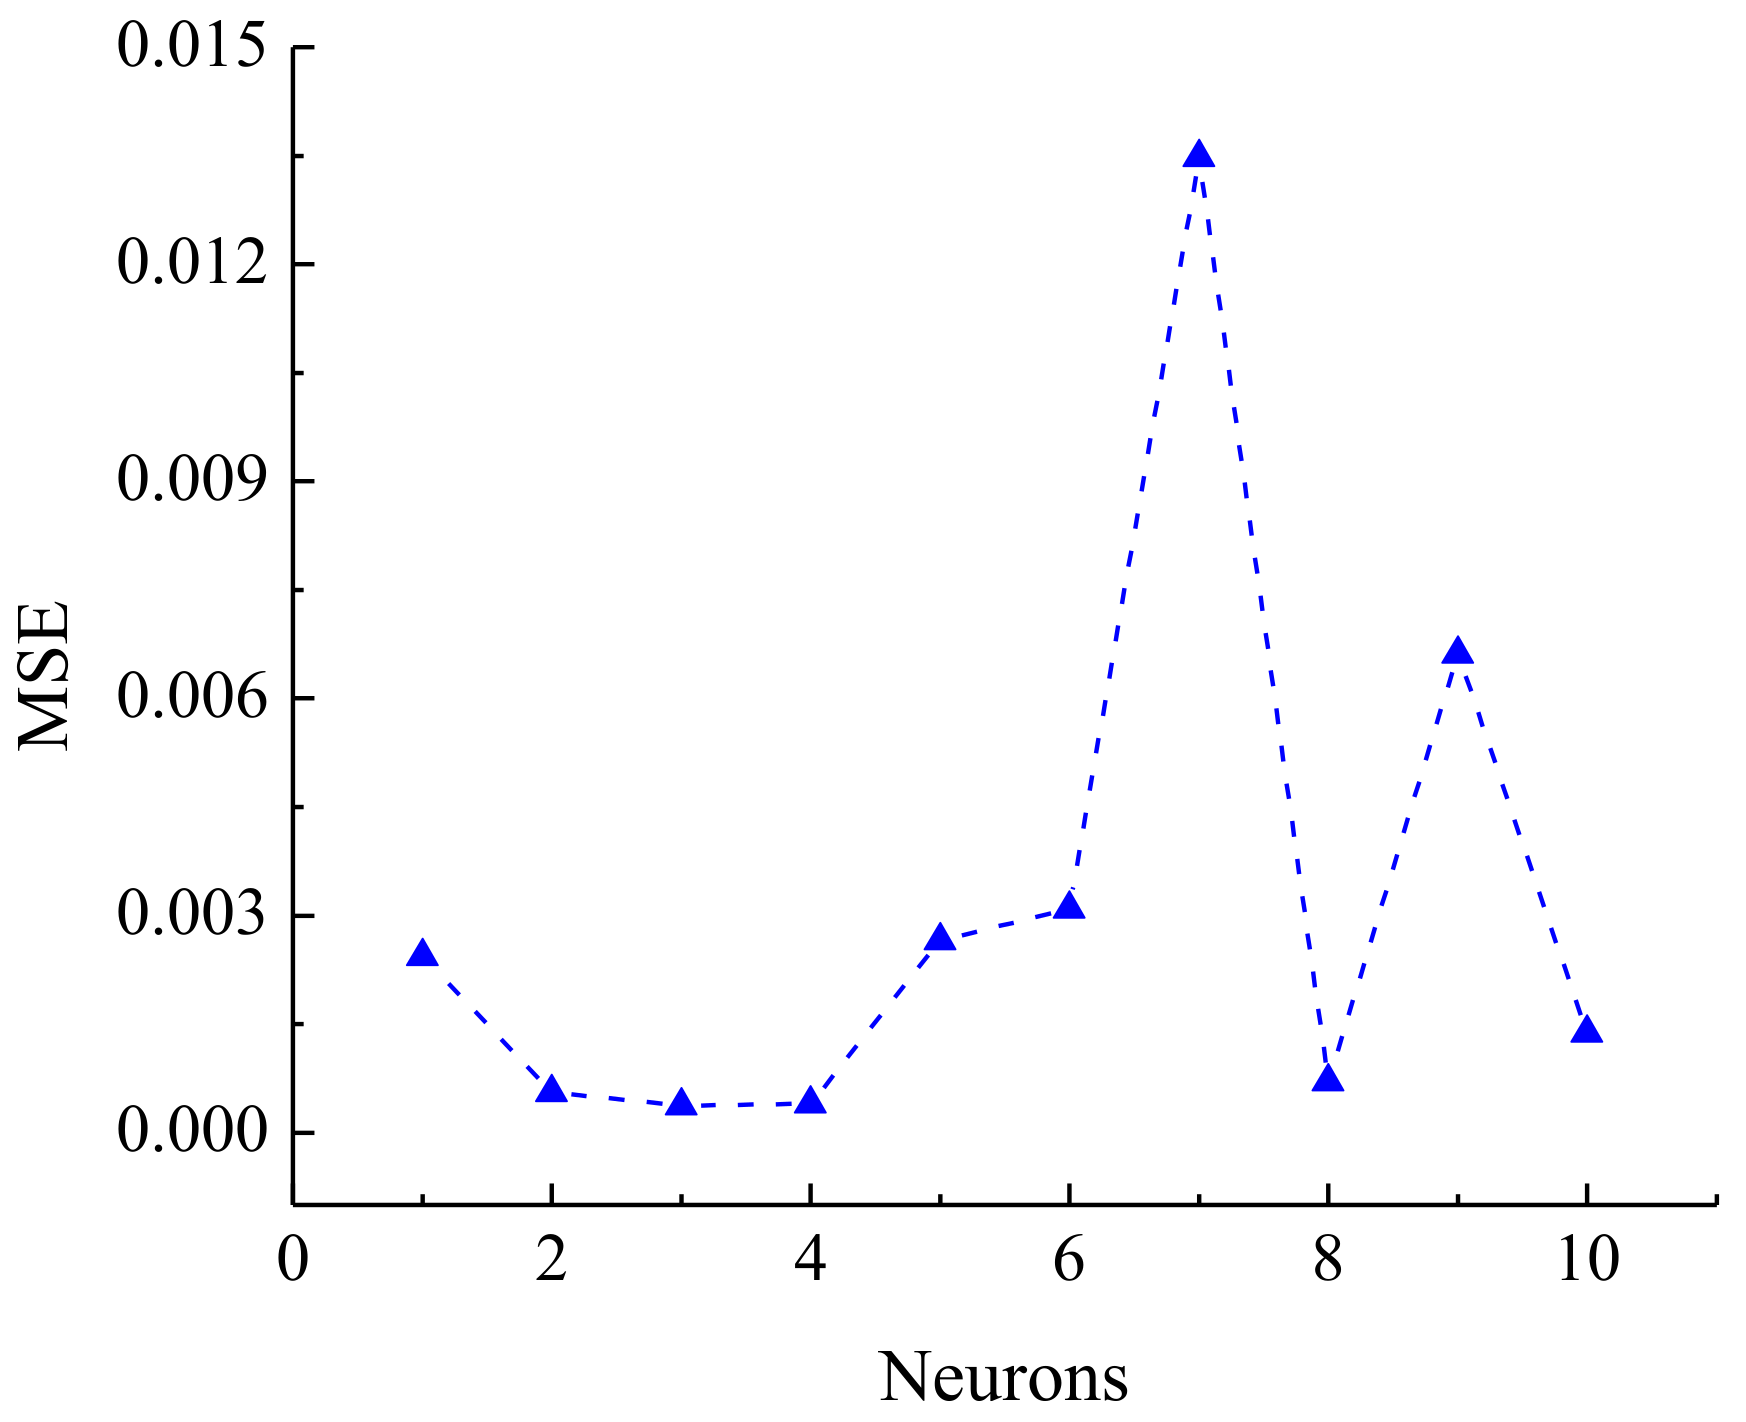
The BBD of RSM was applied to visualize the effect of various independent parameters, namely, initial pH, temperature, contact time, and initial concentration, on the dependent parameter (removal efficiency of CV). Experimental data and predicted values for the removal of CV from aqueous solution are listed in Table 3. A multivariate analysis was performed to describe the relationship between dependent parameters and independent parameters; the fitted model equation is shown as follows.
Y = 68.20 0.82 X 1 5.48 X 2 + 3.79 X 3 + 3.13 X 4 + 0.3 X 1 X 2 4.30 X 1 X 3 + 2.22 X 1 X 4 5.02 X 2 X 3 + 1.37 X 2 X 4 1.20 X 3 X 4 + 4.94 X 1 2 + 2.85 X 2 2 + 1.97 X 3 2 1.47 X 4 2
The plot of normal probabilities versus the residual values shows that the points of residuals on the plot follow a straight line, confirming the normality of the error distribution (Figure 12). The value of the determination coefficient (R2 = 0.9701) demonstrates that the predicted values were in agreement with experimental values (Figure 13). Three-dimensional response surface plots (a, b, c, d, e, and f) indicate the combined effect of initial pH and initial concentration, contact time and initial concentration, temperature and initial concentration, contact time and initial pH, temperature and initial pH, and temperature and contact time. It is evident that the maximum removal efficiency was recorded at high pH and low initial concentration (Figure 14). As shown in Figure 15, the value of final pH is higher than that of initial pH. This may be ascribed to the increased negative charge on the surface of rGO/Fe/Ni composites. Since the pHzpc of rGO/Fe/Ni composites is 3.5, the adsorption of CV was also enhanced when pH > pHzpc.
Analysis of variance (ANOVA) was applied to examine the quality of the fitted model. If the values of p are less than 0.05, then the model terms have a statistically significant role on the CV removal (Table 4). Therefore, it can be concluded that the variables X2, X3, X4, X1X3, X2X3, and X12 are all statistically significant model terms. The F values represent the significance of operating parameters on the CV removal by rGO/Fe/Ni composites, based on which the order for the importance of operating parameters is as follows: X2 > X3 > X4 > X1. This model has a good suitability due to its high F-values and nonsignificant lack of fit.

3.4. BP-ANN Model

The experimental data used in the BP-ANN model were collected in this study from BBD. Of the whole data set, 80% (1–24) was used for training and 20% (25–29) was used for testing (Table 5). The value of R2 (0.9998) of the BP-ANN model indicates the best prediction ability for testing and training in this network (Figure 16). The number of neurons (N) in the hidden layer was determined according to the minimum mean square error (MSE) of the neural network. In order to determine the optimum number of neurons in the hidden layer, the number of nodes was examined by varying from 1 to 10. The values of MSE were used as the error function (Figure 17). As can be seen in Figure 18, the ANN architecture with 3 neurons in the hidden layer appeared to be the optimal topology for training. The influence for each input variable on the output variable was calculated by the Garson equation using the weight and bias (Table 6). It was reported that temperature gives the highest percentage contribution to the decolorization of CV with 36.27% followed by 20.23% of initial concentration, 35.95% of initial pH, and 7.54% of contact time (Table 7).

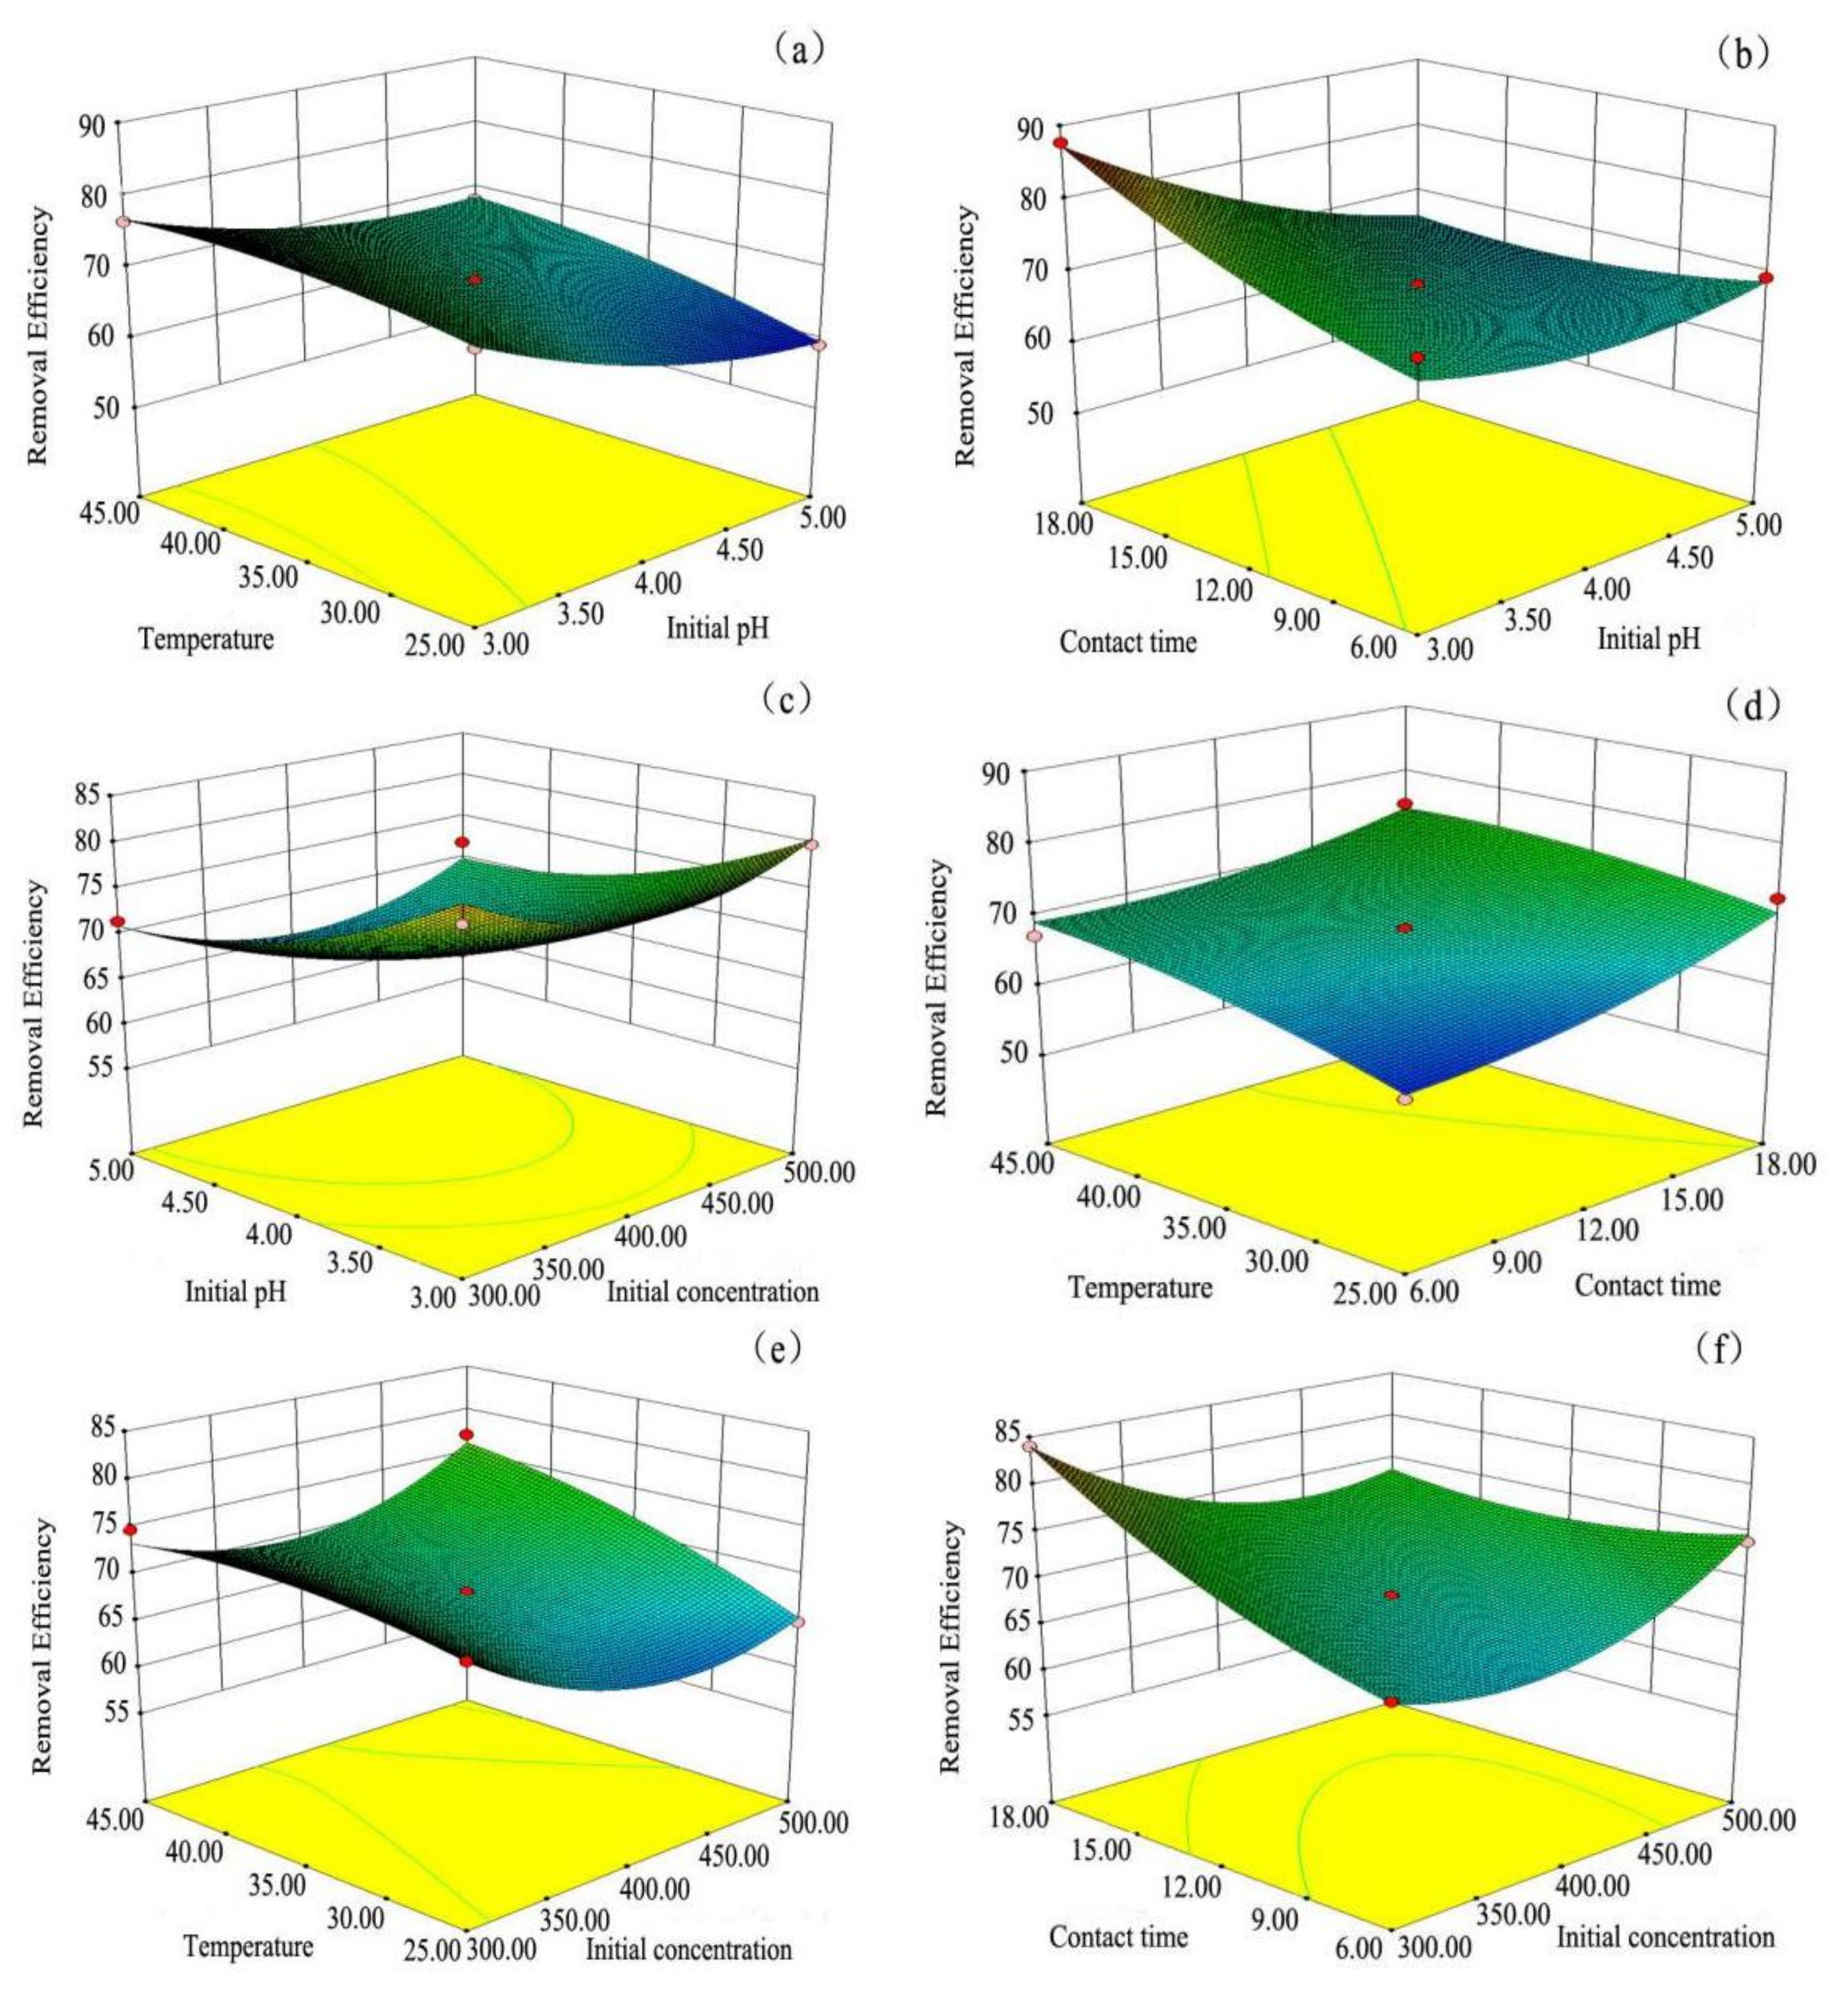
3.5. Prediction by BBD, ANN-PSO, and ANN-GA

The optimum values of independent parameters for BBD are 3.0 for pH, 40.6 °C for temperature, contact time of 18.0 min, and initial concentration of 368.9 mg/L. The maximum removal efficiency predicted under this condition was 88.2%, while the corresponding experimental value was 75.8% (Table 8). The maximum percentage decolorization predicted by using ANN-PSO model is 88.0%, and the corresponding experimental value is 84.5% (Figure 19). The performance of the ANN-GA model indicates that the prediction removal efficiency is 86.9% under the following condition: pH of 3.3, temperature of 36.1 °C, contact time of 15.8 min, and initial concentration of 331.2 mg/L (Figure 20). The absolute errors between the predicted and experimental results are 12.4, 3.5, and 5.6 for the BBD, ANN-PSO, and ANN-GA models, respectively. It was found that ANN-PSO was suitable for the prediction of CV removal by rGO/Fe/Ni composites.

3.6. Isotherm Studies

The adsorption data for the CV onto rGO/Fe/Ni nanocomposites were fitted to Langmuir, Freundlich, Temkin, and Dubinin–Radushkevich (D-R) models. The isotherm studies were performed under contact time of 18 min, pH of 5, and temperature of 25 °C with initial dye concentration of CV ranging from 200 to 1000 mg/L in order to provide an insight into the adsorption characteristics of rGO/Fe/Ni composites. The Freundlich isotherm assumes that the adsorption occurs on a heterogeneous surface with a multilayer adsorption mechanism, which is expressed as follows [49]:
log q e = log k f + 1 / n log c e
where qe is the amount of CV adsorbed (mg/g); ce is the equilibrium concentration of CV (mg/L); and Kf and n are constants affecting the adsorption capacity and intensity of adsorption, respectively, with value closer to zero with the rising heterogeneous nature of the surface (1/n < 1 indicates normal Langmuir isotherm while 1/n above 1 indicates bimechanism and cooperative adsorption).
The Langmuir isotherm describes the adsorption process occurring in a single layer (forming a molecular monolayer) of the adsorbent surface, and was employed for the calculation of the maximum capacity of adsorption (qmax). A plot of 1/qe versus 1/ce was used to obtain the Langmuir equilibrium isotherm. The Langmuir isotherm equation in linear form is given as follows [50]:
c e / q e = 1 / q m K L + c e / q m
R L = 1 / 1 + K L c 0
where c0 and ce are the initial and final dye concentration (mg/L), respectively; qe is the amount of CV at equilibrium (mg/g); qm is the maximum adsorption capacity; KL is the Langmuir constant (L/mg); and RL is the separation factor that indicates the adsorption nature to be either unfavorable (RL > 1), linear (RL = 1), favorable (0 < RL < 1), or irreversible (RL = 0) [51].
The Temkin isotherm considers that the heat of adsorption for all molecules in the phase will decrease linearly with coverage owing to adsorbent–adsorbate interaction [52,53].
q e = B ln A + B ln c e
where B is related to the heat of adsorption, while A (L/g) is the binding constant responding to the maximum binding energy at equilibrium; ce and qe have the same meanings as mentioned above.
The Dubinin–Radushkevich (D-R) isotherm was applied to estimate whether the adsorption process has a physical or chemical mechanism [54,55]. The linear form of the D-R isotherm is presented as the following equations [56,57]:
ln q e = ln q max α ε 2
ε = R T ln ( 1 + 1 / c e )
E = 2 α 1 / 2
where ce, qe, and qmax have the same meanings as mentioned above; T is the absolute solution temperature (K); R is the universal gas constant, 8.314 (J/mol K); α is a constant energy (mol2/J2); and ε is the Polanyi potential. The value of E gives information about the adsorption mechanism: physical or chemical. If it lies between 8 and 16 kJ/mol, the adsorption process is controlled by a chemical mechanism, while a value of E smaller than 8 kJ/mol indicates that the adsorption process was physisorption [58].
The calculated isotherm parameters for the adsorption of CV onto rGO/Fe/Ni composites are presented in Table 9. The value of KF for the Freunlich model was 98.7 and the 1/n was found to be 0.4572, demonstrating that the adsorption of CV onto the rGO/Fe/Ni composites was a favorable process. The values of RL (7.8 × 10⁻⁶–3.9 × 10⁻⁵) are in the range of 0–1, indicating that the process is favorable, which corroborates the KF values of the Freunlich isotherm. The value of the Langmuir isotherm constant (KL) is 128.8 L/mg. The maximum adsorption capacity from the Langmuir isotherm was calculated to be 2000 mg/g. The mean adsorption energy value of CV was 0.2 KJ/mol, implying that the adsorption of CV by rGO/Fe/Ni composites was mostly chemisorption. The value of R2 for the Freundlich isotherm (0.9700) was higher than those for the Langmuir (0.9483), Temkin (0.9094), and D-R (0.7339) isotherms. The values of the adsorption isotherm constants n and R2 indicate that the experimental values are well fitted to the Freundlich model. As given in Table 10, the removal capacity of the rGO/Fe/Ni composites is significantly higher than that of other materials. The excellent CV removal capacity of rGO/Fe/Ni composites is an important advantage for environmental remediation.

3.7. Kinetics Studies

A study on the kinetics was applied to describe the solute uptake rate and the rate-controlling step of the process for the CV adsorption onto rGO/Fe/Ni composites. The experimental data were fitted to the pseudo-first-order, pseudo-second-order, intraparticle diffusion, and Elovich kinetic models.
The pseudo-first-order kinetic model is presented by the relation of Lagergren, which states that the adsorption rate of vacant sites is proportional to the number of occupied sites, and the equations can be described by the following form [64,65]:
log ( q e q t ) = l o q e k 1 t / 2.303
where qe (mg/g) and qt (mg/g) are the adsorption capacity at equilibrium and at time t (min), respectively, and k1 (min/1) is the first-order rate constant. The pseudo-second-order model can be represented in the following form [66]:
t / q t = 1 / k 2 q e 2 + t / q e
where k2 is the pseudo-second-order rate constant (g/mg/min), and the adsorption rate constants (k2) can be determined experimentally by plotting of t/qt versus t.
To study the adsorption mechanism, the kinetic data of adsorption were fitted into intraparticle diffusion and Elovich equations. The intraparticle diffusion model was described by Weber and Morriss, and can be used to investigate the rate-limiting step for CV adsorption onto rGO/Fe/Ni composites [67,68]:
q t = k 3 t 0.5 + B
where k3 is the rate constant of intraparticle diffusion (mg/g min1/2), and the value of B is proportional to the boundary layer [69].
The Elovich model implies multilayer adsorption and assumes that the adsorption sites increase exponentially during the adsorption process; this equation can be written as follows [70]:
q t = 1 / β ln ( α β ) + 1 / β ln t
where α (mg/g/min) is the initial adsorption rate and β (g/mg) is the desorption constant, which is related to the extent of surface coverage and activation energy for chemisorption.
The values of parameters obtained from these models are presented in Table 11. From the values of R2, it can be concluded that the experimental data are well fitted to the pseudo-second-order kinetic model in contrast with the pseudo-first-order, intraparticle diffusion, and Elvoich kinetics. This implicates that the adsorption is of a chemical nature.

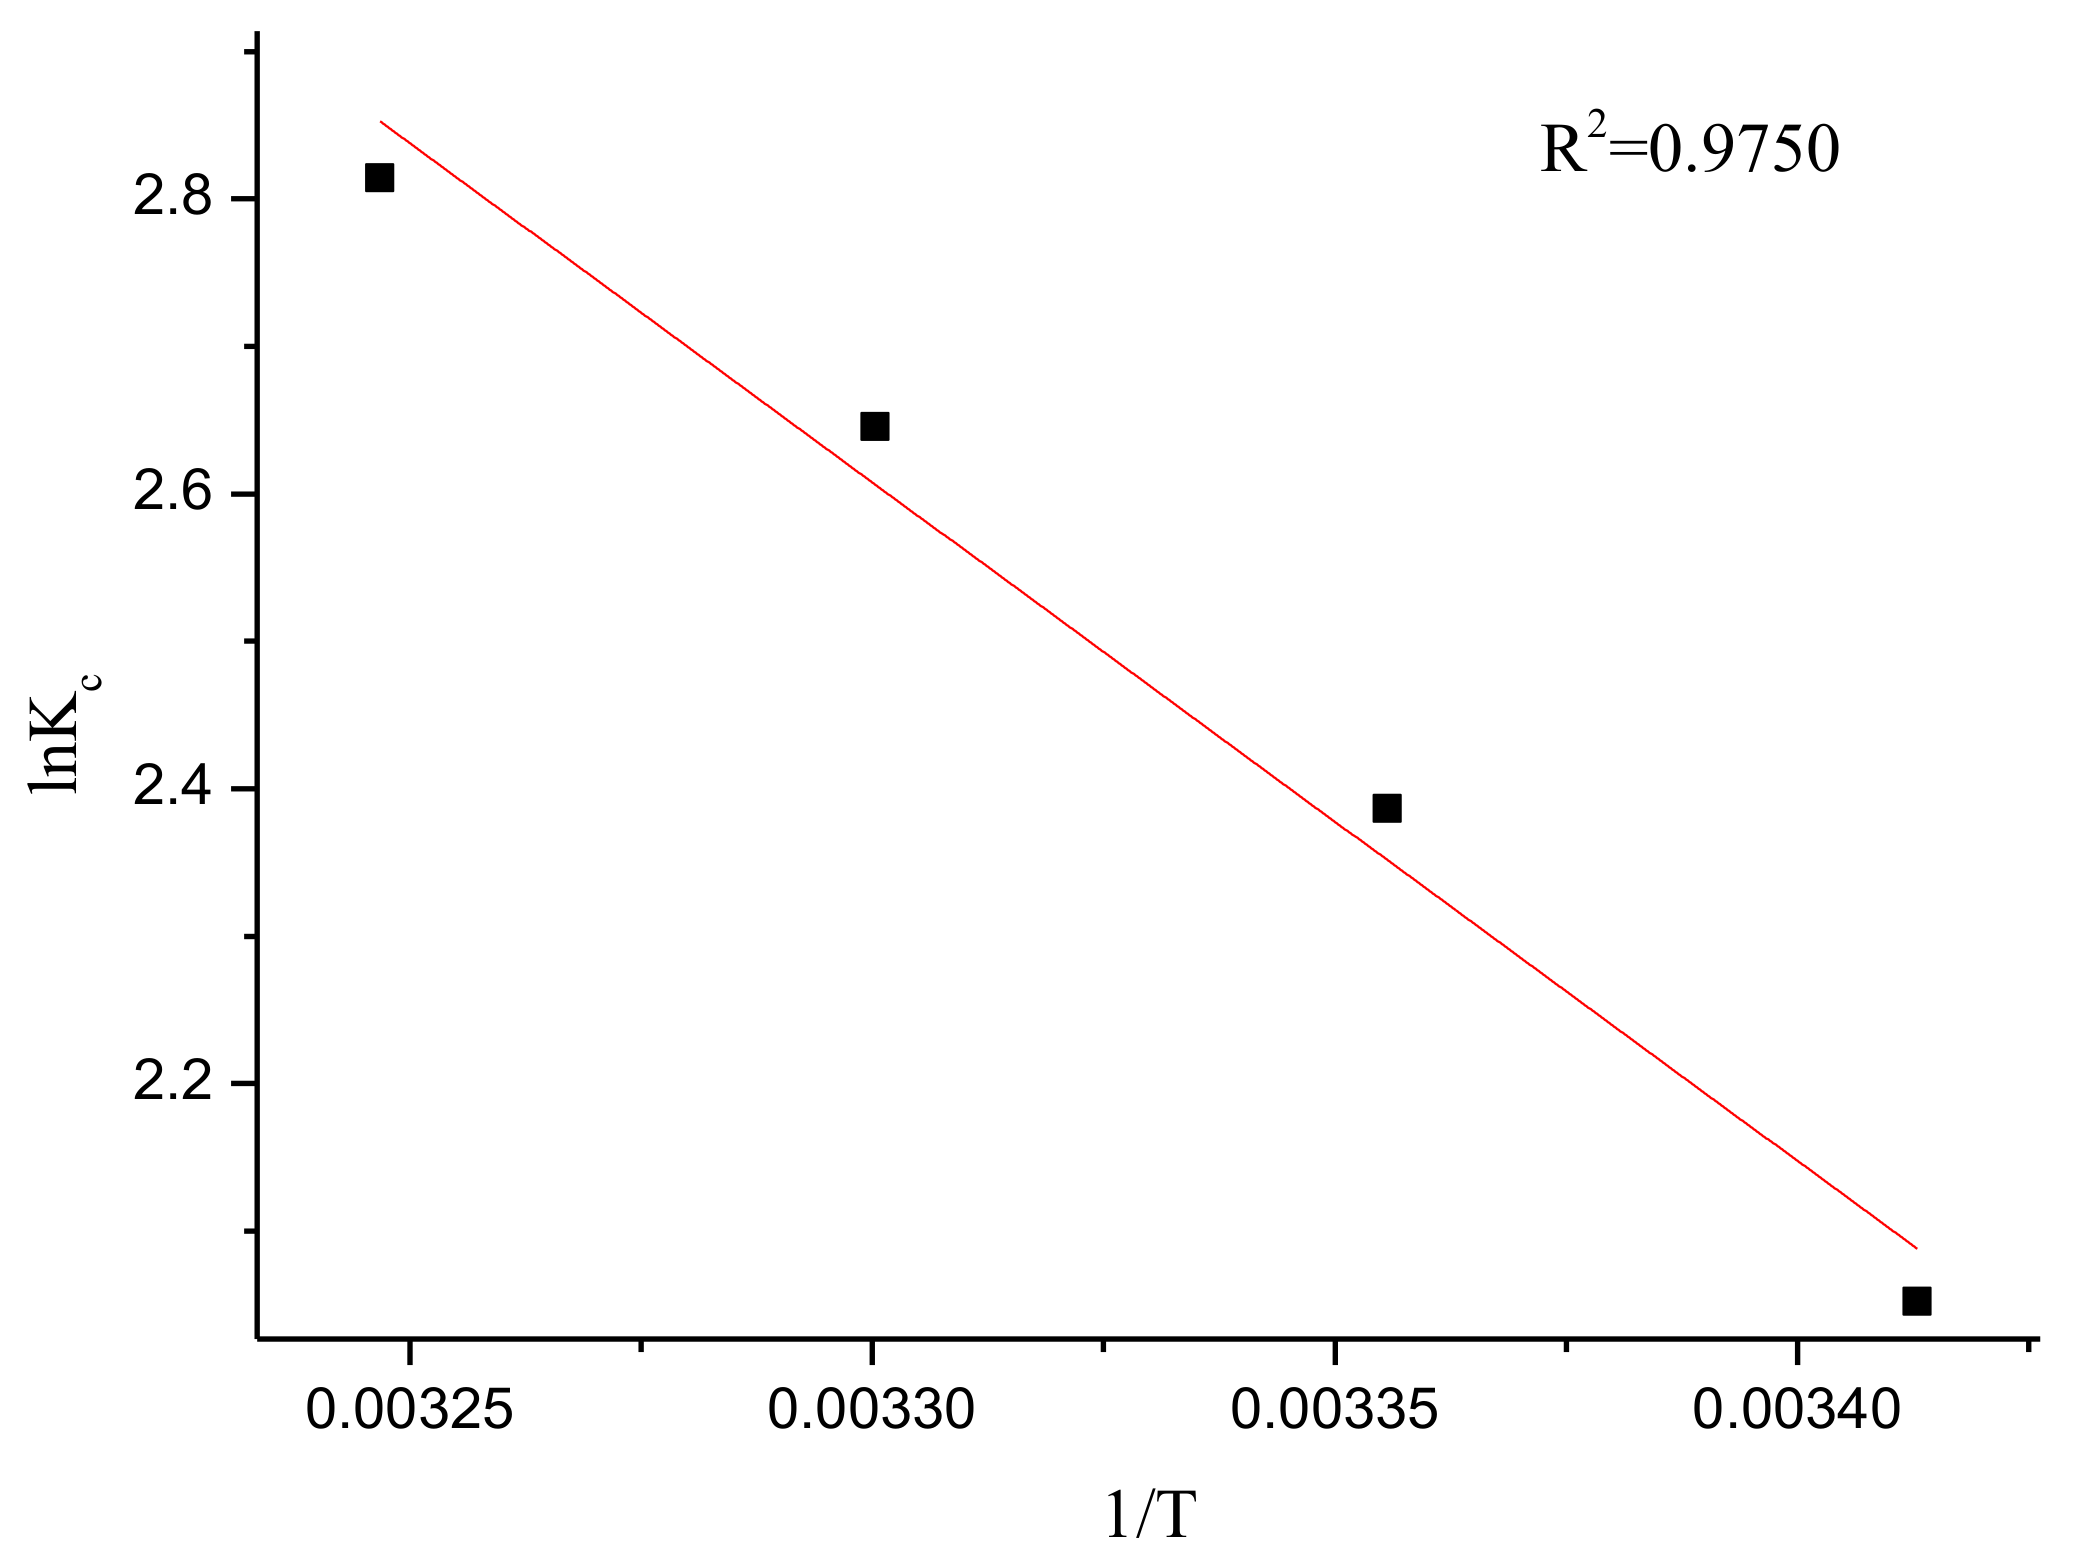
3.8. Thermodynamics Studies

In order to investigate the effect of temperature on the adsorption of CV, experiments were carried out at four different temperatures: 298, 308, 318, and 328 K. The amount of adsorption was increased from 946.21 to 1087.04 mg/g with the increase in temperature. Kc was calculated using the following equation [71]:
K c = q e / c e .
The enthalpy change ΔH0 (kJ/mol) and entropy change ΔS0 (J/mol/K) for the adsorption of CV were calculated from the slope and intercept of the plot of ln(Kc) v/s 1/T, and these parameters can be obtained from the Van’t Hoff equation [72]:
ln K c = Δ S 0 / R Δ H 0 / R T .
The values of Gibbs free energy (ΔG0) was computed from the following equation:
Δ G 0 = Δ H 0 T Δ S 0 .
Values of ΔG0 for the adsorption of CV onto rGO/Fe/Ni composites in this work were found to be −5.0850, −5.9120, −6.5544, and −6.9719 kJ/mol at 293, 303, 313, and 323 K, respectively (Table 12). The negative values of ΔG0 demonstrate the spontaneous nature of the adsorption process. In addition, by plotting a graph of ln Kc versus 1/T, the values of ΔH0 and ΔS0 can be obtained from the slopes and intercepts (Figure 21). The positive ΔH0 value suggests the endothermic nature of the adsorption process that is supported by the increase in removal efficiency with increasing temperature [73]. A positive value of entropy change was observed, which corresponded to the increase of randomness at the solid/liquid interface in the adsorption process [74]. The positive values of ΔS0 and ΔH0 show that the interaction of rGO/Fe/Ni composites with CV is basically entropy driven [75].

4. Conclusions

The results of this study demonstrate that rGO/Fe/Ni composites can be used effectively for the removal of CV from aqueous solutions. This material was synthesized by using the co-precipitation method, and characterized by XRD, SEM, EDS, Raman spectroscopy, N2-sorption, and XPS. Operating parameters such as initial concentration, initial pH, contact time, and temperature were investigated with the aid of BBD, ANN-GA, and ANN-PSO models to predict the optimum conditions and the maximum removal efficiency. The high value of R2 (0.9998) for the BP-ANN model indicates the best prediction ability. The absolute errors between predicted and experimental results were 12.4 for BBD, 5.6 for ANN-GA, and 3.5 for ANN-PSO. The existence of the high degree of agreement between the predicted results and experimental results indicate that the ANN-PSO could be used effectively for the evaluation and optimization of the effects of the independent variables on the removal efficiency of CV. Since the pHzpc of rGO/Fe/Ni composites is 3.5, the adsorption of CV was enhanced when pH > pHzpc. The maximum adsorption capacity from the Langmuir isotherm was calculated to be 2000 mg/g. The value of R2 for the Freundlich isotherm (0.9700) was higher than those for the Langmuir (0.9483), Temkin (0.9094), and D-R (0.7339) isotherms. The experimental data is well fitted to the pseudo-second-order kinetic model. The negative values of ΔG0 illustrate the spontaneous nature in the range of temperature studied (293–323 K). The positive values of ΔS0 and ΔH0 show that the interaction of rGO/Fe/Ni composites with CV is basically entropy driven. Further studies should be performed concerning the zeta potential and the oxidation–reduction potential of nanomaterials, as well as the removal of two dyes simultaneously.

Author Contributions

J.H., W.R. and X.W. conceived and designed the experiments, performed the experiments and wrote the paper; J.Q., Y.H. and R.C. analyzed the data.

Funding

This research was funded by the National Natural Science Foundation of China under Grants No. 21667012 and 21367009, and the National 111 Project of China under Grant No. D17016.

Conflicts of Interest

The authors declare no conflict of interest.

References

  1. Miyah, Y.; Lahrichi, A.; Idrissi, M.; Boujraf, S.; Taouda, H.; Zerrouq, F. Assessment of adsorption kinetics for removal potential of crystal violet dye from aqueous solutions using Moroccan pyrophyllite. J. Assoc. Arab Univ. Basic Appl. Sci. 2017, 23, 20–28. [Google Scholar] [CrossRef]
  2. Rehman, F.; SAayed, M.; Khan, J.A.; Khan, H.M. Removal of crystal violet dye from aqueous solution by gamma irradiation. J. Chil. Chem. Soc. 2017, 62, 3359–3364. [Google Scholar] [CrossRef]
  3. Tripathy, N.; Ahmad, R.; Song, J.E.; Park, H.; Khang, G. ZnO nanonails for photocatalytic degradation of crystal violet dye under UV irradiation. Mater. Sci. 2017, 4, 267–276. [Google Scholar] [CrossRef]
  4. Kulkarni, M.R.; Revanth, T.; Acharya, A.; Bhat, P. Removal of crystal violet dye from aqueous solution using water hyacinth: Equilibrium, kinetics and thermodynamics study. Resour.-Effic. Technol. 2017, 3, 71–77. [Google Scholar] [CrossRef]
  5. Benjelloun, Y.; Lahrichi, A.; Boumchita, S.; Idrissi, M.; Miyah, Y.; Anis, Kh.; Nenov, V.; Zerrouq, F. Removal of crystal violet by wet oxidation with H2O2 over an Iron oxide catalyst synthesized from fly ash. J. Mater. Environ. Sci. 2017, 8, 2259–2269. [Google Scholar]
  6. Bazzoa, A.; Adebayob, M.A.; Diasa, S.L.P.; Limaa, E.C.; Vaghettia, J.C.P.; de Oliveiraa, E.R.; Leitea, A.J.B.; Pavanc, F.A. Avocado seed powder: Characterization and its application for crystal violet dye removal from aqueous solutions. Desalination Water Treat. 2015, 57, 1–16. [Google Scholar] [CrossRef]
  7. Oladipo, A.A.; Gazi, M. Enhanced removal of crystal violet by low cost alginate/acid activated bentonite composite beads: Optimization and modelling using non-linear regression technique. J. Water Process Eng. 2014, 2, 43–52. [Google Scholar] [CrossRef]
  8. Bosson, J.; Gouin, J.; Lacour, J. Cationic triangulenes and helicenes: Synthesis, chemical stability, optical properties and extended applications of these unusual dyes. Chem. Soc. Rev. 2014, 43, 2824–2840. [Google Scholar] [CrossRef] [PubMed]
  9. Sudamalla, P.; Saravanan, P.; Matheswaran, M. Optimization of operating parameters using response surface methodology for adsorption of crystal violet by activated carbon prepared from mango kernel. Environ. Res. 2012, 22, 1–7. [Google Scholar]
  10. Choi, K.; Lee, W. Enhanced degradation of trichloroethylene in nano-scalezero-valent iron Fenton system with Cu(II). J. Hazard. Mater. 2012, 99, 146–153. [Google Scholar] [CrossRef] [PubMed]
  11. Yin, W.; Wu, J.; Li, P.; Wang, X.; Zhu, N.; Wu, P.; Yang, B. Experimental study ofzero-valent iron induced nitrobenzene reduction in groundwater: The effects of pH, iron dosage, oxygen and common dissolved anions. Chem. Eng. J. 2012, 184, 198–204. [Google Scholar] [CrossRef]
  12. Fan, M.Y.; Li, T.J.; Hu, J.W.; Cao, R.S.; Wu, Q.; Wei, X.H.; Li, L.Y.; Shi, X.D.; Ruan, W.Q. Synthesis and characterization of reduced graphene oxide-supported nanoscale zero-valent iron (nZVI/rGO) composites used for Pb(II) removal. Materials 2016, 9, 687. [Google Scholar] [CrossRef] [PubMed]
  13. Luo, S.; Qin, P.; Shao, J.; Peng, L.; Zeng, Q.; Gu, J.D. Synthesis of reactive nanoscalezero valent iron using rectorite supports and its application for Orange II removal. Chem. Eng. J. 2013, 223, 1–7. [Google Scholar] [CrossRef]
  14. Segura, Y.; Martínez, F.; Melero, J.A.; Molina, R.; Chand, R.; Bremner, D.H. Enhance-ment of the advanced Fenton process (Fe0/H2O2) by ultrasound for themineralization of phenol. Appl. Catal. B Environ. 2012, 113–114, 100–106. [Google Scholar] [CrossRef]
  15. Li, L.Y.; Hu, J.W.; Shi, X.D.; Fan, M.Y.; Luo, J.; Wei, X.H. Nanoscale zero-valent metals: A review of synthesis, characterization, and applications to environmental remediation. Environ. Sci. Pollut. Res. 2016, 23, 17880–17900. [Google Scholar] [CrossRef] [PubMed]
  16. Eda, B.G.; Chhowalla, M. Chemically derived graphene oxide: Towards large-area thin-film electronics and optoelectronics. Adv. Mater. 2010, 22, 2392–2415. [Google Scholar] [CrossRef] [PubMed]
  17. Dreyer, D.R.; Park, S.; Bielawski, C.W.; Ruoff, R.S. The chemistry of graphene oxide. Chem. Soc. Rev. 2010, 39, 228–240. [Google Scholar] [CrossRef] [PubMed]
  18. Zhou, S.; Bongiorno, A. Density functional theory modeling of multilayer “epitaxial” graphene oxide. Acc. Chem. Res. 2014, 47, 3331–3339. [Google Scholar] [CrossRef] [PubMed]
  19. Hu, L.; Hu, X.; Wu, X.; Du, C.; Dai, Y.C.; Deng, J.B. Density functional calculation of transition metal adatom adsorption on graphene. Phys. B Condens. Matter 2010, 405, 3337–3341. [Google Scholar] [CrossRef]
  20. Dimakis, N.; Flor, F.A.; Salgado, A.; Adjibi, K.; Vargas, S.; Saenz, J. Density functional theory calculations on transition metal atoms adsorbed on graphene monolayers. Appl. Surf. Sci. 2016, 421, 252–259. [Google Scholar] [CrossRef]
  21. Nakada, K.; Ishii, A. DFT Calculation for adatom adsorption on graphene. In Graphene Simulation; InTech: Rijeka, Croatia, 2011. [Google Scholar]
  22. Dimakis, N.; Navarro, N.E.; Velazquez, J.; Salgado, A. Electronic and vibrational properties of graphene monolayers with iron adatoms: A density functional theory study. Appl. Surf. Sci. 2015, 334, 2–6. [Google Scholar] [CrossRef]
  23. Chan, K.T.; Neaton, J.B.; Cohen, M.L. First-principles study of metal adatom adsorption on graphene. Phys. Rev. B Condens. Matter 2008, 77, 1–12. [Google Scholar] [CrossRef]
  24. Mazaheri, H.; Ghaedi, M.; Azqhandi, M.H.A.; Asfarama, A. Application of machine/statistical learning, artificial intelligence and statistical experimental design for the modeling and optimization of methylene blue and Cd(II) removal from a binary aqueous solution by natural walnut carbon. Phys. Chem. Chem. Phys. 2017, 19, 11299–11317. [Google Scholar] [CrossRef] [PubMed]
  25. Najafi, F.; Moradi, O.; Rajabi, M.; Asif, M.; Tyagi, I.; Agarwal, S. Gupta, V.K. Thermodynamics of the adsorption of nickel ions from aqueous phase using graphene oxide and glycine functionalized graphene oxide. J. Mol. Liq. 2015, 208, 106–113. [Google Scholar] [CrossRef]
  26. Robati, D.; Mirza, B.; Rajabi, M.; Moradi, O.; Tyagi, I.; Agarwal, S.; Gupta, V. Removal of hazardous dyes-BR 12 and methyl orange using graphene oxide as an adsorbent from aqueous phase. Chem. Eng. J. 2016, 284, 687–697. [Google Scholar] [CrossRef]
  27. Fan, M.Y.; Hu, J.W.; Cao, R.S.; Ruan, W.Q.; Wei, X.H. A review on experimental design for pollutants removal in water treatment with the aid of artificial intelligence. Chemsphere 2018, 2, 111. [Google Scholar] [CrossRef] [PubMed]
  28. Rajendra, M.; Jena, P.C.; Raheman, H. Prediction of optimized pretreatment process parameters for biodiesel production using ANN and GA. Fuel 2009, 88, 868–875. [Google Scholar] [CrossRef]
  29. Gordan, B.; Armaghani, D.J.; Hajihassani, M.; Monjezi, M. Prediction of seismic slope stability through combination of particle swarm optimization and neural network. Eng. Comput. 2016, 2, 85–97. [Google Scholar] [CrossRef]
  30. Hummers, W.S.; Offeman, R.E. Preparation of graphitic oxide. J. Am. Chem. Soc. 1958, 80, 1339. [Google Scholar] [CrossRef]
  31. Kang, H.Y.; Xiu, Z.M.; Chen, J.W.; Cao, W.P.; Guo, Y.F.; Li, T.L.; Jin, Z.H. Reduction of nitrate by bimetallic Fe/Ni nanoparticles. Environ. Technol. 2012, 33, 2185–2192. [Google Scholar] [CrossRef] [PubMed]
  32. Ghaedi, A.M.; Ghaedi, M.; Pouranfard, A.R.; Ansari, A.; Avazzadeh, Z.; Vafaei, A.; Tyagi, I.; Agarwal, S.; Gupta, V.K. Adsorption of triamterene on multi-walled and single-walled carbon nanotubes: Artificial neural network modeling and genetic algorithm optimization. J. Mol. Liq. 2016, 216, 654–665. [Google Scholar] [CrossRef]
  33. Zehra, T.; Priyantha, N.; Lim, L.B.L.; Iqbal, E. Sorption characteristics of peat of Brunei Darussalam V: 535 removal of Congo red dye from aqueous solution by peat. Desalination Water Treat. 2015, 54, 2592–2600. [Google Scholar] [CrossRef]
  34. Zhang, Y.Y.; Pan, B.C. Modeling batch and column phosphate removal by hydrated ferric oxide-based nanocomposite using response surface methodology and artificial neural network. Chem. Eng. J. 2014, 249, 111–120. [Google Scholar] [CrossRef]
  35. Mohana, S.; Singh, Y.; Verma, D.K.; Hasana, S.H. Synthesis of CuO nanoparticles through greenroute using Citrus limon juice and its application asnanosorbent for Cr(VI) remediation: Processoptimization with RSM and ANN-GA based model. Process Saf. Environ. Prot. 2015, 96, 156–166. [Google Scholar] [CrossRef]
  36. Ruan, W.Q.; Shi, X.D.; Hu, J.W.; Hou, Y.; Fan, M.Y.; Cao, R.S.; Wei, X.H. Modeling of Malachite Green Removal from aqueous solutions by nanoscale zerovalent zinc using artificial neural network. Appl. Sci. 2017, 8, 3. [Google Scholar] [CrossRef]
  37. Montano, J.J.; Palmer, A. Numeric sensitivity analysis applied to feedforward neural networks. Neural Comput. Appl. 2003, 12, 119–125. [Google Scholar] [CrossRef]
  38. Fan, M.Y.; Hu, J.W.; Cao, R.S.; Xiong, K.N.; Wei, X.H. Modeling and prediction of copper removal from aqueous solutions by nZVI/rGO magnetic nanocomposites using ANN-GA and ANN-PSO. Sci. Rep. 2017, 7, 18040. [Google Scholar] [CrossRef] [PubMed]
  39. Kennedy, J.; Spears, W.M. Matching algorithms to problems: An experimental test of the particle swarm and some genetic algorithms on the multimodal problem generator. In Proceedings of the IEEE Int’l Conference on Evolutionary Computation, Anchorage, AK, USA, 4–9 May 1998; pp. 78–83. [Google Scholar]
  40. Samanta, B.; Al-Balushi, K.R.; Al-Araimi, S.A. Bearing fault detection using artificial neural networks and genetic algorithm. Soft Comput. 2004, 3, 1–12. [Google Scholar] [CrossRef]
  41. Shi, X.D.; Ruan, W.Q.; Hu, J.W.; Fan, M.Y.; Cao, R.S.; Wei, X.H. Optimizing the removal of rhodamine B in aqueous solutions by reduced graphene oxide-supported nanoscale zerovalent iron (nZVI/rGO) using an artificial neural network-genetic algorithm (ANN-GA). Nanomaterials 2017, 7, 309. [Google Scholar] [CrossRef]
  42. Eberhart, R.C.; Kennedy, J. A new optimizer using particle swarm theory. In Proceedings of the 6th International Symposium on Micromachine and Human Science, Nagoya, Japan, 4–6 October 1995; pp. 39–43. [Google Scholar]
  43. Sahu, R.S.; Li, D.L.; Doong, R. Unveiling the hydrodechlorination of trichloroethylene by reduced graphene oxide supported bimetallic Fe/Ni nanoparticles. Chem. Eng. J. 2018, 334, 30–40. [Google Scholar] [CrossRef]
  44. Wang, W.; Ji, Z.; Li, T.; Zhang, H.; Gao, S. Preparation of spherical iron nanoclusters in ethanol-water solution for nitrate removal. Chemosphere 2006, 65, 1396–1404. [Google Scholar] [CrossRef] [PubMed]
  45. Sahu, R.S.; Bindumadhavan, K.; Doong, R.A. Boron-doped reduced graphene oxidebased bimetallic Ni/Fe nanohybrids for the rapid dechlorination of trichloroethylene. Environ. Sci. Nano 2017, 4, 565–576. [Google Scholar] [CrossRef]
  46. Kumar, N.A.; Nolan, H.; McEvoy, N.; Rezvani, E.; Doyle, R.; Lyons, M.E.G.; Duesberg, G.S. Plasma-assisted simultaneous reduction and nitrogen doping of graphene oxide nanosheets. J. Mater. Chem. A 2013, 1, 4431–4435. [Google Scholar] [CrossRef]
  47. Bhunia, P.; Kim, G.; Baik, C.; Lee, H. A strategically designed porous iron-iron oxide matrix on graphene for heavy metal adsorption. Chem. Commun. 2012, 48, 9888–9890. [Google Scholar] [CrossRef] [PubMed]
  48. Li, B.J.; Cao, H.Q.; Yin, G.; Lu, Y.X.; Yin, J.F. Cu2O@reduced graphene oxide composite for removal of contaminants from water and supercapacitor. J. Mater. Chem. 2011, 21, 10645–10648. [Google Scholar] [CrossRef]
  49. Ahmad, M.A.; Alrozi, R. Removal of malachite green dye from aqueous solution using rambutan peel-based activated carbon: Equilibrium, kinetic and thermodynamic studies. Chem. Eng. J. 2011, 171, 510–516. [Google Scholar] [CrossRef]
  50. Ashrafi, S.D.; Kamani, H.; Jaafari, J.; Mahvi, A.H. Experimental design and response surface modeling for optimization of fluoroquinolone removal from aqueous solution by NaOH-modified rice husk. Desalination Water Treat. 2016, 57, 16456–16465. [Google Scholar] [CrossRef]
  51. Langmuir, I. The adsorption of gases on plane surfaces of glass, mica and platinum. J. Am. Chem. Soc. 1918, 40, 1361–1403. [Google Scholar] [CrossRef]
  52. Hema, M.; Arivoli, S. Adsorption kinetics and thermodynamics of malachite green dye onto acid activated low cost carbon. J. Appl. Sci. Environ. Manag. 2008, 12, 43. [Google Scholar]
  53. Temkin, M.J.; Pyzhev, V. Recent modifications to Langmuir isotherms. Acta Physicochim. URSS 1940, 12, 217–222. [Google Scholar]
  54. Nur, S.; Abas, A.; Shah, H.; Siajam, S.I.; Kamal, M.L. Adsorption of Pb(II) ions by using mangrove-alginate composite beads(MACB): Isotherm, Kinetics and Thermodynamics studies. J. Purity Util. React. Environ. 2015, 4, 124–131. [Google Scholar]
  55. Gunay, A.; Arslankaya, E.; Tosun, I. Lead removal from aqueous solution by natural and pretreated clinoptilolite: Adsorption equilibrium and kinetics. J. Hazard. Mater. 2007, 146, 362–371. [Google Scholar] [CrossRef] [PubMed]
  56. Dabrowski, A. Adsorption—From theory to practice. Adv. Colloid Interface Sci. 2001, 93, 135–224. [Google Scholar] [CrossRef]
  57. Dubinin, M.M. The potential theory of adsorption of gases and vapors for adsorbents with energetically non-uniform surface. Chem. Rev. 1960, 60, 235–266. [Google Scholar] [CrossRef]
  58. Hobson, J.P. Physical adsorption isotherms extending from ultra-high vacuum to vapor pressure. J. Phys. Chem. 1969, 73, 2720–2727. [Google Scholar] [CrossRef]
  59. Banerjee, S.; Gautam, R.K.; Jaiswal, A.; Chattopadhyaya, M.C.; Sharma, Y.C. Rapid scavenging of methylene blue dye from a liquid phase by adsorption on alumina nanoparticles. RSC Adv. 2015, 5, 14425–14440. [Google Scholar] [CrossRef]
  60. Jiao, Q.; Qiu., F.X.; Rong, X.S.; Yan., J.; Zhao, H.; Yang, D.Y. Adsorption behavior of crystal violet from aqueous solutions with chitosan–graphite oxide modified polyurethane as an adsorbent. J. Appl. Polym. Sci. 2015, 132, 83–101. [Google Scholar]
  61. Islam, M.S.; Kusumoto, Y.; Kurawaki, J.; Abdulla-AL-Mamun, M.; Manaka, H. A comparative study on heat dissipation, morphological and magnetic properties of hyperthermia suitable nanoparticles prepared by co-precipitation and hydrothermal methods. Bull. Mater. Sci. 2012, 35, 1047–1053. [Google Scholar] [CrossRef]
  62. Javad, Z.; Maryam, B.; Tahere, S. Simultaneous removal of binary mixture of Brilliant Green and Crystal Violet using derivative spectrophotometric determination, multivariate optimization and adsorption characterization of dyes on surfactant modified nano-c-alumina. Spectrochim. Acta Mol. Biomol. Spectrosc. 2015, 137, 1016–1028. [Google Scholar]
  63. Ghorai, S.; Sarkar, A.; Raoufi, M.; Panda, A.B.; Schönherr, H.; Pal, S. Enhanced removal of methylene blue and methyl violet dyes from aqueous solution using a nanocomposite of hydrolyzed polyacrylamide grafted xanthan gum and incorporated nanosilica. ACS Appl. Mater. Interfaces 2014, 6, 4766–4777. [Google Scholar] [CrossRef] [PubMed]
  64. Bharath, G.; Alhseinat, E.; Ponpandian, N.; Khan, M.A.; Siddiqui, M.R.; Ahmed, F.; Alsharaeh, E.H. Development of adsorption and electrosorption techniques for removal of organic and inorganic pollutants from wastewater using novel magnetite/porous graphene-based nanocomposites. Sep. Purif. Technol. 2017, 188, 206–218. [Google Scholar] [CrossRef]
  65. Lagergren, S. Zur Theorie Der Sogenannten Adsorption Gelöster Stoffe. Bihang Till K Svenska Vet-Akad. Handlingar 1898, 24, 1–39. [Google Scholar]
  66. Ho, Y.S.; McKay, G. Sorption of dye from aqueous solution by peat. Chem. Eng. J. 1998, 70, 115–124. [Google Scholar] [CrossRef]
  67. Ho, Y.S.; McKay, G. Pseudo-second order model for sorption processes. Process Biochem. 1999, 4, 451–465. [Google Scholar] [CrossRef]
  68. Fan, M.Y.; Li, T.J.; Hu, J.W.; Cao, R.S.; Wei, X.H.; Shi, X.D.; Ruan, W.Q. Artificial neural network modeling and genetic algorithm optimization for cadmium removal from aqueous solutions by reduced graphene oxide-supported nanoscale zero-valent iron (nZVI/rGO) composites. Materials 2017, 10, 544. [Google Scholar] [CrossRef] [PubMed]
  69. Messina, P.V.; Schulz, P.C. Adsorption of reactive dyes on titaniasilica mesoporous materials. J. Colloid Interface Sci. 2006, 299, 305–320. [Google Scholar] [CrossRef] [PubMed]
  70. Akpomie, K.G.; Dawodu, F.A. Efficient abstraction of Ni(II) and Mn(II) ions from solution onto an alkaline modified montmorillonite. J. Taibah. Univ. Sci. 2014, 8, 343–356. [Google Scholar] [CrossRef]
  71. Haddad, M.E.; Slimani, R.; Mamouni, R.; ElAntri, S.; Lazar, S. Removal of two textile dyes from aqueous solutions onto calcined bones. J. Assoc. Arab Univ. Basic Appl. Sci. 2013, 14, 51–59. [Google Scholar] [CrossRef]
  72. Namasivayam, C.; Senthilkumar, S. Recycling of industrial solid waste for the removal of mercury (II) by adsorption process. Chemosphere 1997, 34, 357–375. [Google Scholar] [CrossRef]
  73. Wang, S.B.; Boyjoo, Y.; Choueib, A.; Zhu, Z.H. Removal of dyes from aqueous solution using fly ash and red mud. Water Res. 2005, 39, 129–138. [Google Scholar] [CrossRef] [PubMed]
  74. Sadaf, S.; Bhatti, H.N. Batch and fixed bed column studies for the removal of Indosol Yellow BG dye by peanut husk. J. Taiwan Inst. Chem. E. 2014, 45, 541–553. [Google Scholar] [CrossRef]
  75. Simone, M.S.; Klicia, A.S.; Roberta, C.; Roland, V.; Christian, S.; Wim, D.G.; Antonio, J.A.M. Adsorption of carotenes and phosphorus from palm oil onto acid activated bleaching earth: Equilibrium, kinetics and thermodynamics. J. Food Eng. 2013, 118, 341–349. [Google Scholar]
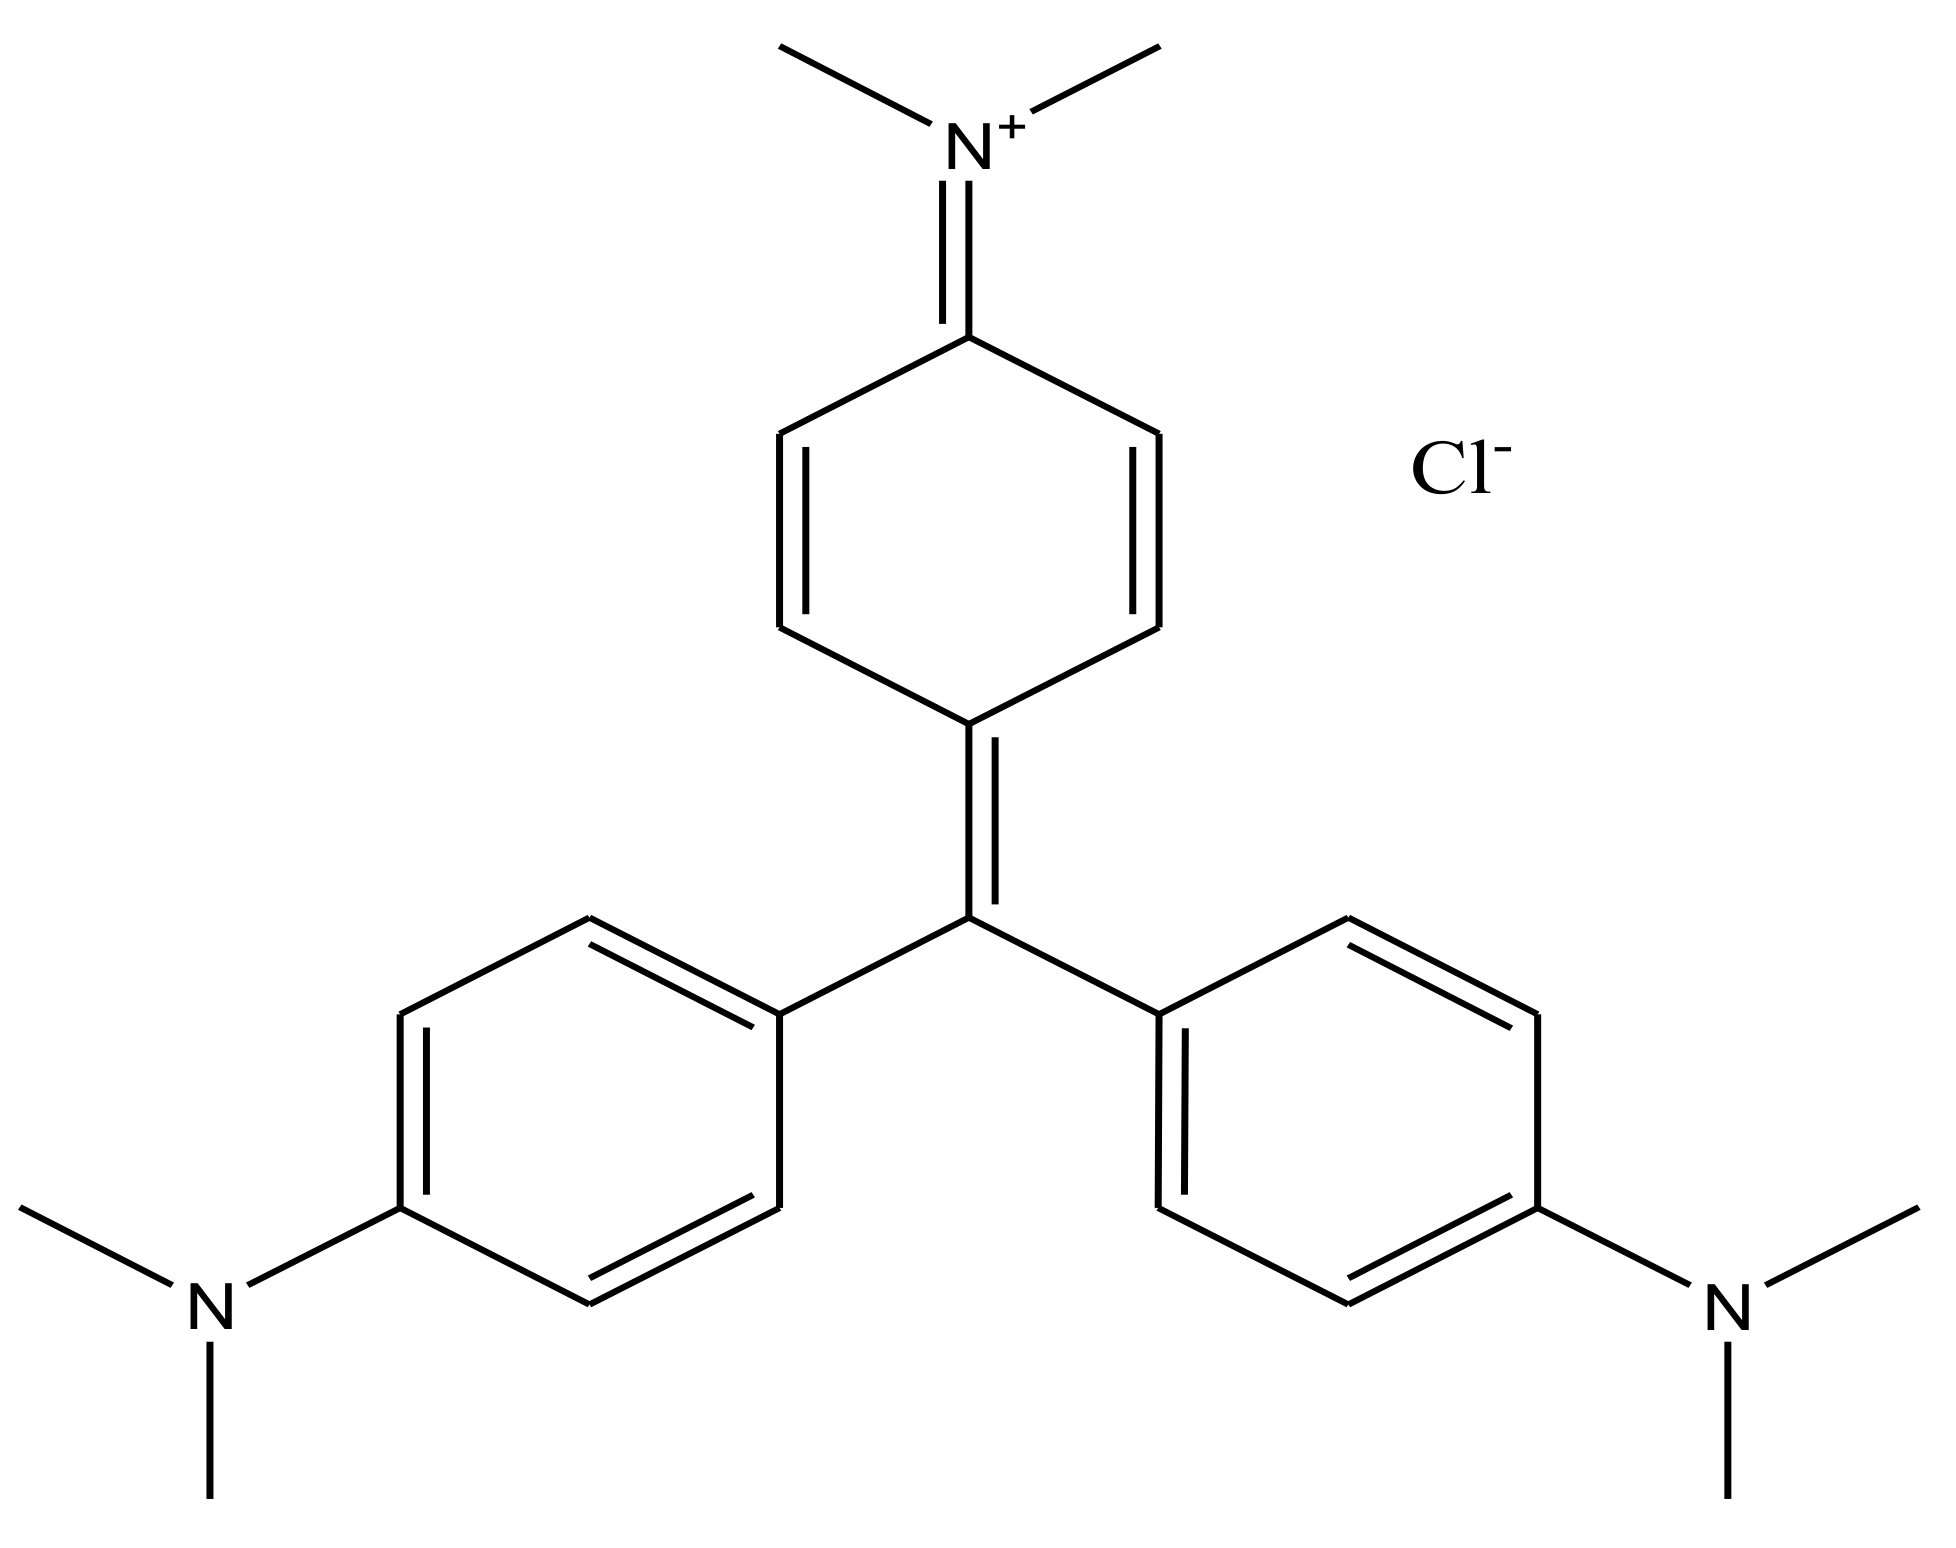
Figure 1. Model structure of graphene oxide (GO).
Materials 11 00865 g001
Figure 2. Structural formula of crystal violet (CV).
Materials 11 00865 g002
Figure 3. Schematic for the artificial neuron model.
Materials 11 00865 g003
Figure 4. XRD patterns of GO, Fe/Ni, nanoparticles and reduced GO (rGO)/Fe/Ni composites.
Materials 11 00865 g004
Figure 5. SEM images of Fe/Ni (a) and rGO/Fe/Ni (b).
Materials 11 00865 g005
Figure 6. EDS spectra of Fe/Ni (a) and rGO/Fe/Ni (b).
Materials 11 00865 g006
Figure 7. The distribution of diameters of Fe/Ni (a) and rGO/Fe/Ni (b).
Materials 11 00865 g007
Figure 8. Raman spectra of GO, rGO, and rGO/Fe/Ni composites.
Materials 11 00865 g008
Figure 9. The adsorption/desorption of Fe/Ni nanoparticles and rGO/Fe/Ni composites.
Materials 11 00865 g009
Figure 10. XPS analyses of Fe/Ni and rGO/Fe/Ni: wide scan (a); high-resolution spectra of Fe2p for Fe/Ni nanoparticles (b); and high-resolution spectra of Fe2p for rGO/Fe/Ni composites (c).
Materials 11 00865 g010
Figure 11. The relation between pH and the removal efficiency (a); the initial pH versus ΔpH (b).
Materials 11 00865 g011
Figure 12. The normal probabilities versus internally studentized residuals.
Materials 11 00865 g012
Figure 13. The predicted values versus the actual values.
Materials 11 00865 g013
Figure 14. Three-dimensional response surface plots for the CV removal: (a) Initial pH–Temperature; (b) Initial pH–Contact time; (c) Initial pH–Initial concentration (d) Temperature–Contact time; (e) Temperature–Initial concentration; (f) Contact time–Initial concentration.
Materials 11 00865 g014
Figure 15. The difference between the initial and final pH of the solutions.
Materials 11 00865 g015
Figure 16. Regression plot of the experimental and predicted results.
Materials 11 00865 g016
Figure 17. Mean square error (MSE) of neurons in the BP-ANN model.
Materials 11 00865 g017
Figure 18. Applied BP-ANN model in this study.
Materials 11 00865 g018
Figure 19. Removal efficiency versus iteration.
Materials 11 00865 g019
Figure 20. Removal efficiency versus generation.
Materials 11 00865 g020
Figure 21. Plot of lnKc versus 1/T for initial pH of 5, contact time of 18 min, and initial concentration of 500.00 mg/L.
Materials 11 00865 g021
Table 1. Characteristics of CV dye.
Chemical NameCrystal Violet
Molecular formulaC25H30N3Cl
Molecular weight408 g/mol
Maximum wavelength λ583 nm
Table 2. Independent variables and levels used for the removal of CV.
Independent VariablesFactorsLevels
−101
Initial dye concentration (mg/L)X1300400500
Initial pHX2345
Contact time (min)X361218
Temperature (°C)X4253545
Table 3. Comparison between predicted removal efficiency by the Box–Behnken design (BBD) model and experimental values.
RunX1 (mg/L)X2X3 (min)X4 (°C)Actual (%)Predicted (%)
13004122571.671.5
24004123568.268.2
33003123580.682.6
43005123571.571.0
550046357474.8
6400462559.960.6
75004124577.176.2
8400563569.368.8
94003183587.787.3
10400418457574.4
115003123579.880.4
125005123571.970.0
13400312257373.3
14400363572.569.7
155004183572.873.8
164005183564.466.3
17500412256569.6
184005124568.168.6
193004124574.873.4
204004123568.268.2
214005122559.159.6
22400464567.269.2
23300418358484.2
244004123568.268.2
254004182572.570.1
264003124576.576.8
274004123568.268.2
284004123568.268.2
2930046356867.8
Table 4. Analysis of variance (ANOVA) for the experimental results from the response surface methodology (RSM).
SourceSum of SquaresDegree of FreedomMean SquareF-Valuep-Value
Model1110.151479.3032.49<0.0001Significant
X18.1718.173.350.0887
X2360.801360.80147.82<0.0001
X3172.521172.5270.68<0.0001
X4117.811117.8148.27<0.0001
X1X20.3610.360.150.7067
X1X373.96173.9630.30<0.0001
X1X419.80119.808.110.0129
X2X3101.001101.0041.38<0.0001
X2X47.5617.563.100.1002
X3X45.7615.762.360.1468
X12158.401158.4064.90<0.0001
X2252.84152.8421.650.0004
X3225.09125.0910.280.0063
X4214.03114.035.750.0310
Residual107.84147.70--
Lack of Fit107.841010.78--
Pure Error040--
Total5777.3728---
Table 5. Comparison of the predicted values by using the back-propagation (BP)-artificial neural network (ANN) model with the experimental values.
RunsX1 (mg/L)X2X3 (min)X4 (°C)Experimental Value (%)Predicted Value (%)Absolute Error (%)
13004122571.671.450.15
24004123568.268.120.08
33003123580.680.50.1
43005123571.571.40.10
550046357474.020.02
6400462559.959.990.09
75004124577.177.030.07
8400563569.369.290.01
94003183587.786.800.90
10400418457574.980.02
115003123579.879.920.12
125005123571.971.880.02
13400312257373.420.12
14400363572.572.530.03
155004183572.872.780.02
164005183564.464.350.05
17500412256565.080.08
184005124568.167.90.02
193004124574.874.880.08
204004123568.268.230.03
214005122559.159.150.05
22400464567.267.340.14
23300418358484.060.06
244004123568.268.380.18
25 *4004182572.572.490.01
26 *4003124576.576.680.12
27 *4004123568.268.160.04
28 *4004123568.268.170.03
29 *30046356867.030.03
Mean absolute error (%)0.10
* representation test set.
Table 6. The weights and biases of BP-ANN in input–hidden layers (wi and bi) and hidden–output layer (wj and bj).
Number of Neuronswibiwjbj
Input Variables
Initial Dye ConcentrationInitial pHContact TimeTemperature
1−0.051830.2899−1.9836−1.4754−2.4896−0.99640.2743
21.0057−0.045581.11441.98561.93630.4235
3−1.4023−1.0854−1.73550.20401.38310.7355
4−1.11281.92090−0.5651−0.975−0.8299−0.7634
52.0220−1.3428−0.44200.33350.2766−0.9220
60.34201.32651.41401.52390.27660.1964
7−0.6076−1.4517−1.48711.2288−0.82990.2086
81.9255−0.69181.4166−0.07202−1.38310.03286
91.90831.1988−1.0214−0.27601.9363−0.9850
100.7757−1.0114−1.3414−1.66552.48960.3779
Table 7. Relative influence of input variables.
Input VariablesRelative Significance (%)Order
Initial dye concentration20.23%3
Initial pH35.95%2
Contact time7.54%4
Temperature36.27%1
Table 8. Comparison between the predicted percentage decolorization of CV by using BBD, ANN-particle swarm optimization (PSO), and ANN-genetic algorithm (GA) models and the experimental results.
ModelsIndependent ParametersPrediction (%)Experiment (%)Absolute Error (%)
X1X2X3X4
BBD368.93.018.040.688.275.812.4
ANN-PSO300.04.018.045.088.084.53.5
ANN-GA331.23.315.836.186.981.35.6
Table 9. Isotherm parameters for the adsorption of CV onto the rGO/Fe/Ni composites.
Isotherm ModelsParametersValue of Parameters
FreundlichKf (mg/g)98.7
1/n0.4572
R20.9700
LangmuirKL (L/mg)128.8
qm (mg/g)2000.00
R20.9483
RL7.8 × 10−6–3.9 × 10⁻⁵
TemkinA (L/g)0.089
B402.97
R20.9094
Dubinin–Radushkevichqm (mg/g)1350.4
α (mol2/J2)1.0 × 10−3
E (kJ/mol)0.2
R20.7339
Table 10. CV adsorption capacity of the rGO/Fe/Ni composites and other materials.
AdsorbentsMaximum Adsorption Capacity (mg/g)References
Chitosan–graphite oxide64.935[59]
NaOH-treated almond shell123[60]
Surfactant-modified alumina254[61]
Grafted polyacrylamide on SiO2 nanocomposites378.8[62]
Fe3O4/porous graphene460[63]
rGO/Fe/Ni composites2000This study
Table 11. Kinetic parameters for the adsorption of CV onto the rGO/Fe/Ni composites.
Kinetic ModelsParametersValues of Parameters
Pseudo-first-orderk1 (1/min)0.18
qe (mg/g)953.89
R20.9091
Pseudo-second-orderk2 (g/mg/min)2.0 × 10−3
qe (mg/g)1111.11
R20.9946
Intraparticle diffusionk3(mg/g/min1/2)128.04
B (mg/g)364.18
R20.957
Elovichα (mg/g/min)733.34
β (g/mg)4.5 × 10−2
R20.9724
Table 12. The thermodynamic parameters for the adsorption of CV onto rGO/Fe/Ni composites.
KΔG0 (KJ/mol)ΔS0 (kJ/mol/K)ΔH0 (kJ/mol)
293−5.08500.148038.2450
303−5.9120
313−6.5544
323−6.9719

