Article

Chlorophyll Fluorescence Imaging Analysis for Elucidating the Mechanism of Photosystem II Acclimation to Cadmium Exposure in the Hyperaccumulating Plant Noccaea caerulescens

1
Division of Botany, Department of Biology, Faculty of Science, Istanbul University, 34134 Istanbul, Turkey
2
Department of Plant and Environmental Sciences, University of Copenhagen, Thorvaldsensvej 40, DK-1871 Frederiksberg C, Denmark
3
Department of Botany, Aristotle University of Thessaloniki, 54124 Thessaloniki, Greece
*
Author to whom correspondence should be addressed.
Materials 2018, 11(12), 2580; https://doi.org/10.3390/ma11122580
Submission received: 11 November 2018 / Revised: 12 December 2018 / Accepted: 13 December 2018 / Published: 18 December 2018
(This article belongs to the Special Issue The Role of Metal Ions in Biology, Biochemistry and Medicine)

Abstract

:
We provide new data on the mechanism of Noccaea caerulescens acclimation to Cd exposure by elucidating the process of photosystem II (PSII) acclimation by chlorophyll fluorescence imaging analysis. Seeds from the metallophyte N. caerulescens were grown in hydroponic culture for 12 weeks before exposure to 40 and 120 μM Cd for 3 and 4 days. At the beginning of exposure to 40 μM Cd, we observed a spatial leaf heterogeneity of decreased PSII photochemistry, that later recovered completely. This acclimation was achieved possibly through the reduced plastoquinone (PQ) pool signaling. Exposure to 120 μM Cd under the growth light did not affect PSII photochemistry, while under high light due to a photoprotective mechanism (regulated heat dissipation for protection) that down-regulated PSII quantum yield, the quantum yield of non-regulated energy loss in PSII (ΦNO) decreased even more than control values. Thus, N. caerulescens plants exposed to 120 μM Cd for 4 days exhibited lower reactive oxygen species (ROS) production as singlet oxygen (1O2). The response of N. caerulescens to Cd exposure fits the ‘Threshold for Tolerance Model’, with a lag time of 4 d and a threshold concentration of 40 μM Cd required for the induction of the acclimation mechanism.

Graphical Abstract

1. Introduction

Cadmium is a non-essential heavy metal that can occur in the environment in high concentrations as a consequence of numerous human activities, thus becoming toxic to all organisms [1,2,3,4,5]. Plants have developed several exclusive and effective mechanisms for Cd detoxification and tolerance, including control of Cd influx and acceleration of Cd efflux, Cd chelation and sequestration, Cd remobilization, and scavenging of Cd-induced reactive oxygen species [5,6,7,8,9,10].
Hyperaccumulators are plant species that vigorously take up heavy metals, translocate them into the above-ground parts and isolate them into a risk-free state [4,11]. These plants can accumulate several percent of heavy metals in their dry mass [4]. Hyperaccumulators also have to stock the absorbed heavy metal in a manner that is not detrimental to vital enzymes and especially photosynthesis [12,13]. Hyperaccumulators can be used for phytoremediation and also for phytomining [4,14,15,16]. Phytoremediation is a cost-effective and environmentally-friendly technology that uses plants to remove the toxic metals from soils; it has been widely used in practice [14,17].
Noccaea caerulescens is known as a zinc–cadmium–nickel hyperaccumulator because it can accumulate these metals at extremely high concentrations in its aboveground tissues [18], and has been proposed as an ideal species for examining metal tolerance and hyperaccumulation [19]. It has recently gained a lot of attention due to its potential use in phytoremediation and phytomining [20,21]. Certain ecotypes of N. caerulescens can store as much as 14,000 μg Cd g−1 dry biomass without showing toxicity signs [22,23,24]. Cadmium concentrations in the leaves above 0.01% dry biomass are considered extraordinary and are the limit level for Cd hyperaccumulation [24,25].
Photosynthesis has been shown to be very sensitive to Cd either directly or indirectly [4,26,27,28,29,30,31]. A Cd-induced decrease in photosynthetic efficiency may result from disturbances in the electron transport [32,33], enzymatic activities involved in CO2 fixation [34,35], or from stomatal closure [36,37]. Photosystem II (PSII) is extremely sensitive to Cd that exerts multiple effects on both donor (it inhibits oxygen evolution) and acceptor sites (it inhibits electron transfer from quinone A, QA to quinone B, QB) [28,33,38,39]. The less susceptible component of the photosynthetic apparatus to Cd is thought to be PSI [28,40].
We investigated photosynthetic acclimation to Cd toxicity using the hyperaccumulator Noccaea caerulescens. Our previous study indicated that despite the substantial high toxicity levels of Zn and Cd in N. caerulescens aboveground tissues, the photochemical energy use at PSII did not differ compared to controls [13]. However, the underlying mechanism of photosynthetic acclimation has not been elucidated. In the present study, in order to investigate the mechanism of N. caerulescens acclimation to Cd exposure and to clarify the process of photosynthetic acclimation, we treated in hydroponic culture N. caerulescens plants with 40 and 120 μM Cd for 3 and 4 days.

2. Materials and Methods

2.1. Seed Collection and Experimental Design

Seeds of Noccaea caerulescens F.K. Mey collected from a former Copper Mine area at Røros (Norway) were cultivated hydroponically in an environmental growth chamber as described previously [13].
After growth for 12 weeks, some plants were exposed to 40 or 120 μM Cd (supplied as 3CdSO4.8H2O) for 3 and 4 days while others were left to control growth conditions.

2.2. Chlorophyll Fluorescence Imaging Analysis

Chlorophyll fluorescence measurements were carried out with an Imaging-PAM Chlorophyll Fluorometer (Walz, Effeltrich, Germany) in dark-adapted leaves (15 min) of N. caerulescens plants, grown at 0 (control), 40 or 120 μM Cd for 3 and 4 days, as described previously [13,41]. Five leaves were measured from five different plants with eight areas of interest in each leaf. Two light intensities were selected for chlorophyll fluorescence measurements, a low light intensity that was similar to the growth light (300 μmol photons m−2 s−1, GL) and a high light intensity (1000 μmol photons m−2 s−1, HL, more than three times that of the growth light). The measured and calculated chlorophyll fluorescence parameters with their definitions are given in Table 1.
Representative results of the measured chlorophyll fluorescence parameters are also displayed as color-coded images.

2.3. Statistical Analyses

All measurements that are expressed as mean ± SD were analyzed by student t-test (p < 0.05). Five leaves from five different plants were analyzed in each treatment. In all graphs, the error bars are standard deviations, while columns with the same letter are not statistically different at p < 0.05.

3. Results

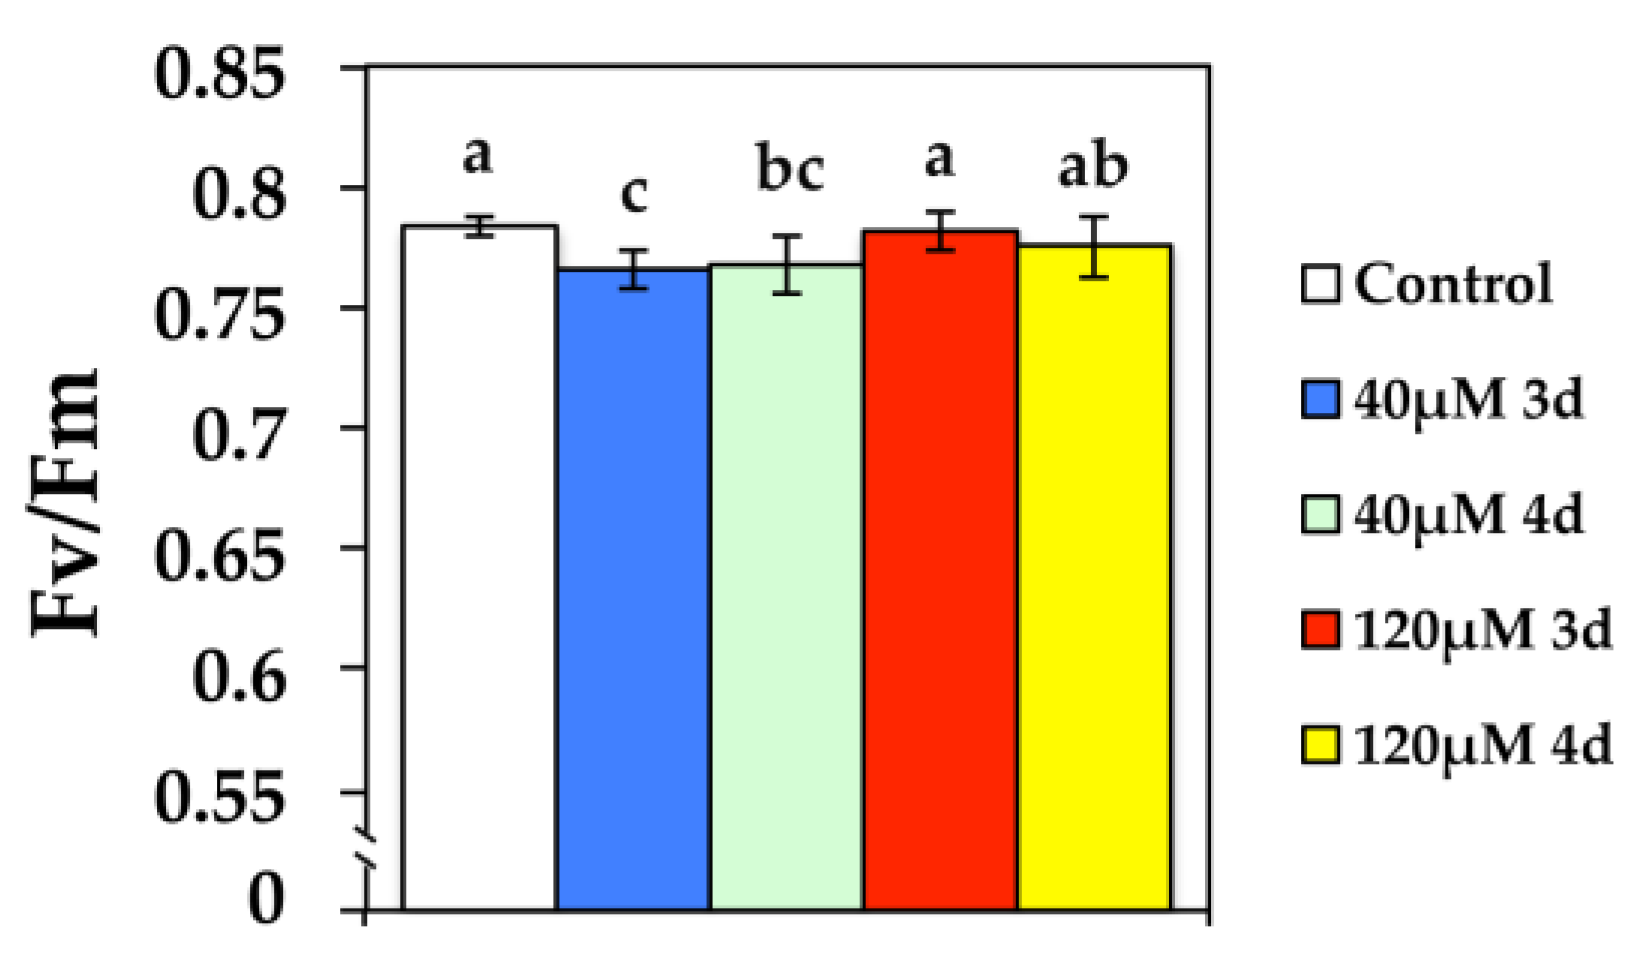
3.1. Changes in the Maximum Quantum Efficiency of PSII Photochemistry after Cd Exposure

At the beginning of exposure to 40 μM Cd, the maximum quantum efficiency of PSII photochemistry (Fv/Fm) in N. caerulescens decreased significantly but increased to control values at 120 μM Cd (Figure 1).

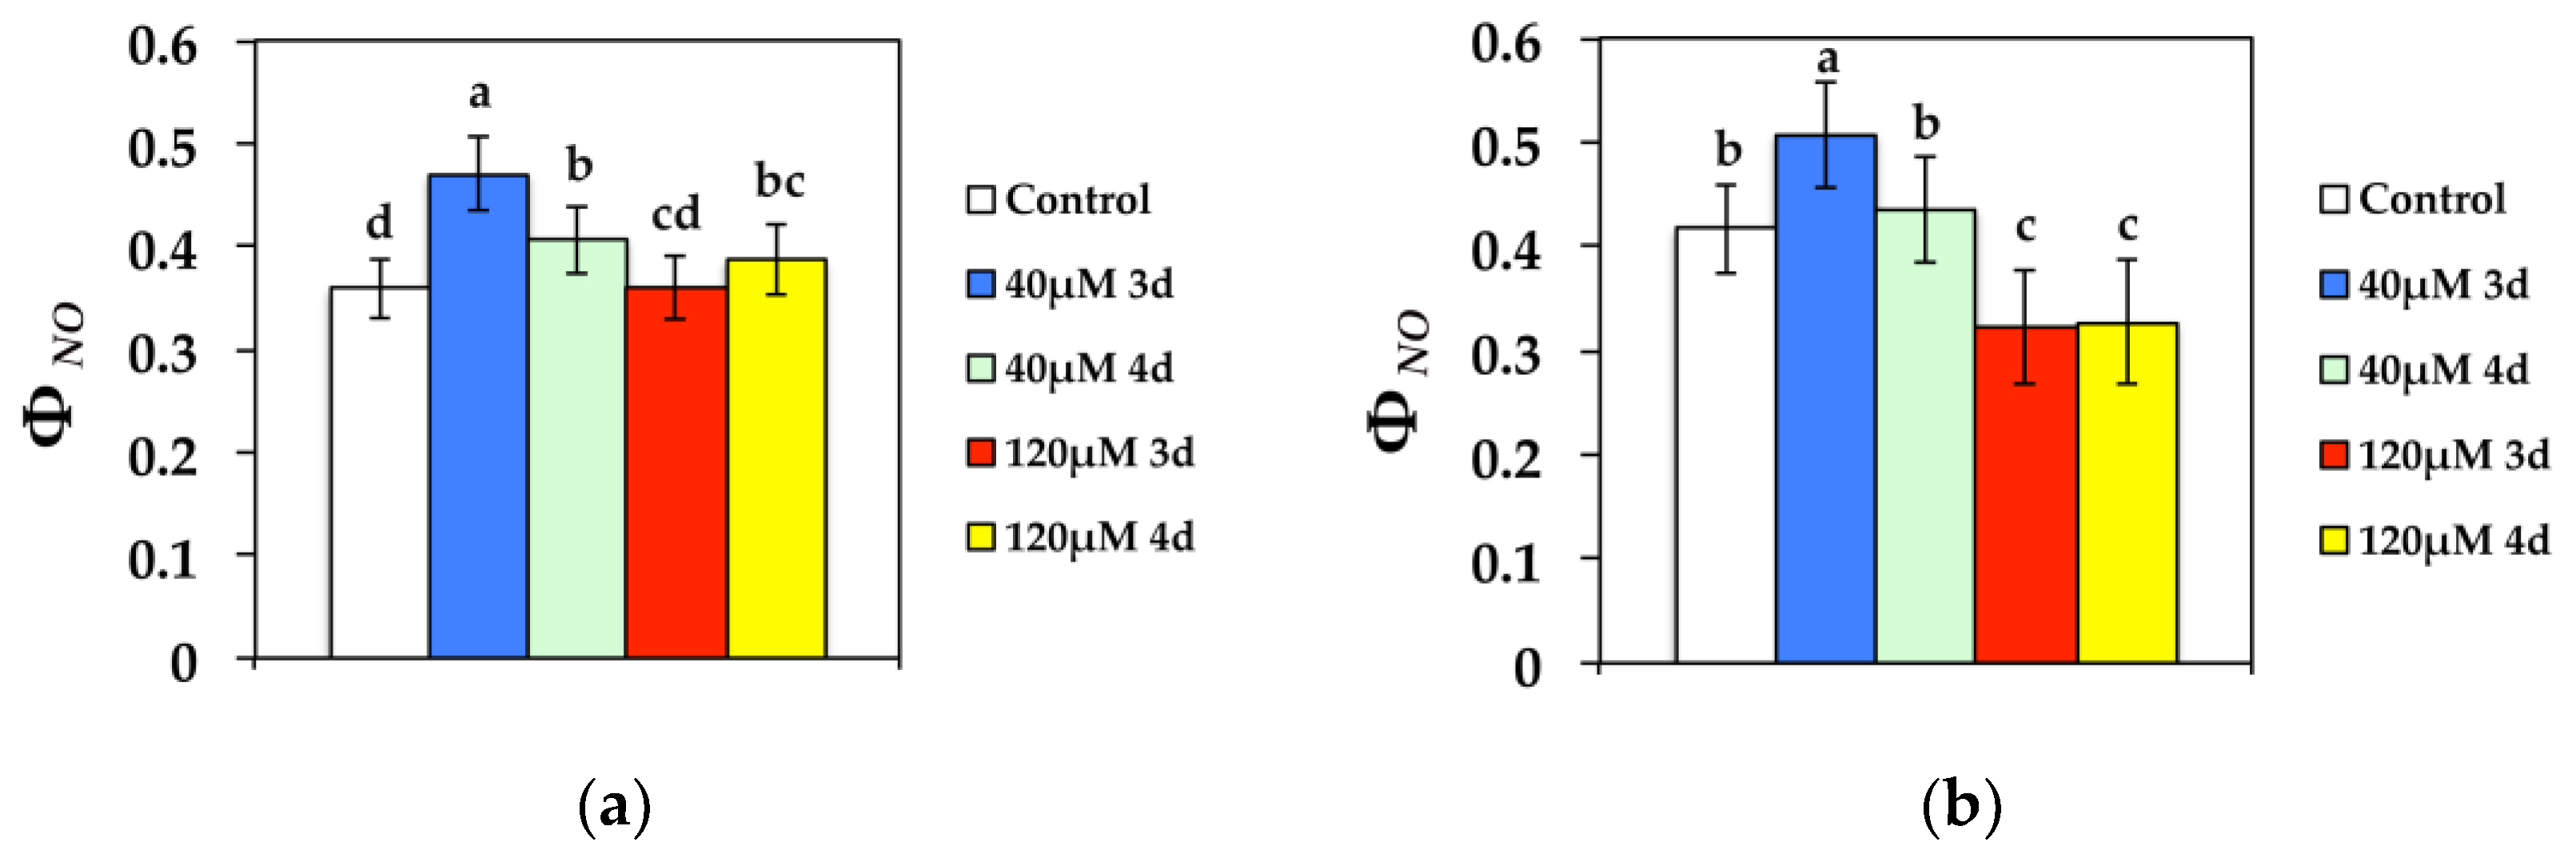
3.2. Changes in the Allocation of Absorbed Light Energy in PSII after Cd Exposure

The quantum yield of photochemical energy conversion in PSII (ΦPSII), at both growth light (GL) and high light (HL) intensity decreased significantly compared to the control, after 3 d at 40 μM Cd, while it improved during the 4 d (Figure 2). However, ΦPSII increased to control values after 3 d at 120 μM Cd at GL and stabilized to control values after 4 days of exposure (Figure 2a). High light (HL) exposure to 120 μM Cd resulted in decreased ΦPSII compared to controls (Figure 2b).
The quantum yield of regulated non-photochemical energy loss in PSII (ΦNPQ) decreased significantly compared to the control after 3 d at 40 μM Cd at GL and increased to control values during the 4 d (Figure 3a). Exposure to 120 μM Cd resulted in decreased ΦNPQ at GL compared to controls during the 4 d (Figure 3a). At HL, ΦNPQ remained unchanged at 40 μM Cd, but increased significantly at 120 μM Cd (Figure 3b).
The quantum yield of non-regulated energy loss in PSII (ΦNO), a loss process due to PSII inactivity, at both GL and HL intensity, increased significantly compared to the control after 3 d exposure to 40 μM Cd, while during the 4 d it decreased compared to 3 d (Figure 4). After exposure to 120 μM Cd for 3 d at GL, ΦNO retained the same values compared to the controls, but increased during the 4 d (Figure 4a). However, ΦNO decreased more than the control values at 120 μM Cd at HL (Figure 4b).

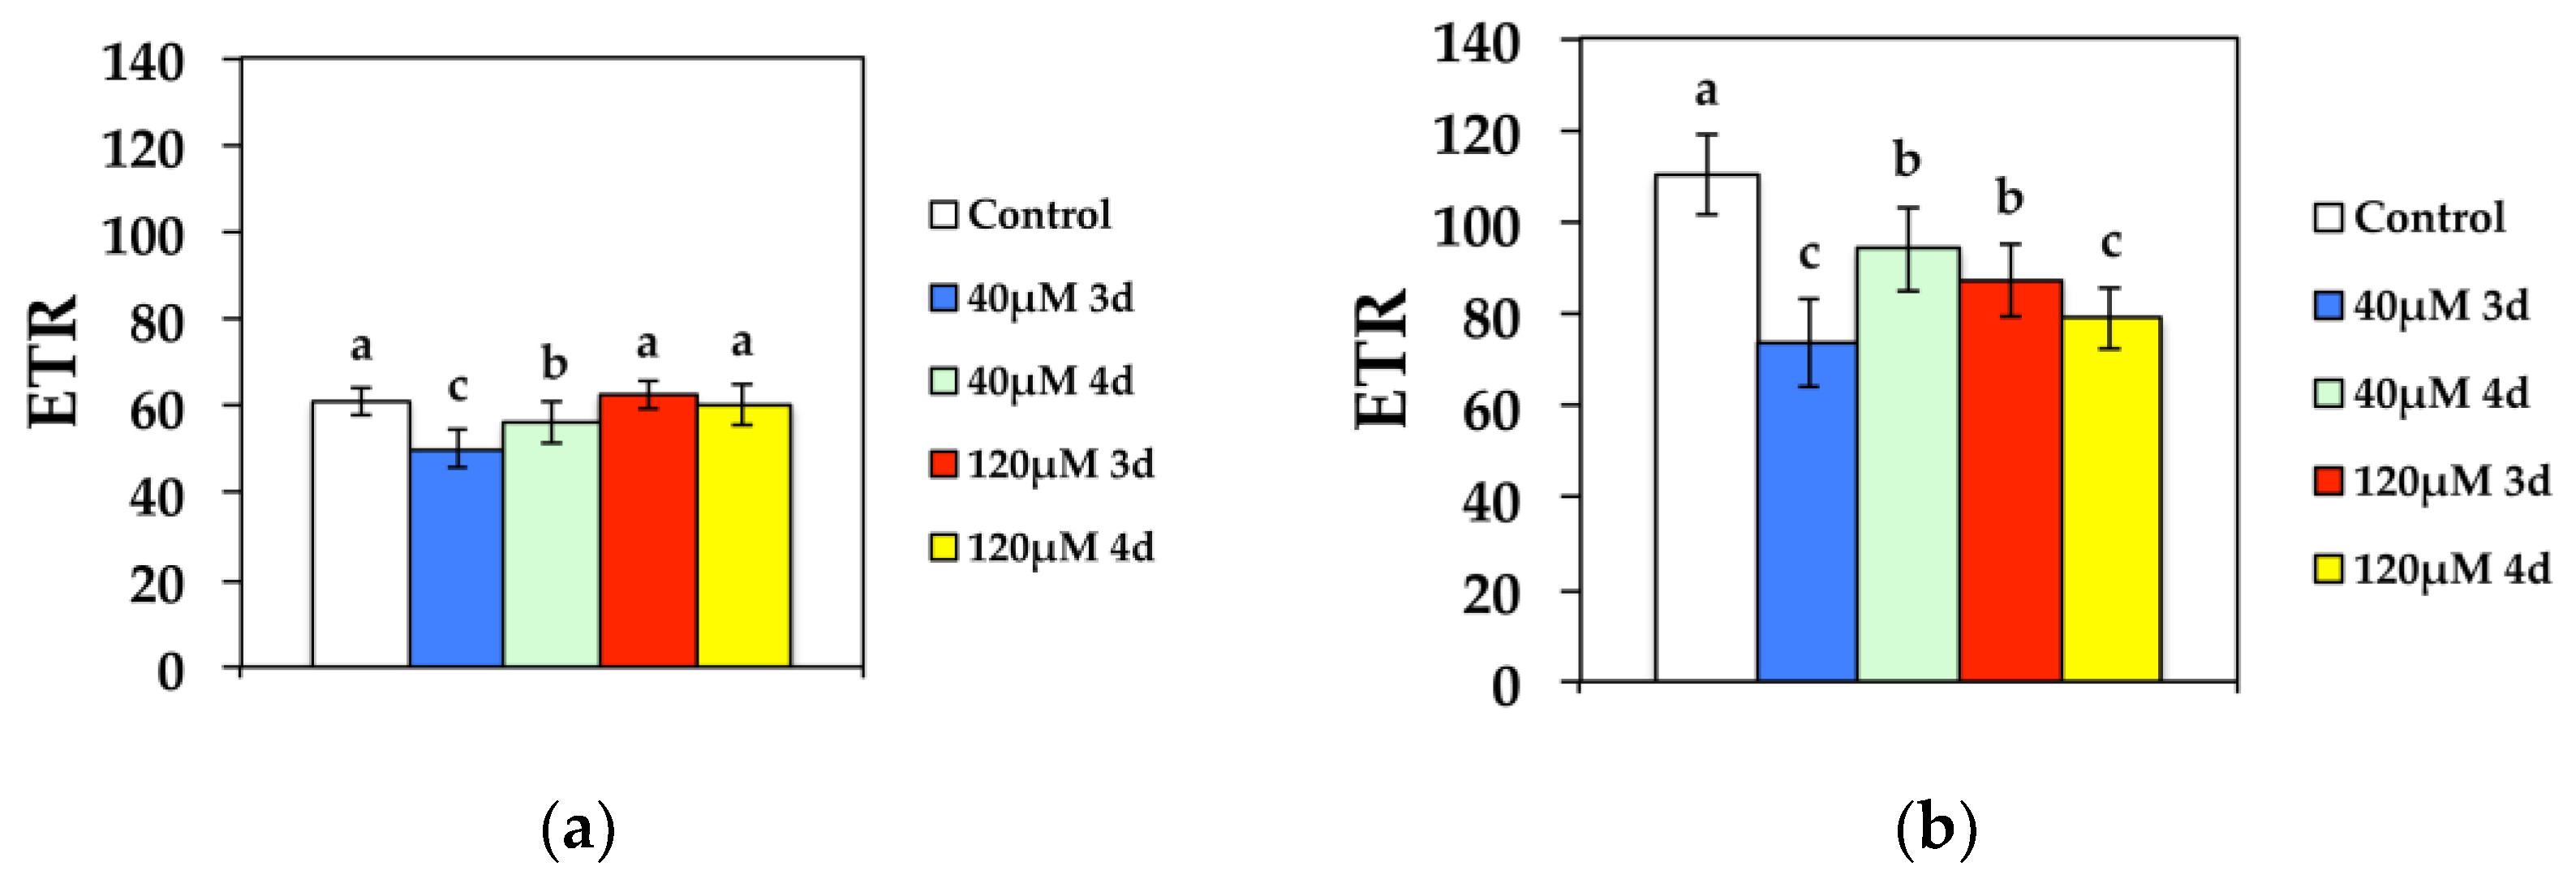
3.3. Non-Photochemical Quenching and Electron Transport Rate in Response to Cd

Non-photochemical quenching (NPQ) that reflects heat dissipation of excitation energy, decreased significantly compared to the control after 3 d at 40 μM Cd at GL, while it improved during the 4 d (Figure 5a). Exposure to 120 μM Cd resulted in decreased NPQ at GL compared to controls during the 4 d (Figure 5a). At HL, NPQ decreased significantly compared to the control after 3 d exposure to 40 μM Cd, and increased to control values during the 4 d, while after exposure to 120 μM Cd increased significantly compared to the controls (Figure 5b).
The electron transport rate (ETR), at both GL and HL intensity, decreased significantly compared to the control after 3 d at 40 μM Cd, while it improved during the 4 d (Figure 6). However, ETR increased to control values after 3 d exposure to 120 μM Cd at GL and stabilized to control values after 4 d exposure (Figure 6a). High light exposure to 120 μM Cd resulted in decreased ETR compared to the controls (Figure 6b).

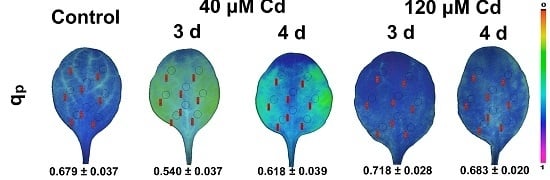
3.4. Changes in the Redox State of PSII after Cd Exposure

The redox state of QA (qP) that is a measure of the fraction of open PSII reaction centers, at both GL and HL intensity, decreased significantly compared to the control after 3 d at 40 μM Cd, while it improved during the 4 d (Figure 7). However, qP increased to control values after 3 d exposure to 120 μM Cd at GL and stabilized to control values after 4 d exposure (Figure 7a). High light exposure to 120 μM Cd resulted in a more reduced redox state of QA compared to controls, i.e., a lower fraction of open PSII reaction centers (Figure 7b).

3.5. Spatiotemporal Variation of PSII Responses to Cd Exposure

The major veins (mid-vein, first- and second-order veins) in N. caerulescens leaves grown under control growth conditions at both GL and HL defined areas with a lower fraction of open PSII reaction centers or a more reduced redox state of QA, while mesophyll cells expressed larger spatial heterogeneity with a larger fraction of open PSII reaction centers or a more oxidized redox state (Figure 8e and Figure 9d).
The maximum quantum efficiency of PSII photochemistry (Fv/Fm) show the smallest spatial heterogeneity even though it decreased significantly at 40 μM Cd and increased to control values at 120 μM Cd (Figure 8a). The quantum yield of photochemical energy conversion in PSII (ΦPSII) decreased significantly after 3 d at 40 μM Cd at GL, while it improved during the 4 d, showing a high spatiotemporal leaf heterogeneity (Figure 8b). Among the chlorophyll fluorescence parameters with high spatiotemporal heterogeneity observed at GL, were the images of the quantum yield of non-regulated energy dissipated in PSII (non-regulated heat dissipation, a loss process due to PSII inactivity) (ΦNO) (Figure 8d) and the images of the redox state of the PQ pool (qP) (Figure 8e). The most severely affected leaf area after 3 d at 40 μM Cd, was the left and right leaf side, while the central area was less affected (Figure 8d,e). At the left and right leaf side after 3 d exposure to 40 μM Cd, the quantum yield of non-regulated energy loss in PSII (ΦNO) increased; thus, these areas exhibited increased singlet oxygen (1O2) production (Figure 8d), and also presented the lower qP values (Figure 8e). However, in the left and right leaf side after 4 d exposure to Cd, ΦNO decreased (Figure 8d) and the redox state of the PQ pool increased (qP) (Figure 8e). At exposure to 120 μM Cd at GL, leaf spatial heterogeneity decreased, and both ΦNO (Figure 8d) and qP (Figure 8e) stabilized to control values.
Exposure of N. caerulescens to HL increased the spatiotemporal leaf heterogeneity (Figure 9) and the plants suffered more from Cd toxicity during the 3 d of exposure to 40 μM Cd, but they recovered during the 4 d. However, exposure to 120 μM Cd at HL revealed mild effects. This was realized by an increase in ΦNPQ (Figure 9b) that down-regulated PSII quantum yield (ΦPSII) (Figure 9a) and decreased the quantum yield of non-regulated energy loss in PSII (ΦNO) (Figure 9c).

4. Discussion

The type of damage on PSII that has frequently been identified as the main target of Cd toxicity on photosynthesis strongly depends on light conditions [4,43,44,45,46]. At GL, the damage of the PSII function is mainly due to the impairment that results from the replacement by Cd2+ of the Mg2+ ion in the chlorophyll molecules of the light-harvesting complex II, while in HL it is mainly from direct damage to the PSII reaction center [4,44,45,46].
N. caerulescens leaves grown under control growth conditions at both GL and HL show a spatial heterogeneity in PSII functionality (Figure 8 and Figure 9). This spatial heterogeneity may be attributed to ‘patchy stomatal behavior’, in which stomata in adjacent regions exhibit significantly different mean apertures from each other, resulting in significantly different stomatal conductance (gs) [47,48]. Stomatal conductance decreases when the stomata close; this is used as an indicator of the extent of stomatal opening [49,50]. It is assumed that spatial variation in the quantum efficiency of PSII photochemistry (ΦPSII) arises from local differences in internal CO2 concentrations, which in turn result from changes in stomatal conductance due to patchy stomatal behavior [51]. A body of evidence suggests that patterns of ΦPSII can be used to calculate stomatal conductance [51,52,53,54,55].
At the beginning of exposure to 40 μM, Cd ΦPSII decreased significantly at the left and right leaf sides (Figure 8b and Figure 9a), with a simultaneous decrease in ΦNPQ (Figure 8c and Figure 9b) resulting in an increase of the quantum yield of non-regulated non-photochemical energy loss (ΦNO) (Figure 8d and Figure 9c). The increase in ΦNO indicates that photochemical energy conversion and photoprotective regulatory mechanism were insufficient, pointing to serious problems of the plant to cope with the absorbed light energy [56,57]. ΦNO consists of chlorophyll fluorescence internal conversions and intersystem crossing, which indicate the formation of singlet oxygen (1O2) via the triplet state of chlorophyll (3chl *) [13,58,59]. After 3 d exposure to 40 μM Cd, N. caerulescens leaves exhibited increased 1O2 production at the left and right leaf sides, since ΦNO increased significantly at those areas. Thus, although Cd2+ is a redox-inert element, it produces reactive oxygen species [28]. The simultaneous reduced PQ pool that was observed mainly at the left and right leaf sides mediated stomatal closure probably through the generation of mesophyll chloroplastic hydrogen peroxide (H2O2) [60]. The stomatal closure at these areas implies decreased transpiration rates that slow down Cd supply.
During the 4 d exposure to 40 μM Cd, ΦPSII increased at the left and right leaf sides (Figure 8b and Figure 9a), with a simultaneous increase in ΦNPQ (Figure 8c and Figure 9b) resulting in a decrease of ΦNO (Figure 8d and Figure 9c) compared to 3 d exposure. This response is attributed to both the possible Cd detoxification mechanism achieved by vacuolar sequestration, that seems to be the main mechanism for Cd detoxification [61,62,63], and to the reduced plastoquinone (PQ) pool that mediated stomatal closure and decreased Cd supply at the affected leaf area, leading to the acclimation of N. caerulescens to Cd exposure. Under exposure to 120 μM Cd at HL, the quantum yield of non-regulated energy loss in PSII (ΦNO) decreased even more than control values, and thus exhibited lower singlet oxygen (1O2) production. This was due to the photoprotective mechanism that can divert absorbed light to other processes such as thermal dissipation, preventing the photosynthetic apparatus from oxidative damage [64,65,66,67,68,69,70].
The observed spatial heterogeneity in the quantum yield of linear electron transport (ΦPSII) in N. caerulescens leaves exposed to 40 μM Cd for 3 d (Figure 8b and Figure 9a) is in accordance to elemental imaging using laser ablation inductively-coupled plasma mass spectrometry, performed on whole leaves of the hyperaccumulator N. caerulescens that revealed differences in the supply of Cd over the whole leaf area, suggesting a heterogeneous distribution across the leaf [71]. Useful information can be obtained by combining chlorophyll fluorescence images, followed by laser ablation inductively-coupled plasma mass spectrometry on whole leaves of the hyperaccumulator N. caerulescens exposed to Cd.
It seems that spatiotemporal variations in the redox state of the PQ pool related to stomatal conductance, an indicator of the extent of stomatal opening [50], are interconnected to the heterogeneous distribution of Cd over the entire leaf area [71]. Thus, the spatial heterogeneity in the redox state of the PQ pool throughout the whole leaf area (Figure 8e and Figure 9d) reveals a spatial supply of Cd across the leaf. Recently, Cd2+ root influx has been shown to exhibit spatiotemporal patterns [72]. A heterogeneous distribution of a reduced PQ pool gives rise to a spatial distribution of H2O2 accumulation [73]. Still, reactive oxygen species (O2, H2O2) production corresponds to spatial accumulation metal patterns [74].
In our work, the response of N. caerulescens to Cd exposure fits the ‘Threshold for Tolerance Model’, with a lag time or/and a threshold concentration required for the induction of a tolerance mechanism [75,76,77,78]. Concurrent to this model, mild stress or short exposure times can produce significant effects on plants, while moderate stress or longer exposure times have less or no effect [79]. In accordance with this model, 40 μM Cd and 3d exposure time caused significant effects on PSII functioning, while 120 μM Cd or 4d exposure time have less or no effect. A lag-time of 4d exposure to 40 μM Cd was required for N. caerulescens to activate stress-coping mechanisms.

5. Conclusions

Acclimation to Cd exposure was achieved through the possible Cd detoxification mechanism done by vacuolar sequestration and the reduced plastoquinone (PQ) pool signaling that mediated stomatal closure and decreased Cd supply at the affected leaf area. The response of N. caerulescens to Cd exposure fits the ‘Threshold for Tolerance Model’, with a lag time of 4 d and a threshold concentration of 40 μM Cd required for the induction of the acclimation mechanism through the reduced PQ pool that mediated stomatal closure probably by the generation of mesophyll chloroplastic hydrogen peroxide (H2O2) [60], which acts as a fast acclimation signaling molecule [73,80], as well as activates the Cd detoxification mechanism through vacuolar sequestration [61,62,63]. The mode of Cd damage on PSII strongly depends on the irradiance conditions [4,43,44,45,46]. Chlorophyll fluorescence imaging analysis is a non-invasive tool to assess the physiological status of plants and detect the impacts of environmental stress [81,82,83], permitting also the visualization of the spatiotemporal variations in PSII efficiency [76]. As it was shown in our experiments, it is also capable of elucidating the mechanism of photosystem II acclimation to Cd exposure.

Author Contributions

G.B. and M.M. conceived and designed the experiments and analyzed the data; J.M. and N.G. performed the experiments and analyzed the data; M.M. wrote the paper; All authors review and approved the manuscript.

Funding

This research was funded by the Istanbul University Scientific Research Projects Thesis-2015-44682 and BEK-2016-21903.

Conflicts of Interest

The authors declare no conflict of interest. The funders had no role in the design of the study; in the collection, analyses, or interpretation of data; in the writing of the manuscript, and in the decision to publish the results.

References

  1. Lagerwerff, J.V.; Specht, A.W. Contamination of roadside soil and vegetation with cadmium, nickel, lead, and zinc. Environ. Sci. Technol. 1970, 4, 583–586. [Google Scholar] [CrossRef]
  2. Buchauer, M.J. Contamination of soil and vegetation near a zinc smelter by zinc, cadmium, copper, and lead. Environ. Sci. Technol. 1973, 7, 131–135. [Google Scholar] [CrossRef]
  3. McBride, M.B.; Richards, B.K.; Steenhuis, T.; Russo, J.J.; Sauvé, S. Mobility and solubility of toxic metals and nutrients in soil fifteen years after sewage sludge application. Soil Sci. 1997, 162, 487–500. [Google Scholar] [CrossRef]
  4. Küpper, H.; Parameswaran, A.; Leitenmaier, B.; Trtílek, M.; Šerlík, I. Cadmium induced inhibition of photosynthesis and long-term acclimation to cadmium stress in the hyperaccumulator Thlaspi caerulescens. New Phytol. 2007, 175, 655–674. [Google Scholar] [CrossRef] [PubMed]
  5. Yao, X.; Cai, Y.; Yu, D.; Liang, G. bHLH104 confers tolerance to cadmium stress in Arabidopsis thaliana. J. Integr. Plant Biol. 2018, 60, 691–702. [Google Scholar] [CrossRef] [PubMed]
  6. Hall, J.L. Cellular mechanisms for heavy metal detoxification and tolerance. J. Exp. Bot. 2002, 53, 1–11. [Google Scholar] [CrossRef] [PubMed] [Green Version]
  7. Kim, D.Y.; Bovet, L.; Maeshima, M.; Martinoia, E.; Lee, Y. The ABC transporter AtPDR8 is a cadmium extrusion pump conferring heavy metal resistance. Plant J. 2007, 50, 207–218. [Google Scholar] [CrossRef] [PubMed] [Green Version]
  8. Dalcorso, G.; Farinati, S.; Furini, A. Regulatory networks of cadmium stress in plants. Plant Signal. Behav. 2010, 5, 663–667. [Google Scholar] [CrossRef] [PubMed] [Green Version]
  9. Lin, Y.F.; Aarts, M.G. The molecular mechanism of zinc and cadmium stress response in plants. Cell Mol. Life Sci. 2012, 69, 3187–3206. [Google Scholar] [CrossRef] [PubMed]
  10. Shi, Y.Z.; Zhu, X.F.; Wan, J.X.; Li, G.X.; Zheng, S.J. Glucose alleviates cadmium toxicity by increasing cadmium fixation in root cell wall and sequestration into vacuole in Arabidopsis. J. Integr. Plant Biol. 2015, 57, 830–837. [Google Scholar] [CrossRef] [PubMed]
  11. Brooks, R.R.; Lee, J.; Reeves, R.D.; Jaffre, T. Detection of nickeliferous rocks by analysis of herbarium species of indicator plants. J. Geochem. Explor. 1977, 7, 49–57. [Google Scholar] [CrossRef]
  12. Leitenmaier, B.; Küpper, H. Cadmium uptake and sequestration kinetics in individual leaf cell protoplasts of the Cd/Zn hyperaccumulator Thlaspi caerulescens. Plant Cell Environ. 2011, 34, 208–219. [Google Scholar] [CrossRef] [PubMed]
  13. Bayçu, G.; Gevrek-Kürüm, N.; Moustaka, J.; Csatári, I.; Rognes, S.E.; Moustakas, M. Cadmium-zinc accumulation and photosystem II responses of Noccaea caerulescens to Cd and Zn exposure. Environ. Sci. Pollut. Res. 2017, 24, 2840–2850. [Google Scholar] [CrossRef] [PubMed]
  14. Baker, A.J.M.; McGrath, S.P.; Sidoli, C.M.D.; Reeves, R.D. The possibility of situ heavy metal decontamination of polluted soils using crops of metal-accumulating plants. Resour. Conserv. Recycl. 1994, 11, 41–49. [Google Scholar] [CrossRef]
  15. McGrath, S.P.; Zhao, F.J. Phytoextraction of metals and metalloids from contaminated soils. Curr. Opin. Biotechnol. 2003, 14, 277–282. [Google Scholar] [CrossRef]
  16. Chaney, R.L.; Angle, J.S.; McIntosh, M.S.; Reeves, R.D.; Li, Y.M.; Brewer, E.P.; Chen, K.Y.; Roseberg, R.J.; Perner, H.; Synkowski, E.C.; et al. Using hyperaccumulator plants to phytoextract Soil Ni and Cd. Z. Naturforsch. C 2005, 60, 190–198. [Google Scholar] [PubMed]
  17. Zhang, X.D.; Wang, Y.; Li, H.B.; Yang, Z.M. Isolation and identification of rapeseed (Brassica napus) cultivars for potential higher and lower Cd accumulation. J. Plant Nutr. Soil Sci. 2018, 181, 479–487. [Google Scholar] [CrossRef]
  18. Escarré, J.; Lefèbvre, C.; Gruber, W.; Leblanc, M.; Lepart, J.; Rivière, Y.; Delay, B. Zinc and cadmium hyperaccumulation by Thlaspi caerulescens from metalliferous and nonmetalliferous sites in the Mediterranean area: Implications for phytoextraction. New Phytol. 2000, 145, 429–437. [Google Scholar]
  19. Assunção, A.G.L.; Bookum, W.M.; Nelissen, H.J.M.; Vooijs, R.; Schat, H.; Ernst, W.H.O. Differential metal-specific tolerance and accumulation patterns among Thlaspi caerulescens populations originating from different soil types. New Phytol. 2003, 159, 411–419. [Google Scholar] [CrossRef]
  20. Escarré, J.; Lefèbvre, C.; Frérot, H.; Mahieu, S.; Noret, N. Metal concentration and metal mass of metallicolous, non metallicolous and serpentine Noccaea caerulescens populations, cultivated in different growth media. Plant Soil 2013, 370, 197–221. [Google Scholar] [CrossRef]
  21. Mousset, M.; David, P.; Petit, C.; Pouzadoux, J.; Hatt, C.; Flaven, E.; Ronce, O.; Mignot, A. Lower selfing rates in metallicolous populations than in non-metallicolous populations of the pseudometallophyte Noccaea caerulescens (Brassicaceae) in Southern France. Ann. Bot. 2016, 117, 507–519. [Google Scholar] [CrossRef] [PubMed]
  22. Lasat, M.M.; Pence, N.S.; Garvin, D.F.; Ebbs, S.D.; Kochian, L.V. Molecular physiology of zinc transport in the Zn hyperaccumulator Thlaspi caerulescens. J. Exp. Bot. 2000, 51, 71–79. [Google Scholar] [CrossRef] [PubMed]
  23. Lombi, E.; Zhao, F.J.; Dunham, S.J.; McGrath, S.P. Cadmium accumulation in populations of Thlaspi caerulescens and Thlaspi goesingense. New Phytol. 2000, 145, 11–20. [Google Scholar] [CrossRef]
  24. Assunção, A.G.L.; Schat, H.; Aarts, M.G.M. Thlaspi caerulescens, an attractive model species to study heavy metal hyperaccumulation in plants. New Phytol. 2003, 159, 351–360. [Google Scholar] [CrossRef]
  25. Baker, A.J.M.; McGrath, S.P.; Reeves, D.R.; Smith, J.A.C. Metal hyperaccumulator plants: A review of the ecology and physiology of a biological resource for phytoremediation of metal-polluted soils. In Phytoremediation of Contaminated Soils and Water; Terry, N., Banuelos, G., Eds.; CRC Press: Boca Raton, FL, USA, 2000; pp. 171–188. [Google Scholar]
  26. Greger, M.; Ögren, E. Direct and indirect effects of Cd2+ on photosynthesis in sugar beet (Beta vulgaris). Physiol. Plant. 1991, 83, 129–135. [Google Scholar] [CrossRef]
  27. Ouzounidou, G.; Moustakas, M.; Eleftheriou, E.P. Physiological and ultrastructural effects of cadmium on wheat (Triticum aestivum L.) leaves. Arch. Environ. Contam. Toxicol. 1997, 32, 154–160. [Google Scholar] [CrossRef] [PubMed]
  28. Ekmekçi, Y.; Tanyolaç, D.; Ayhan, B. Effects of cadmium on antioxidant enzyme and photosynthetic activities in leaves of two maize cultivars. J. Plant Physiol. 2008, 165, 600–611. [Google Scholar] [CrossRef] [PubMed]
  29. Liu, C.; Guo, J.; Cui, Y.; Lü, T.; Zhang, X.; Shi, G. Effects of cadmium and salicylic acid on growth, spectral reflectance and photosynthesis of castor bean seedlings. Plant Soil 2011, 344, 131–141. [Google Scholar] [CrossRef]
  30. Parmar, P.; Kumari, N.; Sharma, V. Structural and functional alterations in photosynthetic apparatus of plants under cadmium stress. Bot. Stud. 2013, 54, 45. [Google Scholar] [CrossRef] [PubMed]
  31. Xue, Z.C.; Gao, H.Y.; Zhang, L.T. Effects of cadmium on growth, photosynthetic rate, and chlorophyll content in leaves of soybean seedlings. Biol. Plant. 2013, 57, 587–590. [Google Scholar] [CrossRef]
  32. Baszynski, T.; Wajda, L.; Krol, M.; Wolinska, D.; Krupa, Z.; Tukendorf, A. Photosynthetic activities of cadmium-treated tomato plants. Physiol. Plant. 1980, 48, 365–370. [Google Scholar] [CrossRef]
  33. Sigfridsson, K.G.V.; Bernát, G.; Mamedov, F.; Styring, S. Molecular interference of Cd2+ with Photosystem II. Biochim. Biophys. Acta 2004, 1659, 19–31. [Google Scholar] [CrossRef] [PubMed]
  34. Malik, D.; Sheoran, I.S.; Singh, R. Carbon metabolism in leaves of cadmium treated wheat seedlings. Plant Physiol. Biochem. 1992, 30, 223–229. [Google Scholar]
  35. Krantev, A.; Yordanova, R.; Janda, T.; Szalai, G.; Popova, L. Treatment with salicylic acid decreases the effect of cadmium on photosynthesis in maize plants. J. Plant Physiol. 2008, 165, 920–931. [Google Scholar] [CrossRef] [PubMed]
  36. Poschenrieder, C.; Gunse, B.; Barcelo, J. Influence of cadmium on water relations, stomatal resistance, and abscisic acid content in expanding bean leaves. Plant Physiol. 1989, 90, 1365–1371. [Google Scholar] [CrossRef] [PubMed]
  37. Shi, G.R.; Cai, Q.S. Photosynthetic and anatomic responses of peanut leaves to cadmium stress. Photosynthetica 2008, 46, 627–630. [Google Scholar] [CrossRef]
  38. Krupa, Z.; Moniak, M. The stage of leaf maturity implicates the response of the photosynthetic apparatus to cadmium toxicity. Plant Sci. 1998, 138, 149–156. [Google Scholar] [CrossRef]
  39. Pagliano, C.; Raviolo, M.; Dalla Vecchia, F.; Gabbrielli, R.; Gonnelli, C.; Rascio, N.; Barbato, R.; La Rocca, N. Evidence for PSII-donor-side damage and photoinhibition induced by cadmium treatment on rice (Oryza sativa L.). J. Photochem. Photobiol. B Biol. 2006, 84, 70–78. [Google Scholar] [CrossRef] [PubMed]
  40. Chugh, L.K.; Sawhney, S.K. Photosynthetic activities of Pisum sativum seedlings grown in presence of cadmium. Plant Physiol. Biochem. 1999, 37, 297–303. [Google Scholar] [CrossRef]
  41. Moustaka, J.; Panteris, E.; Adamakis, I.D.S.; Tanou, G.; Giannakoula, A.; Eleftheriou, E.P.; Moustakas, M. High anthocyanin accumulation in poinsettia leaves is accompanied by thylakoid membrane unstacking, acting as a photoprotective mechanism, to prevent ROS formation. Environ. Exp. Bot. 2018, 154, 44–55. [Google Scholar] [CrossRef]
  42. Oxborough, K.; Baker, N.R. Resolving chlorophyll a fluorescence images of photosynthetic efficiency into photochemical and non-photochemical components-calculation of qP and Fv-/Fm- without measuring Fo-. Photosynth. Res. 1997, 54, 135–142. [Google Scholar] [CrossRef]
  43. Cedeno-Maldonado, A.; Swader, J.A.; Heath, R.L. The cupric ion as an inhibitor of photosynthetic electron transport in isolated chloroplasts. Plant Physiol. 1972, 50, 698–701. [Google Scholar] [CrossRef] [PubMed]
  44. Küpper, H.; Küpper, F.; Spiller, M. Environmental relevance of heavy metal substituted chlorophylls using the example of water plants. J. Exp. Bot. 1996, 47, 259–266. [Google Scholar] [CrossRef]
  45. Küpper, H.; Küpper, F.; Spiller, M. In situ detection of heavy metal substituted chlorophylls in water plants. Photosynth. Res. 1998, 58, 125–133. [Google Scholar] [CrossRef]
  46. Küpper, H.; Setlík, I.; Spiller, M.; Küpper, F.C.; Prásil, O. Heavy metal-induced inhibition of photosynthesis: Targets of in vivo heavy metal chlorophyll formation. J. Phycol. 2002, 38, 429–441. [Google Scholar] [CrossRef]
  47. Weyers, J.D.B.; Lawson, T. Heterogeneity in stomatal characteristics. Adv. Bot. Res. 1997, 26, 317–352. [Google Scholar]
  48. Lawson, T.; Morison, J. Visualising patterns of CO2 diffusion in leaves. New Phytol. 2006, 169, 637–640. [Google Scholar] [CrossRef] [PubMed]
  49. Omasa, K.; Hashimoto, Y.; Aiga, I. Observation of stomatal movements of intact plants using an image instrumentation system with a light microscope. Plant Cell Physiol. 1983, 24, 281–288. [Google Scholar] [CrossRef]
  50. Jones, H.G. Use of thermography for quantitative studies of spatial and temporal variation of stomatal conductance over leaf surfaces. Plant Cell Environ. 1999, 22, 1043–1055. [Google Scholar] [CrossRef] [Green Version]
  51. Lawson, T.; Weyers, J. Spatial and temporal variation in gas exchange over the lower surface of Phaseolus vulgaris L. primary leaves. J. Exp. Bot. 1999, 50, 1381–1391. [Google Scholar] [CrossRef]
  52. Eckstein, J.; Beyschlag, W.; Mott, K.A.; Ryel, R.J. Changes in photon flux can induce stomatal patchiness. Plant Cell Environ. 1996, 12, 559–568. [Google Scholar] [CrossRef]
  53. Genty, B.; Meyer, S. Quantitative mapping of leaf photosynthesis using chlorophyll fluorescence imaging. Aust. J. Plant Physiol. 1994, 22, 277–284. [Google Scholar] [CrossRef]
  54. Mott, K.A. Effects of patchy stomatal closure on gas exchange measurements following abscisic acid treatment. Plant Cell Environ. 1995, 18, 1291–1300. [Google Scholar] [CrossRef]
  55. Omasa, K.; Takayama, K. Simultaneous measurement of stomatal conductance, non-photochemical quenching, and photochemical yield of photosystem II in intact leaves by thermal and chlorophyll fluorescence imaging. Plant Cell Physiol. 2003, 44, 1290–1300. [Google Scholar] [CrossRef] [PubMed]
  56. Calatayud, A.; Roca, D.; Martínez, P.F. Spatial–temporal variations in rose leaves under water stress conditions studied by chlorophyll fluorescence imaging. Plant Physiol. Biochem. 2006, 44, 564–573. [Google Scholar] [CrossRef] [PubMed]
  57. Moustakas, M.; Malea, P.; Zafeirakoglou, A.; Sperdouli, I. Photochemical changes and oxidative damage in the aquatic macrophyte Cymodocea nodosa exposed to paraquat-induced oxidative stress. Pest. Biochem. Physiol. 2016, 126, 28–34. [Google Scholar] [CrossRef] [PubMed]
  58. Apel, K.; Hirt, H. Reactive oxygen species: Metabolism, oxidative stress, and signal transduction. Annu. Rev. Plant Biol. 2004, 55, 373–399. [Google Scholar] [CrossRef] [PubMed]
  59. Gawroński, P.; Witoń, D.; Vashutina, K.; Bederska, M.; Betliński, B.; Rusaczonek, A.; Karpiński, S. Mitogen-activated protein kinase 4 is a salicylic acid-independent regulator of growth but not of photosynthesis in Arabidopsis. Mol. Plant 2014, 7, 1151–1166. [Google Scholar] [CrossRef] [PubMed]
  60. Wang, W.H.; He, E.M.; Chen, J.; Guo, Y.; Chen, J.; Liu, X.; Zheng, H.L. The reduced state of the plastoquinone pool is required for chloroplast-mediated stomatal closure in response to calcium stimulation. Plant J. 2016, 86, 132–144. [Google Scholar] [CrossRef] [PubMed]
  61. Küpper, H.; Mijovilovich, A.; Meyer-klaucke, W.; Kroneck, P.M.H. Tissue- and age-dependent differences in the complexation of cadmium and zinc in the cadmium/zinc hyperaccumulator Thlaspi caerulescens (Ganges Ecotype) revealed by X-ray absorption spectroscopy. Plant Physiol. 2004, 134, 748–757. [Google Scholar]
  62. Ma, J.F.; Ueno, D.; Zhao, F.J.; McGrath, S.P. Subcellular localization of Cd and Zn in the leaves of a Cd-hyperaccumulating ecotype of Thlaspi caerulescens. Planta 2005, 220, 731–736. [Google Scholar] [CrossRef] [PubMed]
  63. Ebbs, S.D.; Zambrano, M.C.; Spiller, S.M.; Newville, M. Cadmium sorption, influx, and efflux at the mesophyll layer of leaves from ecotypes of the Zn/Cd hyperaccumulator Thlaspi caerulescens. New Phytol. 2009, 181, 626–636. [Google Scholar] [CrossRef] [PubMed]
  64. Demmig-Adams, B.; Adams, W.W.A., III. Photoprotection in an ecological context: The remarkable complexity of thermal energy dissipation. New Phytol. 2006, 172, 11–21. [Google Scholar] [CrossRef] [PubMed]
  65. Moustaka, J.; Moustakas, M. Photoprotective mechanism of the non-target organism Arabidopsis thaliana to paraquat exposure. Pest. Biochem. Physiol. 2014, 111, 1–6. [Google Scholar] [CrossRef] [PubMed]
  66. Agathokleous, E. Environmental hormesis, a fundamental non-monotonic biological phenomenon with implications in ecotoxicology and environmental safety. Ecotoxicol. Environ. Saf. 2018, 148, 1042–1053. [Google Scholar] [CrossRef]
  67. Georgieva, K.; Doncheva, S.; Mihailova, G.; Petkova, S. Response of sun- and shade-adapted plants of Haberlea rhodopensis to desiccation. Plant Growth Regul. 2012, 67, 121–132. [Google Scholar] [CrossRef]
  68. Jusovic, M.; Velitchkova, M.Y.; Misheva, S.P.; Börner, A.; Apostolova, E.L.; Dobrikova, A.G. Photosynthetic responses of a wheat mutant (Rht-B1c) with altered DELLA proteins to salt stress. J. Plant Growth Regul. 2018, 37, 645–656. [Google Scholar] [CrossRef]
  69. Moustaka, J.; Ouzounidou, G.; Sperdouli, I.; Moustakas, M. Photosystem II is more sensitive than photosystem I to Al3+ induced phytotoxicity. Materials 2018, 11, 1772. [Google Scholar] [CrossRef] [PubMed]
  70. Moustaka, J.; Ouzounidou, G.; Bayçu, G.; Moustakas, M. Aluminum resistance in wheat involves maintenance of leaf Ca2+ and Mg2+ content, decreased lipid peroxidation and Al accumulation, and low photosystem II excitation pressure. BioMetals 2016, 29, 611–623. [Google Scholar] [CrossRef] [PubMed]
  71. Callahan, D.L.; Hare, D.J.; Bishop, D.P.; Doble, P.A.; Roessner, U. Elemental imaging of leaves from the metal hyperaccumulating plant Noccaea caerulescens shows different spatial distribution of Ni, Zn and Cd. RSC Adv. 2016, 6, 2337–2344. [Google Scholar] [CrossRef]
  72. Chen, X.; Ouyang, Y.; Fan, Y.; Qiu, B.; Zhang, G.; Zeng, F. The pathway of transmembrane cadmium influx via calcium-permeable channels and its spatial characteristics along rice root. J. Exp. Bot. 2018, 69, 5279–5291. [Google Scholar] [CrossRef] [PubMed]
  73. Antonoglou, O.; Moustaka, J.; Adamakis, I.D.; Sperdouli, I.; Pantazaki, A.; Moustakas, M.; Dendrinou-Samara, C. Nanobrass CuZn nanoparticles as foliar spray non phytotoxic fungicides. ACS Appl. Mater. Interfaces 2018, 10, 4450–4461. [Google Scholar] [CrossRef] [PubMed]
  74. Hanć, A.; Małecka, A.; Kutrowska, A.; Bagniewska-Zadworna, A.; Tomaszewska, B.; Barałkiewicz, D. Direct analysis of elemental biodistribution in pea seedlings by LA-ICP-MS, EDX and confocal microscopy: Imaging and quantification. Microchem. J. 2016, 128, 305–311. [Google Scholar] [CrossRef]
  75. Barceló, J.; Poschenrieder, C. Fast root growth responses, root exudates, and internal detoxification as clues to the mechanisms of aluminium toxicity and resistance: A review. Environ. Exp. Bot. 2002, 48, 75–92. [Google Scholar] [CrossRef]
  76. Sperdouli, I.; Moustakas, M. Spatio-temporal heterogeneity in Arabidopsis thaliana leaves under drought stress. Plant Biol. 2012, 14, 118–128. [Google Scholar] [CrossRef] [PubMed]
  77. Sperdouli, I.; Moustakas, M. Leaf developmental stage modulates metabolite accumulation and photosynthesis contributing to acclimation of Arabidopsis thaliana to water deficit. J. Plant Res. 2014, 127, 481–489. [Google Scholar] [CrossRef] [PubMed]
  78. Moustakas, M.; Malea, P.; Haritonidou, K.; Sperdouli, I. Copper bioaccumulation, photosystem II functioning and oxidative stress in the seagrass Cymodocea nodosa exposed to copper oxide nanoparticles. Environ. Sci. Pollut. Res. 2017, 24, 16007–16018. [Google Scholar] [CrossRef] [PubMed]
  79. Lichtenthaler, H.K. The stress concept in plants: An introduction. Ann. N.Y. Acad. Sci. 1998, 851, 187–198. [Google Scholar] [CrossRef] [PubMed]
  80. Wilson, K.E.; Ivanov, A.G.; Öquist, G.; Grodzinski, B.; Sarhan, F.; Huner, N.P.A. Energy balance, organellar redox status, and acclimation to environmental stress. Can. J. Bot. 2006, 84, 1355–1370. [Google Scholar] [CrossRef]
  81. Guidi, L.; Calatayud, A. Non-invasive tools to estimate stress-induced changes in photosynthetic performance in plants inhabiting Mediterranean areas. Environ. Exp. Bot. 2014, 103, 42–52. [Google Scholar] [CrossRef]
  82. Gorbe, E.; Calatayud, A. Applications of chlorophyll fluorescence imaging technique in horticultural research: A review. Sci. Hortic. 2012, 138, 24–35. [Google Scholar] [CrossRef]
  83. Moustaka, J.; Tanou, G.; Adamakis, I.D.; Eleftheriou, E.P.; Moustakas, M. Leaf age dependent photoprotective and antioxidative mechanisms to paraquat-induced oxidative stress in Arabidopsis thaliana. Int. J. Mol. Sci. 2015, 16, 13989–14006. [Google Scholar] [CrossRef] [PubMed]
Figure 1. Changes in the maximum quantum efficiency of PSII (Fv/Fm) in N. caerulescens plants grown at 0 (control), 40 or 120 μM Cd2+ for 3 and 4 days.
Materials 11 02580 g001
Figure 2. Changes in the quantum efficiency of PSII photochemistry (ΦPSII) in N. caerulescens measured (a) at 300 μmol photons m−2 s−1 or (b) 1000 μmol photons m−2 s−1. N. caerulescens plants were grown at 0 (control), 40, or 120 μM Cd2+ for 3 and 4 days.
Materials 11 02580 g002
Figure 3. Changes in the quantum yield for dissipation by down regulation in PSII (regulated heat dissipation, a loss process serving for protection) (ΦNPQ) measured at (a) 300 μmol photons m−2 s−1 or (b) 1000 μmol photons m−2 s−1. N. caerulescens plants were grown at 0 (control), 40, or 120 μM Cd2+ for 3 and 4 days.
Materials 11 02580 g003
Figure 4. Changes in the quantum yield of non-regulated energy dissipated in PSII (non-regulated heat dissipation, a loss process due to PSII inactivity) (ΦNO) measured at (a) 300 μmol photons m−2 s−1 or (b) 1000 μmol photons m−2 s−1. N. caerulescens plants were grown at 0 (control), 40, or 120 μM Cd2+ for 3 and 4 days.
Materials 11 02580 g004
Figure 5. Changes in non-photochemical fluorescence quenching (NPQ) measured at (a) 300 μmol photons m−2 s−1 or (b) 1000 μmol photons m−2 s−1. N. caerulescens plants were grown at 0 (control), 40 or 120 μM Cd2+ for 3 and 4 days.
Materials 11 02580 g005
Figure 6. Changes in the relative PSII electron transport rate (ETR) measured at (a) 300 μmol photons m−2 s−1 or (b) 1000 μmol photons m−2 s−1. N. caerulescens plants were grown at 0 (control), 40 or 120 μM Cd2+ for 3 and 4 days.
Materials 11 02580 g006
Figure 7. Changes in the photochemical fluorescence quenching, that is the relative reduction state of QA, reflecting the fraction of open PSII reaction centers (qP) measured at (a) 300 μmol photons m−2 s−1 or (b) 1000 μmol photons m−2 s−1. N. caerulescens plants were grown at 0 (control), 40, or 120 μM Cd2+ for 3 and 4 days.
Materials 11 02580 g007
Figure 8. Representative chlorophyll fluorescence images of the maximum quantum efficiency (Fv/Fm) of PSII after 15 min dark adaptation (a) and after 5 min illumination at 300 μmol photons m−2 s−1 actinic light; of the actual (effective) quantum yield of PSII photochemistry (ΦPSII) (b), the quantum yield for dissipation by downregulation in PSII (ΦNPQ) (c), the quantum yield of non-regulated energy loss in PSII (ΦNO) (d), and the relative reduction state of QA, reflecting the fraction of open PSII reaction centers (qP) (e). N. caerulescens plants were grown at 0 (control), 40 or 120 μM Cd2+ for 3 and 4 days. The colour code depicted at the right side of the images ranges from black (pixel values 0.0) to purple (1.0). The eight areas of interest are shown in each image. The average value of each photosynthetic parameter of the leaf is presented in the figure.
Materials 11 02580 g008
Figure 9. Representative chlorophyll fluorescence images after 5 min illumination at 1000 μmol photons m−2 s−1 actinic light; of the actual (effective) quantum yield of PSII photochemistry (ΦPSII) (a), the quantum yield for dissipation by downregulation in PSII (ΦNPQ) (b), the quantum yield of non-regulated energy loss in PSII (ΦNO) (c), and the relative reduction state of QA, reflecting the fraction of open PSII reaction centers (qP) (d) N. caerulescens plants were grown at 0 (control), 40 or 120 μM Cd2+ for 3 and 4 days. The colour code depicted at the right side of the images ranges from black (pixel values 0.0) to purple (1.0). The eight areas of interest are shown in each image. The average value of each photosynthetic parameter of the leaf is presented in the figure.
Materials 11 02580 g009
Table 1. Definitions of all measured and calculated chlorophyll fluorescence parameters.
Chlorophyll Fluo-Rescence ParameterDefinitionCalculation
FoMinimum chlorophyll a fluorescence in the dark-adapted leaf (PSII centers open)Obtained by applying measuring photon irradiance of 1.2 μmol photons m−2 s−1
FmMaximum chlorophyll a fluorescence in the dark-adapted leaf (PSII centers closed)Obtained with a saturating pulse (SP) of 6000 μmol photons m−2 s−1
FsSteady-state photosynthesisMeasured after 5 min illumination time before switching off the actinic light (AL) of 300 μmol photons m−2 s−1 or 1000 μmol photons m−2 s−1
FoMinimum chlorophyll a fluorescence in the light-adapted leafIt was computed by the Imaging Win software (Heinz Walz GmbH, Effeltrich, Germany) as Fo′ = Fo/(Fv/Fm + Fo/Fm′) [42]
FmMaximum chlorophyll a fluorescence in the light-adapted leafMeasured with saturating pulses (SPs) every 20 s for 5 min after application of the actinic light (AL) of 300 μmol photons m−2 s−1 or 1000 μmol photons m−2 s−1
Fv/FmThe maximum quantum efficiency of PSII photochemistryCalculated as (FmFo)/Fm
ΦPSIIThe effective quantum yield of photochemical energy conversion in PSIICalculated as (Fm′ − Fs)/Fm
qPThe redox state of QACalculated as (Fm′ − Fs)/(Fm′ − Fo′)
NPQThe non-photochemical quenching that reflects heat dissipation of excitation energyCalculated as (FmFm′)/Fm
ETRThe relative PSII electron transport rateCalculated as ΦPSII x Photosynthetic Photon Flux Density × 0.5 × 0.84
ΦNPQThe quantum yield of regulated non- photochemical energy loss in PSII, that is the quantum yield for dissipation by down regulation in PSIICalculated as Fs/Fm′ − Fs/Fm
ΦNOThe quantum yield of non-regulated energy loss in PSIICalculated as Fs/Fm
1 − qPThe fraction of closed PSII reaction centersCalculated as 1 − qP

