Morphological, Rheological and Electromagnetic Properties of Nanocarbon/Poly(lactic) Acid for 3D Printing: Solution Blending vs. Melt Mixing

 ,
,  ,
,  ,
, 
Abstract
:1. Introduction
2. Materials and Methods
2.1. Preparation of Nanocomposites
2.2. Experimental Methods
3. Result
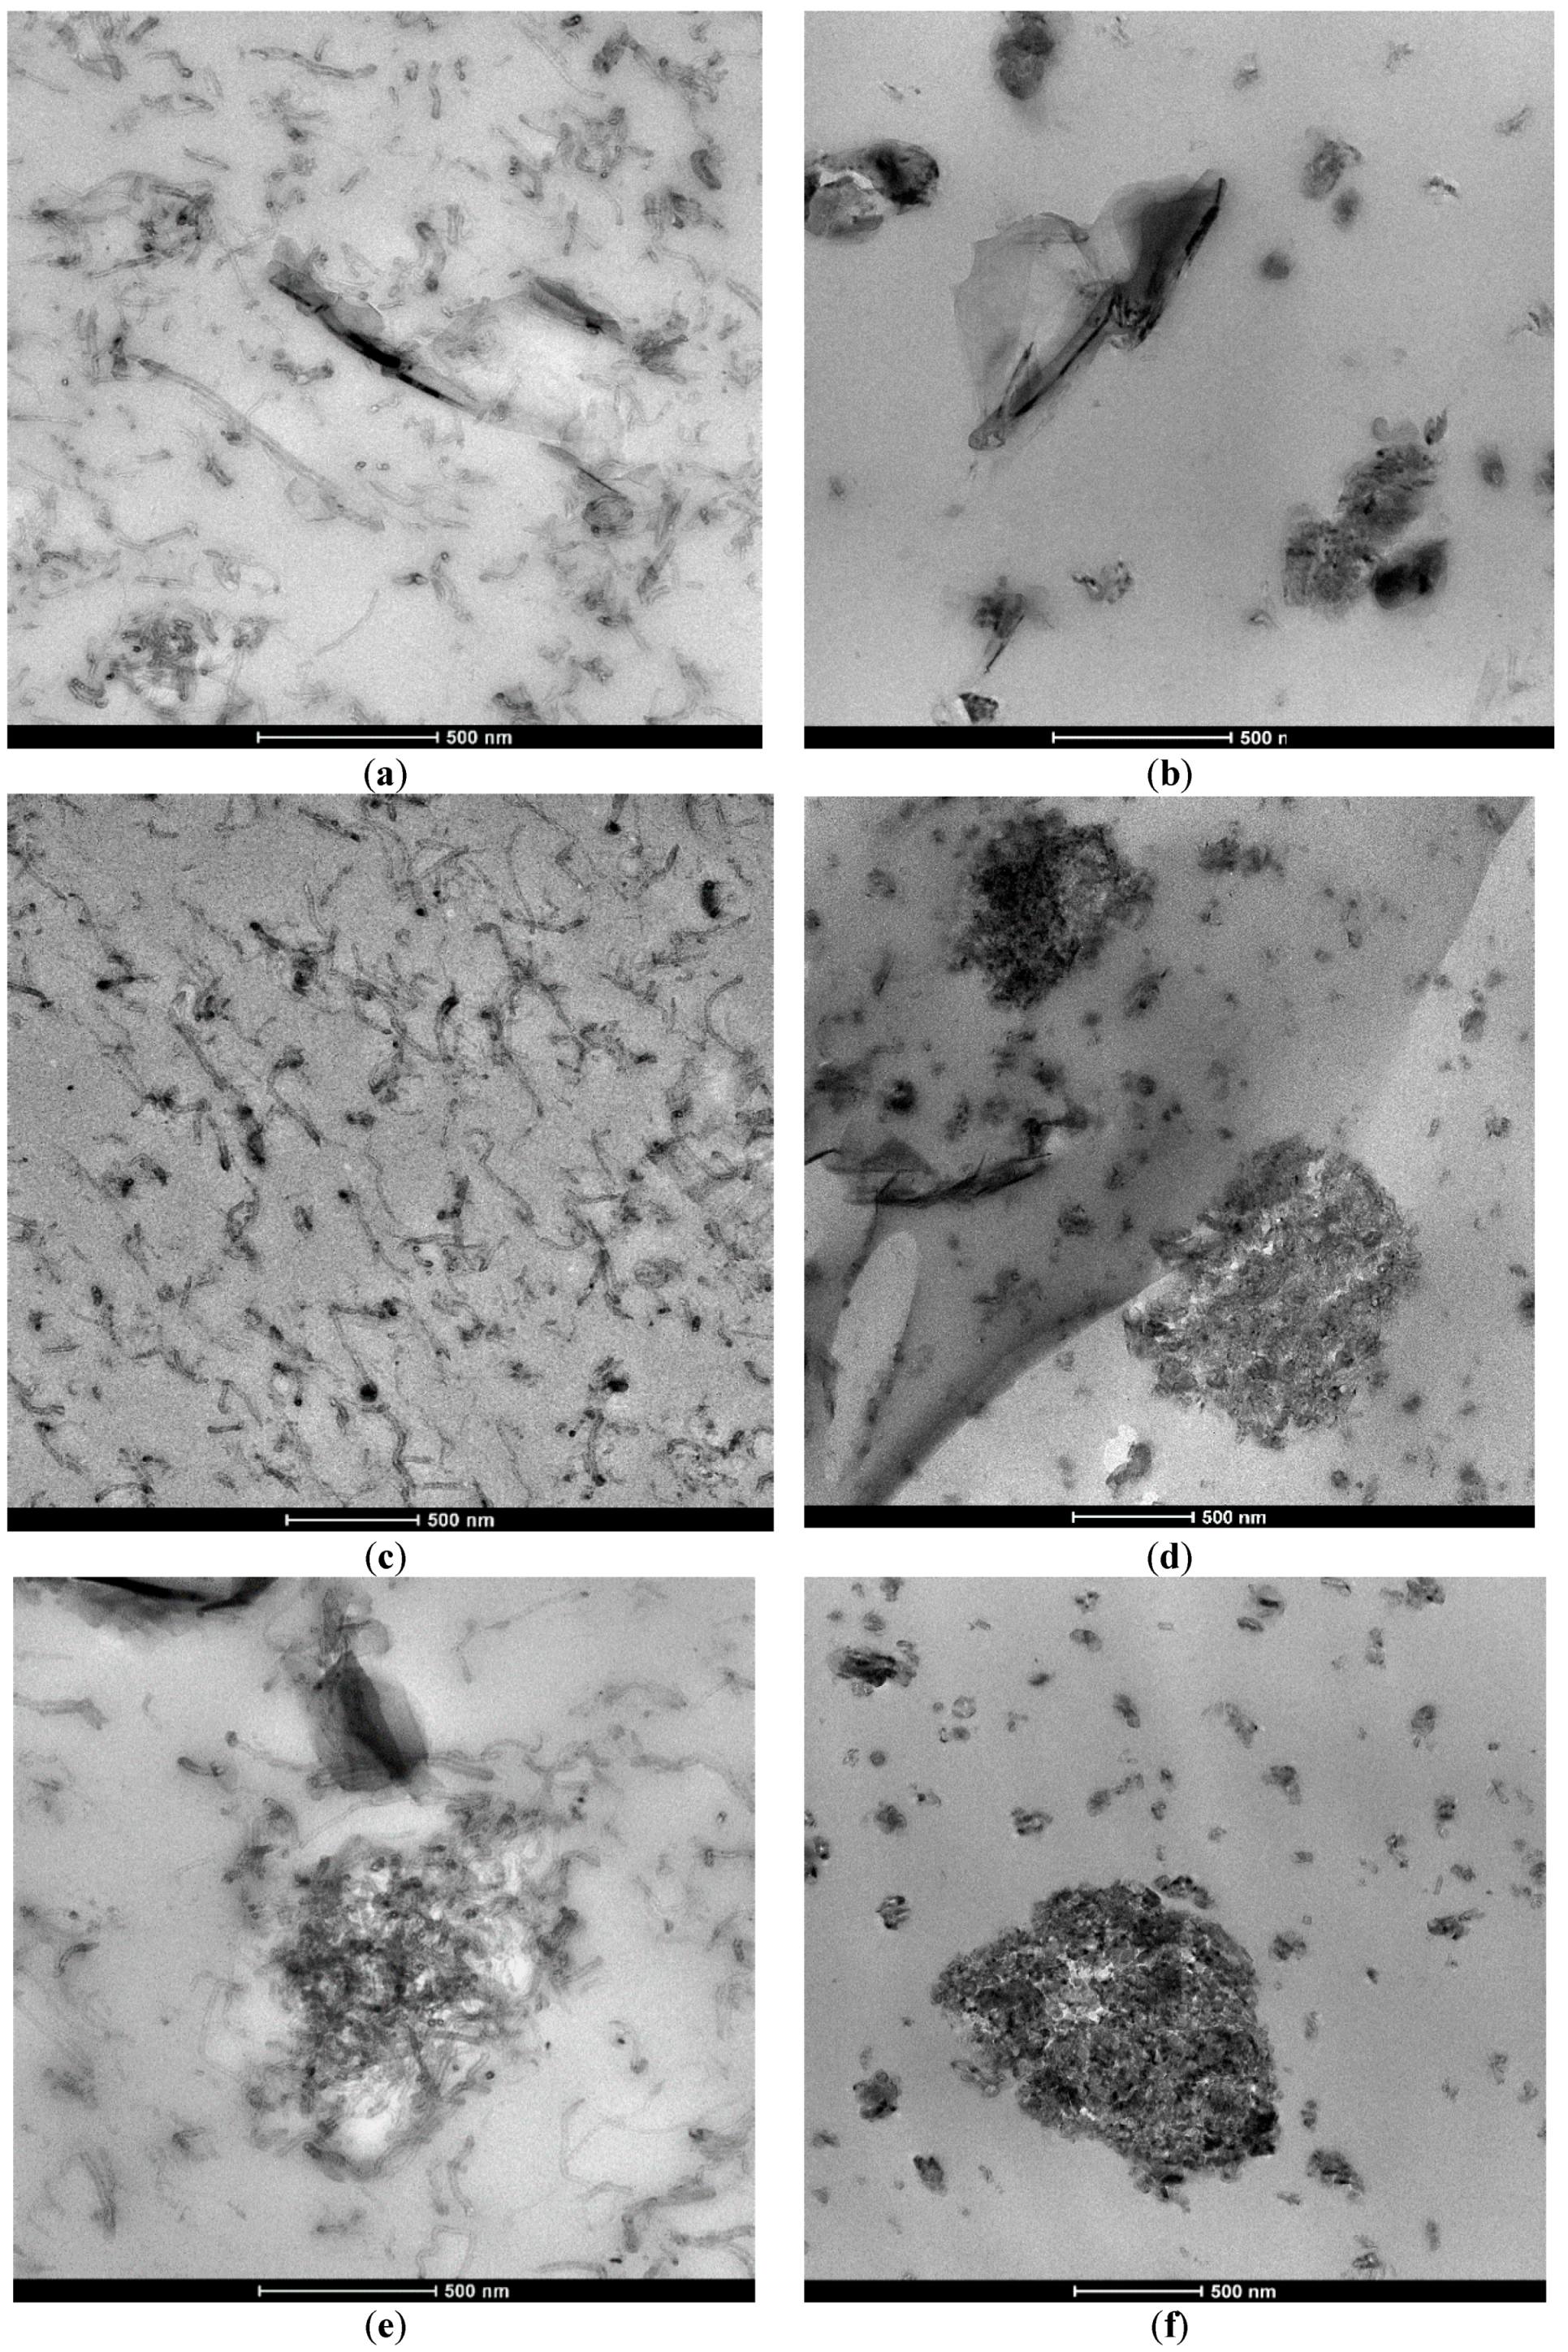
3.1. Morphological Investigation
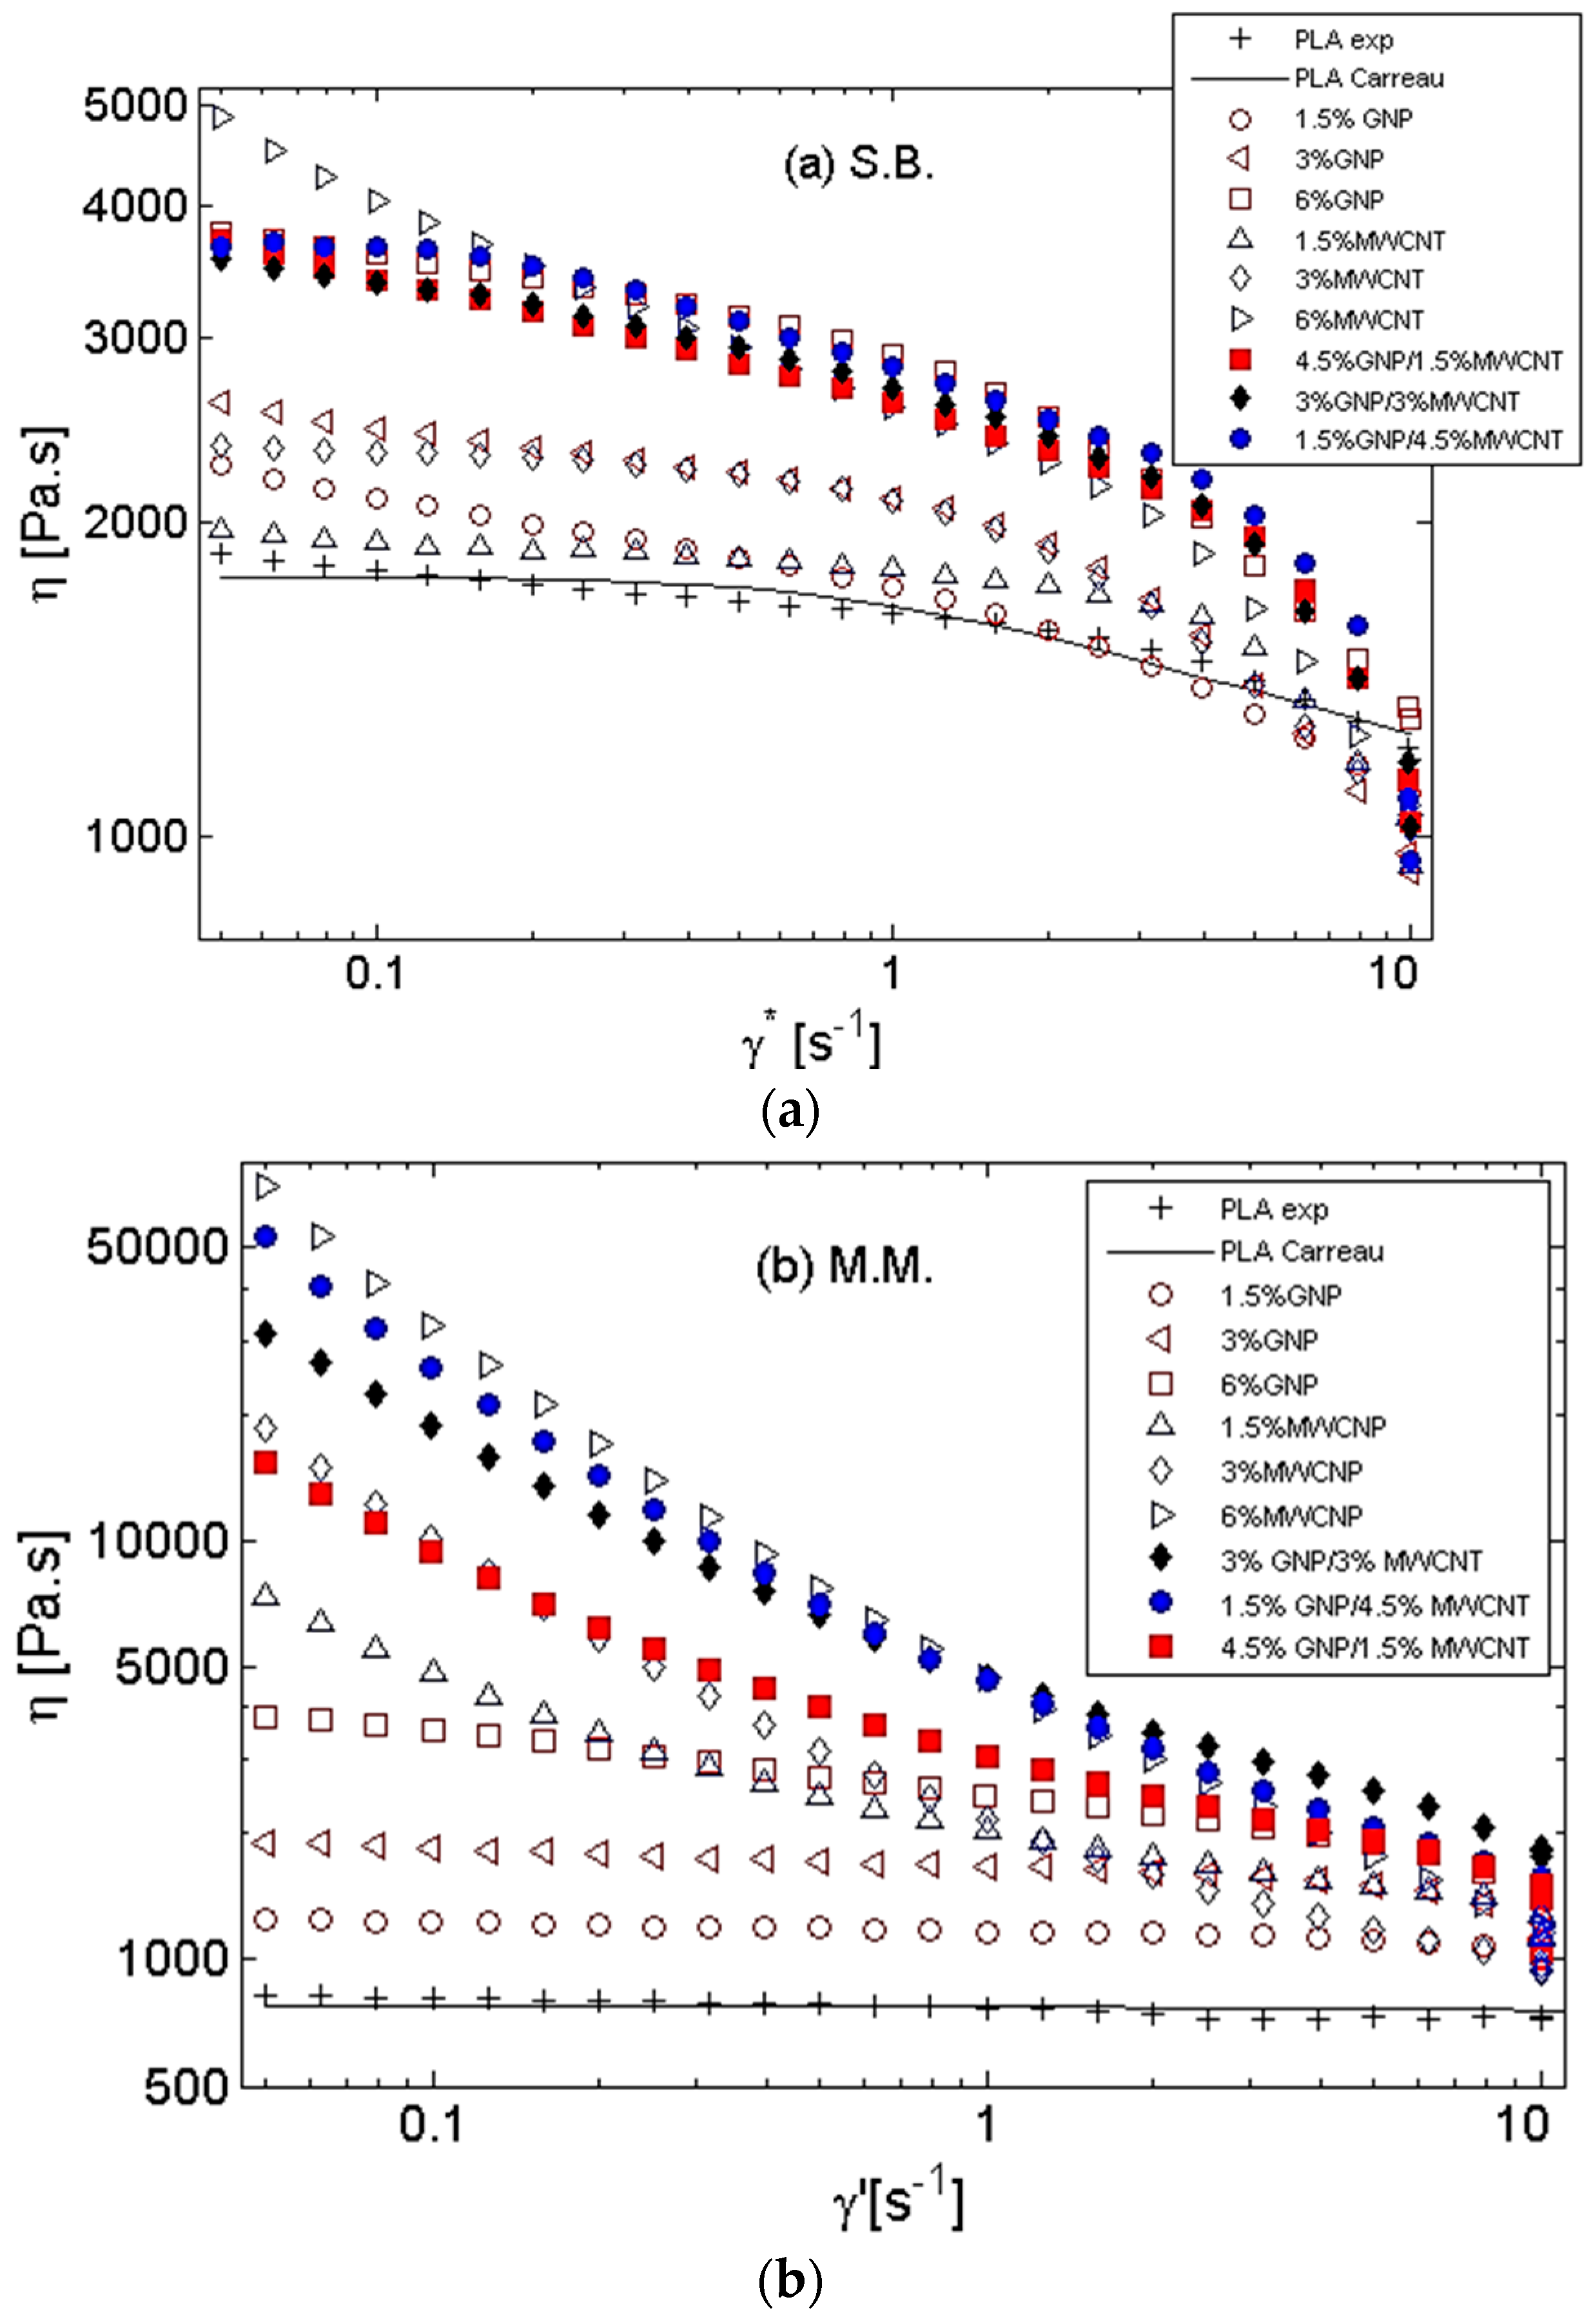
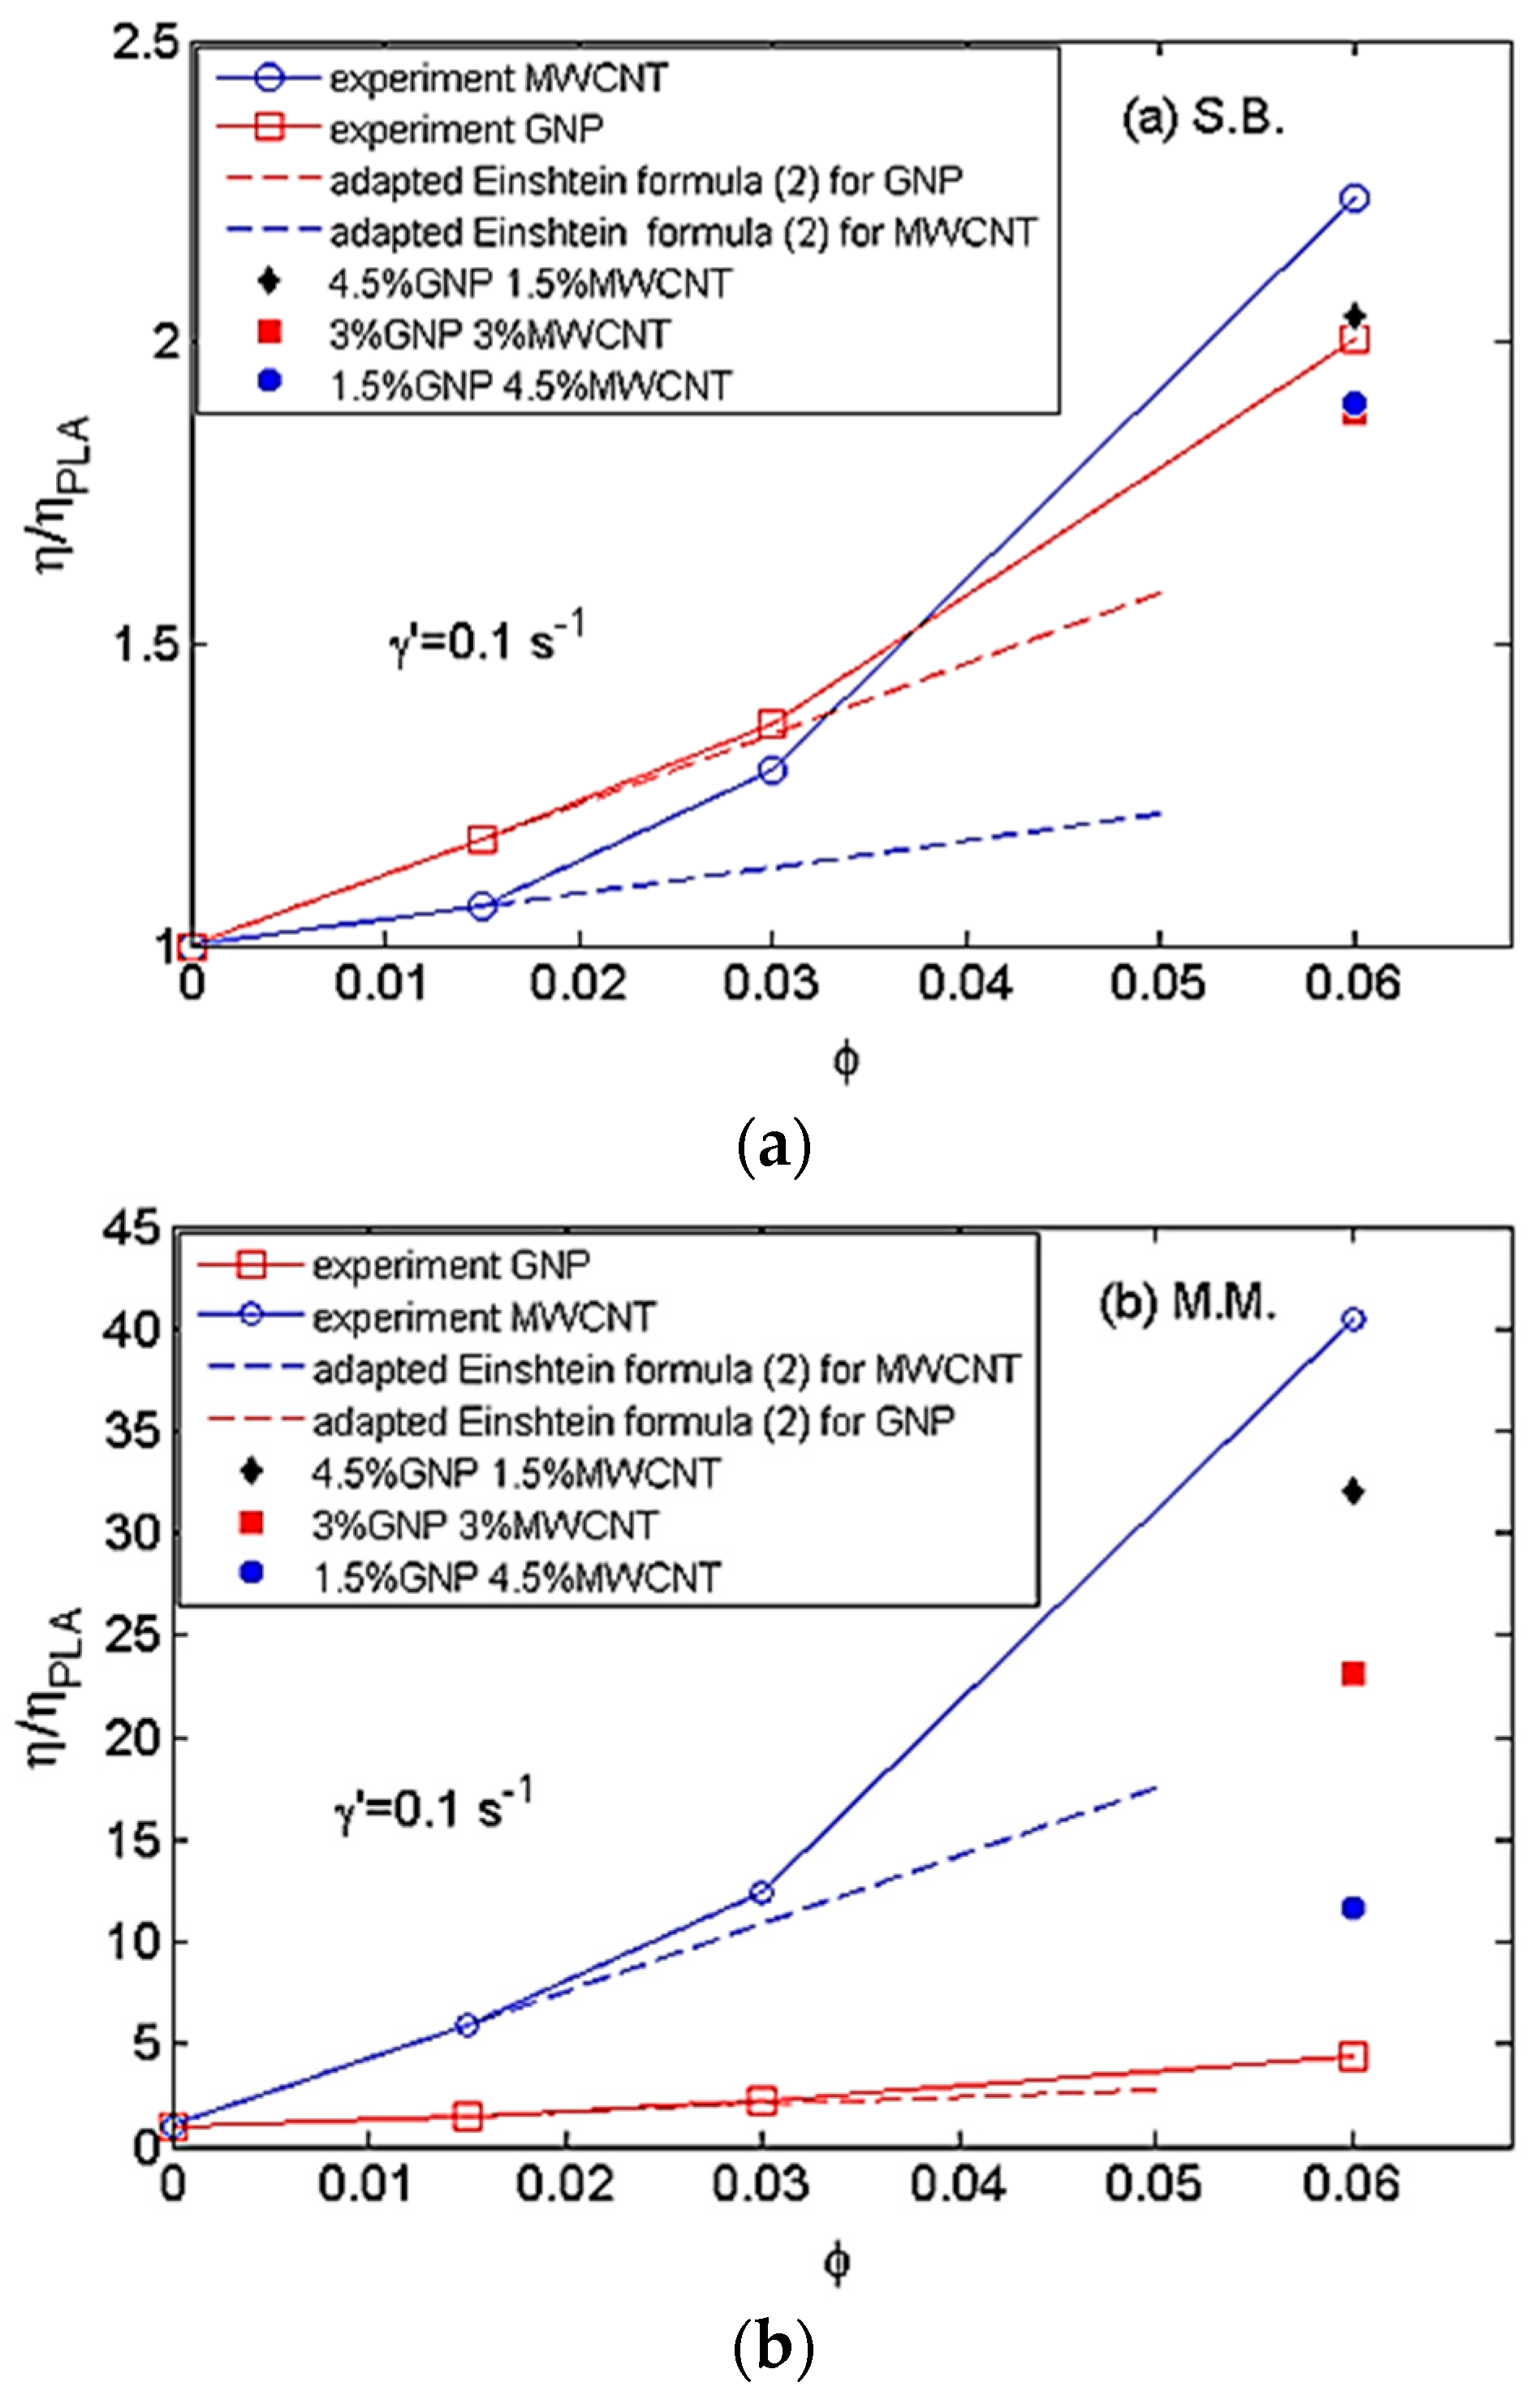
3.2. Rheological Characterization
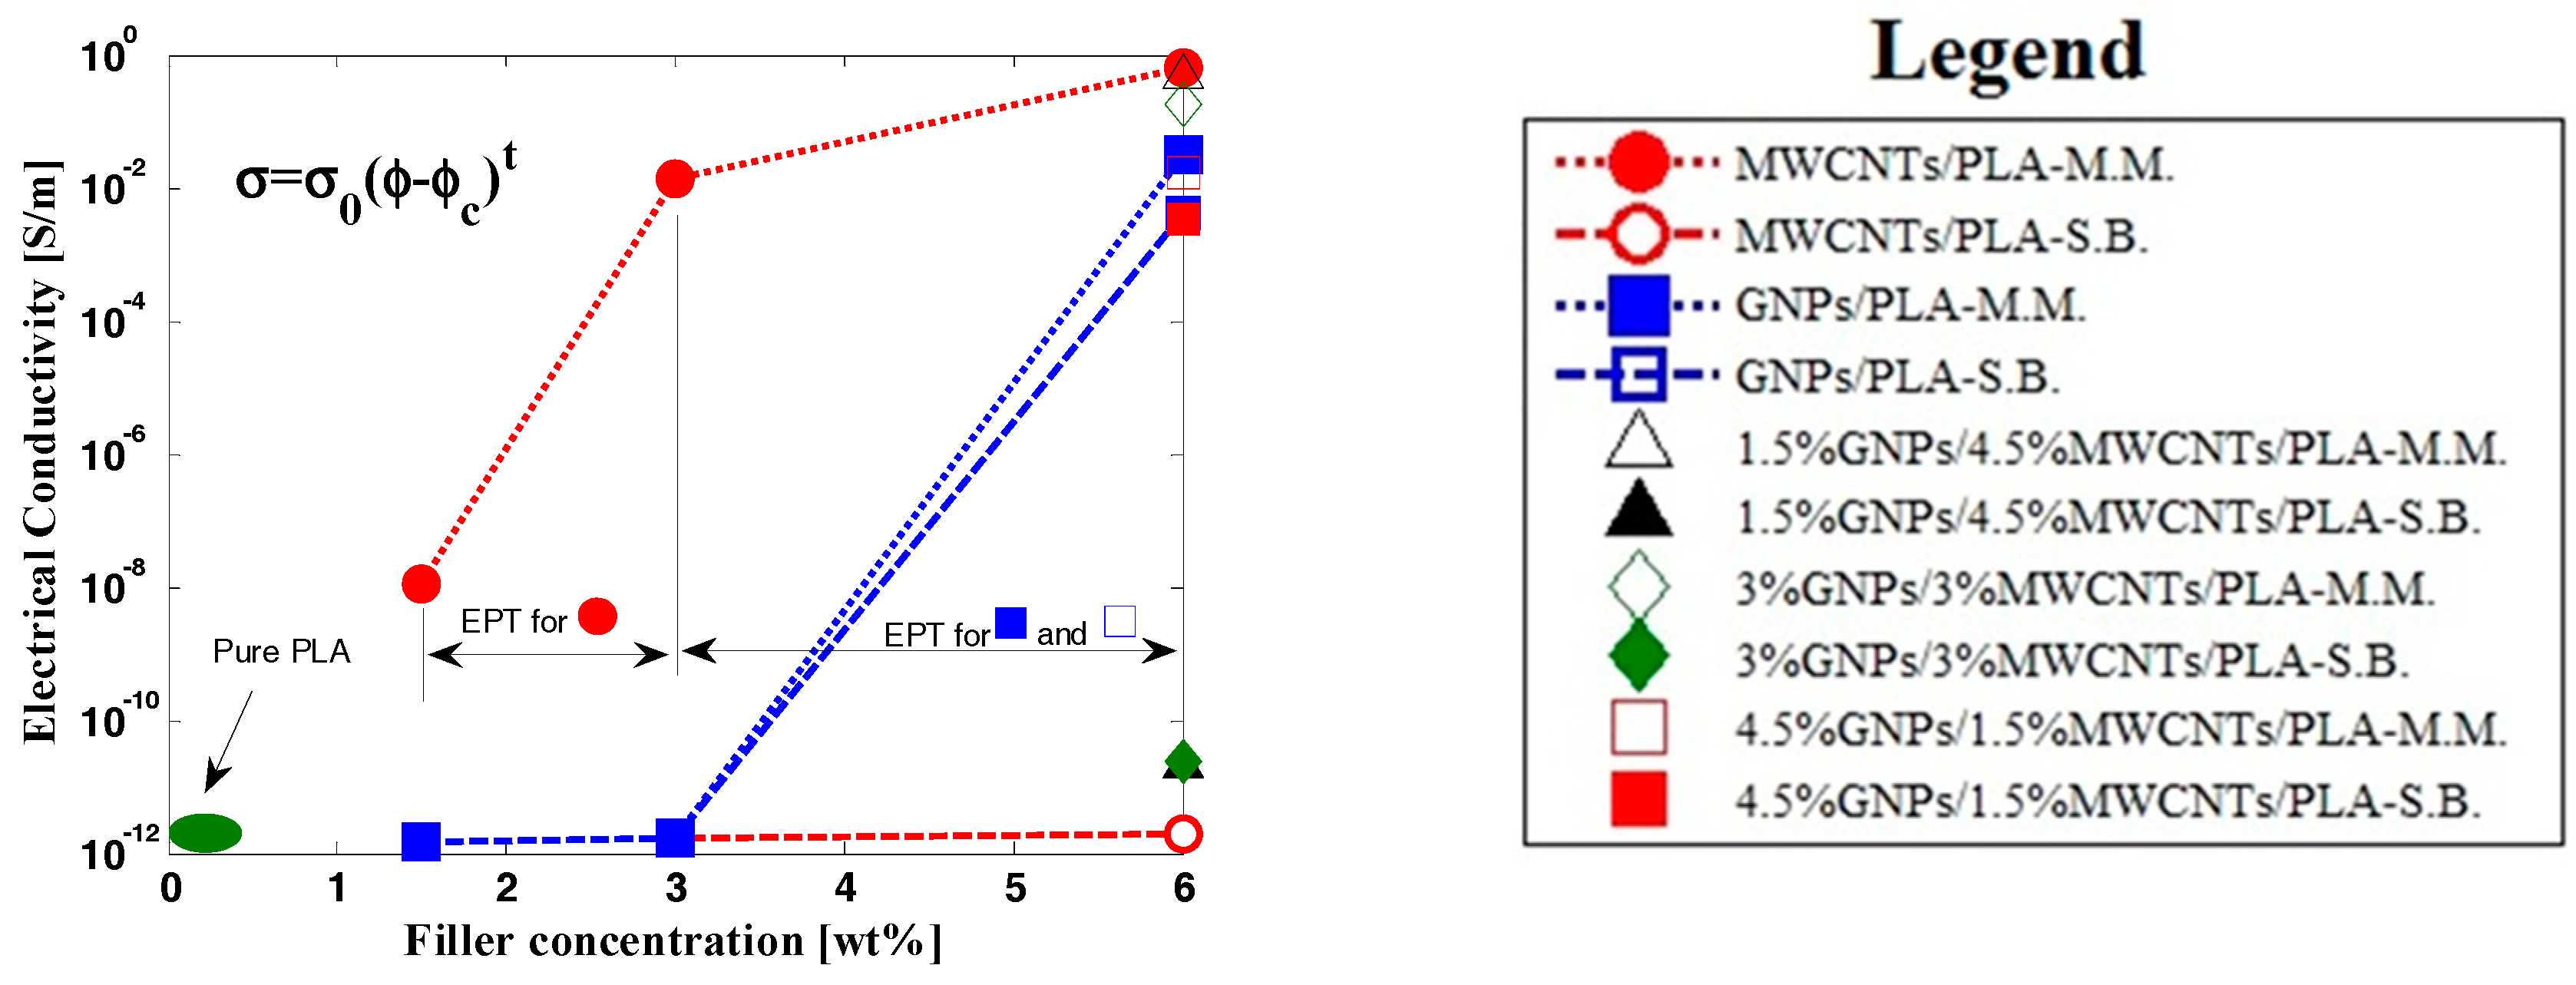
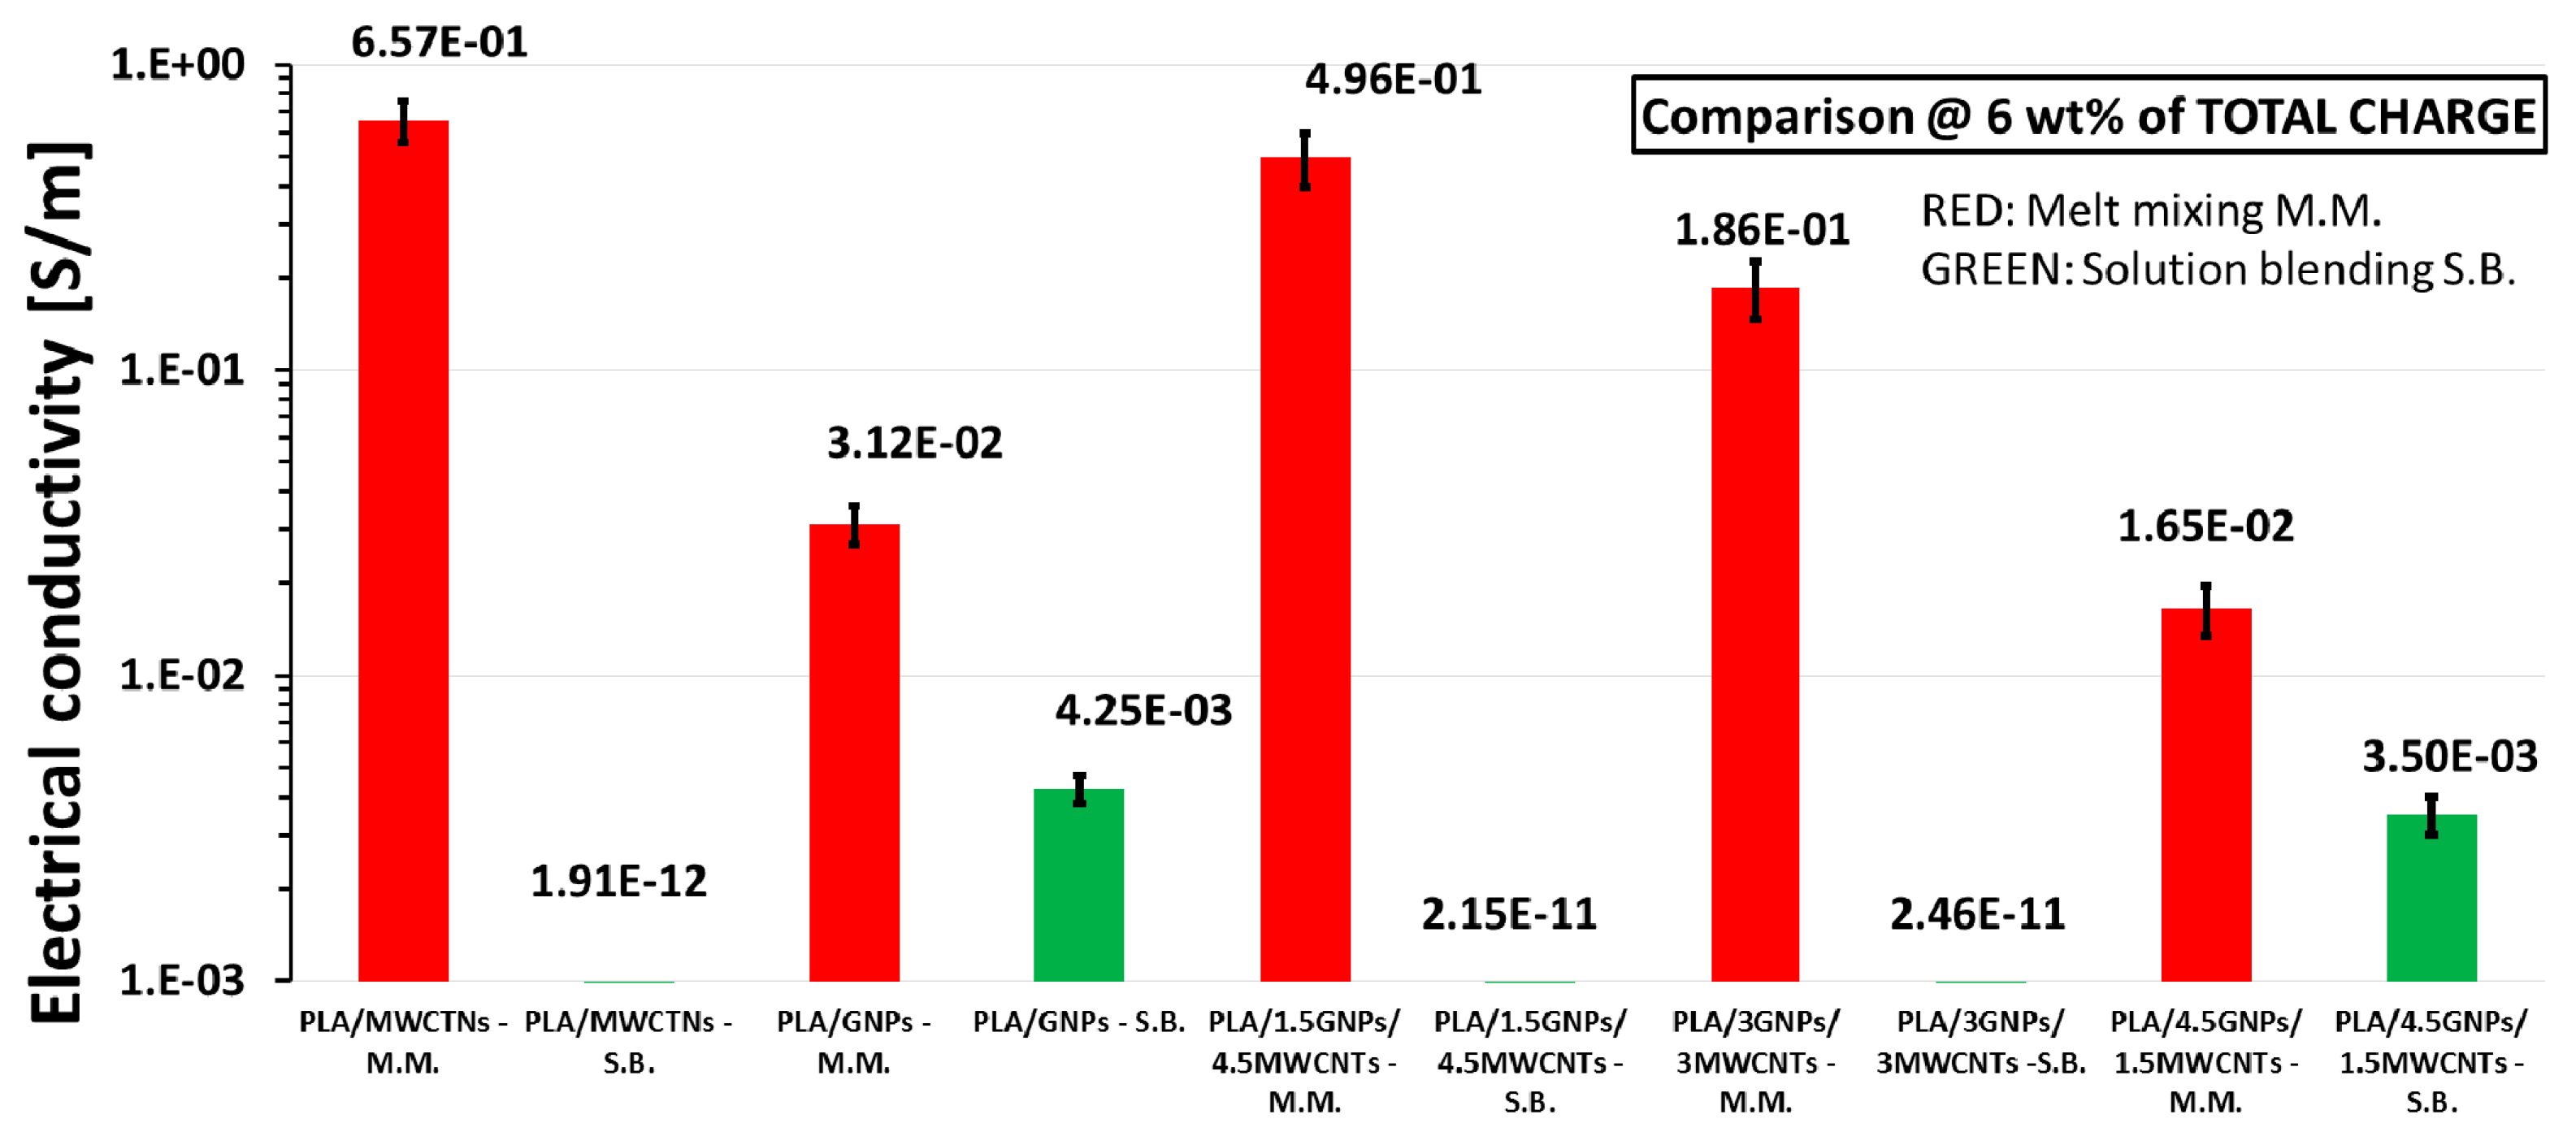
3.3. DC Electrical Properties
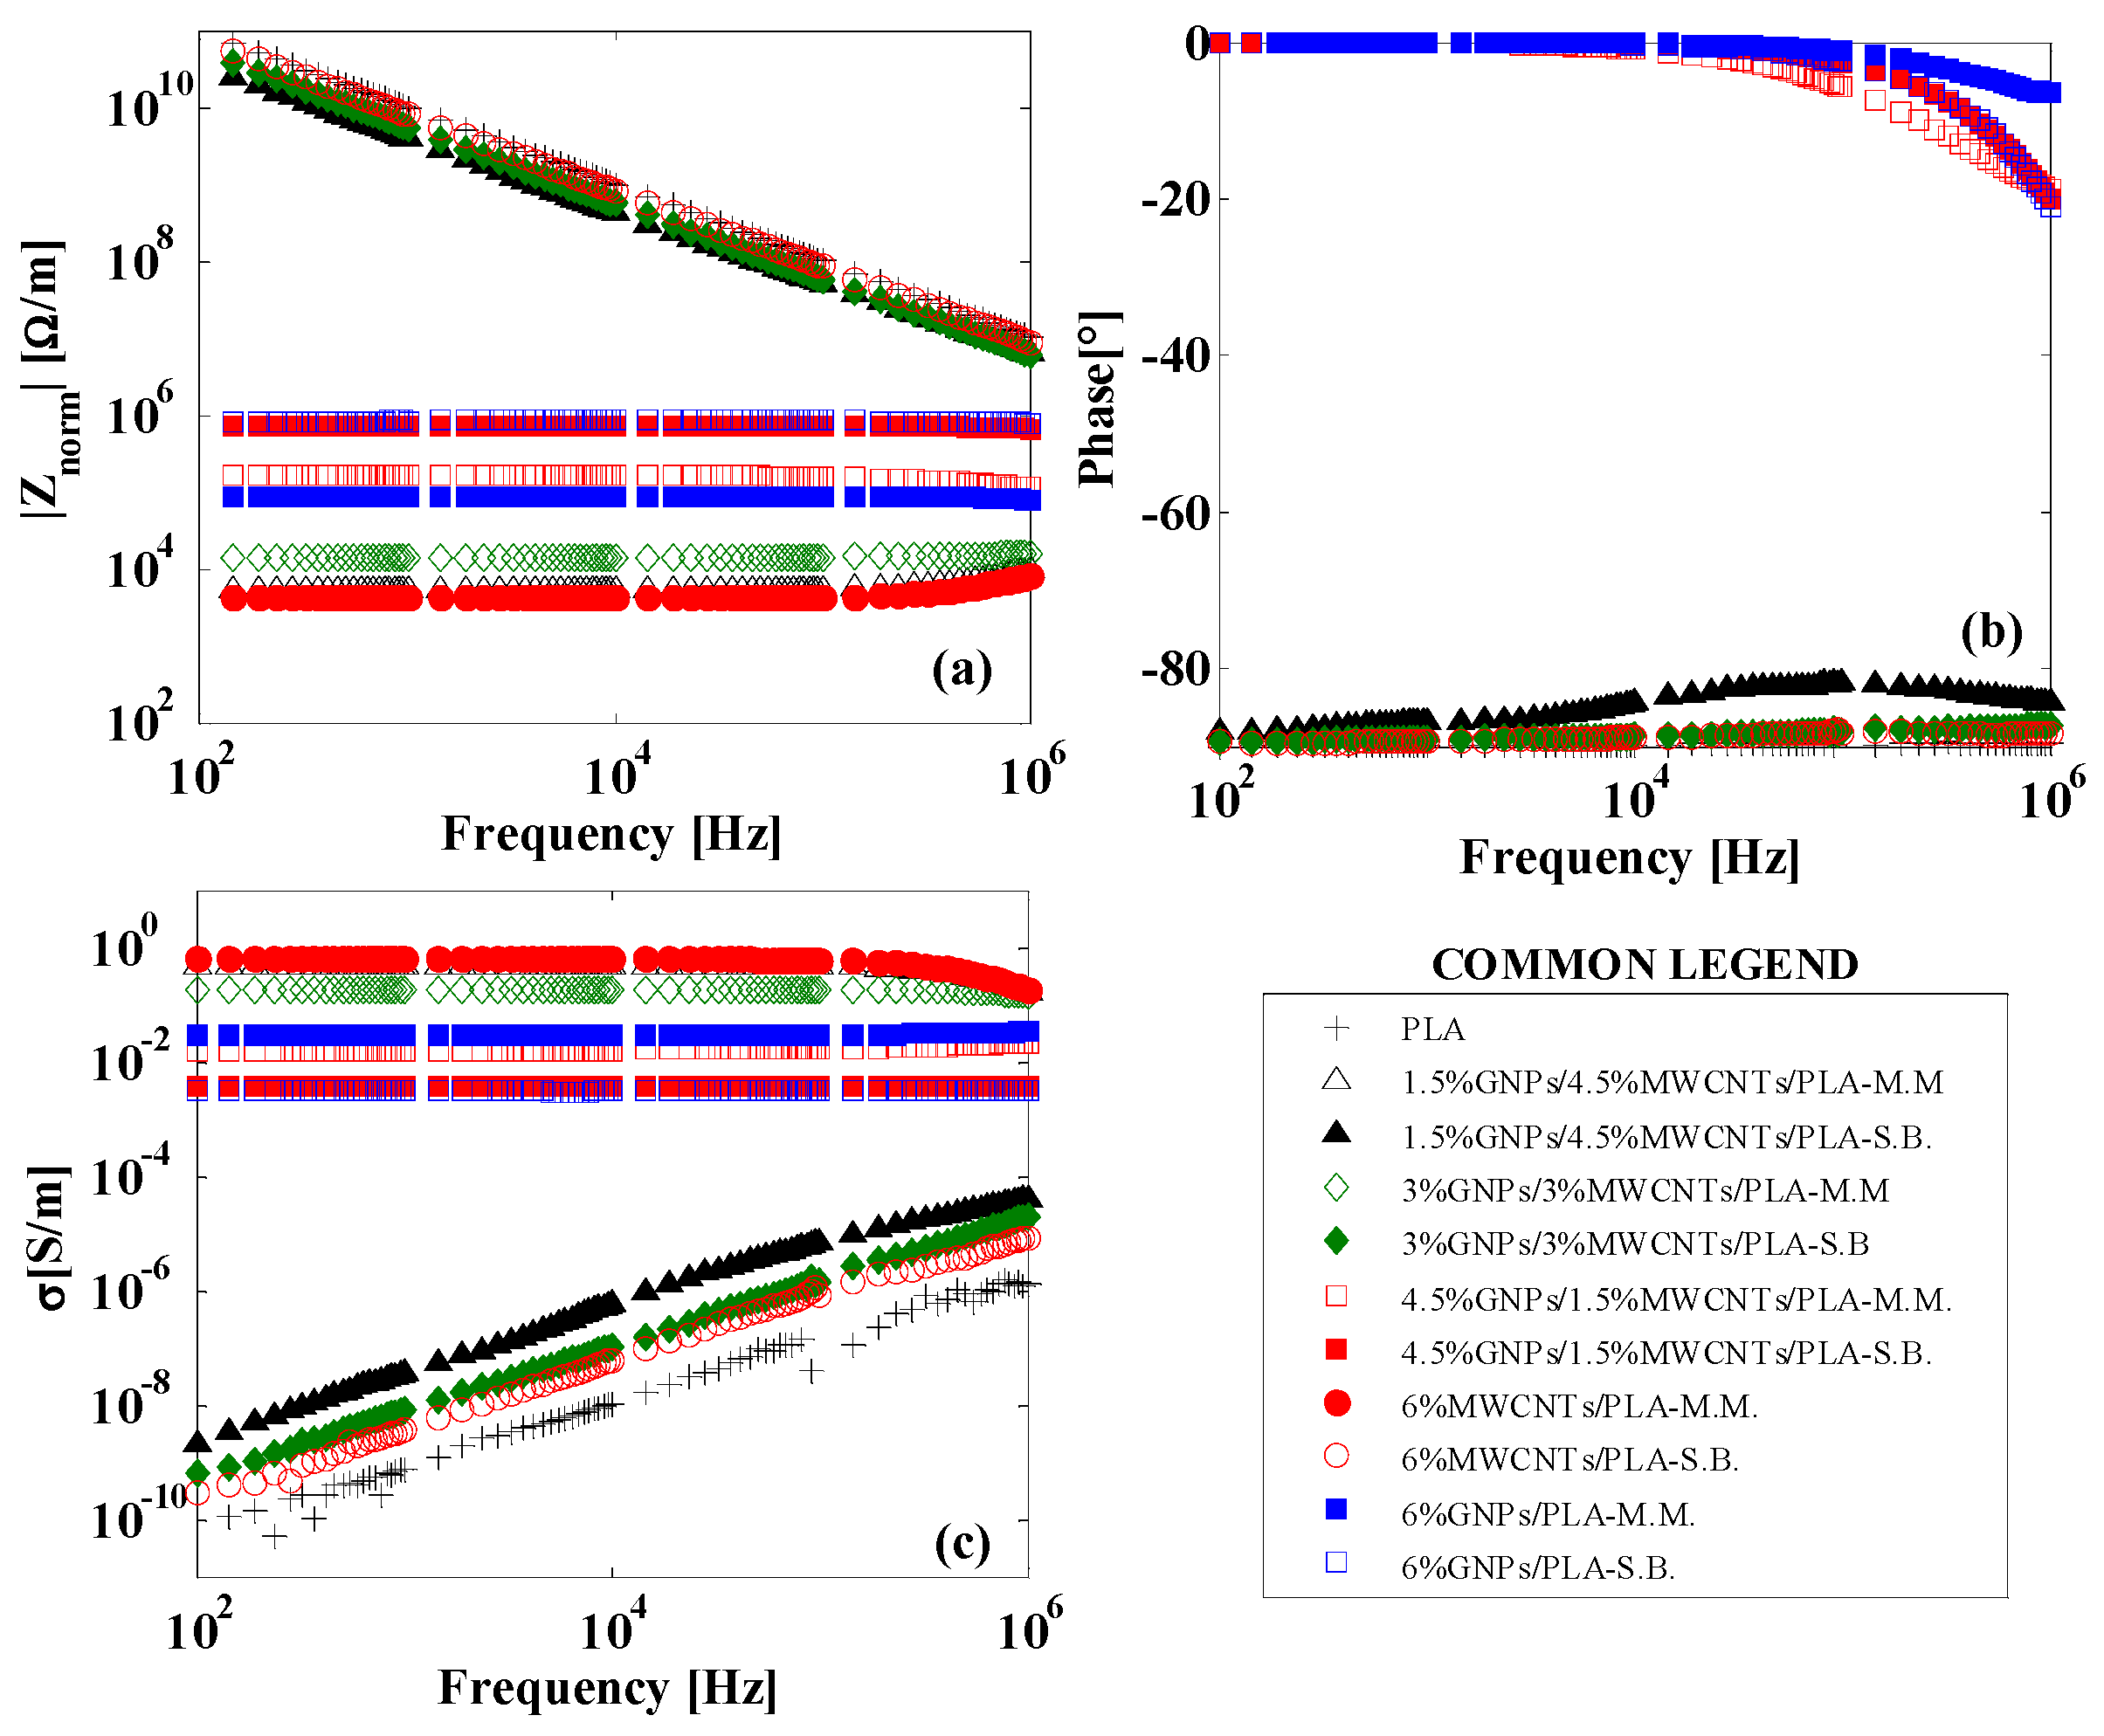
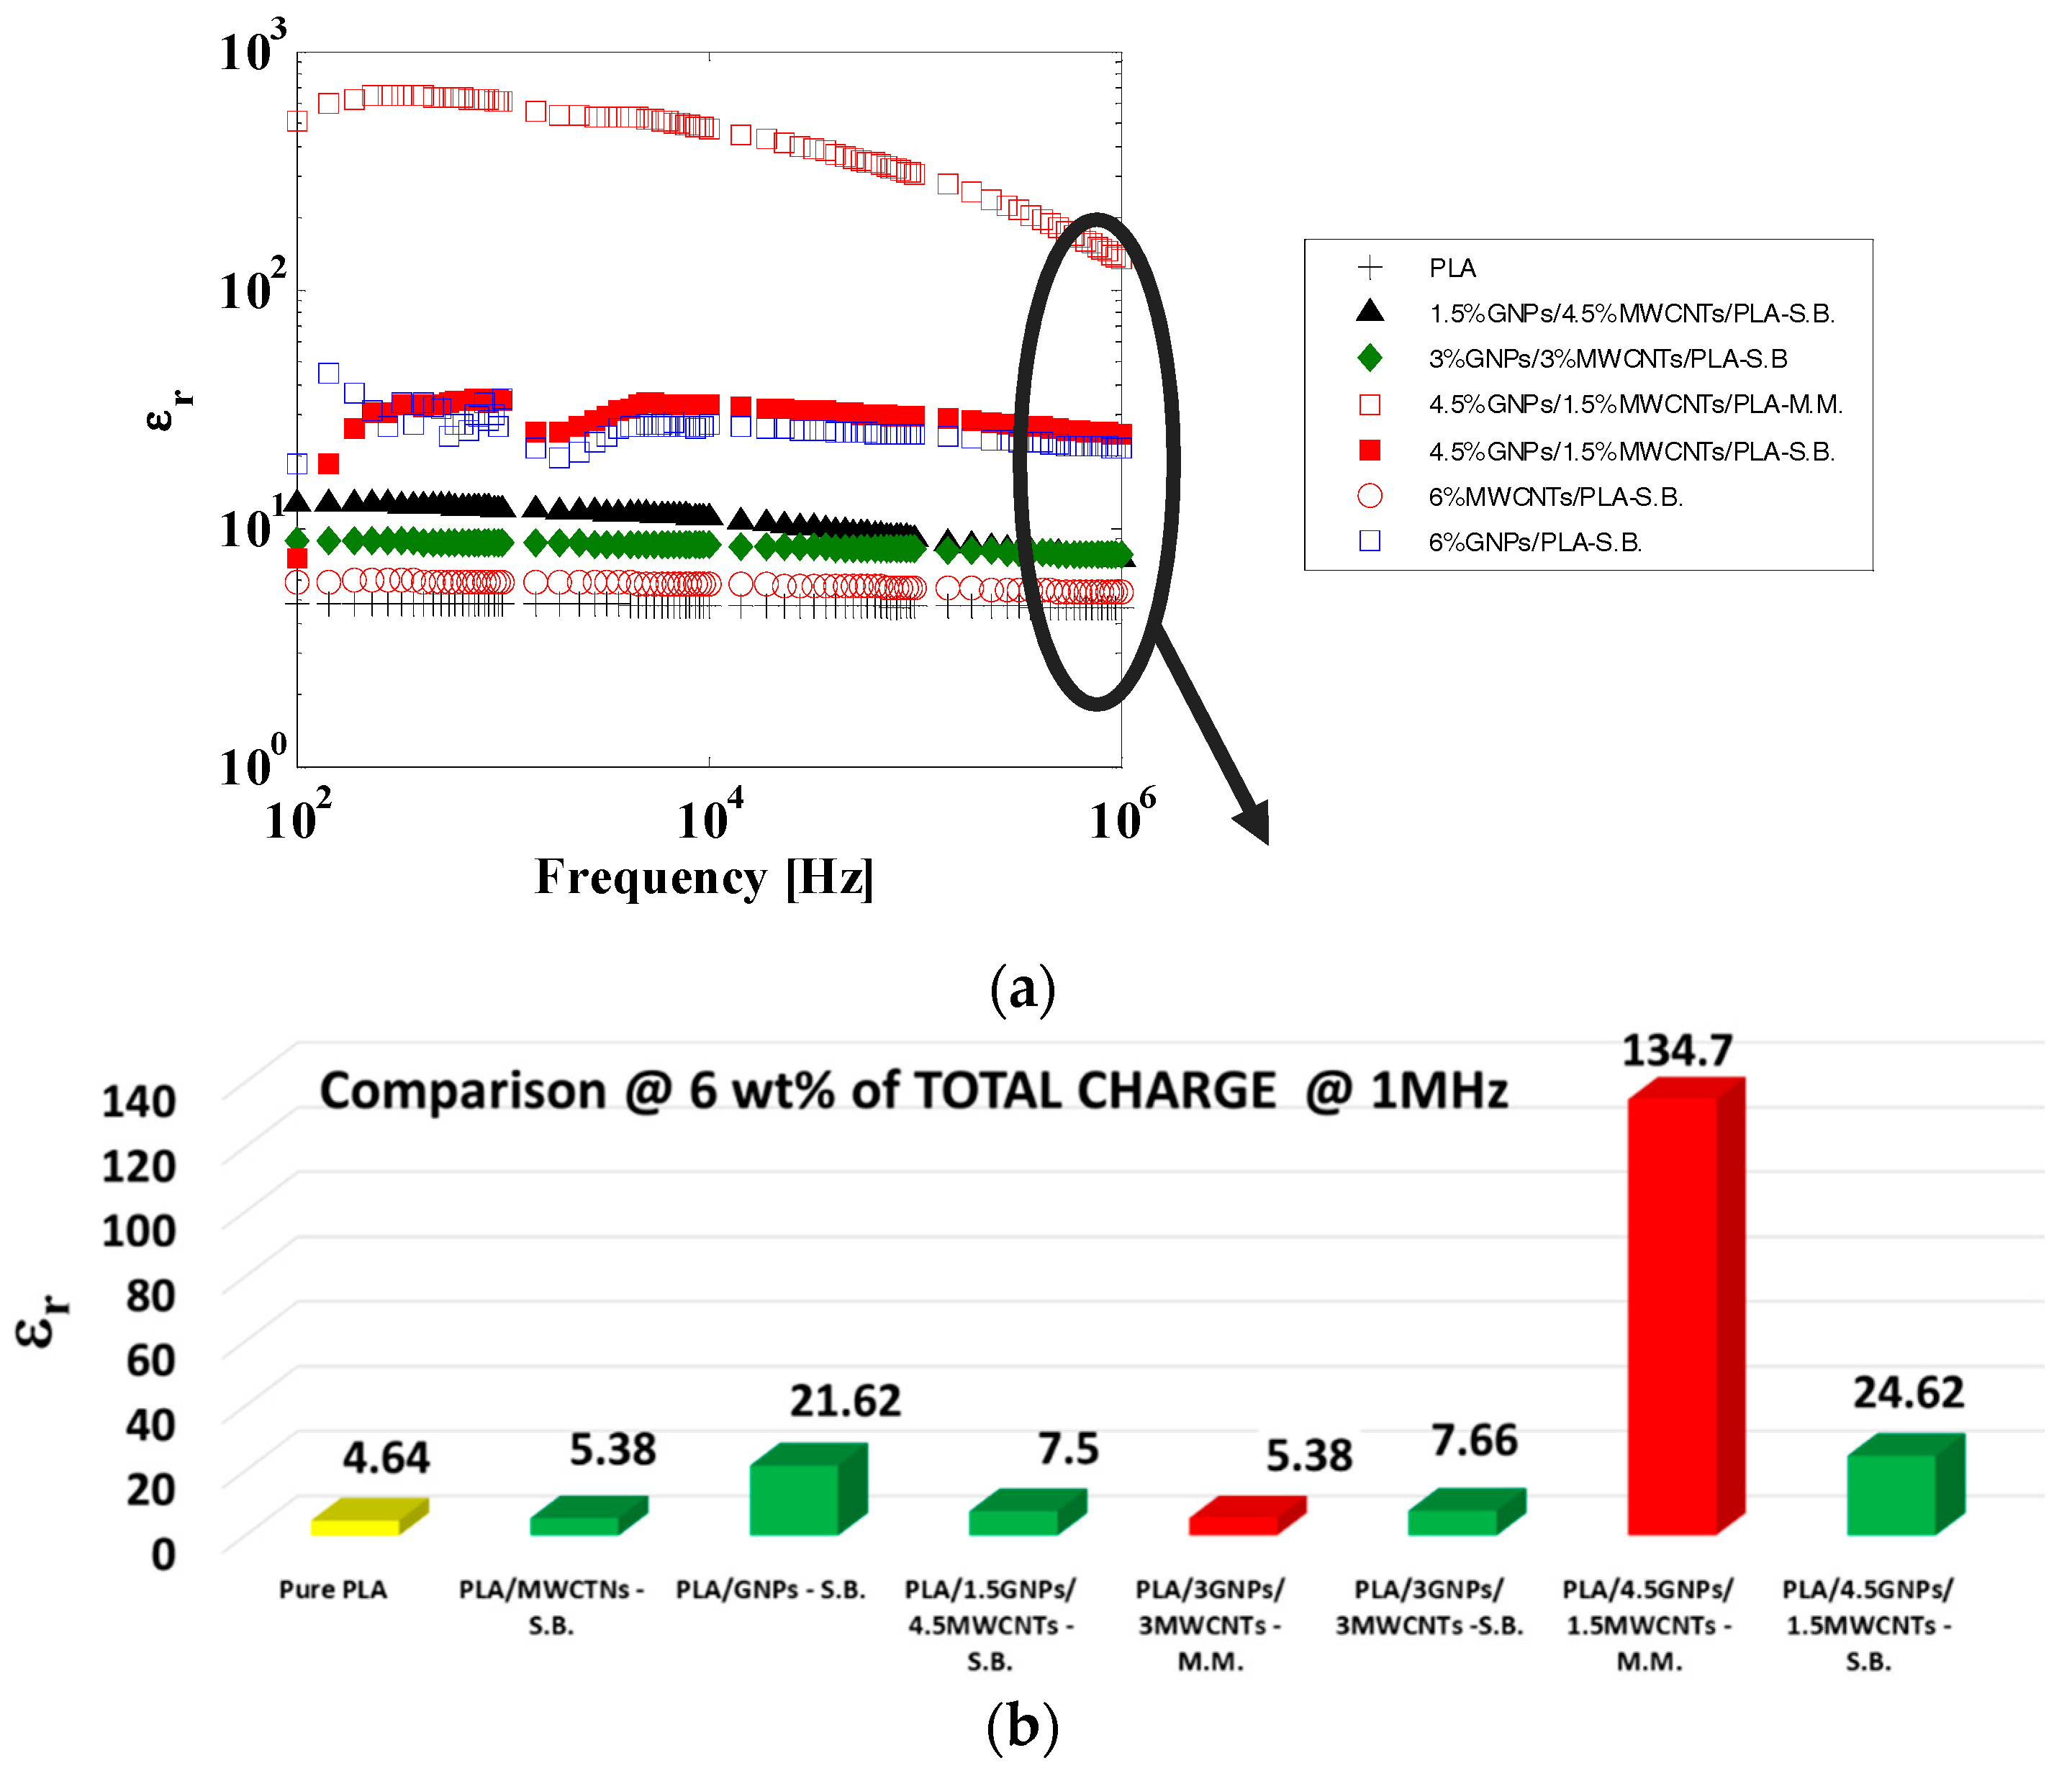
3.4. AC Electrical Properties in the Frequency Range of 100 Hz–1 MHz
3.5. Electromagnetic Properties in GHz and THz Regions
4. Summary and Results
Author Contributions
Funding
Acknowledgments
Conflicts of Interest
References
- Ngo, T.D.; Kashani, A.; Imbalzano, G.; Nguyen, K.T.Q.; Hui, D. Additive manufacturing (3D printing): A review of materials, methods, applications and challenges. Compos. Part B 2018, 143, 172–196. [Google Scholar] [CrossRef]
- Kruth, J.P.; Wang, X.; Laoui, T.; Froyen, L. Lasers and materials in selective laser sintering. Assem. Autom. 2003, 23, 357–371. [Google Scholar] [CrossRef]
- Guo, S.Z.; Gosselin, F.; Guerin, N.; Lanouette, A.M.; Heuzey, M.C.; Therriault, D. Solvent-Cast Three-Dimensional Printing of Multifunctional Microsystems. Small 2013, 9, 4118–4122. [Google Scholar] [CrossRef]
- Lebel, L.L.; Aissa, B.; Khakani, M.A.E.; Therriault, D. Ultraviolet-Assisted Direct-Write Fabrication of Carbon Nanotube/Polymer Nanocomposite. Microcoils. Adv. Mater. 2010, 22, 592–596. [Google Scholar] [CrossRef] [PubMed]
- Zhang, X.; Jiang, X.N.; Sun, C. Micro-stereolithography of polymeric and ceramic microstructure. Sens. Actuators A 1999, 77, 149–156. [Google Scholar] [CrossRef]
- Kruth, J.P.; Leu, M.C.; Nakagawa, T. Progress in additive manufacturing and rapid prototyping. CIRP Ann. 1998, 47, 525–540. [Google Scholar] [CrossRef]
- Wong, K.V.; Hernandez, A. A review of additive manufacturing. ISRN Mech. Eng. 2012, 208760. [Google Scholar] [CrossRef]
- Wang, X.; Jiang, M.; Zhou, Z.; Gou, J.; Hui, D. 3D printing of polymer matrix composites: A review and prospective. Compos. Part B 2017, 110, 442–458. [Google Scholar] [CrossRef]
- Bai, G.; Creehan, K.D.; Kuhn, H.A. Inkjet printable nanosilver suspensions for enhanced sintering quality in rapid manufacturing. Nanotechnology 2007, 18, 185701–185705. [Google Scholar] [CrossRef]
- Buffat, P.; Borel, J.P. Size effect on the melting of gold particle. Phys. Rev. A 1976, 13, 2287–2298. [Google Scholar] [CrossRef]
- Vertuccio, L.; Guadagno, L.; Spinelli, G.; Russo, S.; Iannuzzo, G. Effect of carbon nanotube and functionalized liquid rubber on mechanical and electrical properties of epoxy adhesives for aircraft structures. Compos. Part B 2017, 129, 1–10. [Google Scholar] [CrossRef]
- Guadagno, L.; Raimondo, M.; Vittoria, V.; Vertuccio, L.; Naddeo, C.; Russo, S.; De Vivo, B.; Lamberti, P.; Spinelli, G.; Tucci, V. Development of epoxy mixtures for application in aeronautics and aerospace. RSC Adv. 2014, 4, 15474–15488. [Google Scholar] [CrossRef]
- Singh, S.; Ramakrishna, S.; Singh, R. Material issues in additive manufacturing: A review. J. Manuf. Process. 2017, 25, 185–200. [Google Scholar] [CrossRef]
- Crump, S.S. Apparatus and Method for Creating Three-Dimensional Objects. U.S. Patent No. 5,340,433, 23 August 1994. [Google Scholar]
- Zhao, C.; Wang, C.; Gorkin, R., III; Beirne, S.; Shu, K.; Wallace, G.G. Three dimensional (3D) printed electrodes for interdigitated supercapacitors. Electrochem. Commun. 2014, 41, 20–23. [Google Scholar] [CrossRef]
- Ambrosi, A.; Moo, J.G.S.; Pumera, V. Helical 3D-Printed Metal Electrodes as Custom-Shaped 3D Platform for Electrochemical Devices. Adv. Funct. Mater. 2016, 26, 698–703. [Google Scholar] [CrossRef]
- Adams, J.J.; Duoss, E.B.; Malkowski, T.F.; Motala, M.J.; Ahn, B.Y.; Nuzzo, R.G.; Bernhard, J.T.; Lewis, J.A. Conformal printing of electrically small antennas on three-dimensional surfaces. Adv. Mater. 2011, 23, 1335–1340. [Google Scholar] [CrossRef] [PubMed]
- Guo, S.Z.; Yang, X.; Heuzey, M.C.; Therriault, D. 3D printing of a multifunctional nanocomposite helical liquid sensor. Nanoscale 2017, 7, 6451–6456. [Google Scholar] [CrossRef] [PubMed]
- Bustillos, J.; Montero, D.; Nautiyal, P.; Loganathan, A.; Boesl, B.; Agarwal, A. Integration of Graphene in Poly(Lactic) Acid by 3D Printing to Develop Creep and Wear-Resistant Hierarchical Nanocomposites. Polym. Compos. 2017, 1–12. [Google Scholar] [CrossRef]
- Kwok, S.W.; Goh, K.H.H.; Tan, Z.D.; Tan, S.T.M.; Tjiu, W.W.; Soh, J.Y.; Goh, K.E.J. Electrically conductive filament for 3D-printed circuits and sensors. Appl. Mater. Today 2017, 9, 167–175. [Google Scholar] [CrossRef]
- Pan, A.; Huang, Z.; Guo, R.; Liu, J. Effect of FDM Process on Adhesive Strength of Polylactic Acid (PLA) Filament. Key Eng. Mater. 2016, 667, 181–186. [Google Scholar] [CrossRef]
- Dizon, J.R.C.; Espera, A.H., Jr.; Chen, Q.; Advincula, R.C. Mechanical characterization of 3D-printed polymers. Addit. Manuf. 2018, 20, 44–67. [Google Scholar] [CrossRef]
- Gnanasekaran, K.; Heijmans, T.; van Bennekom, S.; Woldhuis, H.; Wijnia, S.; de With, G.; Friedrich, H. 3D printing of CNT- and graphene-based conductive polymer nanocomposites by fused deposition modeling. Appl. Mater. Today 2017, 9, 21–28. [Google Scholar] [CrossRef]
- Bychanok, D.; Li, S.; Gorokhov, G.; Piasotski, K.; Meisak, D.; Kuzhir, P.; Burgess, E.A.; Gallagher, C.P.; Ogrin, F.Y.; Hibbins, A.P.; et al. Fully carbon metasurface: Absorbing coating in microwaves. J. Appl. Phys. 2017, 121, 165103-1–165103-9. [Google Scholar] [CrossRef]
- Novais, R.M.; Simon, F.; Pötschke, P.; Villmow, T.; Covas, J.A.; Paiva, M.C. Poly (lactic acid) composites with poly (lactic acid)-modified carbon nanotubes. J. Polym. Sci. A 2013, 51, 3740–3750. [Google Scholar] [CrossRef]
- Seligra, P.G.; Lamanna, M.; Famá, L. Promising PLA-functionalized MWCNT composites to use in nanotechnology. Polym. Compos. 2016, 37, 3066–3072. [Google Scholar] [CrossRef]
- Utracki, L.A. Clay-Containing Polymer Nanocomposites; Rapra Technology: Shawbury, Shrewsbury, UK, 2004; Volume 1, ISBN 1-85957-437-8. [Google Scholar]
- Kotsilkova, R. Thermosetting Nanocomposites for Engineering Application; Smithers Rapra Technology: Shrewsbury, UK, 2007; p. 325. ISBN1 978-1-84735-062-6. ISBN2 978-1-84735-063-3. [Google Scholar]
- Balberg, I.; Binenbaum, N.; Wagner, N. Percolation thresholds in the three-dimensional sticks system. Phys. Rev. Lett. 1984, 52, 1465–1468. [Google Scholar] [CrossRef]
- De Vivo, B.; Lamberti, P.; Spinelli, G.; Tucci, V. Numerical investigation on the influence factors of the electrical properties of carbon nano tubes-filled composites. J. Appl. Phys. 2013, 113, 244301–244312. [Google Scholar] [CrossRef]
- Eken, E.; Tozzi, E.J.; Klingenberg, D.J.; Bauhofer, W. A simulation study on the combined effects of nanotube shape and shear flow on the electrical percolation thresholds of carbon nanotube/polymer composites. J. Appl. Phys. 2011, 109, 084342. [Google Scholar] [CrossRef]
- De Vivo, B.; Lamberti, P.; Spinelli, G.; Tucci, V.; Guadagno, L.; Raimondo, M. The effect of filler aspect ratio on the electromagnetic properties of carbon-nanofibers reinforced composites. J. Appl. Phys. 2015, 118, 064302. [Google Scholar] [CrossRef]
- Nogales, A.; Broza, G.; Roslaniec, Z.; Schulte, K.; Šics, I.; Hsiao, B.S.; Sanz, A.; García-Gutiérrez, M.C.; Rueda, D.R.; Domingo, C.; Ezquerra, T.A. Low Percolation Threshold in Nanocomposites Based on Oxidized Single Wall Carbon Nanotubes and Poly(butylene terephthalate). Macromolecules 2004, 37, 7669–7672. [Google Scholar] [CrossRef] [Green Version]
- Urquijo, J.; Dagreou, S.S.; Guerrica-Echevarrıa, G.; Eguiazabal, J.I. Morphology and properties of electrically and rheologically percolated PLA/PCL/CNT nanocomposites. J. Appl. Polym. Sci. 2017, 134, 45265. [Google Scholar] [CrossRef]
- Wu, D.; Zhang, Y.; Zhang, M.; Yu, W. Selective Localization of Multiwalled Carbon Nanotubes in Poly (ε-caprolactone)/Polylactide Blend. Biomacromolecules 2009, 10, 417–424. [Google Scholar] [CrossRef] [PubMed]
- De Vivo, B.; Lamberti, P.; Spinelli, G.; Tucci, V. A morphological and structural approach to evaluate the electromagnetic performances of composites based on random networks of carbon nanotubes. J. Appl. Phys. 2014, 15, 154311. [Google Scholar] [CrossRef]
- Panwar, V.; Park, J.O.; Park, S.H.; Kumar, S.; Mehra, R.M. Electrical, dielectric, and electromagnetic shielding properties of polypropylene-graphite composites. J. Appl. Polym. Sci. 2010, 115, 1306–1314. [Google Scholar] [CrossRef]
- Yuan, J.-K.; Yao, S.-H.; Dang, Z.-M.; Sylvestre, A.; Genestoux, M.; Bai, J. Giant Dielectric Permittivity Nanocomposites: Realizing True Potential of Pristine Carbon Nanotubes in Polyvinylidene Fluoride Matrix through an Enhanced Interfacial Interaction. J. Phys. Chem. C 2011, 115, 5515–5521. [Google Scholar] [CrossRef]
- Bychanok, D.; Plyushch, A.; Piasotski, K.; Paddubskaya, A.; Voronovich, S.; Kuzhir, P.; Baturkin, S.; Klochkov, A.; Korovin, E.; Letellier, M.; et al. Electromagnetic properties of polyurethane template-based carbon foams in Ka-band. Phys. Scr. 2015, 90, 094019. [Google Scholar] [CrossRef]
- Paddubskaya, A.; Valynets, N.; Kuzhir, P.; Batrakov, K.; Maksimenko, S.; Kotsilkova, R.; Velichkova, H.; Petrova, I.; Biró, I.; Kertész, K.; et al. Electromagnetic and Thermal properties of 3D Printed Multilayered Nano-carbon / Poly(lactic) Acid Structures. J. Appl. Phys. 2016, 119, 135102. [Google Scholar] [CrossRef]
- Kuzhir, P.; Paddubskaya, A.; Shuba, M.; Maksimenko, S.; Celzard, A.; Fierro, V.; Amaral-Labat, G.; Pizzi, A.; Macutkevic, J.; Valusis, G.; et al. Electromagnetic shielding efficiency in Ka-band: Carbon foam versus epoxy/CNT composites. J. Nanophotonics 2012, 6, 061715. [Google Scholar] [CrossRef]
- Shuba, M.V.; Melnikov, A.V.; Paddubskay, A.; Kuzhir, P.; Maksimenko, S.; Thomsen, C. The role of finite size effects in the microwave and sub-terahertz electromagnetic response of multiwall carbon nanotube based composite: Theory and interpretation of experiment. Phys. Rev. B 2013, 88, 045436. [Google Scholar] [CrossRef]


| Property | Solution Blending | Melt Mixing | ||
|---|---|---|---|---|
| Filler | GNP | MWCNT | GNP | MWCNT-OH |
| Code | TNGNP | TNFN-8 | TNIGNP | TNIMH4 |
| Purity (wt %) | 99.5 | >95 | 90 | 95 |
| Thickness (nm) | 4–20 | x | <30 | x |
| Median size (µm) | 5–10 | x | 5–7 | x |
| Outer diameter (nm) | x | >50 | x | 10–30 |
| Length (µm) | x | 1–5 | x | 10–30 |
| OH-content (%) | x | x | x | 2.48 |
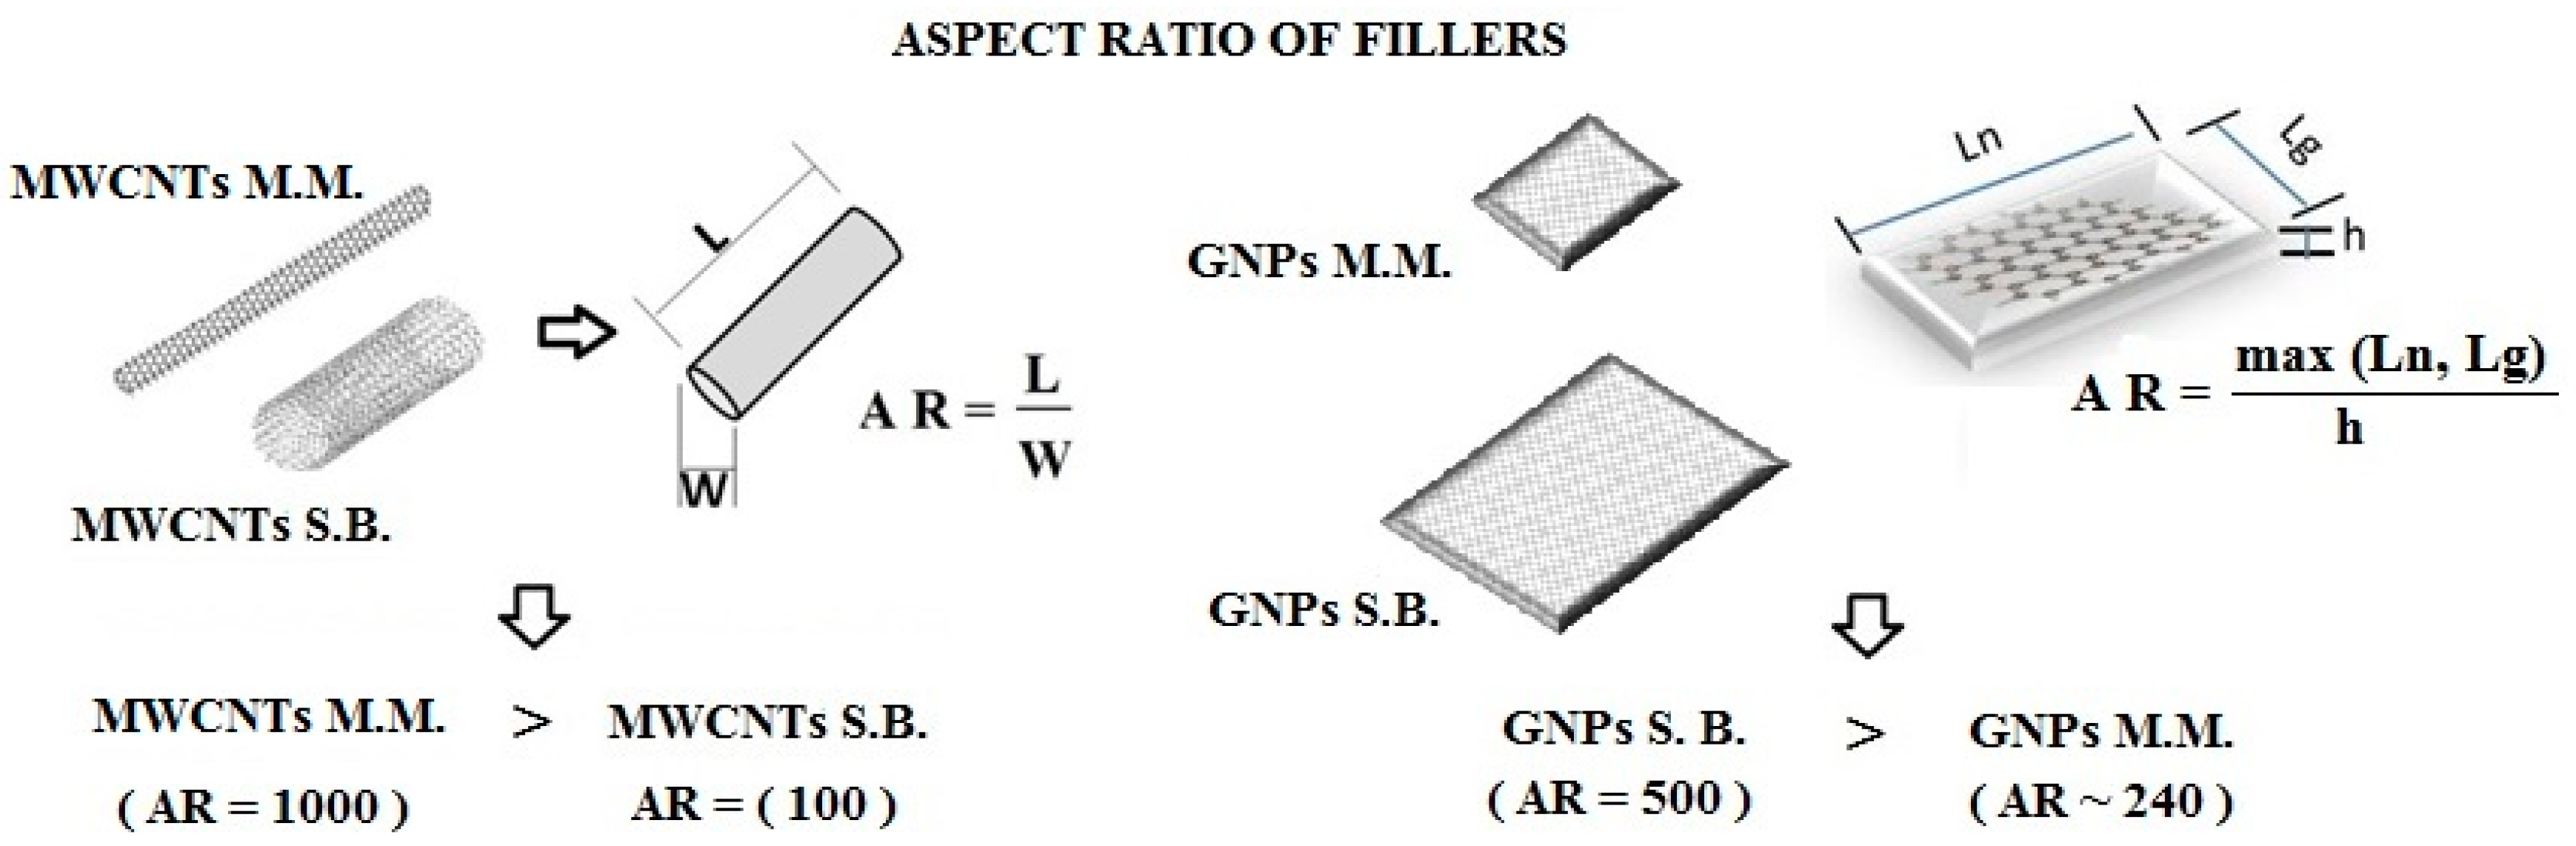
| Aspect ratio | ~500 | ~100 | ~240 | ~1000 |
| True density (g/cm3) | 2.2 | 2.1 | 2.2 | 2.1 |
| Tap Density (g/cm3) | 0.23 | 0.31 | 0.38 | 0.14 |
| Coefficients | Melt Mixing Nanocomposites (M.M.) | Solution Blending Nanocomposites (S.B.) | ||
|---|---|---|---|---|
| MWCNT | GNP | MWCNT | GNP | |
| Aspect ratio (p) | ~1000 | ~240 | ~100 | ~500 |
| а | 0.025 | 0.025 | 0.025 | 0.025 |
| b | 1.372 | 1.307 | 0.9373 | 0.9506 |
| [η] | 329.02 | 34.75 | 4.35 | 11.67 |
| ϕp | <0.015 | <0.03 | <0.015 | <0.03 |
| Sample | 6% GNP | 6% MWCNT | 4.5% GNP/1.5% MWCNT | 3% GNP/3% MWCNT | 1.5% GNP/4.5% MWCNT | neat PLA | ||||||
|---|---|---|---|---|---|---|---|---|---|---|---|---|
| Dielectric permittivity at 30 GHz | ||||||||||||
| Processing | S.B. | M.M. | S.B. | M.M. | S.B. | M.M. | S.B. | M.M. | S.B. | M.M. | S.B. | M.M. |
| ε’ | 6.64 | 9.03 | 4.63 | 9.02 | 10.44 | 9.13 | 6.58 | 11.83 | 8.52 | 11.04 | 2.62 | 2.66 |
| ε″ | 1.19 | 1.10 | 0.76 | 4.67 | 2.55 | 1.59 | 1.71 | 3.64 | 1.58 | 4.51 | 0.04 | 0.01 |
| Dielectric permittivity at 0.3 THz | ||||||||||||
| Processing | S.B. | M.M. | S.B. | M.M. | S.B. | M.M. | S.B. | M.M. | S.B. | M.M. | S.B. | M.M. |
| ε’ | 7.89 | 10.57 | 3.66 | 3.69 | 7.01 | 7.51 | 8.05 | 8.40 | 4.94 | 8.32 | 2.71 | 1.07 |
| ε″ | 3.16 | 3.13 | 0.51 | 0.50 | 2.15 | 2.31 | 4.02 | 3.30 | 2.30 | 3.79 | 0.08 | 0.07 |
| Sample | 6% GNP | 6% MWCNT | 4.5% GNP/1.5% MWCNT | 3% GNP/3% MWCNT | 1.5% GNP/4.5% MWCNT | neat PLA | ||||||
|---|---|---|---|---|---|---|---|---|---|---|---|---|
| Electromagnetic properties at 30 GHz | ||||||||||||
| Processing | S.B. | M.M. | S.B. | M.M. | S.B. | M.M. | S.B. | M.M. | S.B. | M.M. | S.B. | M.M. |
| Absorption | 0.14 | 0.10 | 0.16 | 0.30 | 0.36 | 0.13 | 0.19 | 0.24 | 0.14 | 0.28 | 0.02 | 0 |
| Reflection | 0.62 | 0.70 | 0.50 | 0.58 | 0.56 | 0.68 | 0.59 | 0.62 | 0.66 | 0.60 | 0.27 | 0.28 |
| Transmission | 0.24 | 0.20 | 0.34 | 0.12 | 0.08 | 0.19 | 0.22 | 0.14 | 0.20 | 0.12 | 0.71 | 0.72 |
| EM shielding (A+R), % | 76 | 80 | 66 | 88 | 92 | 81 | 78 | 86 | 80 | 88 | 29 | 28 |
| Electromagnetic properties at 0.3 THz | ||||||||||||
| Processing | S.B. | M.M | S.B. | M.M. | S.B. | M.M. | S.B. | M.M. | S.B. | M.M. | S.B. | M.M. |
| Absorption | 0.67 | 0.68 | 0.42 | 0.41 | 0.59 | 0.6 | 0.69 | 0.67 | 0.7 | 0.69 | 0.1 | 0.12 |
| Reflection | 0.26 | 0.23 | 0.07 | 0.08 | 0.28 | 0.28 | 0.27 | 0.26 | 0.2 | 0.26 | 0 | 0 |
| Transmission | 0.07 | 0.09 | 0.51 | 0.51 | 0.13 | 0.12 | 0.04 | 0.07 | 0.1 | 0.05 | 0.90 | 0.88 |
| EM shielding (A+R), % | 93 | 91 | 49 | 49 | 87 | 88 | 96 | 93 | 90 | 95 | 10 | 12 |
© 2018 by the authors. Licensee MDPI, Basel, Switzerland. This article is an open access article distributed under the terms and conditions of the Creative Commons Attribution (CC BY) license (http://creativecommons.org/licenses/by/4.0/).
Share and Cite
Spinelli, G.; Lamberti, P.; Tucci, V.; Kotsilkova, R.; Tabakova, S.; Ivanova, R.; Angelova, P.; Angelov, V.; Ivanov, E.; Di Maio, R.; et al. Morphological, Rheological and Electromagnetic Properties of Nanocarbon/Poly(lactic) Acid for 3D Printing: Solution Blending vs. Melt Mixing. Materials 2018, 11, 2256. https://doi.org/10.3390/ma11112256
Spinelli G, Lamberti P, Tucci V, Kotsilkova R, Tabakova S, Ivanova R, Angelova P, Angelov V, Ivanov E, Di Maio R, et al. Morphological, Rheological and Electromagnetic Properties of Nanocarbon/Poly(lactic) Acid for 3D Printing: Solution Blending vs. Melt Mixing. Materials. 2018; 11(11):2256. https://doi.org/10.3390/ma11112256
Chicago/Turabian StyleSpinelli, Giovanni, Patrizia Lamberti, Vincenzo Tucci, Rumiana Kotsilkova, Sonia Tabakova, Radost Ivanova, Polya Angelova, Verislav Angelov, Evgeni Ivanov, Rosa Di Maio, and et al. 2018. "Morphological, Rheological and Electromagnetic Properties of Nanocarbon/Poly(lactic) Acid for 3D Printing: Solution Blending vs. Melt Mixing" Materials 11, no. 11: 2256. https://doi.org/10.3390/ma11112256