Dual Sensing Performance of 1,2-Squaraine for the Colorimetric Detection of Fe3+ and Hg2+ Ions
by
 , ,
, ,
Xiaoqian Liu
1,* ,
,
Na Li
1,
Min-Min Xu
2,
Chunhui Jiang
3,
Jianhao Wang
1,
Guoqiang Song
1,* and
Yong Wang
2,* 1
School of Pharmaceutical Engineering and Life Science, Changzhou University, Changzhou 213164, China
2
College of Chemistry, Chemical Engineering and Materials Science, Soochow University, Suzhou 215123, China
3
School of Environmental and Chemical Engineering, Jiangsu University of Science and Technology, 2 Mengxi Road, Zhenjiang 212003, China
*
Authors to whom correspondence should be addressed.
Materials 2018, 11(10), 1998; https://doi.org/10.3390/ma11101998
Submission received: 12 September 2018
/
Revised: 6 October 2018
/
Accepted: 12 October 2018
/
Published: 16 October 2018
Abstract
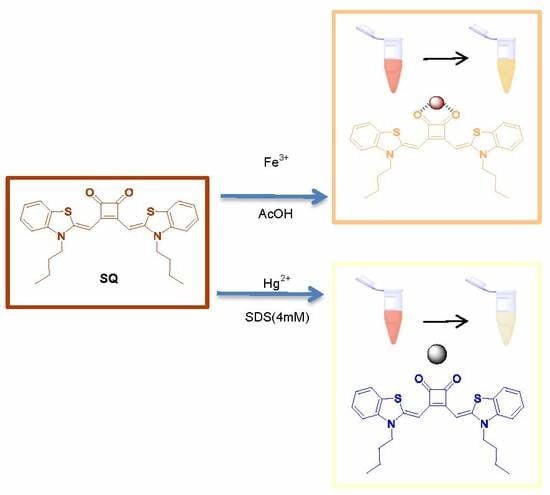
:A simple 1,2-squaraine based chemosensor material (SQ) has been reported to show dual sensing performance for colorimetric detection of Fe3+ and Hg2+ ions. Compared to common instrumental analysis, this method could provide fast and direct detection though colorimetric changes by the naked eye. The sensor has shown excellent selectivity over the other metal ions by tuning different solvent environments. The detection limit for Fe3+ could reach to 0.538 μM, which was lower than that in the environmental agency guideline (U.S. Environmental Protection Agency, U.S. EPA) in drinking water. And for Hg2+ detection, the limit was calculated as 1.689 μM in our case. A 1:1 binding mode between SQ–Fe3+ and SQ–Hg2+ ion were evidenced by Job’s plot measurement and IR analysis. The proposed different binding mechanisms were also supported by Density Function Theory (DFT) calculation. All these findings provide a unique material and a simple, facile, and low cost colorimetric method for dual metal ions analysis and have shown preliminary analytical applications in industrial water sample analysis.
1. Introduction
Development of selective and sensitive chemosensor materials for metal cation ions has attracted considerable attention owing to their key role and potential applications in chemistry, materials, and the environment [1,2,3,4,5,6,7,8,9,10,11]. Among heavy metals, iron is one of the essential elements playing an important function in a wide range of biological process, such as cellular metabolism, oxygen carrying, and regulation of enzyme reactions [12,13,14,15,16]. Meanwhile, mercury is considered a toxic element that has harmful effects on the human health and the environment. Accumulation of mercury in the body will cause severe health problem, especially damage of the central nervous system [17,18,19,20]. Therefore, a convenient and rapid method for the analysis of Fe3+ and Hg2+ is highly in demand. Current analytical techniques such as atomic absorption spectroscopy, inductively coupled plasma mass spectroscopy, and electrochemical analysis require sophisticated instruments and complex sample preparation procedures, which limit their wide applications [21,22,23,24,25]. It is imperative to develop simple material and effective methods for the detection of these ions. The use of a chemosensor material provides unique advantages in a view of sensitivity and response time. One strategy for the design of such molecules involves introducing an appropriate binding ligand to the chromophore in which optical responses are affected by the complexation process [26,27]. A serious of chromophore based materials has been developed, including squaraines, fluorescein, rhodamine, quinolones, porphyrins, coumarin, etc. [28,29,30,31,32,33,34]. However, design of a binding group which will be highly selective to each ion individually is not an easy proposition considered many ions share similar optical properties. Recently, another strategy for applying one single chemosensor material in simultaneous colorimetric detection of multiple metal ions has attracted great interests. The detection can be straightforward as long as the analysis shows differential responses to the metal ions. The strategy allows minimizing the multistep organic synthesis and accelerating the discovery process. A few examples have been reported to achieve multiple ion detections [35,36,37,38,39,40]. However, materials for dual detection of Fe3+ and Hg2+ are relatively rare. In this context, the design and synthesis of simple, facile, low cost colorimetric material for selectively recognition of Fe3+ and Hg2+ remains a challenge.
Squaraines are a class of versatile organic dyes which exhibit unique optical properties, such as intense absorption and efficient fluorescence emission in the visible to near infrared region [41,42]. They can be versatile by linking different electron donors based on heterocyclic structure such as aniline, indole group to the squaric core which acts as an electron acceptor [43,44,45,46,47]. Squaraines are suitable for use in chemosensors because the optical properties can be tuned by external factors such as change in polarity and pH of solvent, temperature or the addition of additives. We are gratifying to present 3,4-bis((Z)-(3-butylbenzo[d]thiazol-2(3H)-ylidene)methyl) cyclobut-3-ene-1,2-dione (SQ) to perform dual colorimetric sensing of Fe3+ and Hg2+, spontaneously, by tuning the solution environment. The sensor was sensitive in diverse solvent environments. It gave a selective color change from orange to cream yellow for addition of Fe3+ in acetic acid with a limit of 0.538 μM which was much lower than the limit in the U.S. environmental protection agency guideline (5.37 μM), while presenting a color change from orange to grain yellow for Hg2+ detection in the high concentrations of anionic surfactant sodium dodecyl sulfonate (SDS) solution with a detection limit of 1.689 μM. The binding constants and properties of 1,2-squanraine towards these two metal ions were further investigated by Job’s plot measurements, IR spectrums, and Election Spray Ionization-Mass spectra (ESI-MS), respectively. Other excess metal ions as interferences in the system show both negligible effects on the 1,2-squaraine towards Fe3+ and Hg2+ detections. Two different complexation patterns were then proposed. The two adjacent oxygen atoms at the electron deficient cyclobutene ring provided extra electron pairs with Fe3+ while the complexation towards Hg2+ differed another way. Further Density Function Theory (DFT) calculations have supported the hypothesis. Finally, the SQ material has proven to be successful in real sample applications.
2. Materials and Methods
2.1. Chemicals and Materials
Unless stated, all the chemicals used were purchased from commercial sources without purification. 1H NMR (400 MHz) and 13C NMR (400 MHz) spectra were recorded on a Bruker AV-400 spectrometer (Bruker, Beijing, China, Tetramethylsilane as internal standard). Mass spectrometry analysis was performed on a Q Exactive mass spectrometer (Thermo Fisher Scientific, Shanghai, China). Absorption spectra were measured on Molecular Device Spectrometer 5 (Molecular Devices Corporation, San Jose, CA, USA). Infrared spectra were performed on a Digilab FTS-3000 FT-IR spectrophotometer (Digilab, Hopkinton, MA, USA).
2.2. General Procedures for UV-Vis Experiments
A stock solution of SQ was prepared 10 mM in dimethyl sulfoxide, DMSO. Further dilutions were made to prepare 100 μM of SQ by adding different solutions. Heavy metal ions stock solutions were prepared 10 mM in distilled water and diluted further accordingly. In UV-Vis experiments, 2 μL of 10 mM SQ solution and 2 μL of 10 mM heavy metal ions were extracted from stock solution and diluted with 196 μL of solvent to make a total volume of 200 μL. In this case, the concentration for SQ was fixed at 100 μM (100 time dilutions from the stock solution). After mixing for 1 min, the absorption measurements were made in 96 well plates on Molecular Device Spectrometer 5 (Molecular Devices Corporation, San Jose, CA, USA) at the wavelength range of 350 nm to 750 nm.
2.3. Job’s Plot Measurements
The stock solutions of sensor SQ (10 mM) in DMSO and FeCl3 (10 mM) in distilled water were prepared, respectively. 0.2 μL, 0.4 μL, 0.6 μL, 0.8 μL, 1.0 μL, 1.2 μL, 1.4 μL, 1.6 μL, 1.8 μL of the sensor SQ (10 mM) solution were taken and transferred to the vials. 1.8 μL, 1.6 μL, 1.4 μL, 1.2 μL, 1.0 μL, 0.8 μL, 0.6 μL, 0.4 μL, 0.2 μL of FeCl3 (10 mM) was added to each sensor solution to make a total volume of 200 μL in acetic acid, separately. After stirring the solution for a few seconds, the absorption spectra were recorded at absorption maximum wavelength. The plots were drawn by plotting Ao/(Ao − A) vs. 1/[Fe3+], where Ao equaled to absorption intensity of SQ without Fe3+, A was corresponded to the absorption intensity of SQ with different concentration of Fe3+. The Job’s plot procedures for SQ towards Hg2+ were similar as above. HgCl2 water solution and 4 mM SDS buffer were used instead.
2.4. Competition Tests
2 μL of NaCl, KCl, LiBr, AgNO3, ZnCl2, HgCl2, CdSO4, FeCl2, CoCl2, CaCl2 salt solutions (stock: 10 mM) was extracted individually and mixed with 2 μL Fe3+ (stock: 2 mM), 2 μL SQ (10 mM) and filled up with acetic acid to total volume of 200 μL. After stirring the solutions for a few seconds, UV-Vis spectra were recorded at room temperature. For the case of Hg2+ detection, HgCl2 solution was used instead of FeCl3.
3. Results
3.1. Spectral Properties of SQ
The synthesis of sensor SQ was followed as reported literature [48] and the characterization for the compound was summarized in Figures S1–S3. The product was distinct from common squaraine as two carbonyl groups (C=O) on squaric core were adjacent to form 1,2-regioisomer instead of 1,3-regioisomer. It has two cross-conjugated-electron systems from hetero aromatic donor to the squaric core as donor acceptor. There are potential binding sites including two carbonyl groups (C=O) on squaric core and sulfur atom on the substituted 3-butyl-2-methylbenzo[d]thiazol-3-ium iodide which could provide extra electron pairs to the metal ions. There are many literatures that reported 1,3-regioisomer can be applied in the recognition of several metal ions [49,50,51,52]. We believe that besides 1,3-regioisomer, 1,2-regioisomer may also function as a metal ion detector in some circumstances.
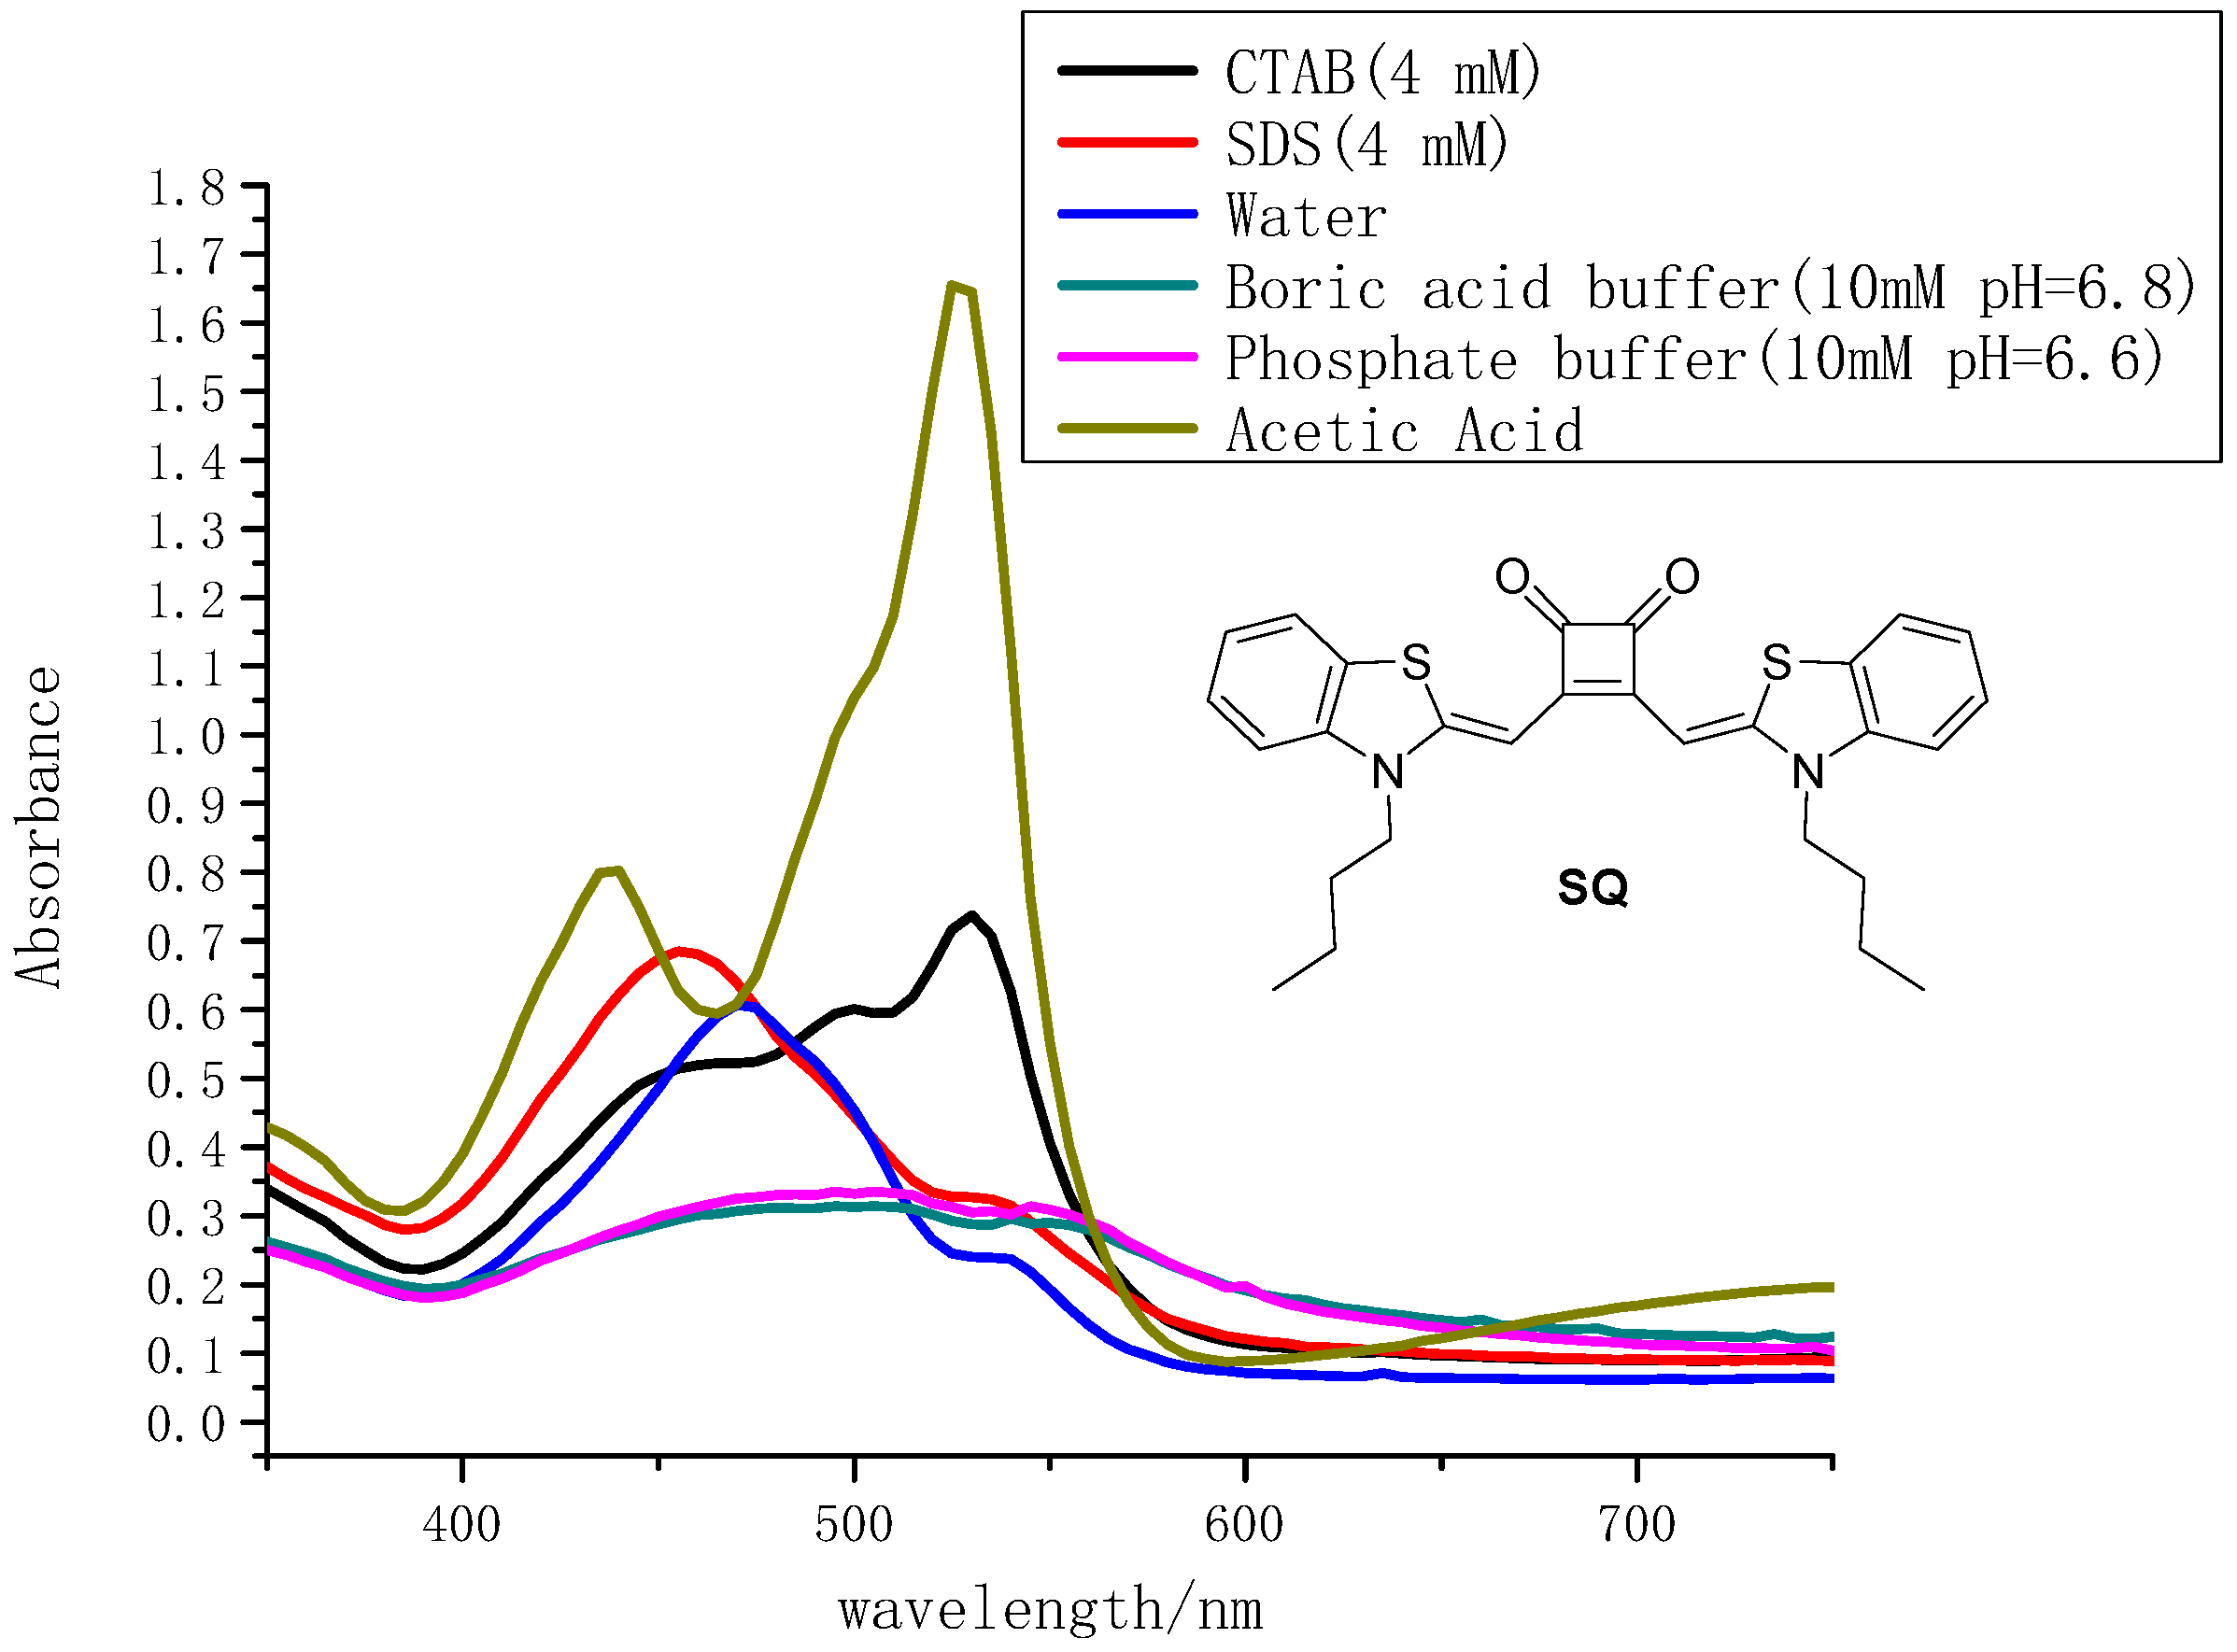
An important characteristic of squaraines is their tendency to form different patterns of aggregations, resulting in a dramatic color modulation [53,54]. We carried out the dilution experiments in some selected solvents (pure acetic acid and 4 mM SDS solution) by UV-Vis measurements to see if there were aggregations for SQ and the results were shown in supporting information (Figure S4a,b). It has shown that the absorption intensities decreased both in pure acetic acid and 4 mM SDS solution with the decrement of the SQ concentrations (10−4–10−6 M). The linear range of concentration of SQ in two different solvents was 1 μM to 10 μM by using the Beer–Lambert law. No absorption wavelength of SQ was shifted which suggest SQ was sensitive to the solvent environment but no aggregation can be concluded from the current data. The molar absorption coefficient of SQ in the linear range was not changed. A series of other solvents was applied in the UV-Vis measurements. Two microliters was extracted from 10 mM SQ stock solution and diluted with 198 μL corresponding solvent to get the total volume of 200 μL. The final concentration of SQ was 100 μM (100 times dilution). The absorption data for SQ in different solutions were summarized in Figure 1. SQ exhibited a maximum absorption wavelength at 475 nm in pure distilled water. While in boric acid buffer (10 mM, pH = 6.8) and phosphate buffer (10 mM, pH = 6.6), it gave a broad flat band in absorption range of 400 nm to 600 nm. Interestingly, it was found that in pure acetic acid, SQ showed two maximum absorption peaks individually at 430 nm and 525 nm. The addition of the cationic surfactant hexadecyl trimethyl ammonium bromide (CTAB) gave a relative broad absorption peak with maximum wavelength of 530 nm. SQ in anionic surfactant sodium dodecyl sulfonate (SDS) solution exhibited slight blue shift to 455 nm in the absorption spectra compared to that in the distilled water.
3.2. Colorimetric Sensing for Fe3+ and Hg2+
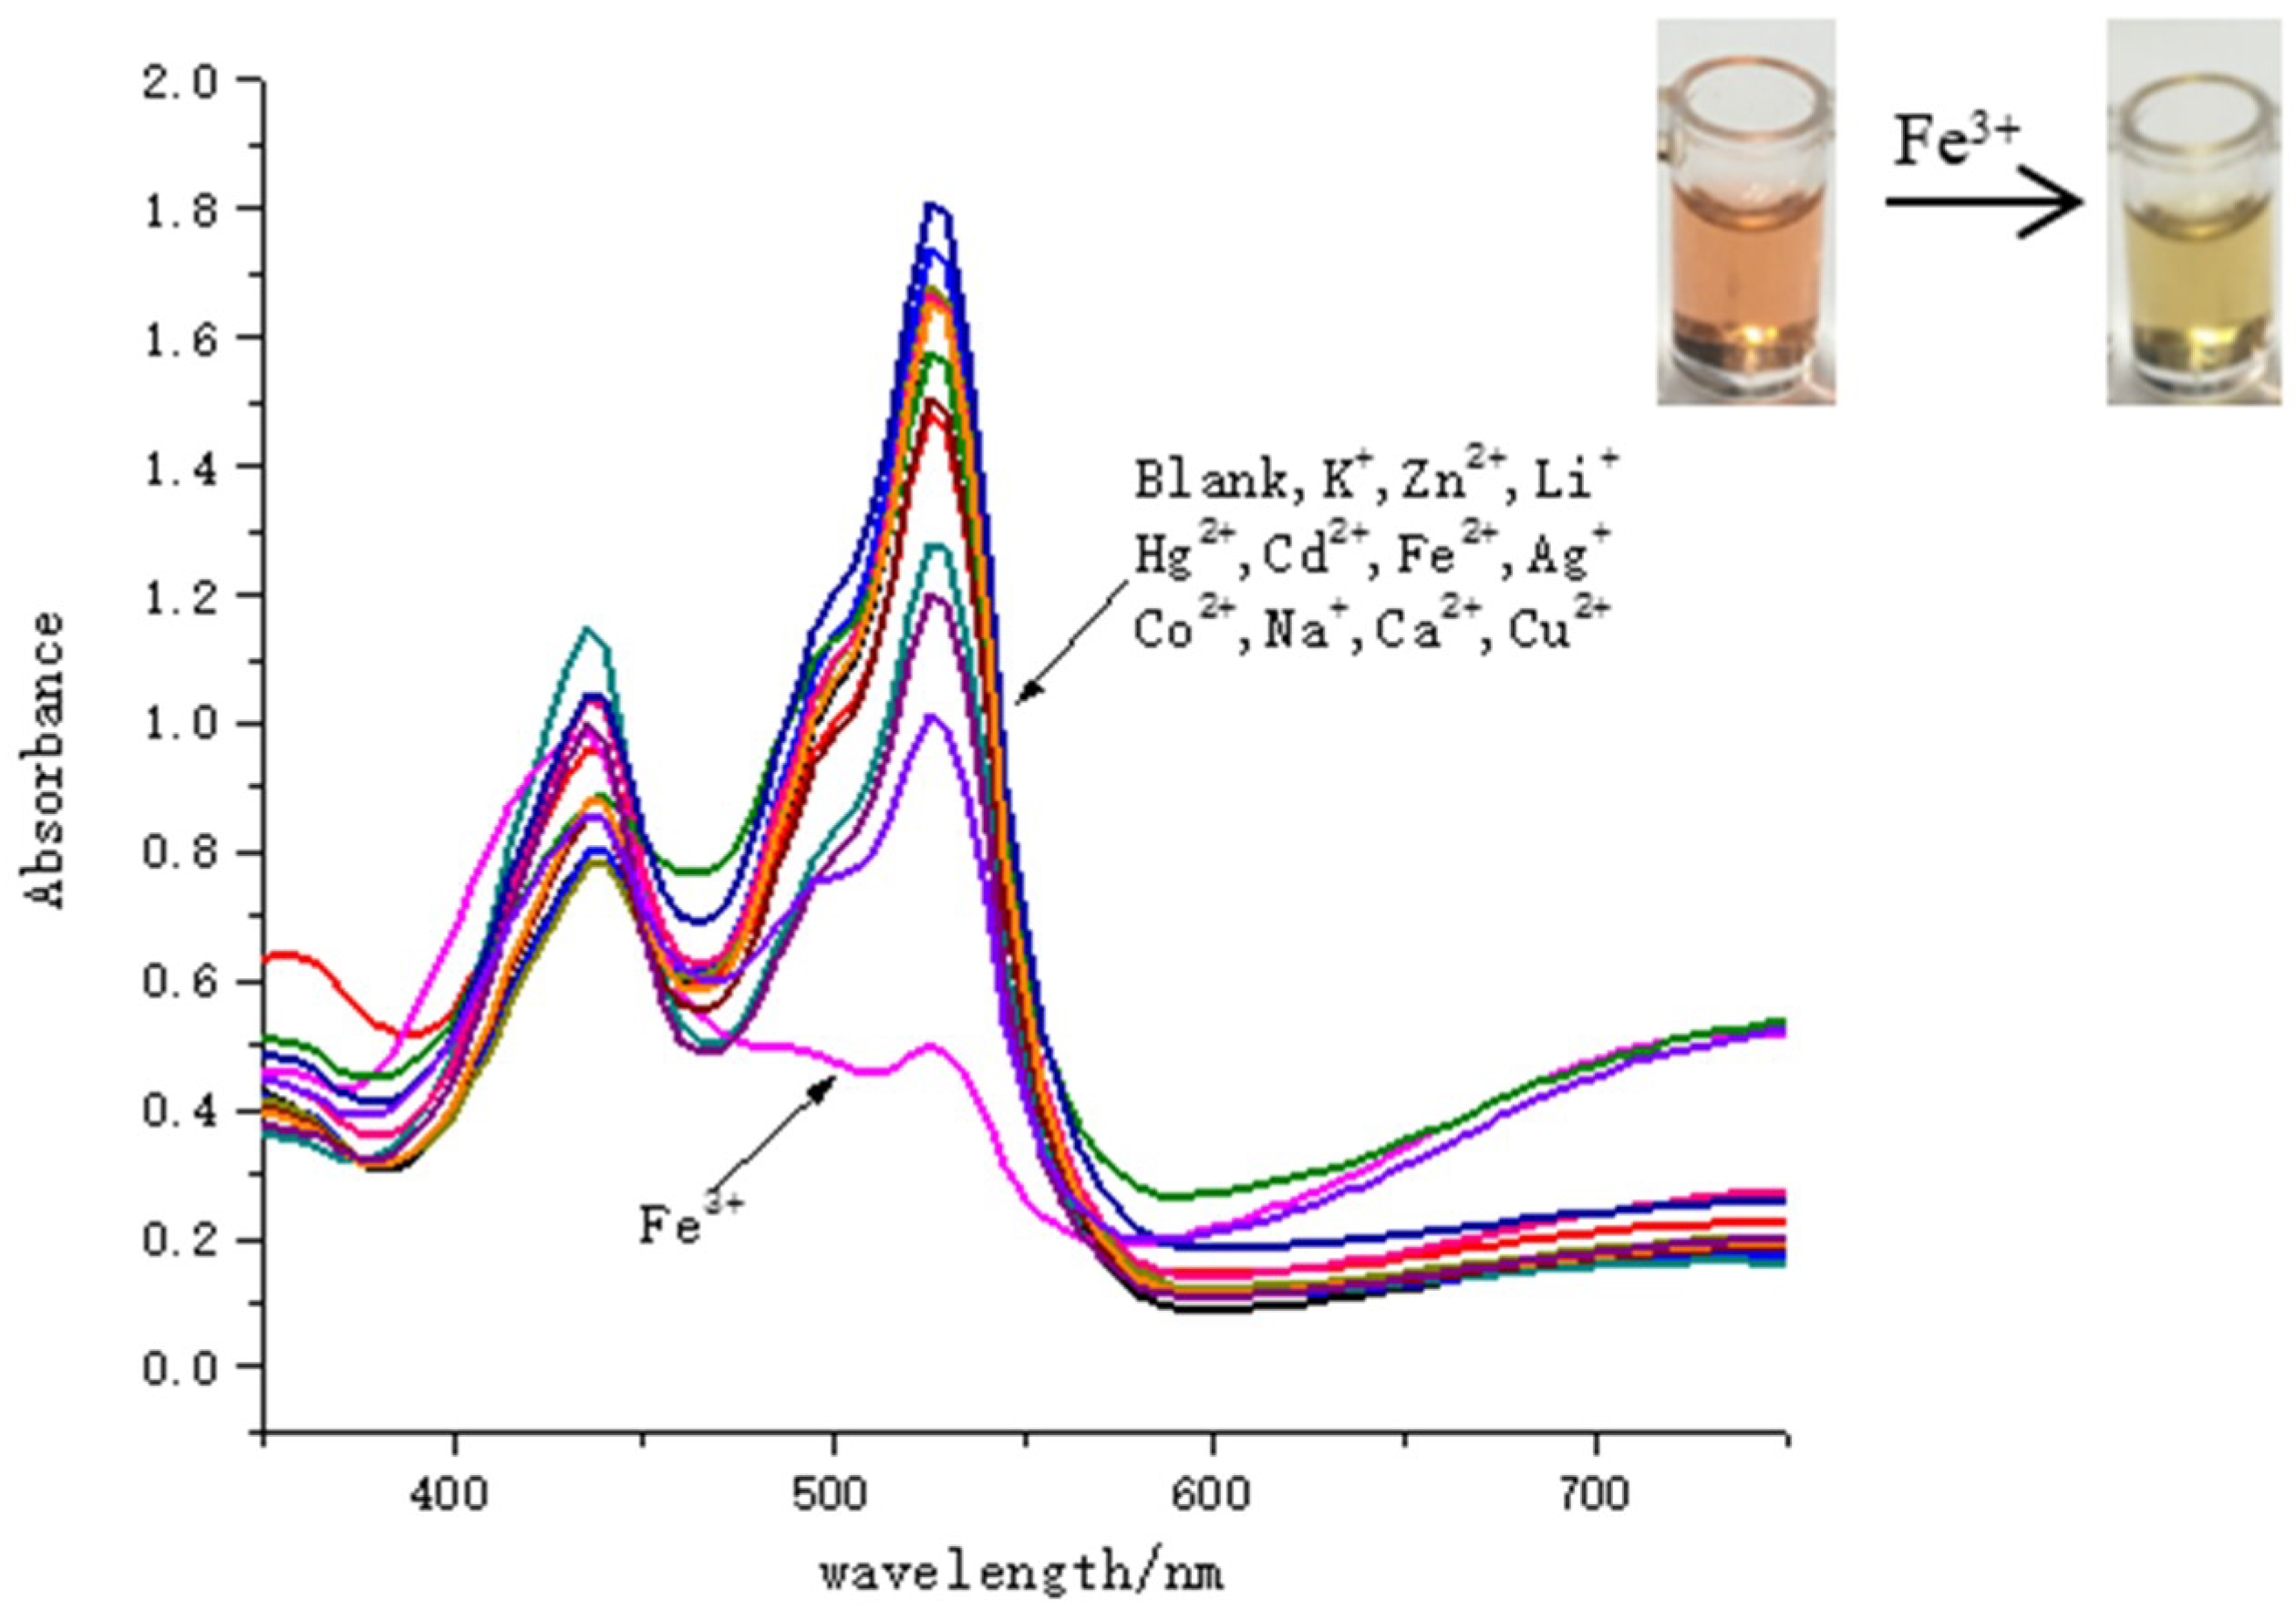
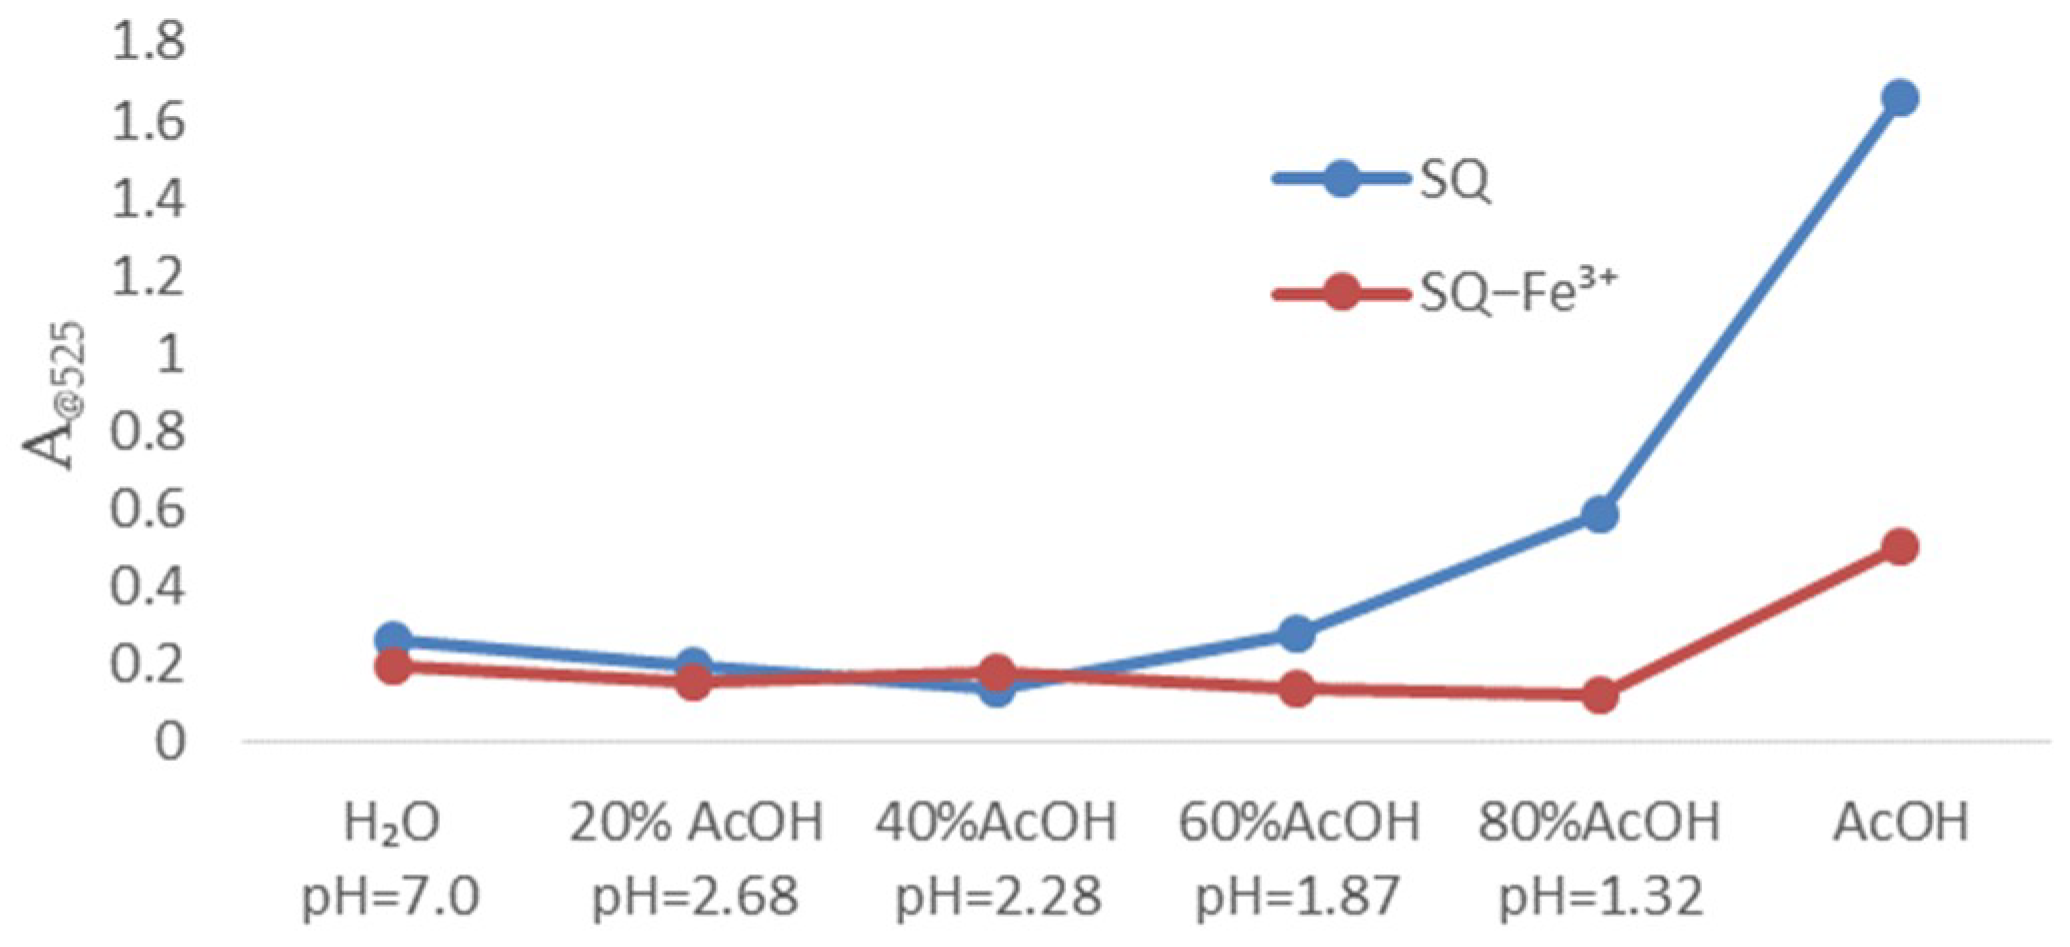
To evaluate the sensing properties of SQ (final concentration: 100 μM) towards metal ions, the UV-Vis spectral changes were investigated with addition of various metal ions including Na+, K+, Li+, Ag+, Zn2+, Hg2+, Cd2+, Fe2+, Co2+, Ca2+, Fe3+ (final concentration: 100 μM) in pure acetic acid. As shown in Figure 2, there were no significant spectral changes in the presence of most metal ions, whereas Fe3+ caused the distinct spectral changes with absorption intensity decreased in 525 nm. And Fe3+ pronounced color changes from orange to cream yellow by direct visualization. The water effect on detection of Fe3+ for SQ in AcOH-H2O solutions was further evaluated (Figure 3). There were gradually decreased absorption bands at 525 nm of SQ with increasing portion of water in acetic acid. The pH effect on the selectivity of SQ for Fe3+ has been observed as well. With increasing amount of AcOH in solution, the pH decreased gradually but the absorption intensity of SQ itself dramatically enhanced. In addition, only a distinct difference in absorption bands was observed in pure acetic acid for SQ with or without addition of Fe3+. We have also monitored the absorption changes of SQ in pure acetic acid and after 24 h, there were no significant changes in view of UV-Vis spectral (Figure S5a). In addition, 1HMR spectrum of SQ in CD2Cl2 after 24 h (Figure S5b) shown with no decomposition preliminarily revealed its stability in this condition. All these results indicated that SQ can be a good probe for detecting Fe3+.
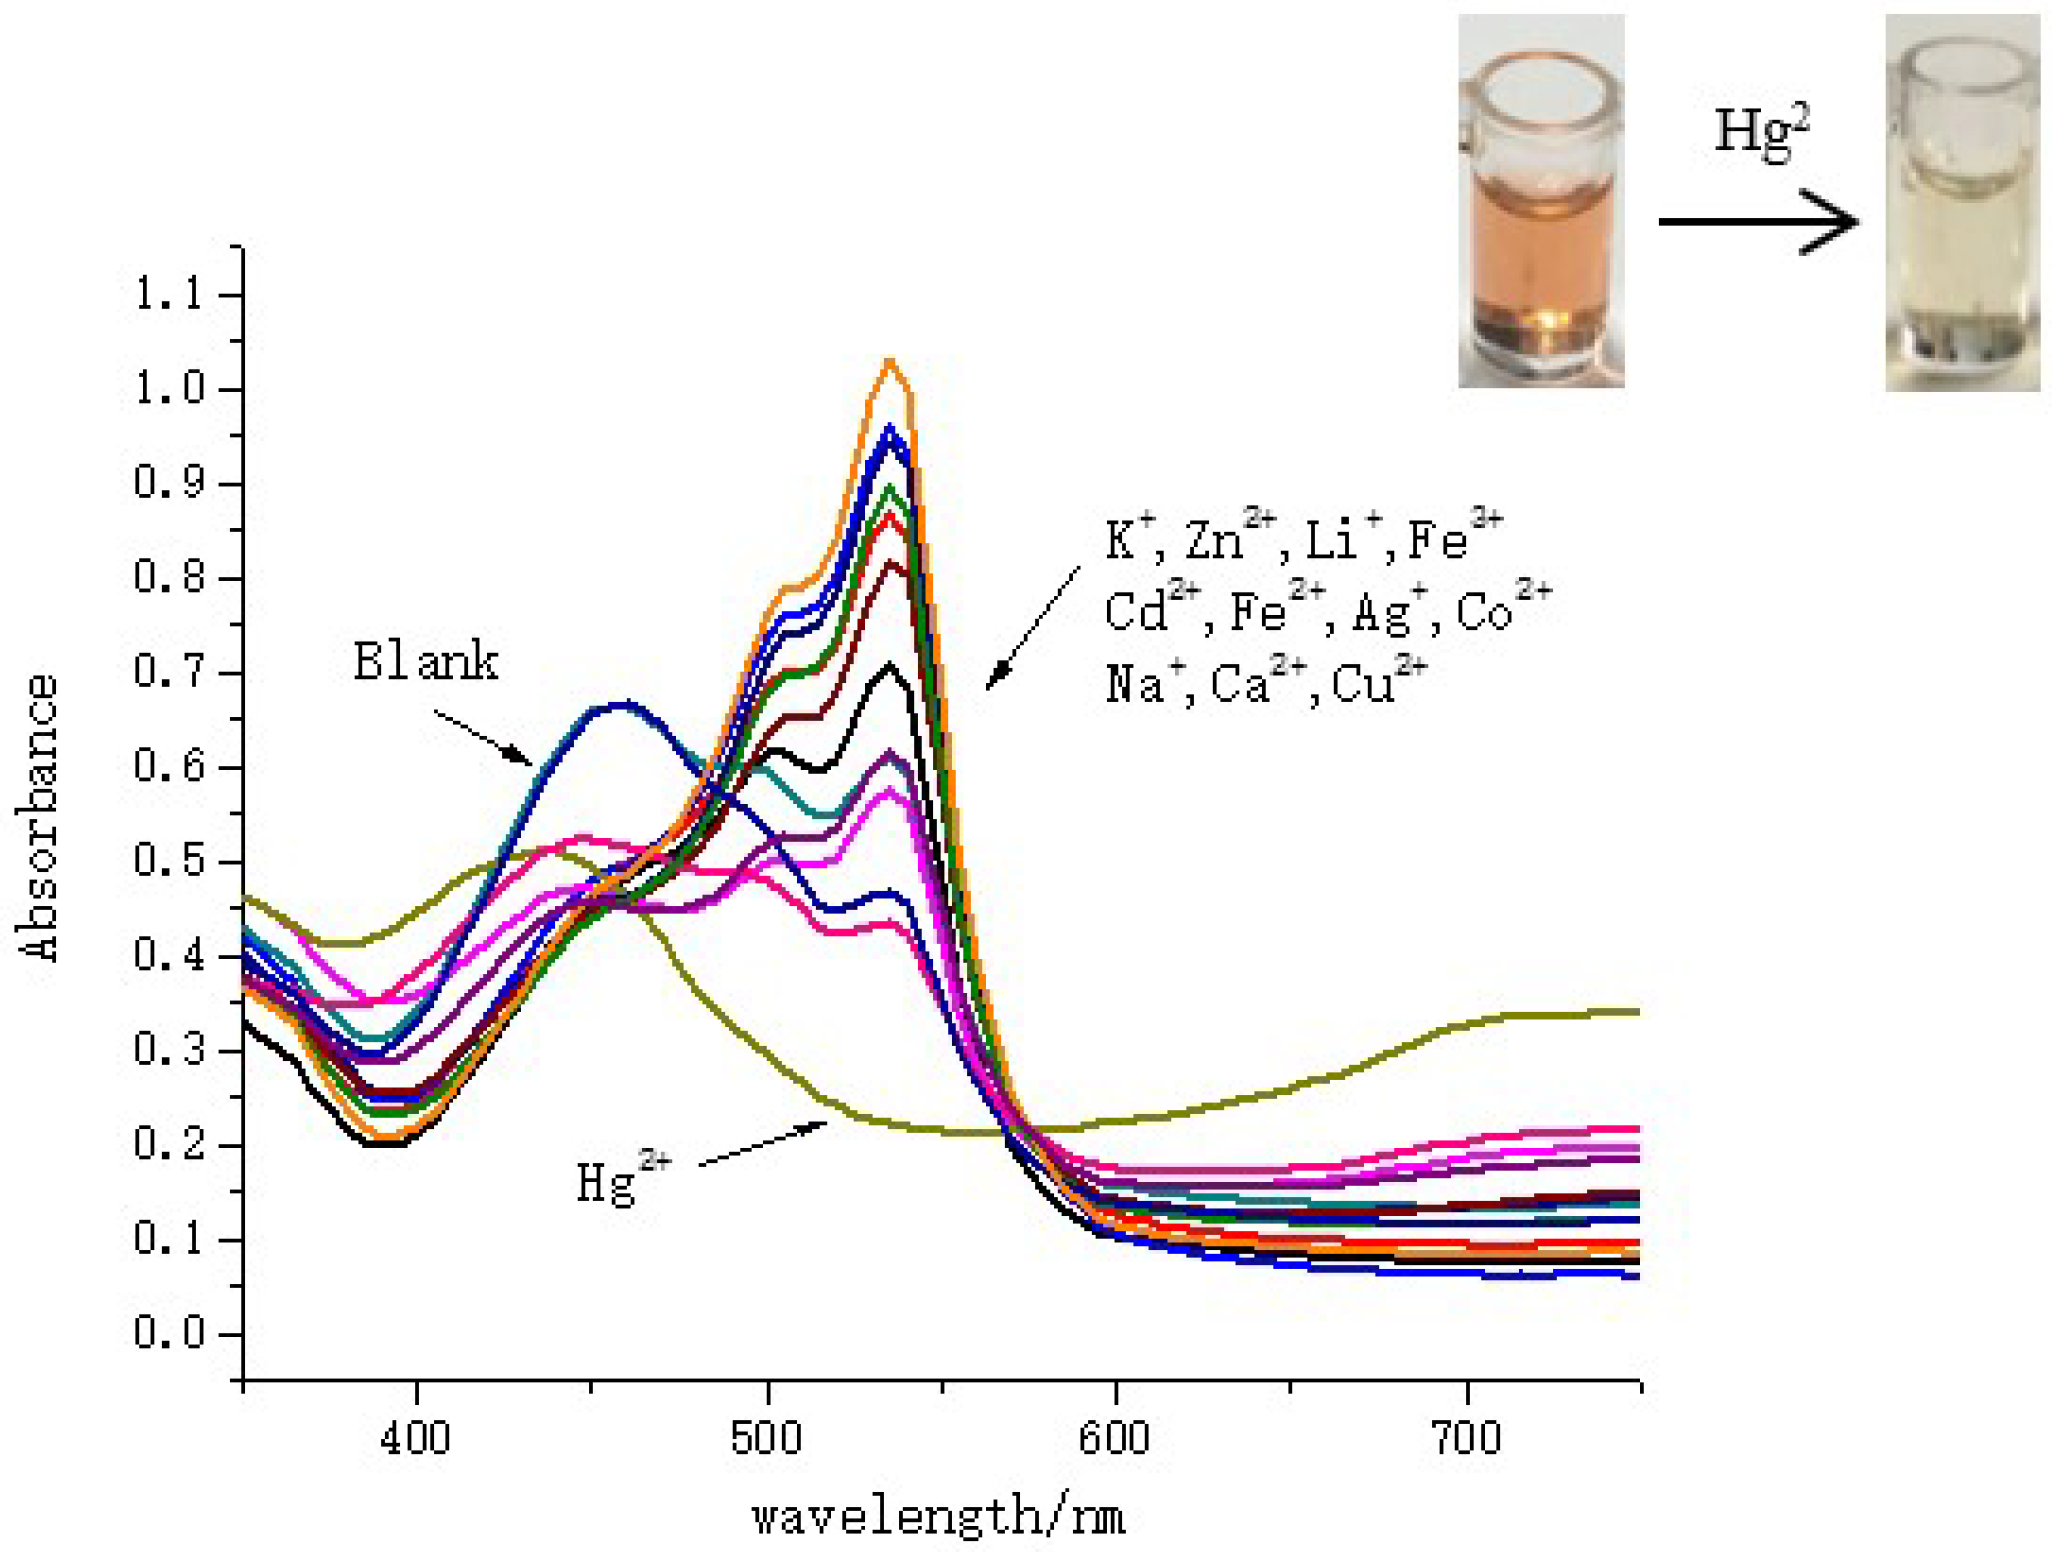
Another interesting phenomenon was discovered in the detection of Hg2+ in SDS surfactant solutions. As shown in Figure 4, when various metal ions were added into SQ solutions in presence of 4 mM SDS, the single absorption band of SQ at 455 nm (maximum absorption wavelength without metal ions) was red shift to 535 nm except for Hg2+. Upon addition of Hg2+, the absorption band at 535 nm decreased gradually, while the absorption in the range of 650 nm to 750 nm increased with one clear isosbestic point, which indicating the binding between SQ and Hg2+ afforded only one species. This new peak might be ascribed to a metal-to-ligand charge transfer [55,56].
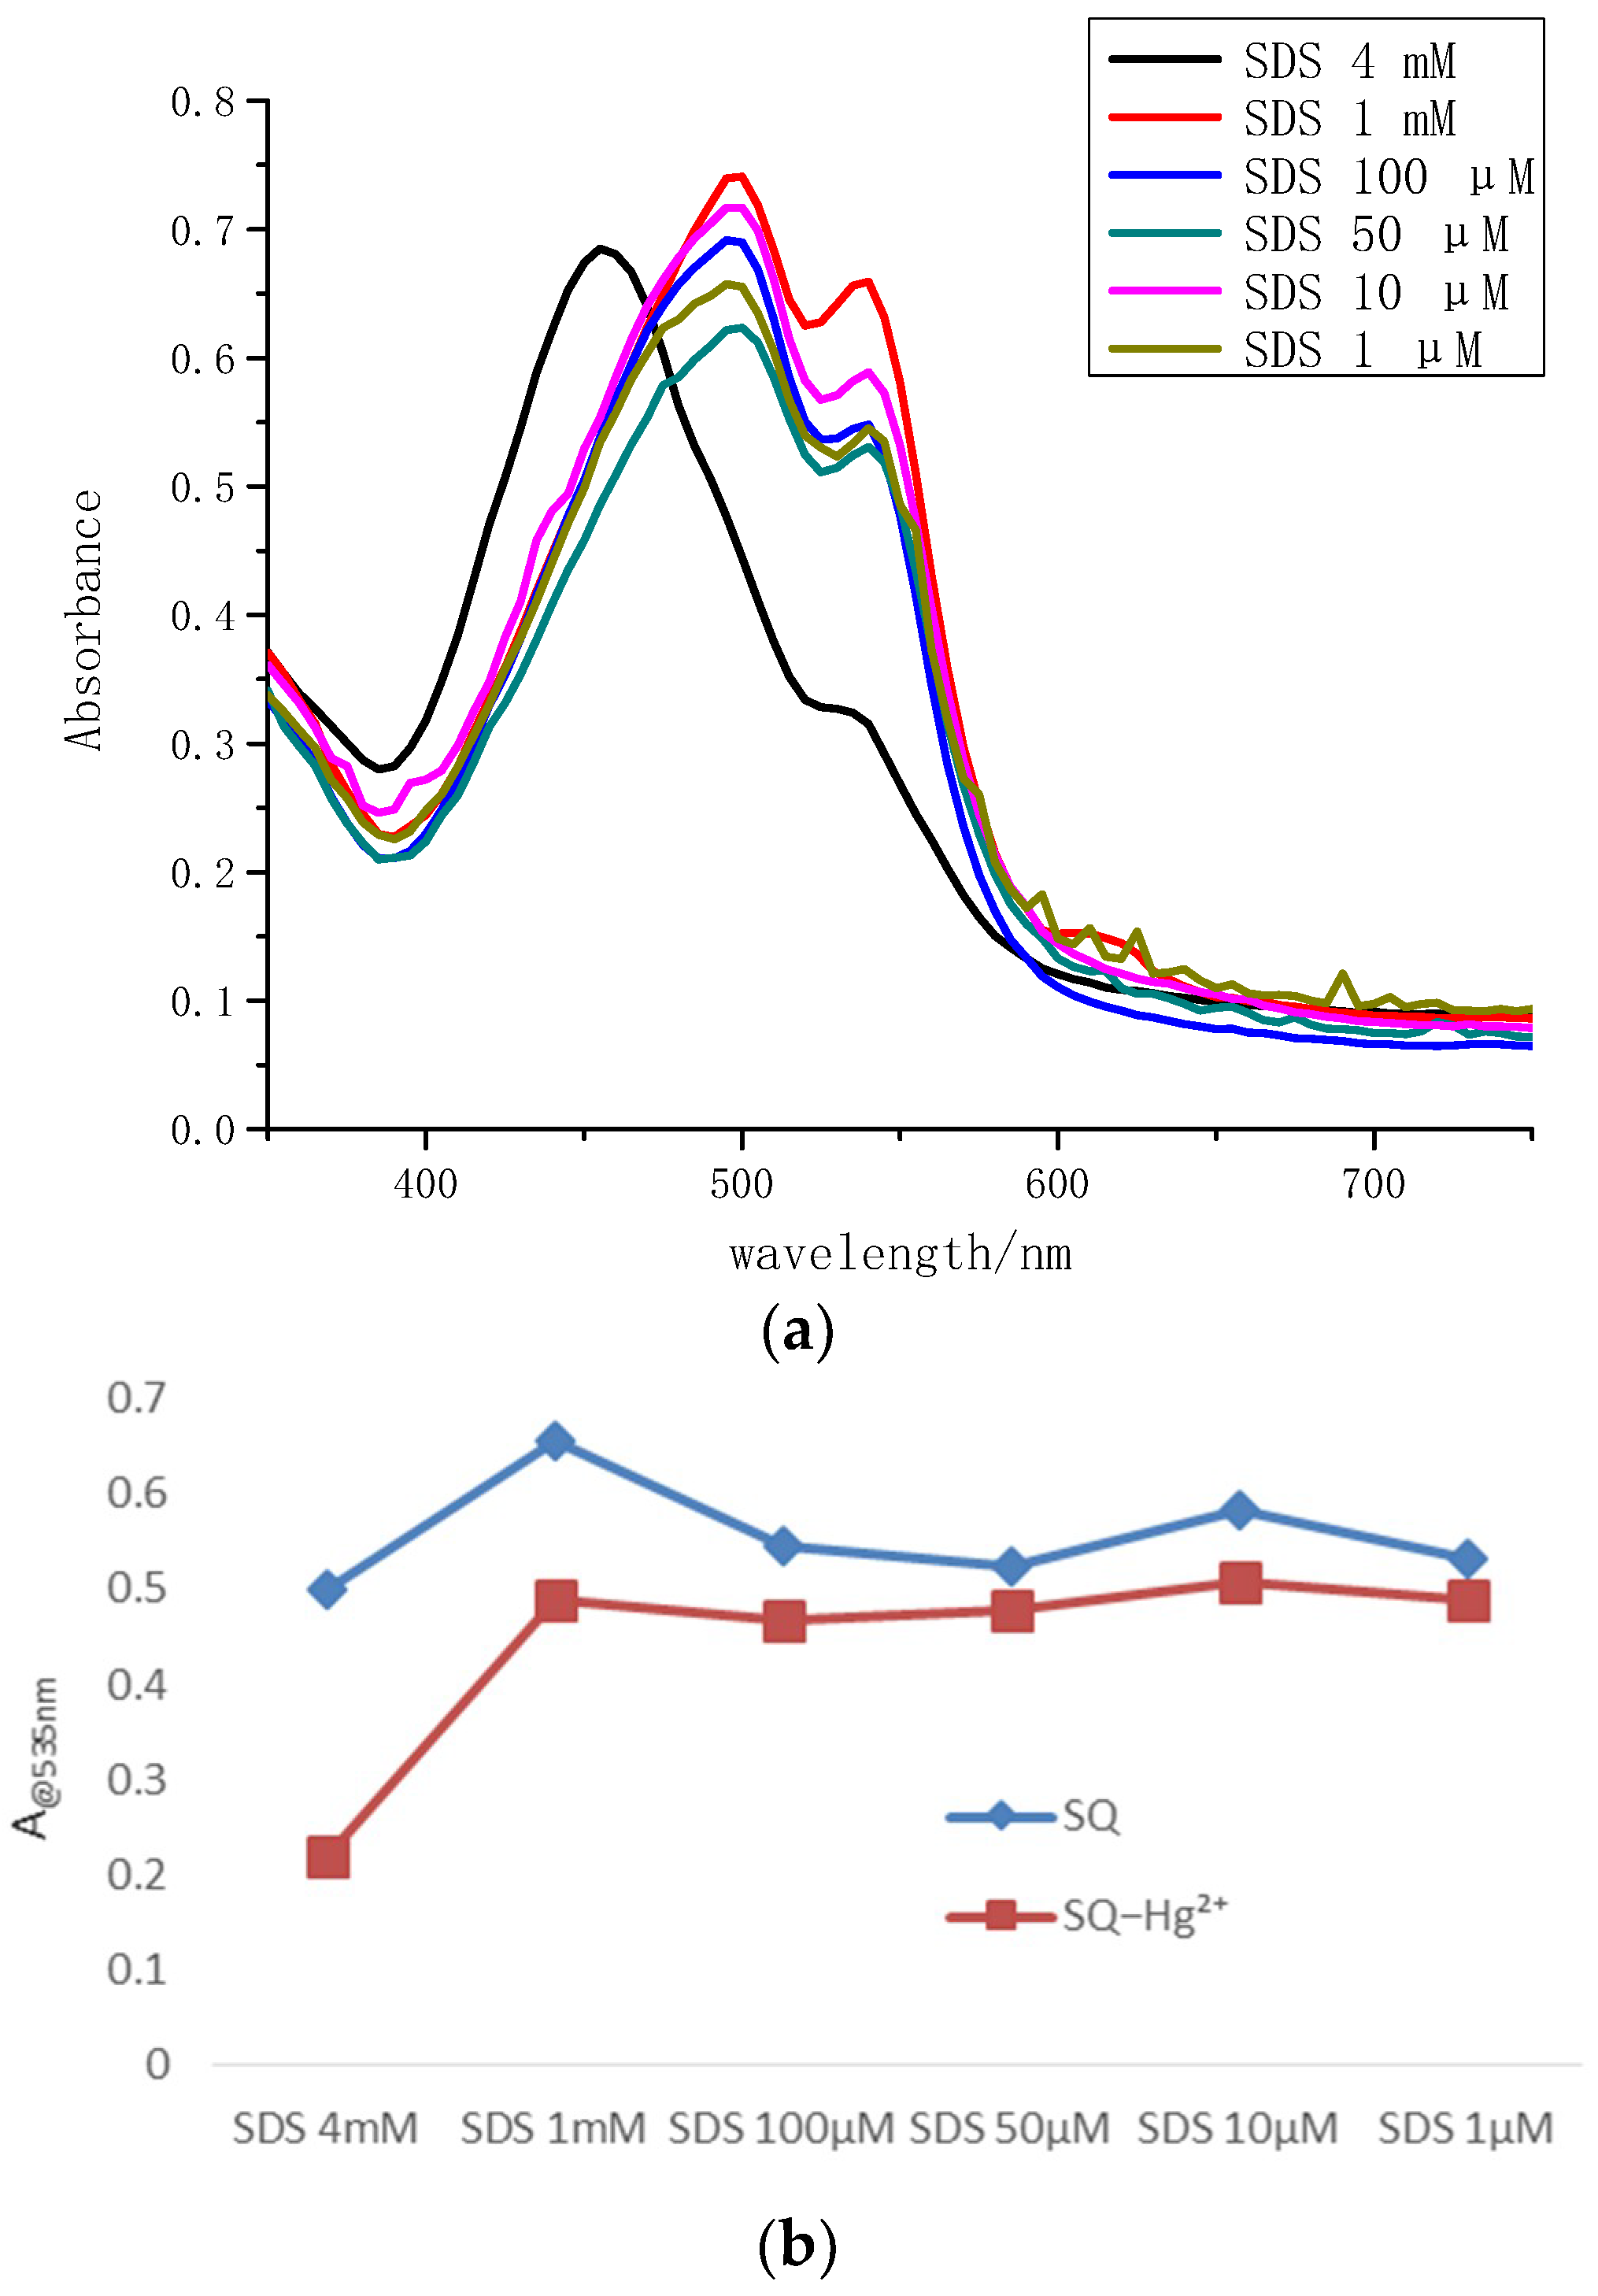
To evaluate the SDS effect on the Hg2+ detection, wide concentrations (1 μM–4 mM) of SDS solutions were adopted in Figure 5a. It was shown that when SDS concentration reached at 4 mM which was higher than critical micelle concentration (CMC) of SDS, the maximum absorption wavelength of SQ without metal ions exhibited a blue shift to 455 nm. It was found that the relative changes of SQ absorption intensity in 4 mM SDS micellar solution at 535 nm discriminate the most compared to that in other concentrations in the case of Hg2+ detection (Figure 5b). The solution of SQ in 4 mM SDS displayed an orange color, and the addition of Hg2+ caused an instant vivid color change from orange to grain yellow. The difference in color response allowed SQ to easily distinguish between Fe3+ and Hg2+ in aqueous solution.
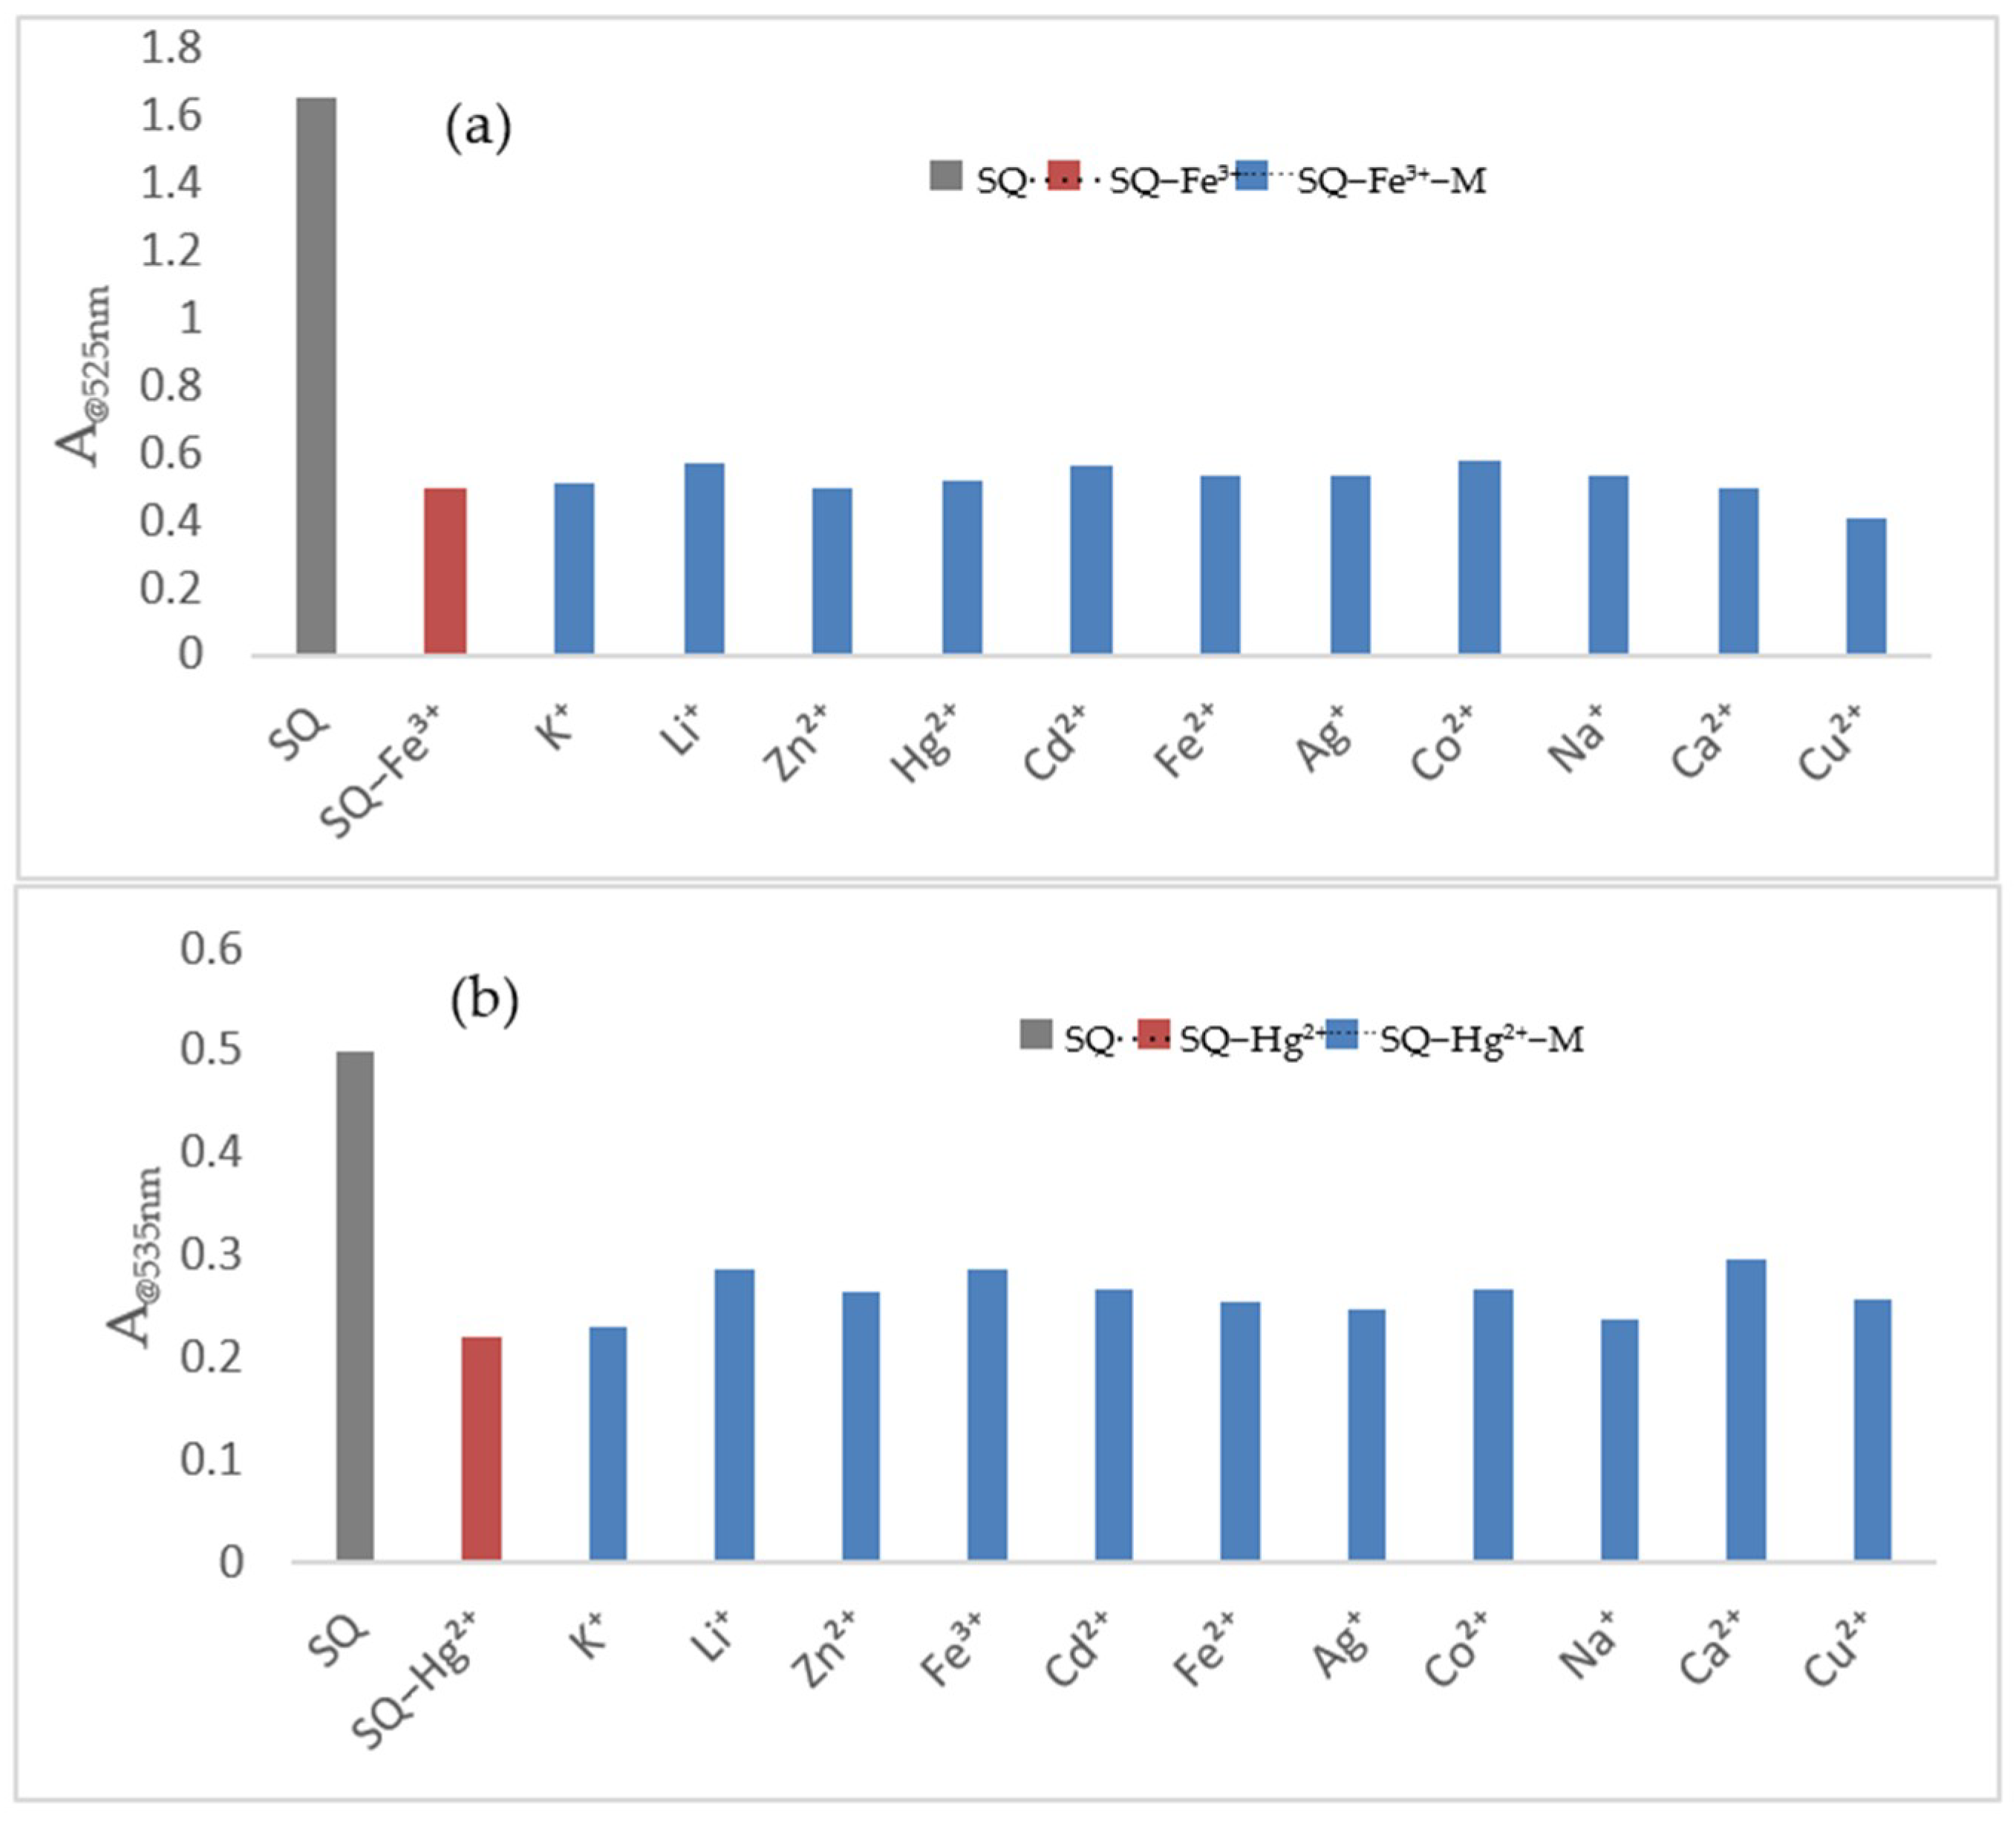
To validate the selectivity for Fe3+ and Hg2+, respectively, the competition experiments have also been performed. Other different ions as interferences were added to the mixture of SQ–Fe3+ or SQ–Hg2+ solution. The final concentration of other cations (100 μM) was 5 times more than that of Fe3+ (20 μM) and Hg2+ (20 μM) in the SQ solution. As shown in Figure 6a,b, there were no significant influences on Fe3+ and Hg2+ detections even extra amounts of other ions were added into the SQ–Fe3+ and SQ–Hg2+ system. All these findings suggest SQ exhibit high selectivity for Fe3+ and Hg2+ compared to other metal ions and it could be used as a colorimetric chemosensor for dual analytes analysis.
For the purpose of exploring the relationship between absorption intensity and response time, a dynamic study of SQ in the detection of Fe3+ and Hg2+ was carried out. After direct addition of Fe3+, the cream yellow color of SQ–Fe3+ was faded instantly and to total colorless after 10 h and for SQ–Hg2+, it took a longer time to get a total colorless solution (Figure S6a,b).
The reversibility and regeneration are essential for materials in practical applications. The reversibility of the recognition process of sensor SQ was performed by a reversible binding experiment. Ethylenediaminetetraacetic acid (EDTA) as a strong chelator was added into both SQ–Fe3+ and SQ–Hg2+ complex systems. Addition of 1 equivalent EDTA to SQ–Fe3+ system resulted in an increasing of absorption signal at 525 nm, indicating the regeneration of free SQ (Figure S7). With the alternate addition of constant concentrations of Fe3+ to SQ solution, the instant color change was observed again which exhibited good stability with a little signal decay for several cycles (Figure S8). For Hg2+, while after addition of 1 equivalent EDTA to SQ–Hg2+ system, a distinct absorption band with observed and the alternate addition of constant concentrations of Hg2+ has shown no dominant absorption changes (Figures S9 and S10). These clear findings of colorimetric ON/OFF behavior of the sensing system suggested that SQ serve as a good reversible sensor for Fe3+ detection.
3.3. Binding Constant (Ka) and Limit of Detection (LOD) for Fe3+ and Hg2+
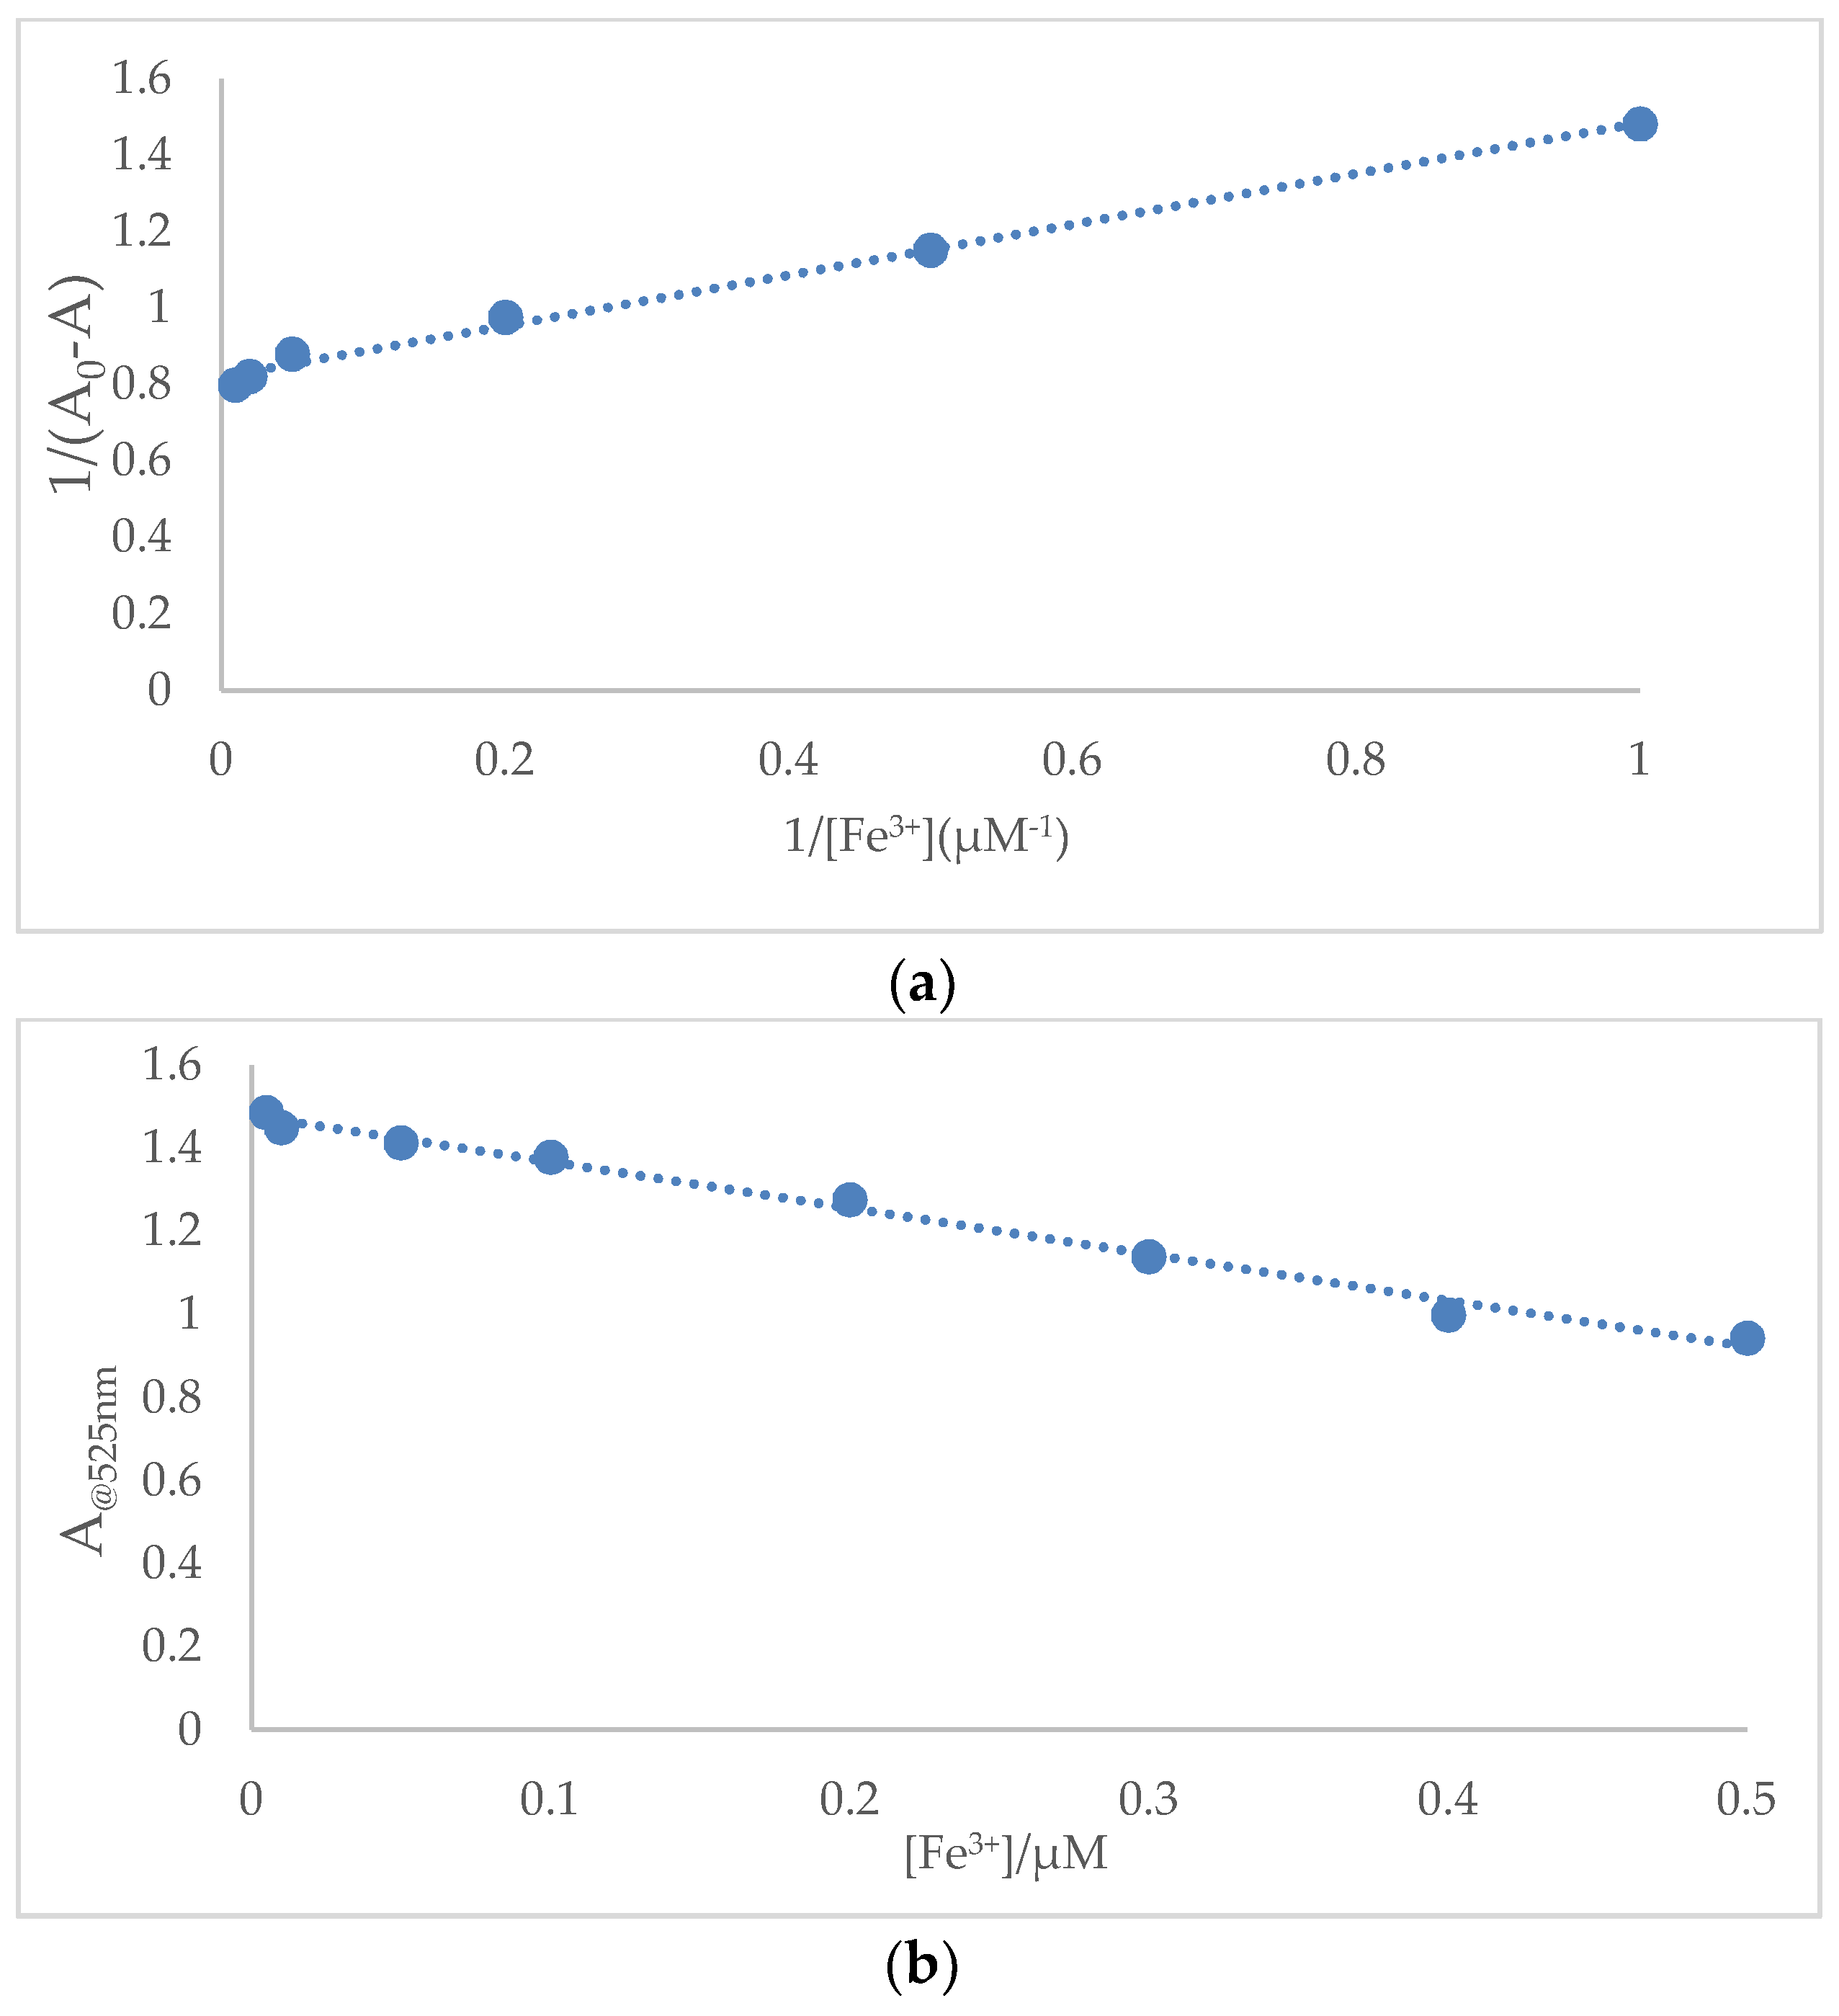
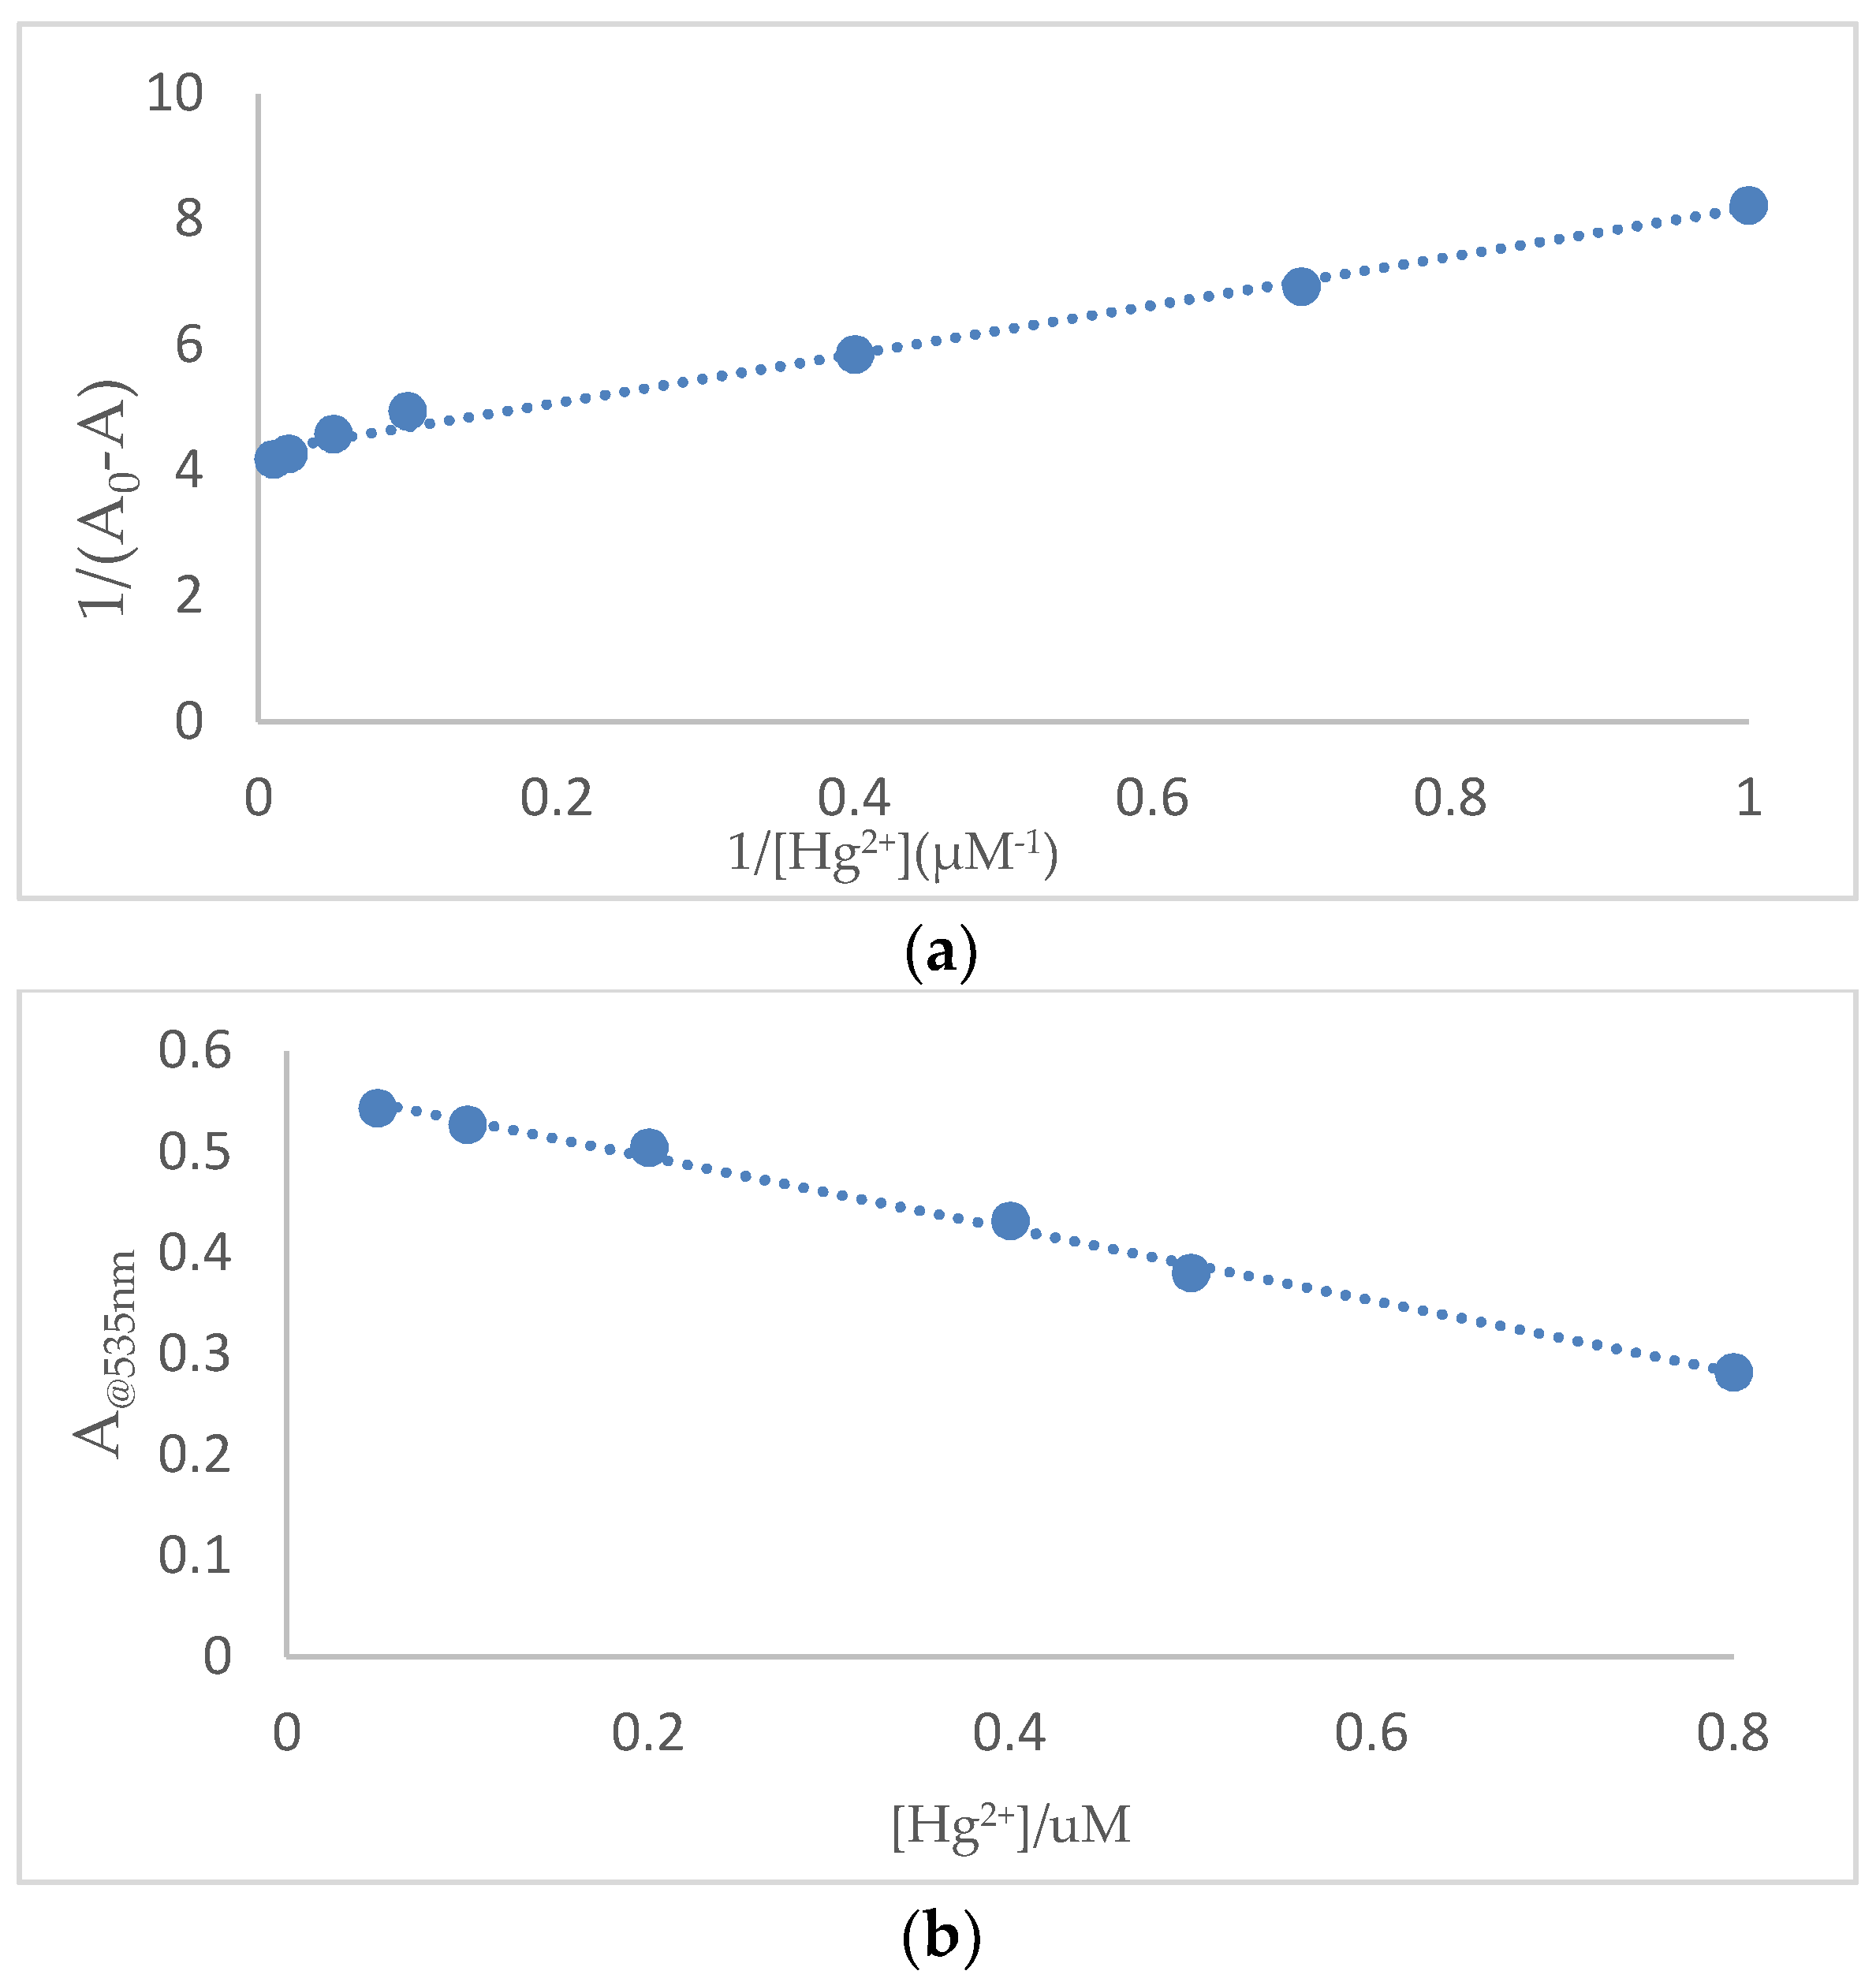
To get a further insight into the colorimetric sensing properties of SQ, a quantitative investigation of the binding affinity of sensor SQ with Fe3+ and Hg2+ was studied by titration. The UV-Vis absorption spectra of 100 μM SQ in acetic acid and SDS solution were recorded during the titration of various concentrations of Fe3+ (1 nM–100 μM) and Hg2+ (1 nM–100 μM), respectively. The binding constant (Ka) was estimated using a Benesi-Hilderbrand plot, which was calculated by absorption changes of consequent titration (A0/A0 − A) against 1/[M]. The magnitude of Ka was calculated from the intercept and slope of the straight line. The estimated value was about 1.24 × 10⁶ M−1 for SQ–Fe3+ complex and 1.1 × 10⁶ M−1 for SQ–Hg2+ (Figure 7a and Figure 8a).
From the absorption titration, the detection limit for Fe3+ and Hg2+ on the basis of 3σ/k was therefore calculated and determined to be 0.538 μM (lower than the U. S. Environmental Protection Agency guideline for drinking water, 5.37 μM) and 1.689 μM (Figure 7b and Figure 8b) for Hg2+ which were superior than many recent reported Fe3+ and Hg2+ related sensors (Table 1). The limit of detection for Hg2+ can be further improved by modifying the structure through introducing more functional groups to increase the solubility of SQ and hydrogen interaction to the metal ions.
3.4. Complexation Mechanism of SQ–Fe3+ and SQ–Hg2+
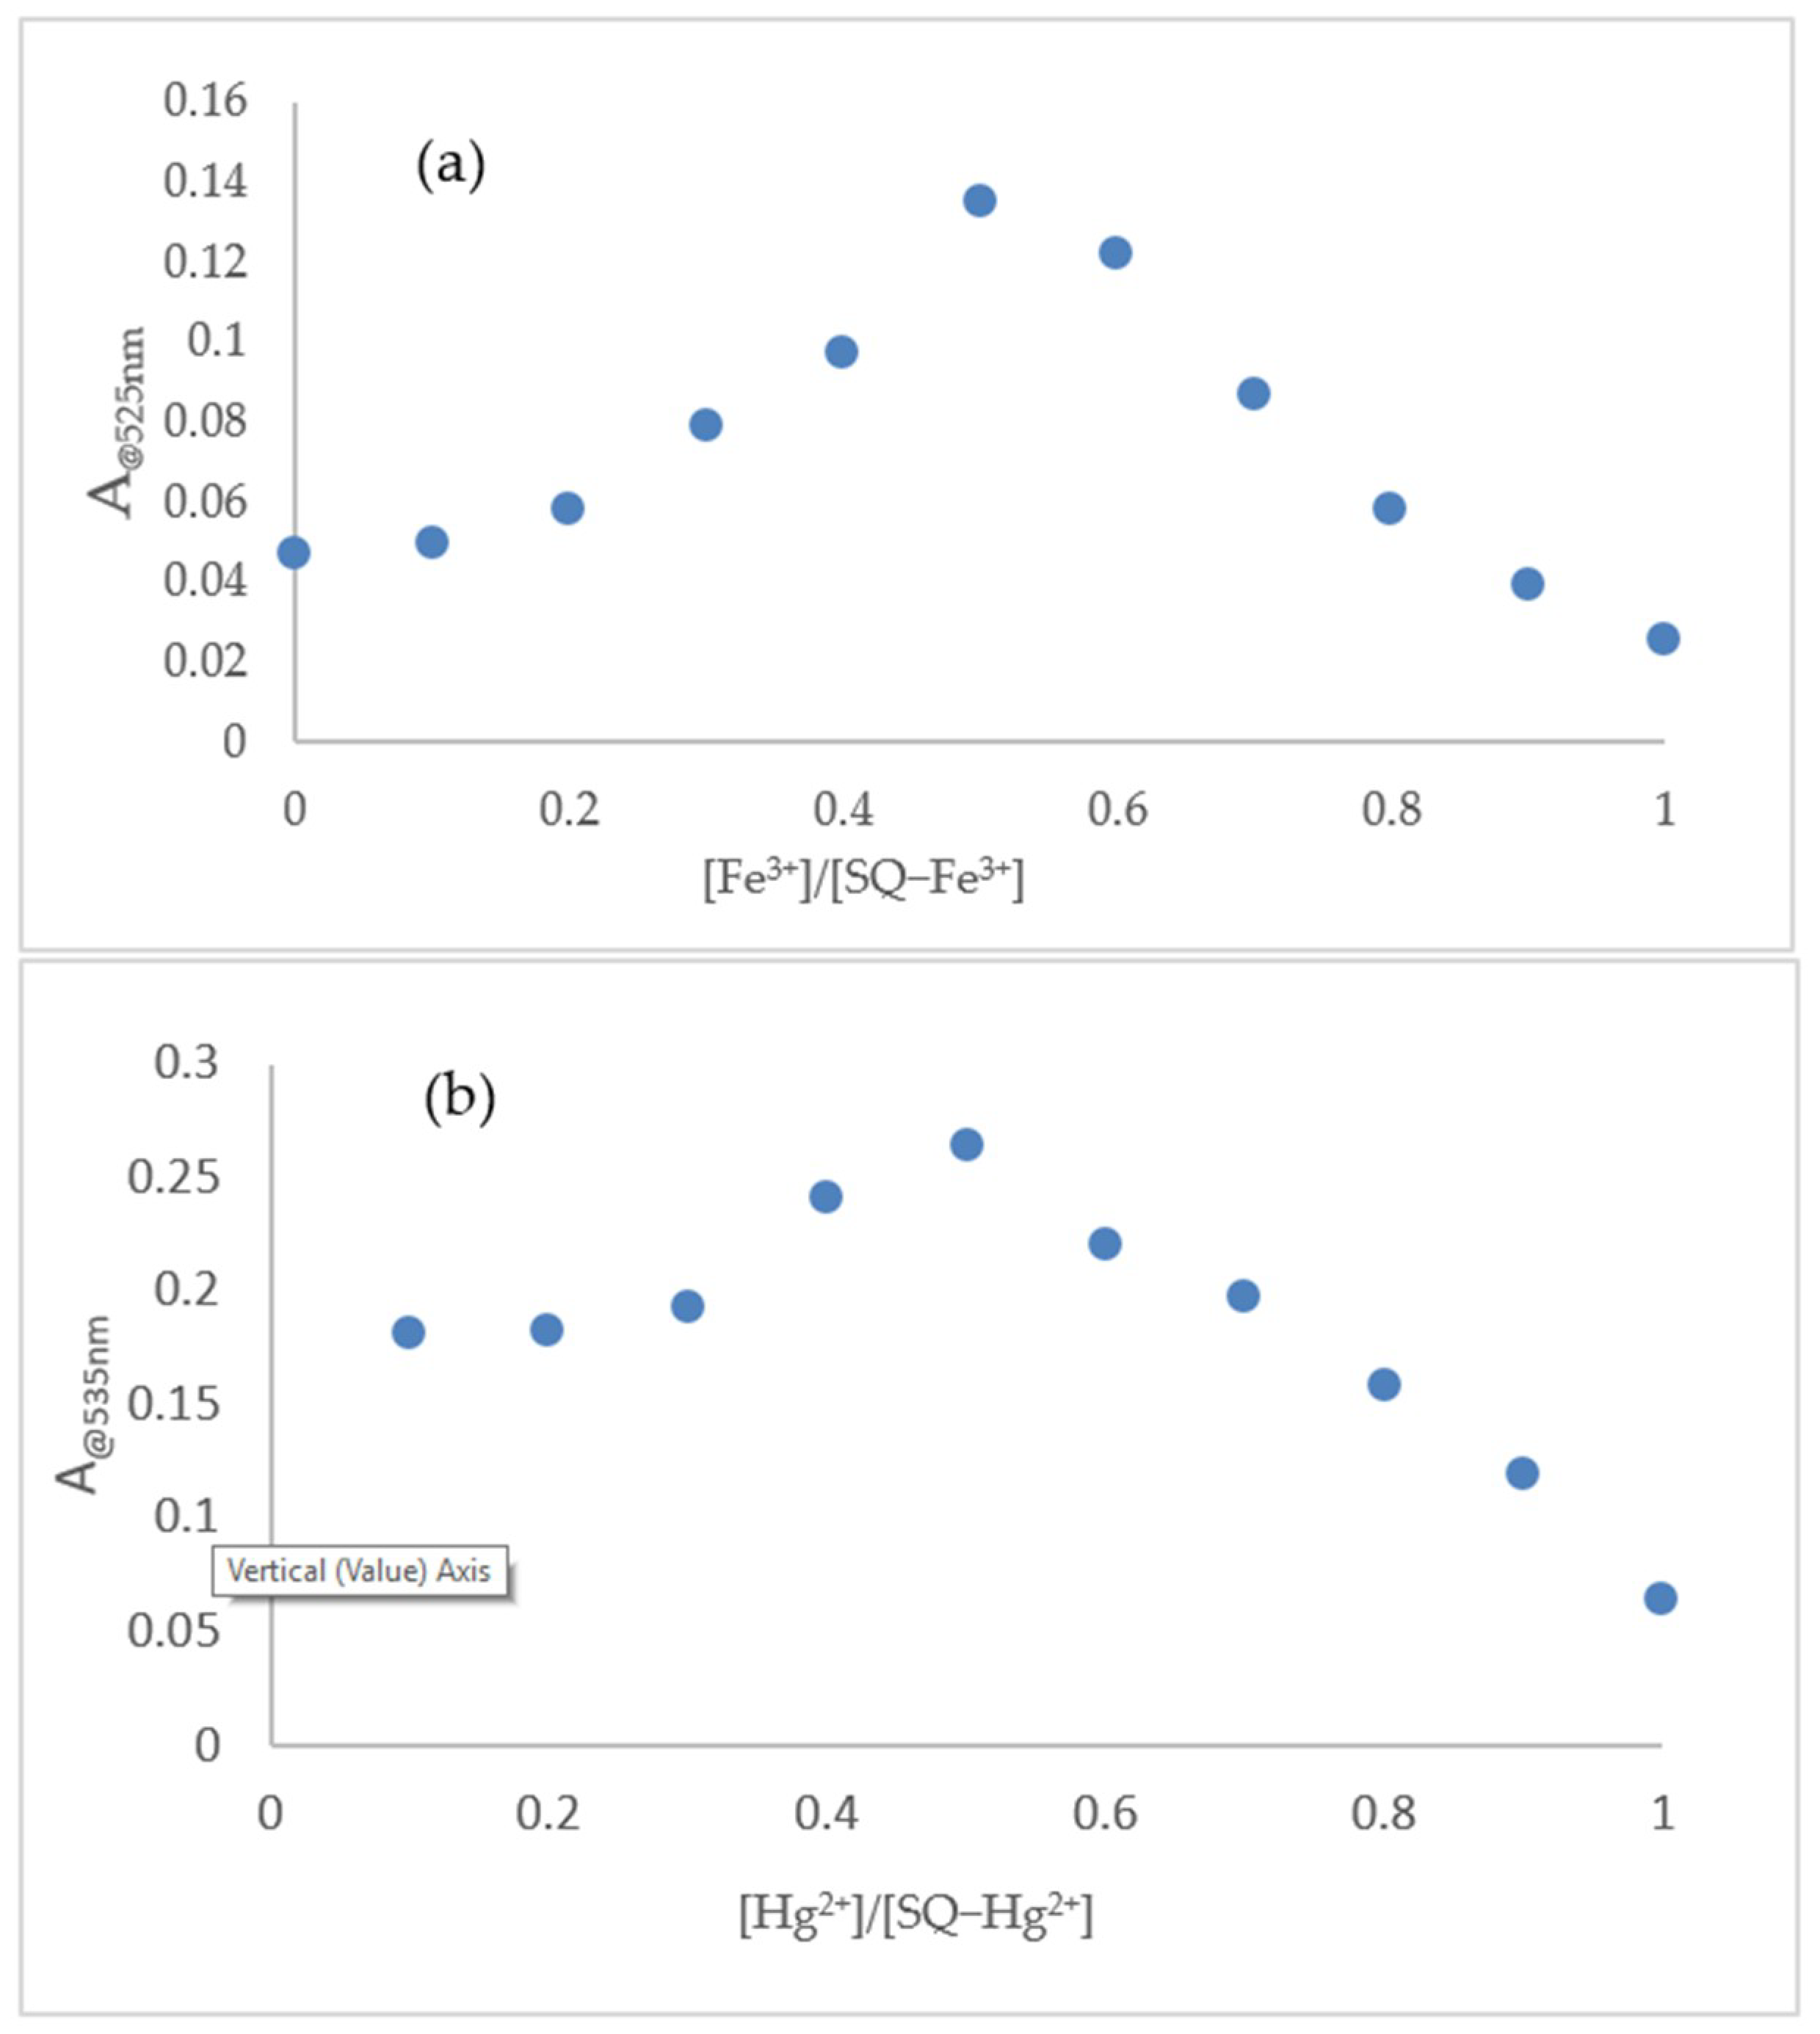
Job’s plot measurement was carried out to determine the complexation mode between SQ and Fe3+. A maximum value of the absorption intensity at 525 nm was observed when the mole fraction of Fe3+ reached 0.5. A signature of 1:1 stoichiometry between SQ and Fe3+ was determined. In addition, a 1:1 stoichiometry between SQ and Hg2+ was also determined following the same process. (Figure 9a,b). The Electron Spray Ionization-Mass data of SQ–Fe3+ and SQ–Hg2+ complexes were included in Figures S11 and S12.
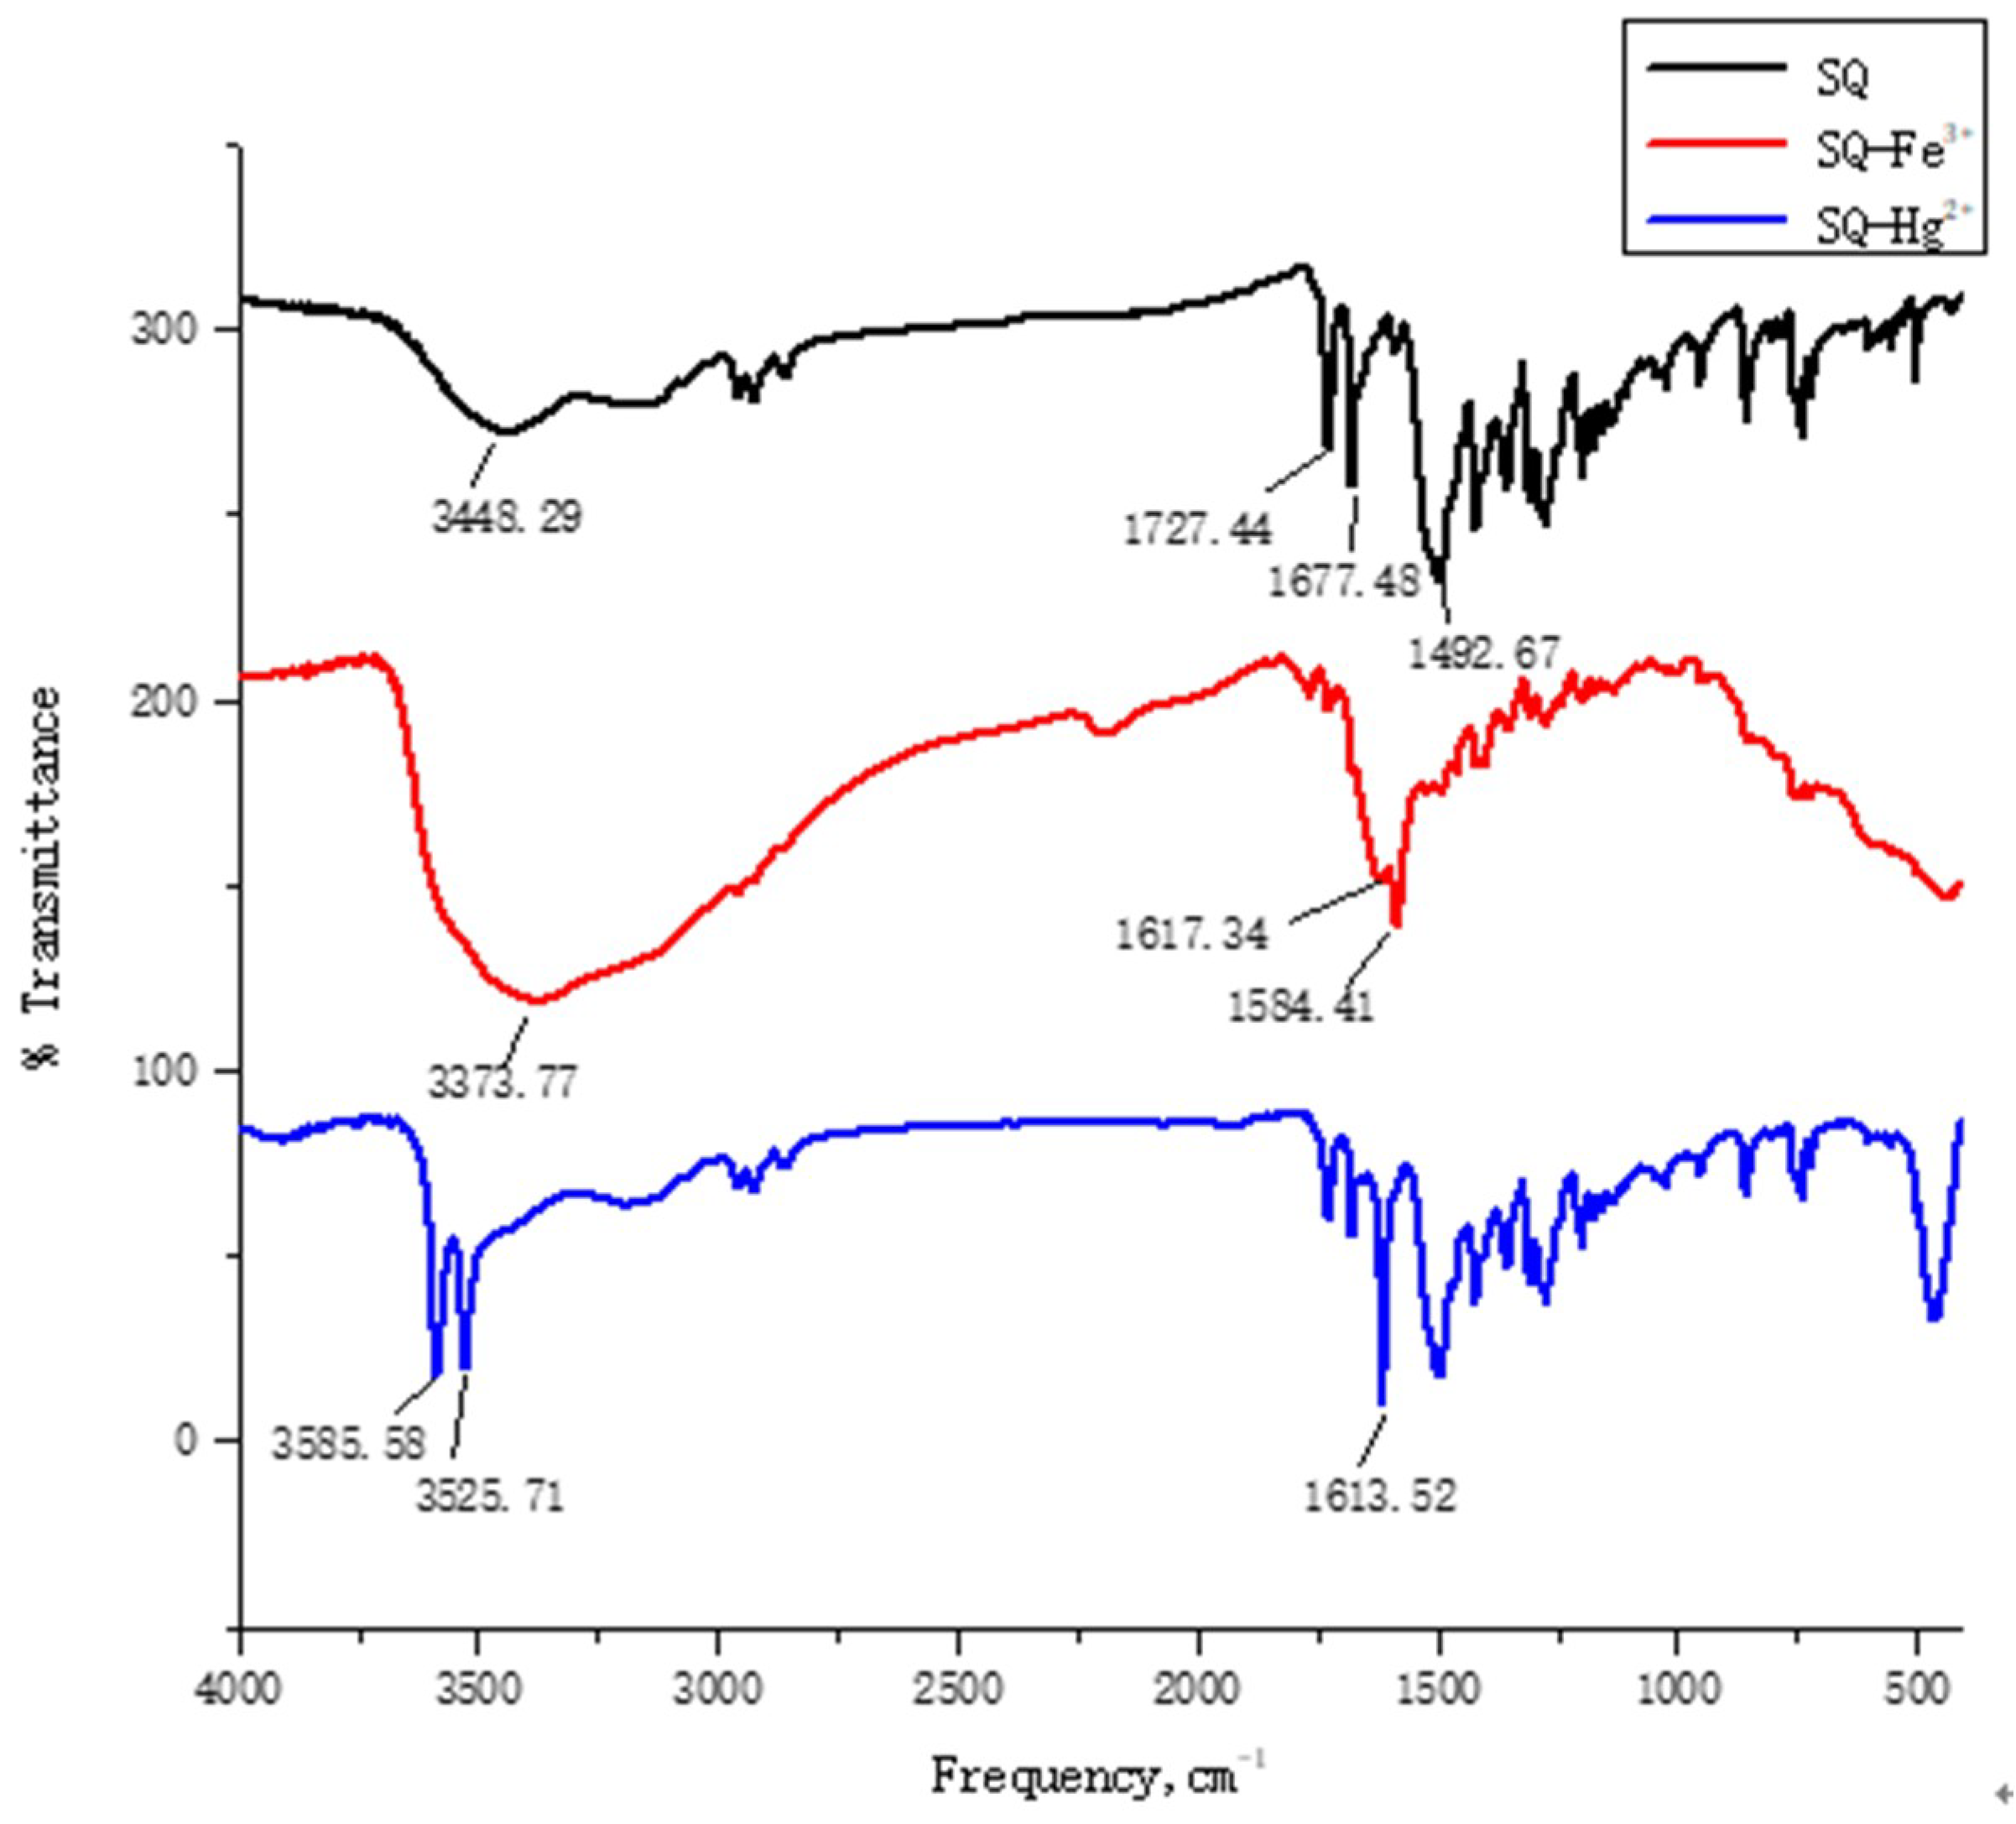
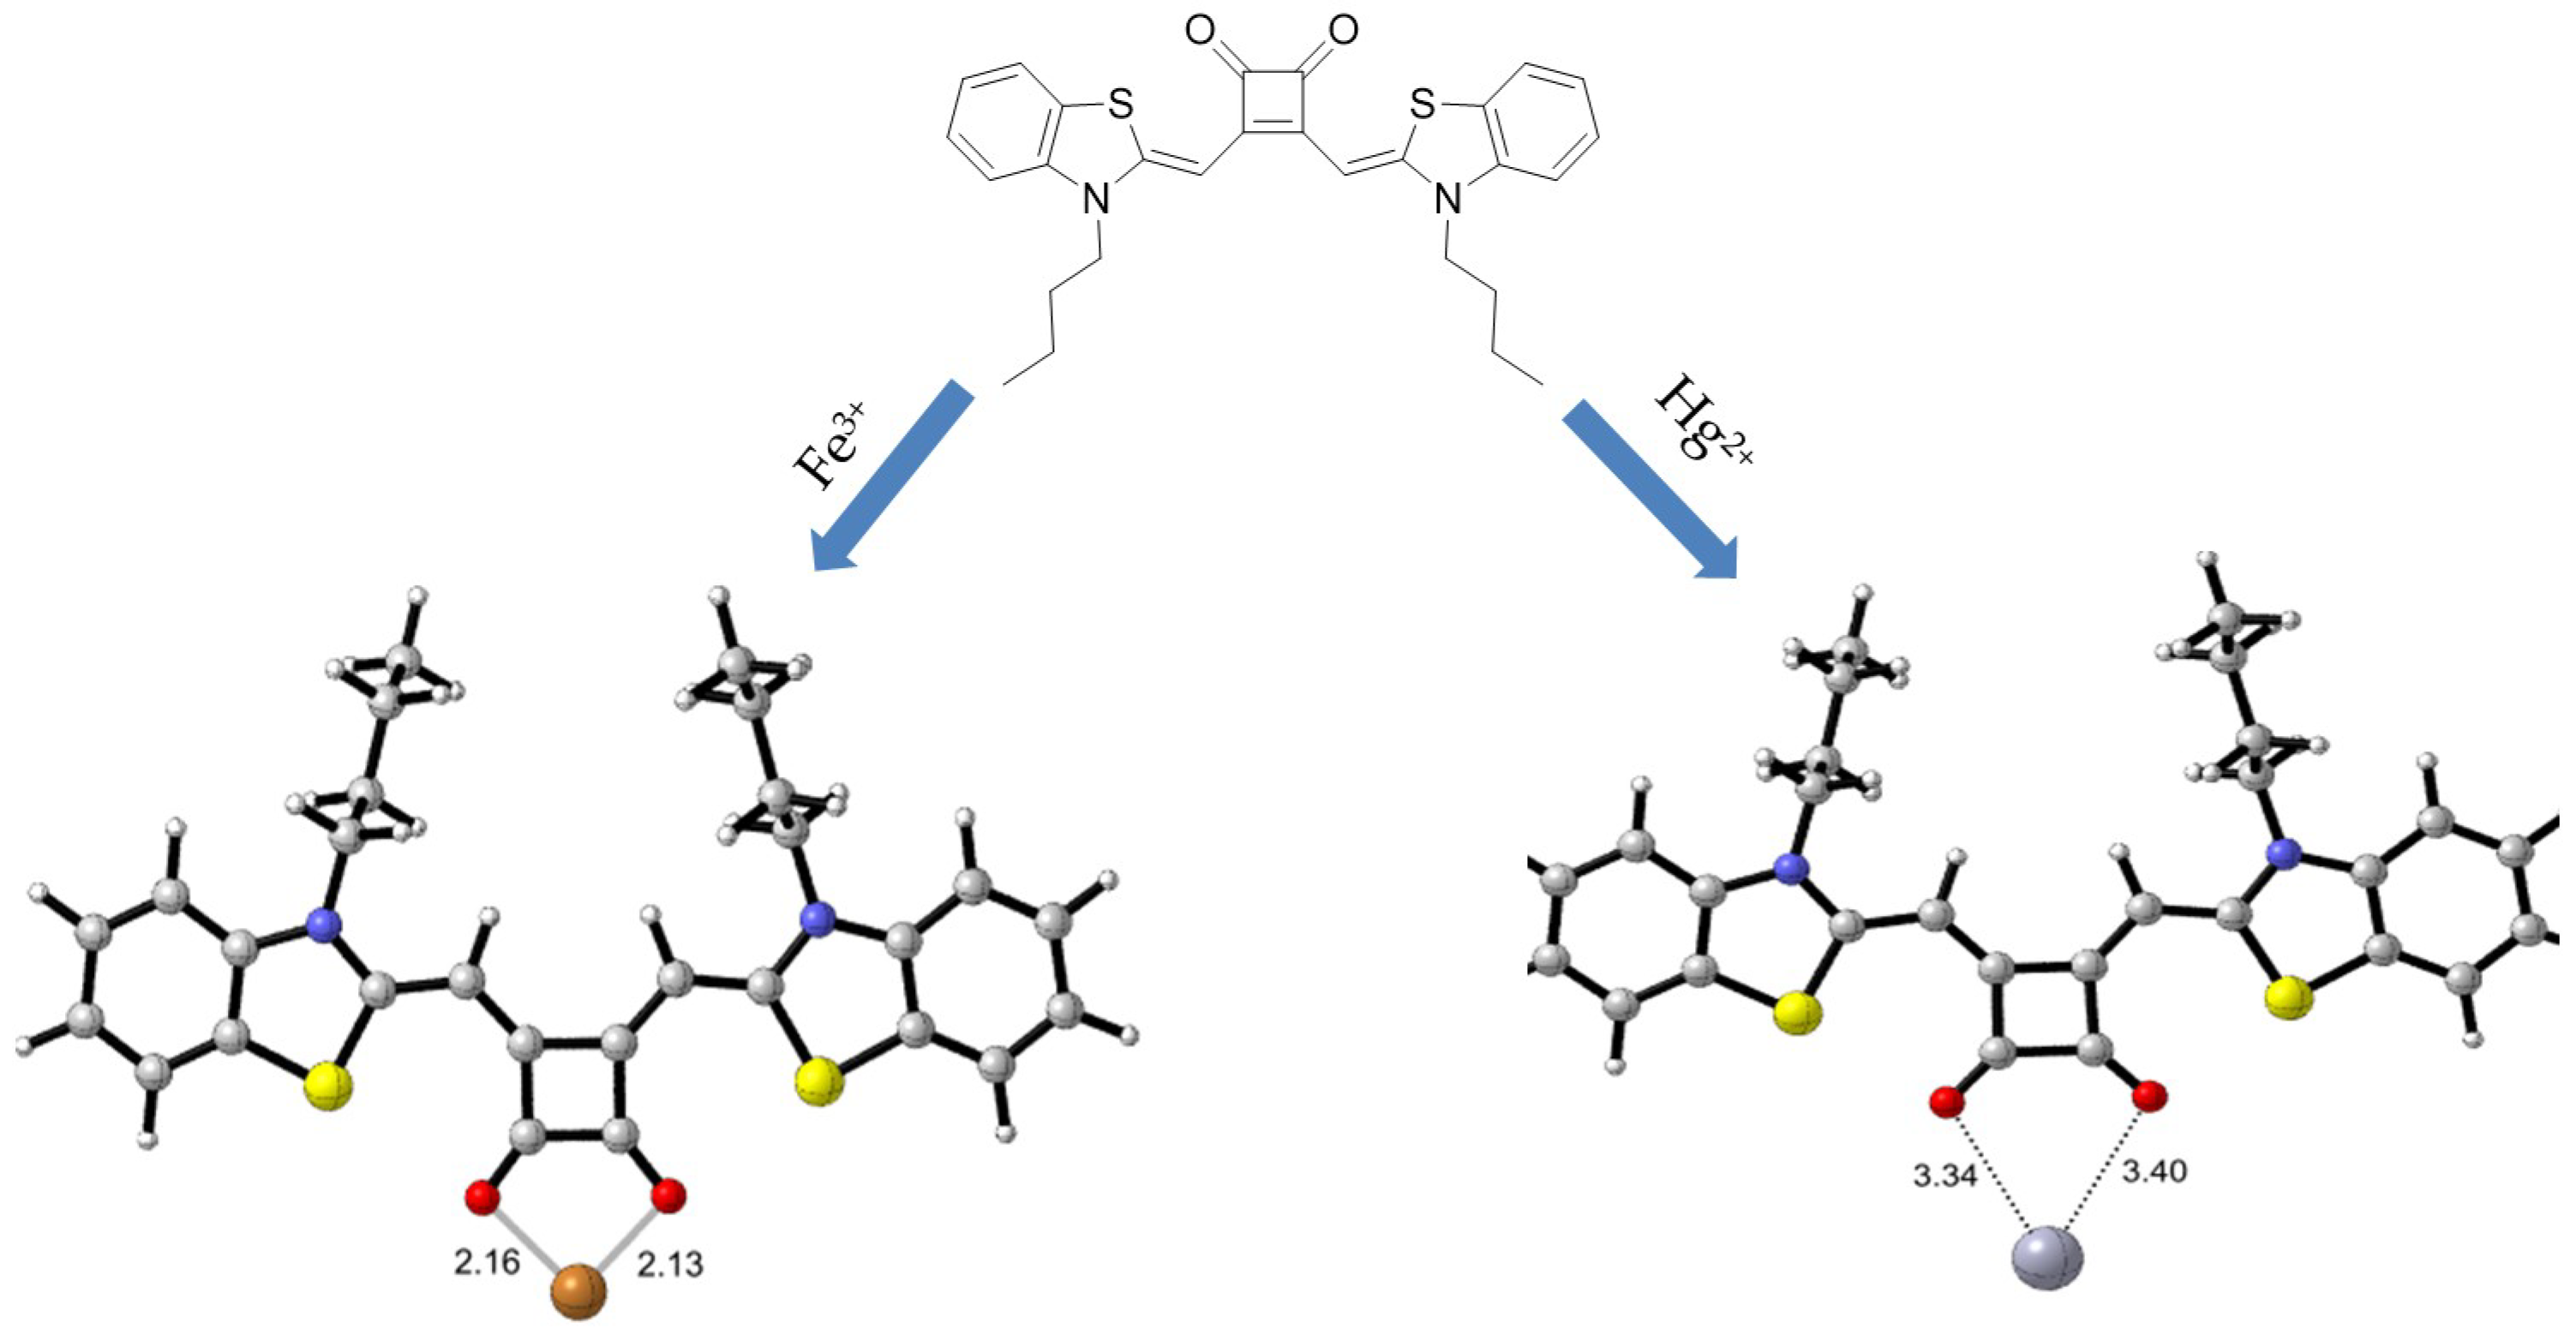
The involvement of binding sites of SQ in complexation was further confirmed through the IR analysis in the presence and absence of metal ions (Figure 10). The characteristic carbonyl stretching frequencies of SQ appeared at 1727.44 cm−1 and 1677.48 cm−1. However, in the SQ–Fe3+ complex, a new peak at 1617.34 cm−1 was observed instead of those at 1766 cm−1 and 1602 cm−1. At the same time, another peak appeared at 1584.41 cm−1 instead of 1492.07 cm−1, indicating the SQ binding with Fe3+ occurs at the two carbonyl groups of squarely moiety in SQ. The IR spectrum for SQ–Hg2+ complex was different to that of SQ–Fe3+ complex. The characteristic carbonyl stretching peak in SQ–Hg2+ complex at 1766 cm−1 and 1602 cm−1 were replaced by a strong new peak at 1613.52 cm−1. More importantly, two more new peaks at 3585.58 cm−1 and 3525.71 cm−1 shown up ascribed to proton vibration. This indicated that more electron pairs were involved in the binding with presence of Hg2+. Conceptually, in accordance with hard soft acid base (HSAB) principle [64], the complexations of SQ–Fe3+ and SQ–Hg2+ were undergone two different pathways, which have been proposed in Scheme 1. For SQ–Fe3+ complex, Fe3+ was proposed to bind two carbonyl groups in squaric moiety with 1:1 stoichiometry, while for SQ–Hg2+ complex, it carried out in a different way.
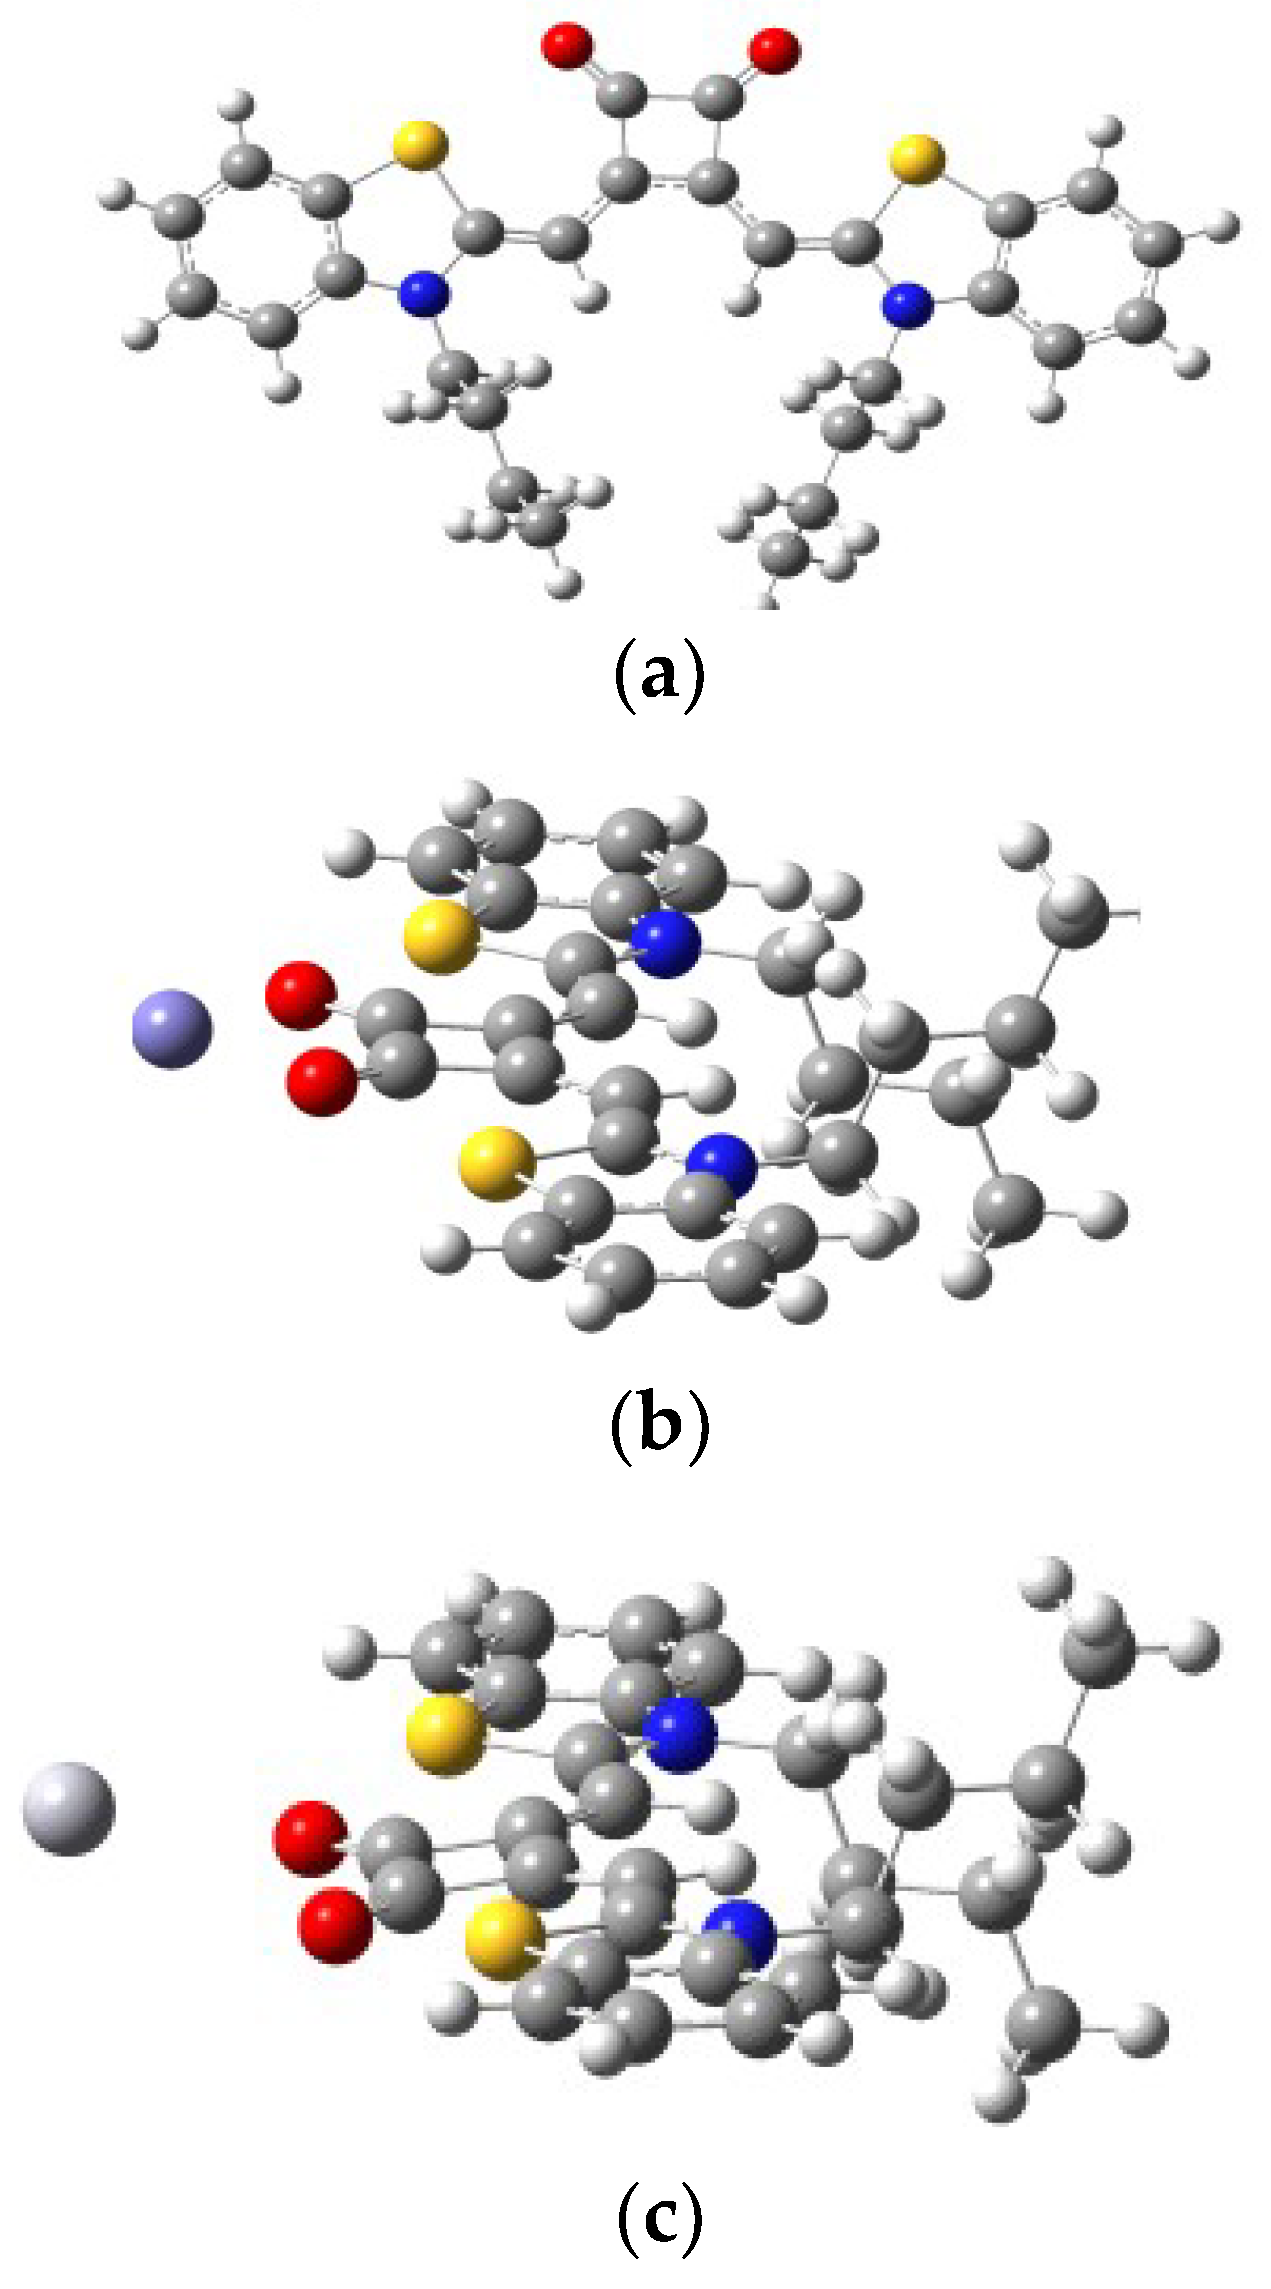
Theoretical calculations have been explored as well to understand the nature of the binding of SQ–Fe3+ and SQ–Hg2+ complexes. All calculations were carried out with the Gaussian 09 package [65]. The density functional theory (DFT) hybrid model with the B3LYP was used for the gas-phase geometry optimization, Lanl2dz basis set with effective core potential (ECP) for Fe and Hg, and the 6-31G(d) basis set was used for all remaining atoms. Based on the calculations, the favorable binding modes between Fe3+ and its Hg2+ complexes were depicted in Figure 11a–c. According to the calculations, the geometry optimized structure of SQ–Fe3+ complex (Figure 11b) was illustrated the same as our proposed. It showed lower energy when Fe3+ was bind two carbonyl groups in squarely moiety. However, the simulated spectra are in good agreement with the proposed complexation mechanism for only SQ–Fe3+ complexes. For SQ–Hg2+ complex, the Hg atom was far away from the SQ.
3.5. Preliminary Analytical Application
The SQ has been validated for practical applications in the determination of Fe3+ and Hg2+ in industry waste water (Table 2). Control experiments showed no significant effect on the colorimetric change of the sensor, the samples were used for the spike and recovery test after treating with acetic acid and 4 mM SDS solution, respectively. It was revealed that SQ has shown a good recovery at different concentrations (Figure S13a,b). These results preliminarily demonstrated that SQ could be potential to be used in selectively and sensitively determine Fe3+ and Hg2+ in real water samples.
4. Conclusions
In conclusion, a simple 1,2-squaraine SQ has been developed to performance dual colorimetric sensing for Fe3+ and Hg2+ ions. An instant color change for selective Fe3+ detection in pure acetic acid was observed with a detection limit of 0.538 μM, while Hg2+ can be detected selectively in 4 mM SDS solution by instant colorimetric response with a detection limit of 1.689 μM. The Job’s plot supported the 1:1 biding mode for both SQ–Fe3+ and SQ–Hg2+ complexes. IR analysis and DFT calculations demonstrated the SQ–Fe3+ and SQ–Hg2+ complexes undergo a different complex mechanism. Our findings provide a simple material and a facile, low cost colorimetric method for dual analytes analysis and have shown preliminary analytical applications in industrial water samples.
Supplementary Materials
The following are available online at https://www.mdpi.com/1996-1944/11/10/1998/s1; Figure S1: 1H NMR spectrum for compound SQ; Figure S2: 13C NMR spectrum for compound SQ; Figure S3: high resolution mass spectrum for SQ; Figure S4: (a) absorption for different concentrations of SQ in pure acetic acid and (b) absorption for different concentrations of SQ in 4 mM SDS solution; Figure S5: (a) absorption of SQ in pure acetic acid at different time points; (b) 1HMR spectra of SQ in CD2Cl2 after 24 hours; Figure S6: (a) dynamic study on the absorption change of SQ–Fe3+ and (b) dynamic study on the absorption change of SQ–Hg2+, Figure S7: reversible study of SQ–Fe3+ toward addition of EDTA; Figure S8: reversible study of SQ–Hg2+ upon alternate addition of Fe3+; Figure S9: reversible study of SQ–Hg2+ complex toward addition of EDTA; Figure S10: reversible absorption changes of SQ upon alternate addition of Hg2+ and EDTA; Figure S11: high resolution mass spectrum for SQ–Fe3+, Figure S12: high resolution mass spectrum for SQ–Hg2+; Figure S13: (a) titration curve of SQ for Fe3+ (1–6 mM) and (b) titration curve of SQ for Hg2+ (1–6 mM).
Author Contributions
Writing—Original Draft Preparation, X.L.; Material Synthesis and Sample Analysis, N.L.; IR Analysis, M.-M.X.; Real Water Sample Analysis, C.J.; Method Validation, J.W.; Review and Editing, G.S.; DFT Calculation, Y.W.
Funding
This work was financially supported by research fund for Jiangsu specially appointed professor (SCZ1505200002 and SCZ1606600001), Foundation of Jiangsu High Education Committee for Natural Science Research Projects (18KJB150005) and the Postdoctoral Science Foundation in Jiangsu province (2018K275C).
Acknowledgments
We thank Aijun Cui for the help of NMR sample analysis.
Conflicts of Interest
The authors declare no conflict of interest.
References
- Yin, J.; Hu, Y.; Yoon, J. Fluorescent probes and bioimaging: Alkali metals, alkaline earth metals and pH. Chem. Soc. Rev. 2015, 44, 4619–4644. [Google Scholar] [CrossRef] [PubMed]
- Li, X.H.; Gao, X.H.; Shi, W.; Ma, H.M. Design strategies for water-soluble small molecular chromogenic and fluorogenic probes. Chem. Rev. 2014, 114, 590–659. [Google Scholar] [CrossRef] [PubMed]
- Zhou, X.; Lee, S.; Xu, Z.; Yoon, J. Recent progress on the development of chemosensors for gases. Chem. Rev. 2015, 115, 7944–8000. [Google Scholar] [CrossRef] [PubMed]
- Carter, K.P.; Young, A.M.; Palmer, A.E. Fluorescent sensors for measuring metal ions in living systems. Chem. Rev. 2014, 114, 4564–4601. [Google Scholar] [CrossRef] [PubMed]
- Sun, J.; Ye, B.; Xia, G.; Zhao, X.; Wang, H. A colorimetric and fluorescent chemosensor for the highly sensitive detection of CO2 gas: Experiment and DFT calculation. Sens. Actuators B Chem. 2016, 233, 76–82. [Google Scholar] [CrossRef]
- Qin, W.; Dou, W.; Leen, V.; Dehan, W.; Van der Auwerar, M.; Boens, N. A ratiometric fluorescent BODIPY-based probe for transition and heavy metal ions. RSC Adv. 2016, 6, 7806–7816. [Google Scholar] [CrossRef] [Green Version]
- Li, C.; Qin, J.; Wang, G.; Wang, B.; Fu, A.; Yang, Z. Development of a simple pyrazine-derived “turn on” Al3+ fluorescent sensor with high selectivity and sensitivity. Inorg. Chim. Acta 2015, 430, 91–95. [Google Scholar] [CrossRef]
- Xu, X.X.; Zheng, X.L.; Fan, X.X.; Su, Y.T.; Zhan, X.Q.; Zheng, H. Semicarbazide-based naphthalimide as a highly selective and sensitive colorimetric and “turn-on” fluorescent chemodosimeter for Cu2+. Sens. Actuators B 2016, 227, 191–197. [Google Scholar]
- Sinha, S.; Mukherjee, T.; Mathew, J.; Mukhopadhyay, S.K.; Ghosh, S. Triazole-based Zn2+-specific molecular marker for fluorescence bioimaging. Anal. Chim. Acta 2014, 822, 60–68. [Google Scholar] [CrossRef] [PubMed]
- Qu, X.; Li, C.; Chen, H.; Mack, J.; Guo, Z.; Shen, Z. A red fluorescent turn-on probe for hydrogen sulfide and its application in living cells. Chem. Commun. 2013, 49, 7510–7512. [Google Scholar] [CrossRef] [PubMed]
- Uglov, A.; Bessmertnykh-Lemeune, A.; Guilard, R.; Averin, A.; Beletskaya, I. Optical methods for the detection of heavy metal ions. Russ. Chem. Rev. 2014, 83, 196–224. [Google Scholar] [CrossRef] [Green Version]
- Li, H.D.; Li, L.L.; Yin, B.Z. Highly selective fluorescent chemosensor for Fe3+ detection based on diaza-18-crown-6 ether appended with dual coumarins. Chem. Commun. 2014, 42, 1–4. [Google Scholar] [CrossRef]
- Bhorge, Y.R.; Tsai, H.T.; Huang, K.F.; Pape, A.J.; Janaki, S.N.; Chen, Y.P. A new pyrene-based schiff-base: A selective colorimetric and fluorescent chemosensor for detection of Cu(II) and Fe(III). Spectrochim. Acta Part. A 2014, 130, 7–12. [Google Scholar] [CrossRef] [PubMed]
- Aisen, A.; Wessling-Resnick, M.; Leibold, E.A. Iron metabolism. Curr. Opin. Chem. Biol. 1999, 3, 200–206. [Google Scholar] [CrossRef]
- Kalinowski, D.S.; Richardson, D.R. Future of toxicology iron chelators and differing modes of action and toxicity: The changing face of iron chelation therapy. Chem. Res. Toxicol. 2007, 20, 715–720. [Google Scholar] [CrossRef] [PubMed]
- Brugnara, C. Iron deficiency and erythropoiesis: New diagnostic approaches. Clin. Chem. 2003, 49, 1573–1578. [Google Scholar] [CrossRef] [PubMed]
- Natale, F.D.; Lancia, A.; Molino, A.; Natale, M.D.; Karatza, D.; Musmarra, D. Capture of mercury ions by natural and industrial materials. J. Hazard. Mater. 2006, 132, 220–225. [Google Scholar] [PubMed]
- Fitzgerald, W.F.; Lamborg, C.H.; Hammerschmidt, C.R. Marine biogeochemical cycling of mercury. Chem. Rev. 2007, 107, 641–662. [Google Scholar] [CrossRef] [PubMed]
- Carvalho, T.W.; Magos, L.; Myers, G.J. The toxicology of mercury–current exposures and clinical manifestations. N. Engl. J. Med. 2003, 349, 1731–1737. [Google Scholar]
- Carvalho, C.M.L.; Chew, E.H.; Hashemy, S.I.; Lu, J.; Holmgren, A. Inhibition of the human thioredoxin system: A molecular mechanism of mercury toxicity. J. Biol. Chem. 2008, 283, 11913–11923. [Google Scholar] [CrossRef] [PubMed]
- Lunvongsa, S.; Oshima, M.; Motomizu, S. Determination of total and dissolved amount of iron in water samples using catalytic spectrophotometric flow injection analysis. Talanta 2006, 68, 969–973. [Google Scholar] [CrossRef] [PubMed]
- Gomes, D.C.; Segundo, M.A.; Lima, J.C.; Rangel, A.S. Spectrophotometric determination of iron and boron in soil extracts using a multi-syringe flow injection system. Talanta 2005, 66, 703–711. [Google Scholar] [CrossRef] [PubMed] [Green Version]
- Timerbaev, A.R.; Dabek-Zlotorzynska, E.; Marc van den Hoop, A.G.T. Inorganic environmental analysis by capillary electrophoresis. Analyst 1999, 124, 811–826. [Google Scholar] [CrossRef]
- Vanloot, P.; Coulomb, B.; Brach-Papa, C.; Sergent, M.; Boudenne, J.L. Multivariate optimization of solid-phase extraction applied to iron determination in finished waters. Chemosphere 2007, 69, 1351–1360. [Google Scholar] [CrossRef] [PubMed]
- Shamspur, T.; Sheikhshoaie, I.; mashhadizadeh, M.H. Flame atomic absorption spectroscopy (FAAS) determination of iron(III) after preconcentration on to modified analcime zeolite with 5-((4-nitrophenylazo)-N-(2′,4′-dimethoxyphenyl)) salicylaldimine by column method. J. Anal. At. Spectrom. 2005, 20, 476–478. [Google Scholar] [CrossRef]
- Lang, L.; Horvat, M.; Bloom, N.S. An improved speciation method for mercury by GC/CVAFS after aqueous phase ethylation and room temperature precollection. Talanta 1994, 41, 371–379. [Google Scholar] [CrossRef]
- Fabbri, D.; Lombardo, M.; Trombinit, C.; Vassura, I. A new procedure for the speciation of mercury in water based on the transformation of mercury(II) and methylmercury(II) into stable acetylides followed by HPLC analysis. Appl. Organomet. Chem. 1995, 9, 713–718. [Google Scholar] [CrossRef]
- Zhang, J.; Zhou, Y.; Hu, W.; Zhang, L.; Huang, Q.; Ma, T. Highly selective fluorescence enhancement chemosensor for Hg2+ based on rhodamine and its application in living cells and aqueous media. Sens. Actuator B Chem. 2013, 183, 290–296. [Google Scholar] [CrossRef]
- Dong, Z.; Tian, X.; Chen, Y.; Hou, J.; Guo, Y.; Sun, J.; Ma, J. A highly selective fluorescent chemosensor for Hg2+ based on rhodamine B and its application as a molecular logic gate. Dyes. Pigm. 2013, 97, 324–329. [Google Scholar] [CrossRef]
- Ghosh, K.; Tarafdar, D. A new quinoline-based chemosensor in ratiometric sensing of Hg2+ ions. Supramol. Chem. 2012, 25, 127–132. [Google Scholar] [CrossRef]
- Qazi, M.A.; Ocak, U.; Ocak, M.; Memon, S. An excellent copper selective chemosensor based on calix[4]arene framework. Anal. Chim. Acta 2013, 761, 157–168. [Google Scholar] [CrossRef] [PubMed]
- Choi, J.K.; Sargsyan, G.; Olive, A.M.; Balaz, M. Highly Sensitive and Selective Spectroscopic Detection of Mercury(II) in Water by Using Pyridyl porphyrin-DNA Conjugates. Chem. Eur. J. 2013, 19, 2515–2522. [Google Scholar] [CrossRef] [PubMed]
- Wang, M.; Yan, F.; Zou, Y.; Chen, L.; Yang, N.; Zhou, X. Recognition of Cu2+ and Hg2+ in physiological conditions by a new rhodamine based dual channel fluorescent probe. Sens. Actuators B Chem. 2014, 192, 512–521. [Google Scholar] [CrossRef]
- Kim, H.; Rao, B.A.; Jeong, J.W.; Mallick, S.; Kang, S.M.; Choi, J.S.; Lee, C.S.; Son, Y.A. A highly selective dual-channel Cu2+ and Al3+ chemodosimeter in aqueous systems: Sensing in living cells and microfluidic flows. Sens. Actuators B Chem. 2015, 210, 173–182. [Google Scholar] [CrossRef]
- Shahid, M.; Razi, S.S.; Srivastava, P.; Ali, R.; Maiti, B.; Misra, A. A useful scaffold based on acenaphthene exhibiting Cu2+ induced excimer fluorescence and sensing cyanide via Cu2+ isplacement approach. Tetrahedron 2012, 68, 9076–9080. [Google Scholar] [CrossRef]
- Sun, J.; Ye, B.; Xia, G.; Wang, H. A multi-responsive squaraine-based“turn on” fluorescent chemosensor for highly sensitive detection of Al3+, Zn2+ and Cd2+ in aqueous media and its biological application. Sens. Actuators B Chem. 2017, 249, 386–394. [Google Scholar] [CrossRef]
- Jeong, J.; Rao, B.A.; Son, Y.A. Dual sensing performance of a rhodamine-derived scaffold for the determination of Cu2+ and Ce4+ in aqueous media. Sens. Actuators B Chem. 2015, 220, 1254–1265. [Google Scholar] [CrossRef]
- Jo, T.G.; Bok, K.H.; Han, J.; Lim, M.H.; Kim, C. Colorimetric detection of Fe3+ and Fe2+ and sequential fluorescent detection of Al3+ and pyrophosphate by an imidazole-based chemosensor in a near-perfect aqueous solution. Dyes Pigm. 2017, 139, 136–147. [Google Scholar] [CrossRef]
- Wang, Y.; Wang, C.; Xue, S.; Liang, Q.; Li, Z.; Xu, S. Highly selective and sensitive colorimetric and fluorescent chemosensor of Fe3+ and Cu2+ based on 2,3,3-trimethylnaphto[1,2-d] squaraine. RSC. Adv. 2016, 6, 6540–6550. [Google Scholar] [CrossRef]
- Wei, T.B.; Zhang, P.; Shi, B.B.; Chen, P.; Lin, Q.; Liu, J.; Zhang, Y.M. A highly selective chemosensor for colorimetric detection of Fe3+ and fluorescence turn-on response of Zn2+. Dyes. Pigm. 2013, 97, 297–302. [Google Scholar] [CrossRef]
- Inoue, T.; Pandy, S.S.; Fujikawa, N.; Yamaguchi, Y.; Hayase, S. Synthesis and characterization of squaric acid based NIR dyes for their application towards dye-sensitized solar cells. J. Photochem. Photobiol. A. 2010, 213, 23–29. [Google Scholar] [CrossRef]
- Maeda, T.; Nakao, H.; Kito, H.; Ichinose, H.; Yagi, S.; Nakazumi, H. Far-red absorbing squarylium dyes with terminally connected electron-accepting units for organic dye-sensitized solar cells. Dyes Pigm. 2011, 90, 275–283. [Google Scholar] [CrossRef]
- Zhu, H.J.; Lin, Y.H.; Wang, G.M.; Chen, Y.Q.; Lin, X.H.; Fu, N.Y. A coordination driven deaggregation approach toward Hg2+-specific chemosensors based on thioether linked squaraine-aniline dyads. Sens. Actuators B 2014, 198, 201–209. [Google Scholar] [CrossRef]
- Li, B.H.; Li, W.W.; Xu, Y.Q.; Li, J.; Tu, J.; Sun, S. A simple approach for the discrimination of surfactants based on the control of squaraine aggregation. Chem. Commun. 2015, 51, 14652–14655. [Google Scholar] [CrossRef] [PubMed]
- Xu, Y.; Li, Z.; Malkovskiy, A.; Sun, S.; Pang, Y. Aggregation control of squaraines and their use as near-infrared fluorescent sensors for protein. J. Phys. Chem. 2010, 114, 8574–8580. [Google Scholar] [CrossRef] [PubMed]
- McEwen, J.J.; Wallace, K.J. Squaraine dyes in molecular recognition and self-assembly. Chem. Commun. 2009, 42, 6339–6351. [Google Scholar] [CrossRef] [PubMed]
- Xu, Y.; Li, B.; Li, L.; Xiao, J.; Ouyang, S.; Sun, Y.; Pang, A. A colorimetric and near-infrared fluorescent probe with high sensitivity and selectivity for acid phosphatase and inhibitor screening. Chem. Commun. 2014, 50, 8677–8680. [Google Scholar] [CrossRef] [PubMed]
- Liu, X.; Cho, B.; Chan, L.Y.; Kwan, W.L.; Lee, C.L. Development of asymmetrical near infrared squaraines with large stokes shift. RSC. Adv. 2015, 5, 106868–106876. [Google Scholar] [CrossRef]
- Ronchi, E.; Ruffo, R.; Rizzato, S.; Albinati, A.; Beverina, L.; Pagani, G.A. Regioselective synthesis of 1,2- vs. 1,3-Squaraines. Org. Lett. 2011, 12, 3166–3169. [Google Scholar] [CrossRef] [PubMed]
- Ajayaghosh, A. Chemistry of squaraine-derived materials: Near-IR Dyes, low band gap systems, and cation sensors. Acc. Chem. Res. 2005, 38, 449–459. [Google Scholar] [CrossRef] [PubMed]
- Ros-Lis, J.; Martínez-Máñez, R.; Rurack, K.; Sancenón, F.; Soto, J.; Spieles, M. Highly selective chromogenic signaling of Hg2+ in aqueous media at nanomolar levels employing a squaraine-based reporter. Inorg. Chem. 2004, 43, 5183–5185. [Google Scholar] [CrossRef] [PubMed]
- Basheera, M.; Alex, S.; Thomas, K.; Suresh, C.; Dasa, S. A squaraine-based chemosensor for Hg2+ and Pb2+. Tetrahedron 2006, 62, 605–610. [Google Scholar] [CrossRef]
- Chen, C.; Wang, R.; Guo, L.; Fu, N.; Dong, H.; Yuan, Y. A squaraine-based colorimetric and “turn on” fluorescent sensor for selective detection of Hg2+ in an aqueous medium. Org. Lett. 2011, 13, 1162–1165. [Google Scholar] [CrossRef] [PubMed]
- Chen, H.; Law, K.Y.; Perlstein, J.; Whitten, D.G. Amphiphilic squaraine dye aggregates: Evidence for a cyclic chiral structure as a general supramolecular structure for aggregates of dyes and aromatic molecules. J. Am. Chem. Soc. 1995, 117, 7257–7258. [Google Scholar] [CrossRef]
- Zhang, Y.; Kim, B.; Yao, S.; Bondar, M.V.; Belfield, K.D. Controlled Aggregation and Enhanced Two-Photon Absorption of a Water-Soluble Squaraine Dye with a Poly(acrylic acid) Template. Langmuir 2013, 29, 11005–11012. [Google Scholar] [CrossRef] [PubMed]
- You, G.R.; Park, G.J.; Lee, S.A.; Ryu, K.Y.; Kim, C. Chelate-type Schiff base acting as a colorimetric sensor for iron in aqueous solution. Sens. Actuators B Chem. 2015, 215, 188–195. [Google Scholar] [CrossRef]
- Choi, Y.W.; Park, G.J.; Na, Y.J.; Jo, H.Y.; Lee, S.A.; You, G.R. A single Schiff base molecule for recognizing multiple metal ions: A fluorescence sensor for Zn(II) and Al(III) and colorimetric sensor for Fe(II) and Fe(III). Sens. Actuators B Chem. 2014, 194, 343–352. [Google Scholar] [CrossRef]
- Li, S.; Zhang, D.; Xie, X.; Ma, S.; Liu, Y.; Xu, Z.; Gao, Y.; Ye, Y. A novel solvent-dependently bifunctional NIR absorptive and fluorescent ratiometric probe for detecting Fe3+/Cu2+ and its application in bioimaging. Sens. Actuators B Chem. 2016, 224, 661–667. [Google Scholar] [CrossRef]
- Wei, D.; Sun, Y.; Yin, J.; Wei, G.; Du, Y. Design and application of Fe3+ probe for “naked-eye” colorimetric detection in fully aqueous system. Sens. Actuators B Chem. 2011, 160, 1316–1321. [Google Scholar] [CrossRef]
- Lee, S.; Rao, B.A.; Son, Y.A. A highly selective fluorescent chemosensor for Hg2+ based on a squaraine–bis (rhodamine-B) derivative: Part II. Sens. Actuators B Chem. 2015, 210, 3519–3532. [Google Scholar] [CrossRef]
- Lee, J.Y.; Rao, B.A.; Hwang, J.Y.; Son, Y.A. A novel sensing capabilities and structural modification from thiourea to urea derivative by Hg(ClO4)2: Selective dual chemodosimeter for Hg2+ and F− ions. Sens. Actuators B Chem. 2015, 220, 1070–1085. [Google Scholar] [CrossRef]
- Kaur, P.; Sareen, D. The synthesis and development of a dual-analyte colorimetric sensor: Simultaneous estimation of Hg2+ and Fe3+. Dyes. Pigm. 2011, 88, 296–300. [Google Scholar] [CrossRef]
- Ho, T.L. Hard soft acids bases (HSAB) principle and organic chemistry. Chem. Rev. 1975, 75, 1–20. [Google Scholar] [CrossRef]
- Huang, J.H.; Sun, Y.Y.; Chou, P.T.; Fang, J.M. Two-stage sensing property via a conjugated donor-acceptor-donor constitution: Application to the visual detection of mercuric Ion. Org. Chem. 2005, 70, 5827–5832. [Google Scholar] [CrossRef] [PubMed]
- Frisch, M.J.; Trucks, G.W.; Schlegel, H.B.; Scuseria, G.E.; Robb, M.A.; Cheeseman, J.R.; Scalmani, G.; Barone, V.; Mennucci, B.; Petersson, G.A.; et al. Gaussian 09, Revision D.01; Gaussian, Inc.: Wallingford, CT, USA, 2013. [Google Scholar]
Figure 1.
The absorption spectra of SQ (100 μM) in different solutions.

Figure 2.
Absorption spectra for 3,4-bis((Z)-(3-butylbenzo[d]thiazol-2(3H)-ylidene)methyl) cyclobut-3-ene-1,2-dione (SQ) solution (100 μM) with/without addition of different metal ions (100 μM) in AcOH.
Figure 2.
Absorption spectra for 3,4-bis((Z)-(3-butylbenzo[d]thiazol-2(3H)-ylidene)methyl) cyclobut-3-ene-1,2-dione (SQ) solution (100 μM) with/without addition of different metal ions (100 μM) in AcOH.

Figure 3.
H2O effects in acetic acid for the SQ (100 μM) absorption changes with or without addition of Fe3+ (100 μM).
Figure 3.
H2O effects in acetic acid for the SQ (100 μM) absorption changes with or without addition of Fe3+ (100 μM).

Figure 4.
Absorption spectra for SQ solution (100 μM) with/without addition of different metal ions (100 μM) in sodium dodecyl sulfonate (SDS) (4 mM) solution.
Figure 4.
Absorption spectra for SQ solution (100 μM) with/without addition of different metal ions (100 μM) in sodium dodecyl sulfonate (SDS) (4 mM) solution.

Figure 5.
(a) The absorption spectra of SQ (100 μM) in different concentration of SDS (1 μM–4 mM) without addition of metal ions. (b) The relative changes of SQ (100 μM) absorption intensity in 4 mM SDS micellar solution at 535 nm with or without addition of Hg2+ (100 μM).
Figure 5.
(a) The absorption spectra of SQ (100 μM) in different concentration of SDS (1 μM–4 mM) without addition of metal ions. (b) The relative changes of SQ (100 μM) absorption intensity in 4 mM SDS micellar solution at 535 nm with or without addition of Hg2+ (100 μM).

Figure 6.
(a) Competition experiments of Fe3+ with other metal ions. Gray bar: absorption intensity of SQ (100 μM) in AcOH solution. Red bar: absorption intensity of SQ (100 μM) with Fe3+ (20 μM) in AcOH solution. Blue bar: absorption intensity of SQ (100 μM) with the addition of the respective competing cations (100 μM) and the Fe3+ (20 μM) in AcOH solution. (b) Competition experiments of Hg2+ with other metal ions. Gray bar: absorption intensity of SQ (100 μM) in SDS (4 mM) solution. Blue bar: absorption intensity of SQ (100 μM) with the addition of the respective competing cations (100 μM) in SDS (4 mM) solution. Red bar: absorption intensity of SQ (100 μM) with the Hg2+ (20 μM) in SDS (4 mM) solution. Blue bar: absorption intensity of SQ (100 μM) with the addition of the respective competing cations (100 μM) and the Hg2+ (20 μM) in SDS (4 mM) solution.

Figure 7.
(a) Benesi-Hildebrand plot analysis of the absorption changes for the complexation between SQ and Fe3+, R2 = 0.9936. (b) Plot of absorption intensity change of SQ (100 μM) against concentrations of Fe3+ from 0.01 μM to 0.5 μM. R2 = 0.9907.
Figure 7.
(a) Benesi-Hildebrand plot analysis of the absorption changes for the complexation between SQ and Fe3+, R2 = 0.9936. (b) Plot of absorption intensity change of SQ (100 μM) against concentrations of Fe3+ from 0.01 μM to 0.5 μM. R2 = 0.9907.

Figure 8.
(a) Benesi-Hildebrand plot analysis of the absorption changes for the complexation between SQ and Hg2+, R2 = 0.9907. (b) Plot of absorption intensity change of SQ (100 μM) against concentrations of Hg2+ from 0.05 μM to 0.8 μM. R2 = 0.9948.
Figure 8.
(a) Benesi-Hildebrand plot analysis of the absorption changes for the complexation between SQ and Hg2+, R2 = 0.9907. (b) Plot of absorption intensity change of SQ (100 μM) against concentrations of Hg2+ from 0.05 μM to 0.8 μM. R2 = 0.9948.

Figure 9.
(a) Job’s plot for the complexation of SQ with Fe3+ in AcOH solution; (b) Job’s plot for the complexation of SQ with Hg2+ in SDS (4 mM).
Figure 9.
(a) Job’s plot for the complexation of SQ with Fe3+ in AcOH solution; (b) Job’s plot for the complexation of SQ with Hg2+ in SDS (4 mM).

Figure 10.
The IR spectrum of SQ (Black line), SQ–Fe3+ (Red line), and SQ–Hg2+ (Blue line) complex in the solid state.
Figure 10.
The IR spectrum of SQ (Black line), SQ–Fe3+ (Red line), and SQ–Hg2+ (Blue line) complex in the solid state.

Scheme 1.
Proposed complexation mechanism of SQ–Fe3+ and SQ–Hg2+.

Figure 11.
The geometry-optimized structures of (a) SQ (yellow, red and blue atoms representing as sulfur, oxygen, nitrogen atoms, respectively); (b) SQ–Fe3+ complex (purple atom representing as Fe3+); (c) SQ–Hg2+ complex (individual atom at left representing as Hg2+ atom) at the SMD (H2O)-TD-PBE0/TZVP+LANL2DZ level.


Table 1.
Comparison of SQ with recently reported chemosensors.
| Sensor | Target | Response Type | LOD (μM) | Reaction Media | Reversibility | Reference |
|---|---|---|---|---|---|---|
| Dansyl based derivative | Fe3+ | Fluorescence | 0.62 | C2H5OH-H2O (1:1, v/v) | No | [57] |
| Rhodamine derivative | Fe3+ | Fluorescence | 0.74 | CH3CN-H2O(1:1, v/v) | Yes | [58] |
| Sugar-functioned coumarin | Fe3+ | Color | 4.6 | H2O | No | [59] |
| Julolidine derivative | Fe3+ | Color | 6.8 | DMF | No | [57] |
| Squaraine -bis(rhodamine-B) derivative | Hg2+ | Fluorescence | 6.48 | CH3CN | Yes | [60] |
| Coumarin-urea derivative | Hg2+ | Fluorescence | 0.45 | CH3CN | Yes | [61] |
| Hetarylazo | Fe3+ | Color | 2.0 | CH3CN | No | [62] |
| Hg2+ | Color | 2.0 | CH3CN | No | ||
| Naphthalimide-rhodamine | Fe3+ | Color | 0.57 | EtOH/PBS buffer (1:1) | No | [63] |
| Hg2+ | Fluorescence | 2.72 | EtOH/PBS buffer (1:1) | Yes | ||
| Our work | Fe3+ | Color | 0.54 | CH3COOH | Yes | / |
| Hg2+ | Color | 1.69 | SDS (4 mM) | No |
Table 2.
Determination of ion in industrial waste water samples with SQ.
| Sample | AAS (μM) | Added (mM) | Found (mM) | Recovery (%) | |
|---|---|---|---|---|---|
| Industrial waste water I | Fe3+ | 2.01 | 1.12 | 1.14 | 102 |
| Hg2+ | 3.20 | 4.30 | 4.41 | 102 | |
| Industrial waste water II | Fe3+ | 4.03 | 2.23 | 2.19 | 98 |
| Hg2+ | 2.43 | 2.85 | 2.77 | 97 | |
| Industrial waste water III | Fe3+ | 6.05 | 4.41 | 4.38 | 99 |
| Hg2+ | 1.65 | 2.20 | 2.17 | 99 | |
© 2018 by the authors. Licensee MDPI, Basel, Switzerland. This article is an open access article distributed under the terms and conditions of the Creative Commons Attribution (CC BY) license (http://creativecommons.org/licenses/by/4.0/).
Share and Cite
MDPI and ACS Style
Liu, X.; Li, N.; Xu, M.-M.; Jiang, C.; Wang, J.; Song, G.; Wang, Y. Dual Sensing Performance of 1,2-Squaraine for the Colorimetric Detection of Fe3+ and Hg2+ Ions. Materials 2018, 11, 1998. https://doi.org/10.3390/ma11101998
AMA Style
Liu X, Li N, Xu M-M, Jiang C, Wang J, Song G, Wang Y. Dual Sensing Performance of 1,2-Squaraine for the Colorimetric Detection of Fe3+ and Hg2+ Ions. Materials. 2018; 11(10):1998. https://doi.org/10.3390/ma11101998
Chicago/Turabian StyleLiu, Xiaoqian, Na Li, Min-Min Xu, Chunhui Jiang, Jianhao Wang, Guoqiang Song, and Yong Wang. 2018. "Dual Sensing Performance of 1,2-Squaraine for the Colorimetric Detection of Fe3+ and Hg2+ Ions" Materials 11, no. 10: 1998. https://doi.org/10.3390/ma11101998
Note that from the first issue of 2016, this journal uses article numbers instead of page numbers. See further details here.